NAVIGATION STUDY FOR LAKE WORTH INLET, FLORIDA DRAFT INTEGRATED FEASIBILITY REPORT AND ENVIRONMENTAL IMPACT STATEMENT APPENDIX A ENGINEERING
|
|
|
- Emory Harvey
- 5 years ago
- Views:
Transcription
1
2 NAVIGATION STUDY FOR LAKE WORTH INLET, FLORIDA DRAFT INTEGRATED FEASIBILITY REPORT AND ENVIRONMENTAL IMPACT STATEMENT APPENDIX A ENGINEERING
3 NAVIGATION STUDY FOR LAKE WORTH INLET, FLORIDA DRAFT INTEGRATED FEASIBILITY REPORT AND ENVIRONMENTAL IMPACT STATEMENT APPENDIX A ENGINEERING Table of Contents Subject Paragraph No. Page No. A. INTRODUCTION General. 1 A 1 Tentatively Selected Plan 2 A 1 B. HYDROLOGY AND HYDRAULICS General 3 A 1 Tides 4 A 2 Currents 5 A 2 Sea Level Rise 6 A 2 Storm Surge 7 A 3 Shoaling 8 A 3 C. GEOTECHNICAL General 9 A 4 Existing Jetty Stability 10 A 4 Jetty Stability With Tentatively Selected Plan 11 A 4 Channel Side Slope Selection 12 A 5 D. DESIGN AND CONSTRUCTION General 13 A 5 Side Slopes 14 A 5 Overdepths 15 A 5 Advance Maintenance and Settling Basin Reconfiguration 16 A 5 A-i
4 Table of Contents (continued) Subject Paragraph No. Page No. North Jetty Stabilization Disposal Areas Construction Procedure A 5 A 6 A 6 E. RELOCATIONS General 20 A 6 F. OPERATION AND MAINTENANCE General Estimated Annual Cost Navigation Aids A 7 A 7 A 7 G. QUANTITIES AND COST ESTIMATE Summary of Quantities Summary of Costs A 7 A 7 H. SHIP SIMULATION STUDY Discussion Optimization Agency Technical Review A 8 A 8 A 9 LIST OF FIGURES (figures follow text) Title Figure No. Projected Future Sea Level Rise at Palm Beach Harbor F 1 LIST OF TABLES (tables follow figures) Title Summary of Construction Quantities for Tentatively Selected Plan Summary of Dredge Areas and Haul Distances Summary of Dredging Volumes for Tentatively Selected Plan Table No. T 1 T 2 T 3 A-ii
5 Table of Contents (continued) LIST OF PLATES (plates follow tables) Title Plate No. NED Plan Location and Vicinity Maps NED Plan Improvements Overview NED Plan STA to STA Entrance Channel NED Plan STA to STA Entrance Channel NED Plan STA Entrance Channel to STA Cut 1 NED Plan STA Cut 1 to STA Cut 2 NED Plan Northern and Southern Turning Basins NED Plan Southern Turning Basin Existing Project Advance Maintenance and Settling Basin Plan Proposed Project Advance Maintenance and Settling Basin Plan Side Slope Plan and Typical Dredging Sections Side Slope Plan and Typical Dredging Sections Typical Dredging Sections Typical Dredging Sections Typical Dredging Sections Typical Dredging Sections Typical Dredging Sections Typical Dredging Sections Beach/Nearshore Disposal Plan Typical Beach Disposal Section Proposed Potential Mitigation/Beneficial Use Sites Typical Cross Sections Seagrass and Hardbottom Mitigation and Hardbottom Mitigation Plan ODMDS Plan NED Plan Area Breakdown for Volumetric and Cost Analysis NED Plan Area Breakdown for Volumetric and Cost Analysis ATTACHMENTS (attachments follow plates) Title Hydrodynamic Modeling Ship Simulation Report Geotechnical Attachment Investigations and Geologic Conditions Boring Logs and Laboratory Reports VE Study Attachment No. A B C D A-iii
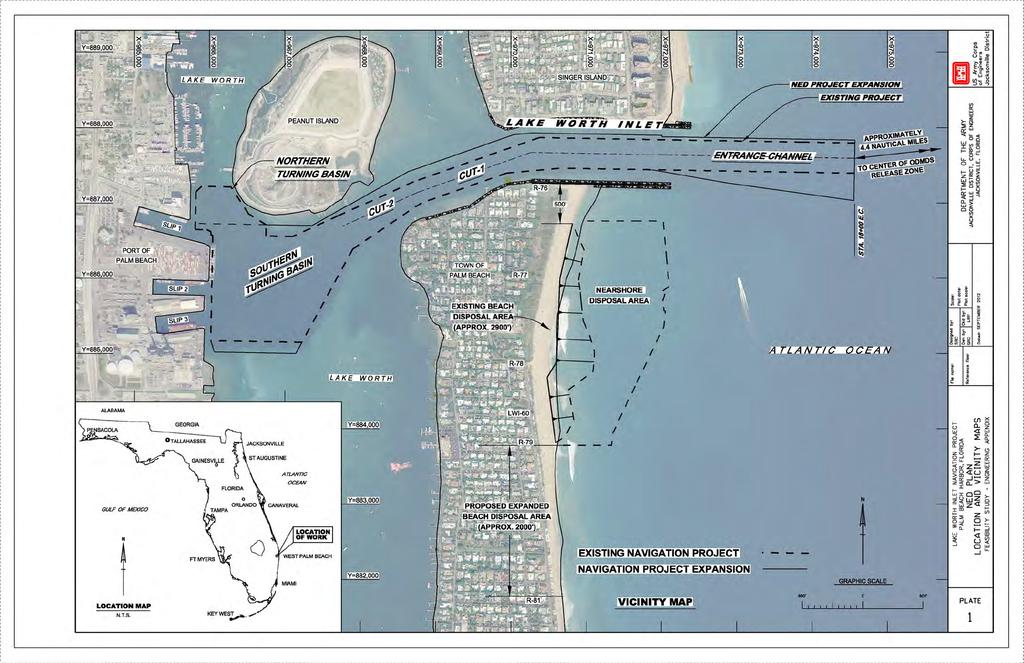
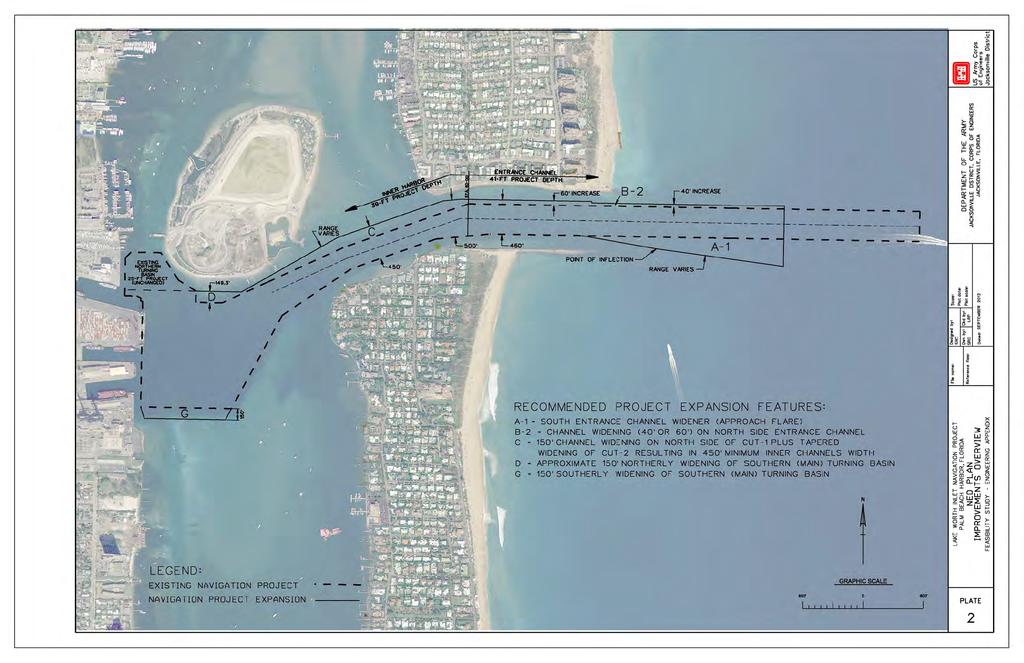
6 LAKE WORTH INLET, FLORIDA APPENDIX A ENGINEERING A. INTRODUCTION 1. General. This appendix presents the discussion of applicable design considerations and construction methods utilized to adequately address the project requirements and to establish a basis for the cost estimates. General requirements for real estate and operation and maintenance are also presented. 2. Tentatively Selected Plan. The Tentatively Selected plan incorporates National Economic Development (NED) improvements to the Federal navigation project at Lake Worth Inlet, Florida. These improvements would include the addition of a new channel flare on the south side of the Entrance Channel, a widening of the Entrance Channel by either 40 or 60 to the north, widening of the Inner Harbor Cuts 1 and 2 to provide for a minimum channel width of 450, a 150 expansion of the Southern (Main) Turning Basin to the south, and an expansion of the Southern (Main) Turning Basin on the north side to remove a notch currently encroaching into the basin. The channel would be deepened to a project depth of 39 feet Mean Lower Low Water (MLLW) for the Inner Harbor and 41 feet MLLW for the Entrance Channel plus applicable allowances and overdepths discussed in this Appendix. Refer to Plate 2 for a complete description of the NED project improvement features. In addition to the navigation project improvements described above that are necessary to facilitate the safe and efficient navigation of the design vessel, there are other features needed to support the project. These features include North Jetty stabilization, reconfiguration of the Advance Maintenance Zones, reconfiguration of the Settling Basin, Seagrass Mitigation Area construction, and Hardbottom Mitigation Area construction as detailed in this Appendix and other areas of the Feasibility Study Report. A discussion of the plan formulation involved in the selection of the Tentatively Selected plan is presented in the main portion of this report. All soundings presented in this report are at MLLW based on the latest tidal epoch available from NOAA and the project is located geospatially in the North American Datum of 1983 (NAD83). B. HYDROLOGY AND HYDRAULICS 3. General. A project location and vicinity map showing the features described below is provided on Plate 1. The currents and water surface elevations in Palm Beach Harbor are subject to tide, the effects of winds, upland drainage, and variations in barometric pressure. These factors serve as boundary conditions for the hydraulic forces influencing the smaller scale limits of this study area. The hydrodynamic model investigations conducted for this feasibility study are presented in an Attachment to this Appendix. Attachment A (Hydrodynamic Modeling) includes two dimensional model descriptions and results that were conducted in support of alternative evaluations and an assessment of channel modification impacts on bay circulation (i.e., currents), channel shoaling and storm surge. A-1
7 4. Tides. The astronomical tide is the most important factor driving the circulation of water within the Harbor and in the variation of water elevations. The tide is semi diurnal where two high waters and two low waters generally occur in a tidal day. The mean tide range is 2.72 ft and the spring tide range is 3.26 ft. 5. Currents. Tidal currents in the Palm Beach Harbor entrance channel are strong. The maximum currents occur in the entrance channel where maximum flood currents of 6.0 feet per second (3.6 knots) are experienced and the maximum ebb velocity is 4.0 feet per second (2.4 knots). Average flood and ebb velocities in the entrance channel are 3 feet per second (1.75 knots) and 2 feet per second (1.25 knots) respectively. At the Inner channel the average flood and ebb velocities are 2.7 feet per second (1.6 knots) and 2.5 feet per second (1.5 knots). In the Intracoastal Waterway (IWW) at Peanut Island the average flood and ebb velocities are both 1.3 feet per second (0.75 knots). 6. Sea Level Rise. The geologic record of historical sea level variations indicates that both increases and decreases in global sea level have occurred. Both global cooling and warming contribute to sea level change. The National Ocean Service (NOS) has compiled long term records of measured water surface elevations along the Atlantic coast. This data is the basis for projecting future relative sea level rise at Palm Beach Harbor. Relative sea level (RSL) refers to local elevation of the sea with respect to land, including the lowering or rising of land through geologic processes such as subsidence and glacial rebound. It is anticipated that sea level will rise within the next 100 years. To incorporate the direct and indirect physical effects of projected future sea level change on design, construction, operation, and maintenance of coastal projects, the U.S. Army Corps of Engineers (USACE) has provided guidance in the form an Engineering Circular, EC (USACE, 2011). EC provides both a methodology and a procedure for determining a range of sea level rise estimates based on the local historic sea level rise rate, the construction (base) year of the project, and the design life of the project. Three estimates are required by the guidance, a baseline estimate representing the minimum expected sea level change, an intermediate estimate, and a high estimate representing the maximum expected sea level change. Following procedures outlined in EC , Appendix B, baseline, intermediate, and high sea level rise values were estimated over the life of the project. Based on historical sea level measurements taken from NOS gage at Miami Beach, Florida, the historic sea level rise rate was determined to be 2.39 mm/year ( ft/year) ( the project base year was specified as 2017; and the project life was projected to be 50 years. Figure F 1 shows the three levels of projected future sea level rise for the life of the project. From these curves, the baseline, intermediate, and high sea level rise values at the end of the 50 year life of the project were projected to be 0.39, 0.89 ft, and 2.47 ft, respectively. The total regional sea level rise predicted by the three scenarios (baseline, intermediate, and high) will not have a significant impact to the performance of the Palm Beach Harbor project. Potential impacts of rising sea level include overtopping of waterside structures, increased shoreline erosion, and flooding of low lying areas. A positive potential impact of sea level rise on the project is a reduction in required maintenance due to increased depth in the channel. In general, regional sea level rise (baseline, intermediate, and high) will not affect the function of the project alternatives or the overall safety of the design vessel. While there is expected to be a small increase in tidal surge and penetration for all three scenarios, the structural aspects of the project will be either unaffected or can be easily adapted to accommodate the change. A-2
8 7. Storm Surge. An analysis was conducted to determine if there would be an impact to storm surge water levels at the project site due to proposed deepening of the Palm Beach Harbor Federal Navigation Project. A two dimensional hydrodynamic model was used to simulate a 100 year return interval total storm tide event on two different model bathymetries representing the existing condition bathymetry and a future bathymetry representing the Federal project with all proposed deepening and widening of the channels and Harbor. The results of these numerical simulations were analyzed to determine any potential changes to total storm tide that might result from the proposed modifications to Palm Beach Harbor. Differences between with and without project water level elevations in the vicinity of the harbor were less than 0.1 m. Therefore no significant impact of project alternative to storm surge is anticipated. 8. Shoaling. In order to assess changes to shoaling patterns and volumes resulting from proposed channel modifications, a two dimensional hydrodynamic model was developed that is capable of simulating complex coupled wave, current and sediment transport processes. The settling basin to the north of the entrance channel is an integral part of the sediment transport dynamics in the entrance channel area. The settling basin has been expanded several times to reduce shoaling in the entrance channel. Included in this investigation is an evaluation of the present and proposed settling basin as well as recommended modification for greater reduction of shoaling in the navigation channel. Future maintenance requirements based on model results and historical shoaling volumes for the Inner Harbor, which include the Inner Channel and Turning Basins is estimated to be a 9.5% increase (1636 cy/yr) of the historical volume (17,224 cy/yr) (See Attachment A, Hydrodynamic Modeling, Table ST1) which corresponds to the increase in project footprint for the Southern (Main) Turning Basin. The Inner Channel (Cuts 1 and 2) does not currently require any maintenance due to tidal flushing and this condition is not anticipated to change based on hydrodynamic modeling results. Since the Turning Basins are not dredged as often as the Entrance Channel and Settling Basin, it should not affect the dredging frequency. In order to accommodate shoaling that occurs in the selected project alternative channel depth, advanced maintenance zones were established. Future maintenance requirements based on model results for the Entrance Channel (including Adv. Maint.) predict a shoaling rate of 33,000 cy/yr and for the Settling Basins a rate of 68,000 cy/yr. That is similar to the current shoaling rate; however, a significant portion of the volume is trapped in the settling basin rather than the channel. The dredge cycle for the proposed project is once every 2 years (it is 1 year currently) as the new capacity of these optimized features prevents the project from shoaling significantly above the project depth. Therefore, the total maintenance volume estimate is 202,000 cy/2 yr. This is based on an average basis, depending upon storm activity or lack thereof, where there may be periods when dredging is required annually and others where dredging is not required until 3 years after the previous event. Based on experience from other construction deepening projects completed by the Jacksonville District, it is anticipated that the first maintenance event for the project will not be needed until the third year following initial construction. This is primarily due to the incorporation of required overdepth in the initial construction dredging. The overall estimate is 24 Maintenance Dredging events over the 50 year project life. A-3
9 C. GEOTECHNICAL 9. General. The geotechnical investigations and the geologic conditions encountered within the scope of study are presented in an Attachment to this Appendix. Attachment C (Geotechnical) includes core boring locations and associated representative data. Additional Investigations will be required to enhance the existing data to bring it to Plans and Specification standards. 10. Existing Jetty Stability. A slope stability analysis was performed using SLOPE/W within the GeoStudio 2004 (Version 6.22) suite to determine the stability of the existing channel slopes in the vicinity of both the north and south jetty. Slope geometry was based on information provided by a survey performed in Since the exact foundation elevations for both the north and south jetties are unknown, as described in Attachment C, it was conservatively assumed that between elevation 23.5 NAVD88 and 30.0 NAVD88 the foundation material consists of high blow count sand and not jetty stone. Engineering Manual (EM) Slope Stability (dated 2003) was the guidance used, with Table 3 1 requiring a long term minimum factory of safety of 1.5. The worstcase (i.e., steepest) slope scenarios were analyzed. The results of the slope stability analysis indicated that between an isolated area, from STA to STA 45+50, for which the 2002 survey showed existing side slopes steeper than one foot vertical to two feet horizontal (1V:2H), the south jetty (in its current state) has an inadequate factor of safety of The same 2002 survey indicated no specific areas of concern for the north jetty, and analysis determined that this jetty has an adequate factor of safety of 1.87 in its current state. It should be noted that the final plans and specifications will be referenced in the project datum, MLLW. However, this geotechnical analysis was performed using NAVD88 as the datum since the 2002 survey data, for which the slope stability model geometries were based on, was referenced to NAVD Jetty Stability with Tentatively Selected Plan. A slope stability analysis was performed to determine if the proposed dredge design template would impact the stability of the existing jetties located to the north and south of the proposed project. South Jetty: Analysis was performed at locations where the design template intercepted the existing slope closest to the jetties. The stability of the south jetty remained unaffected, as shown in Figure 2 of Attachment C, since the design template terminates approximately 50 feet north (i.e. 50 foot buffer) of the toe of the existing slope. As stated above, the south jetty in its current state has an inadequate factor of safety based on conservative assumptions outlined in Attachment C. No jetty stabilization features will be implemented since the proposed dredge design template will not impact its stability in its current state, and would therefore be outside the scope of this project. North Jetty: Due to several unknown factors detailed in Attachment C, a 15 foot horizontal bench (i.e., 15 foot buffer) was established in the design, beyond the channel side toe of the north jetty, as an added safety measure. At locations along the north jetty from STA to 44+00, where the channel template encroached into the 15 foot buffer, the channel template was adjusted to negate the impact, or jetty stabilization measures were incorporated into design to stabilize the jetty. The template was adjusted by eliminating the advanced maintenance in the areas where the design template width extends beyond the existing template (i.e., closer to the jetty). However, an abbreviated area, from approximately STA to 40+75, still required the advance maintenance area due to the vast amount of sand that has been shown to shoal around the north jetty head. The preliminary design of a jetty stabilization feature consists of sheet pile wall placed near the jetty toe in this area which still required advanced maintenance. Details of the preliminary analysis including existing conditions, with project conditions, the methods used, and results are presented in Attachment C. Based on this preliminary evaluation, a PZC 26 sheet, extending below the surveyed bottom to an elevation 60.0 NAVD88 is currently recommended to stabilize the existing jetty. A-4
10 Horizontal extents of this feature are currently anticipated to extend parallel to the jetty toe from approximately STA to Design details such as exact location, width, depth (minimum tip elevation), and sheet pile type will need to be refined during the PED phase using data resulting from the upcoming geotechnical exploration, scour analysis, and other design factors. 12. Channel Side Slope Selection. The available Geotechnical data indicates that the subsurface conditions for the areas west of STA are composed of either thinly bedded and moderately hard limestone and sandstone, or layers of sand, silty sand, limestone and sandstone; therefore, side slopes of 1 foot vertical to 1 foot horizontal (1V:1H) were preliminarily selected for these areas. As an exception in these areas, the southern expansion of the Main Turning Basin will have a tiered system, with 1 foot vertical to 3 feet horizontal (1V:3H) slopes above EL 30.0 MLLW, and 1 foot vertical to 1 foot horizontal (1V:1H) below EL 30.0 MLLW. East of STA 45+00, borings indicate sand and silty sand; therefore, all slopes shall be no steeper than 1 foot vertical to 3 feet horizontal (1V:3H). The side slopes were derived from historical project information, an analysis of the materials to be dredged and existing channel bathymetry. Additional information is provided in Section D below. D. DESIGN AND CONSTRUCTION 13. General. A project location map is shown on Plate 1. The proposed project plan of improvements to the Federal navigation channel is shown on Plates 2 through 8, and typical sections of the channel are provided on Plates 13 through Side Slopes. For estimating purposes, the average side slope for the proposed excavation was determined to be 1 vertical on 3 horizontal (1V:3H) for the Entrance Channel Station 0+00 to Station and 1 vertical on 1 horizontal (1V:1H) for the remainder of the project with the exception of the southern expansion of the Main Turning Basin which utilizes a combined slope of 1V:1H below elevation 30 MLLW and 1V:3H above 30 MLLW, refer to Plates 11 through 18 for details. 15. Overdepths. An additional 2 foot of required overdepth and 1 foot of allowable overdepth are included in the estimated excavation quantities. The required overdepth would be necessary to facilitate future maintenance of the channel due to the existence of consolidated material at project depth. The allowable overdepth would be included to provide for inaccuracies in the dredging process in accordance with ER , Navigation and Dredging Operations and Maintenance Policies. 16. Advance Maintenance and Settling Basin Reconfiguration. The existing project incorporates both advance maintenance and settling basin features as shown on Plate 9. In order to optimize the performance of these features, hydrodynamic modeling was conducted and the resulting reconfiguration of the advance maintenance zones and settling basins are shown on Plate 10. The primary purpose of the reconfigured features is to trap sediment outside of the Federal navigation channel thus preventing shoaling of the channel and decreasing the frequency of maintenance dredging needed to keep the channel open and free from navigation restrictions. 17. North Jetty Stabilization. The preliminary slope stability analysis determined that the North Jetty will require stabilization features to ensure jetty stability once the proposed project has been constructed. The stability of a portion of the North Jetty is affected by the 40 foot widening of the Entrance Channel to the north coupled with the need to incorporate advance maintenance zone C (AMZ C) at the tip of the jetty to capture the littoral sand transport. The stabilization feature, sheet A-5
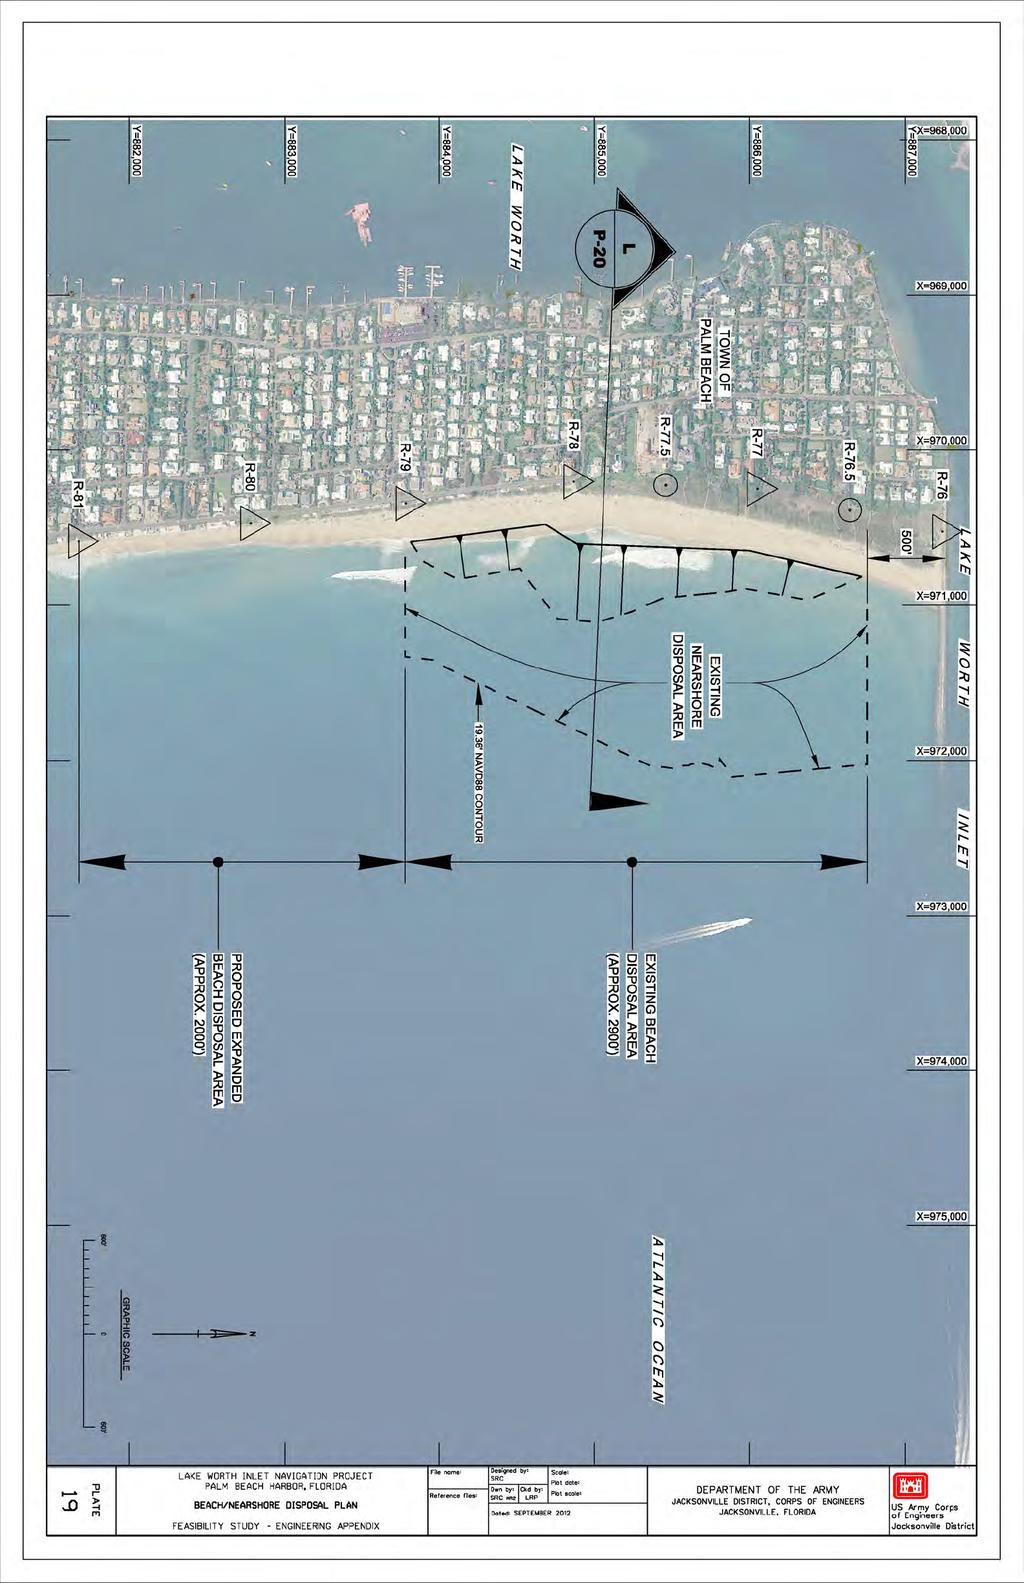
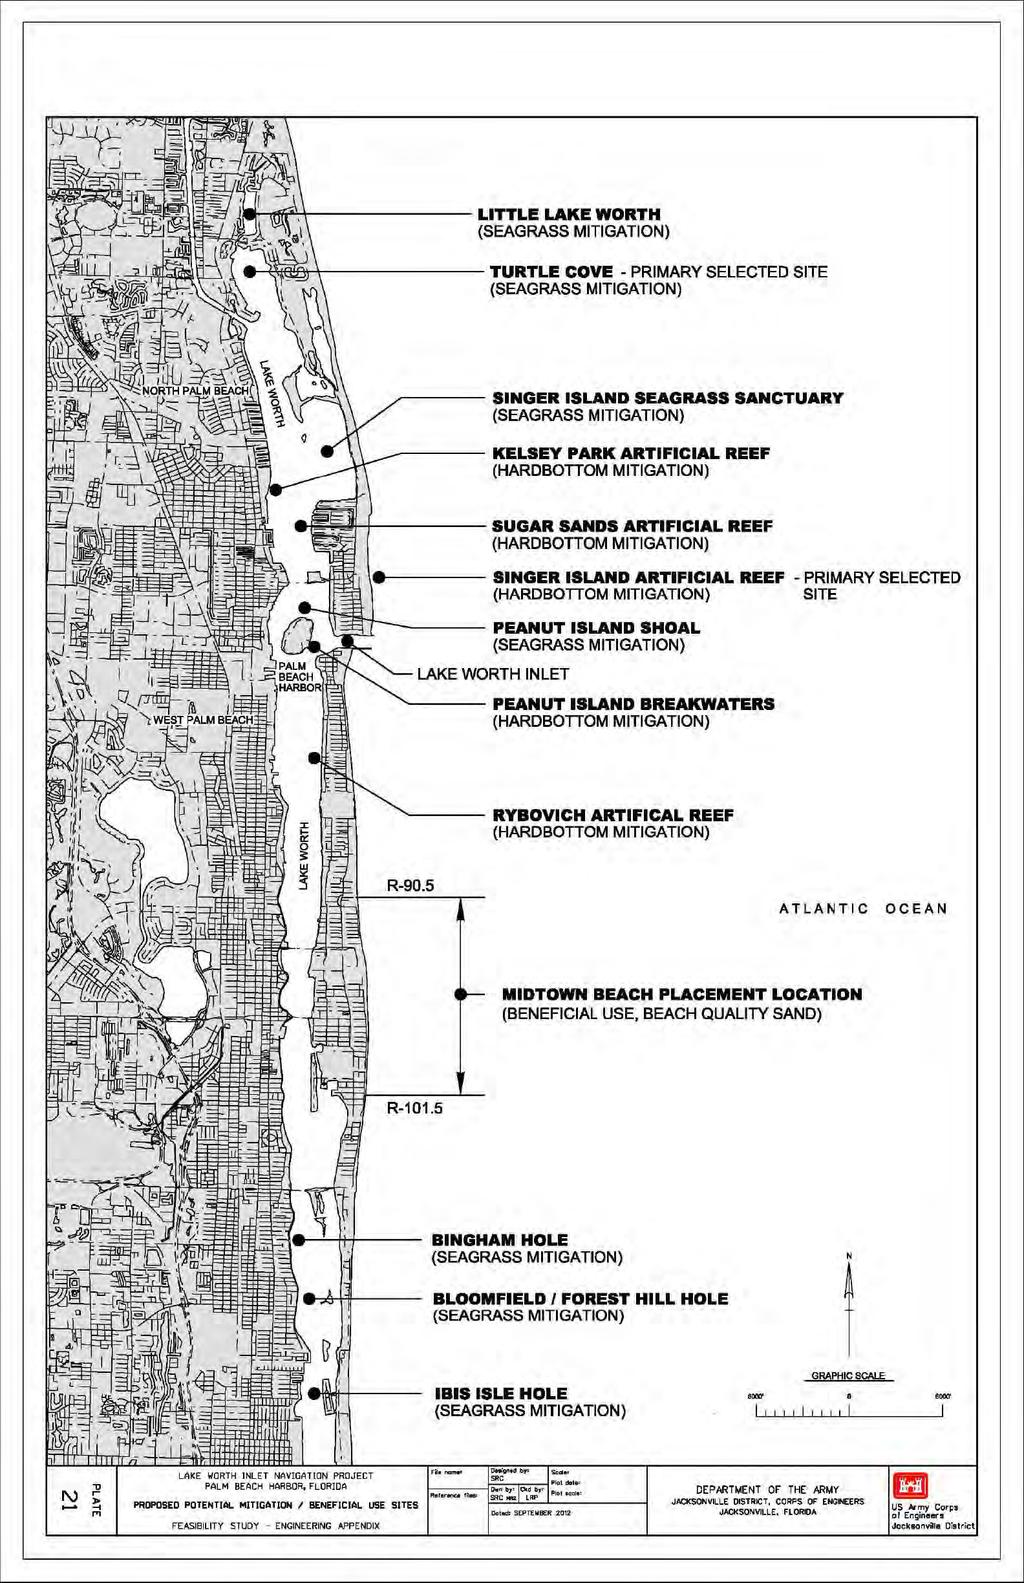
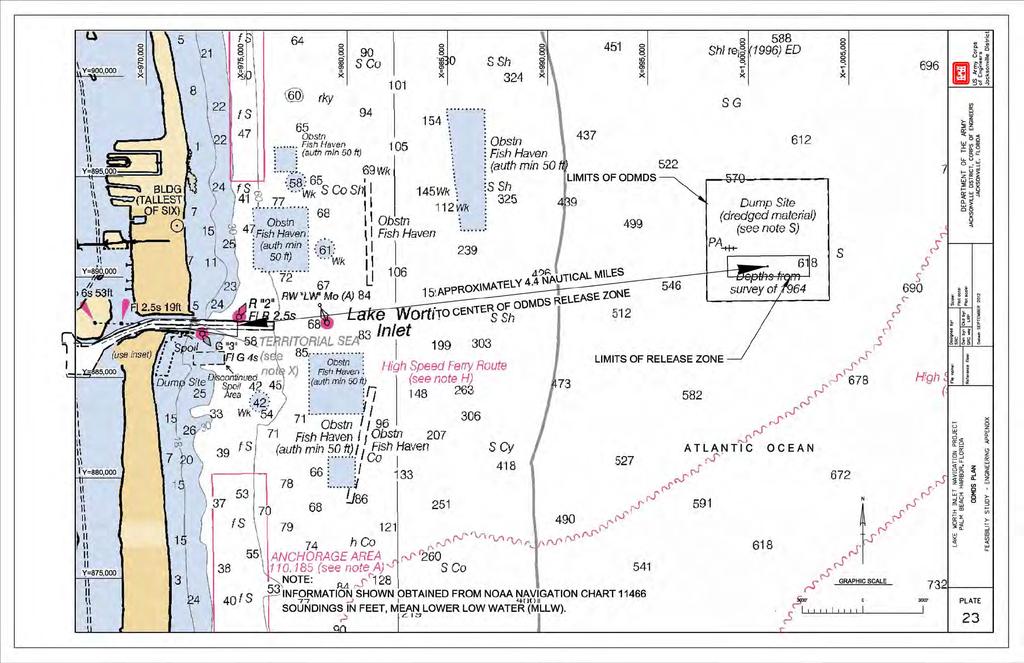
11 pile, was developed using engineering judgment based on the limited core boring data available and historical records for the jetty construction. Refer to Plates 4, 10, and 15 for details regarding the location and length of the proposed sheet pile. A complete and thorough analysis of the subsurface conditions, design of the stabilization feature, as well as any new information pertaining to the existing jetty itself will be required during the PED phase based on the results of the new geotechnical exploration program. 18. Disposal Areas. It is anticipated that all of the material to be excavated from the Entrance Channel from Station (project beginning) up to Station would be placed in the Nearshore Placement Area immediately offshore of the existing beach placement area located south of the inlet. Currently, some real estate easements are not available for beach placement; however, if they become available at the time of construction then beach quality material would be placed to capacity in the Beach Placement areas prior to placement in the Nearshore. All material from the remainder of the project (Entrance Channel Station to end, Cut 1, Cut 2, Southern Turning Basin, and reconfigured Settling Basins) would either be placed in the Palm Beach Ocean Dredged Material Disposal Site (ODMDS) or in the required mitigation sites for seagrass or hardbottom habitat. If, based on additional geotechnical investigations, it is determined that beach quality material exists in sufficient quantity and can be feasibly recovered from these areas of the project, then this material could be placed in the Beach or Nearshore Placement Areas rather than the ODMDS. Refer to Plates 19 and 20 for the Beach and Nearshore Placement Areas plan and typical sections, Plate 23 for the Palm Beach ODMDS site plan, and Plates 21 and 22 for mitigation site locations and conceptual plan and typical sections. Opportunities for additional beneficial use of dredged material exist in the project vicinity such as the filling of anoxic deepwater holes in the Lake Worth Inlet Lagoon, creation of hardbottom habitat, creation of habitat for submerged aquatic vegetation such as seagrasses and/or placement of beach quality material at the MidTown Beach Placement Area. It is not anticipated that the alternative forms of disposal of the dredged material from this project for purposes of beneficial use will result in any cost savings to the project; however, if cost increases are considered small or if there is local interest in paying for any cost difference, these alternatives could be further developed and incorporated into the project. 19. Construction Procedure. For cost estimating purposes, it is anticipated that a mechanical dredge (barge mounted backhoe) and scow barges would be used for construction of the Inner Harbor and Settling Basin and a hydraulic cutter suction dredge would be utilized to dredge the Entrance Channel where beach quality material exists. Mechanical dredging would be utilized for the portions of the project that involve disposal at the ODMDS or mitigation sites and the hydraulic dredge is utilized where beach quality material exists and disposal occurs by pumping material directly onto the beach or into the nearshore placement area. E. RELOCATIONS 20. General. The project sponsor would be required to assume the costs of all relocations and alterations. An investigation into possible utility relocations has been conducted and based on its results there are no relocations anticipated. There is an existing pipeline under the Entrance Channel to service the Sand Transfer Plant that is below the depth of the proposed project as shown on Plate 5. A-6
12 F. OPERATION AND MAINTENANCE 21. General. The Federal Government currently maintains the existing project annually. The Federal Government would be responsible for operation and maintenance of the improvements to the Federal Navigation project proposed in this report upon completion of the construction contract. The local sponsor, Port of Palm Beach, would be responsible for the costs of the construction and maintenance dredging of the Port Slip 3. The Port of Palm Beach is also responsible for the costs of infrastructure improvement of the port facilities that are scheduled to be completed in advance of the authorization of the Federal navigation improvements. 22. Estimated Annual Cost. Based on the hydrodynamic model results it is shown that the proposed project improvements result in a relatively small increase in maintenance volumes in the Inner Channels and Entrance Channel. However, with the implementation of the reconfigured Settling Basin and Advance Maintenance features it is anticipated that the frequency of maintenance dredging events can be decreased from an annual basis to a biannual basis. For the project life of 50 years this optimization will result in an overall reduction of maintenance dredging costs by reducing the fixed costs of dredge mobilization and the administration of 24 rather 50 contracts. Refer to the Economic Appendix for further details regarding the estimated maintenance costs for the project. 23. Navigation Aids. The U.S. Coast Guard (USCG) would be responsible for providing and maintaining navigation aids. Since there will only be a slight realignment of the Entrance Channel centerline (20 northerly shift), the Palm Beach Harbor Pilots have requested that there be no relocation of the Range Markers from their current positions. The channel widening and turning basin expansion will necessitate the need to relocate certain buoys; however, this relocation is considered minor and incidental by the USCG and therefore there will be no cost to the project for their physical relocation. A relatively small amount of cost is identified in the MCACES estimate to cover miscellaneous administrative costs for coordination with the USCG during and post construction. G. QUANTITIES AND COST ESTIMATES 24. Summary of Quantities. A summary of the major construction items are presented in Table T 1 and details of the areas to be dredged are provided in Tables T 2 and T 3 below. 25. Summary of Costs. The estimates of first cost for construction of the NED Plan were prepared using MCACES software and are presented in the Cost Appendix. The estimate includes a narrative, a summary cost, and a detailed cost showing quantity, unit cost, and the amount for contingencies for each cost item. The costs of the non construction features of the project are also included in the cost estimate. The costs have been prepared for an effective date of Fiscal Year 2013 (FY13). A-7
13 H. SHIP SIMULATION STUDY 26. Discussion. The preliminary engineering design for improvements to deep draft navigation features at Lake Worth Inlet and Palm Beach Harbor was completed in May of Optimization and testing of the design was scheduled for the third quarter of that year. The Full Bridge, 360 degree Simulator at STAR Center, in Dania, Florida was selected for the simulation work, and testing by the Professional Harbor Pilots from the Port of Palm Beach. STAR Center was the preferred site for the ship simulation study, based on the fact that they maintain a validated simulation model of Palm Beach Harbor, that could be modified to optimize and test the new engineering design, in conformance with engineering quality requirements mandated by the Corps. The model had been developed earlier, for a study conducted by the Port, of their planned cruise terminal expansion and associated deep draft facilities. A formal proposal to conduct the study at STAR Center was negotiated at the Corps of Engineers in Jacksonville, in July of Engineering oversight for the work at STAR Center was provided by Dennis W. Webb, PE, Group Leader, Deep Draft Navigation Group, US Army Corps of Engineers, Engineering Research and Development Center, Vicksburg, Mississippi, and, Philip T Sylvester, hydraulic engineer ship simulation technical expert from the Corps of Engineers, Jacksonville District. Validation of the Lake Worth Inlet / Palm Beach Harbor simulation model was accomplished during the first day of simulations that were completed over the two week period, September 18 to October 2, Validation is a test of the water currents used in the model. It is a confirmation of the channel layout and navigation aid placement. Validation is a check of the maneuverability and ship handling characteristics, in real time, that each design vessel demonstrates, in the exact visual space displayed by the simulator, as the engineering design of the harbor, properly and correctly referenced and fixed, in the overall larger testing domain. The water currents examined and verified were provided through hydrodynamic modeling of the harbor, by the Corps Coastal Hydraulics group in Jacksonville. Validation is an essential component of the study, performed by the licensed professional harbor pilots from Palm Beach Harbor, that certifies the usefulness and correctness of the simulation model as an engineering tool properly conceived and developed to optimize and test the proposed engineering design. STAR Center completed their Final Report of Lake Worth Feasibility Study in December of The report is a comprehensive discussion of the simulator facility, and the activities associated with ship simulation testing of the proposed engineering design for Lake Worth Inlet /Palm Beach Harbor. Simulation testing matrix, simulation scenario track plots, and harbor pilot post test run evaluations are included in it appendices. The report also includes observations and recommendations with regard to engineering design in the context of navigation usefulness, relevance, and safety. The Report is provided as Attachment B for review and reference. The track plots and comment sheets from the Report are considered to be proprietary intellectual information by the Port of Palm Beach Pilots. A copy of this information is held in confidence by ERDC and the District Office (Philip Sylvester ). 27. Optimization. The Professional Harbor Pilots from Palm Beach Harbor have been on the engineering study team from the very beginning of design development for their facility. The Corps of Engineers in Jacksonville always engages the local harbor pilot group and cultivates a close professional working partnership with them, to learn their site, to understand their problem, and formulate a possible solution that will improve their efficiency and safety. Palm Beach Harbor Pilots Association has been an active, cooperative, and highly valued member of the engineering design team. Their group has provided many hours of work to develop and shape the engineering design for their facility. This work included direct visits of the Corps design team to the Pilots office to A-8
14 work hand in hand on refinements of the channel in order to ensure that no mistakes or misunderstandings could occur with the development of the final plan. They have provided a written statement of support for the design alternative selected during simulations, and worked with the Jacksonville engineering design team to iterate that tested concept into its current, perfected, buildable form. Their letter of support is included in the Attachment B for review and reference. 28. Agency Technical Review. The control of quality is an essential component of the engineering mission at the Jacksonville District. The ship simulation study conducted at STAR Center its concept, development, execution, oversight, and conclusions has been successfully examined for quality and correctness, within the formal framework of Agency Technical Review. All comments have been evaluated, addressed, and back checked to the satisfaction of the assigned review team. A copy of the ATR comment report has been added to Attachment B. A-9
15
16 Table T-1 Summary of Construction Quantities for Tentatively Selected Plan Item Quantity Notes Dredging Volumes (Federal) Entrance Channel Entrance Channel Inner Harbor Inner Harbor Advance Maintenance Advance Maintenance Settling Basin North Jetty Stabilization PZC26 Sheet Pile Seagrass Mitigation Construction Dredge, Transport and Place Fill Dredge, Transport and Place Select Fill 285,404 cubic yards 145,767 cubic yards 910,129 cubic yards 112,950 cubic yards 173,500 cubic yards 12,000 cubic yards 258,000 cubic yards 200 LF, pile length = 63 feet 75,825 cubic yards* 37,125 cubic yards* Disposal in nearshore Disposal in ODMDS Disposal in ODMDS Disposal in Seagrass Mitigation Area Disposal in nearshore Disposal in ODMDS Disposal in ODMDS Place in Dredged Hole Place in Dredged Hole Hardbottom Mitigation Construction Provide and place limestone boulders 25,100 cubic yards Place in Artificial Reef Site *It is anticipated that approximately 112,950 cy of material from the Inner Harbor will be used in the construction of the Seagrass Mitigation Area rather than be disposed in the ODMDS. *modified by stacey to palce border, background white, and remove specific assumed mitigation sites T-1
17 Table T 2 Summary of Dredge Areas and Haul Distances Dredge Area Surface Area (sqft) Distance to Nearshore (ft) Distance to ODMDS (ft) N/A N/A N/A N/A N/A AMA AMC AMA AMC AMA /8AMB AMB SB SB SB T 2
18 Table T 3 Summary of Dredging Volumes for Tentatively Selected Plan Project Depth = 39 feet (Volumes include 2 feet required overdepth plus 1 foot allowable overdepth) Supports unrestricted vessel movement at draft = 36 feet (3 feet Underkeel Clearance for Inner Harbor and 5 feet Underkeel Clearance for Entrance Channel) Channel Area Depth Volume (cy) Nearshore ODMDS X X X X 4AMA X 4AMC X X 5AMA X 5AMC X X 6AMA X X X 8AMB X X X X 11AMB X X X X X X X X TOTALS Settling Basin Area SB X SB X SB X TOTALS T 3
19
20
21
22
23
24
25
26
27
28
29
30
31
32
33
34
35
36
37
38
39
40
41
42
43
44 DRAFT LAKE WORTH INLET, FLORIDA FEASIBILITY STUDY REPORT ENGINEERING APPENDIX - ATTACHMENT A Hydrodynamic Modeling - Draft Hydrodynamic Modeling Attachment- Page 1
45 DRAFT Table of Contents INTRODUCTION... 3 Background... 3 Objectives... 4 Technical Approach - Hydrodynamic Modeling... 4 HYDRODYNAMIC MODEL APPLICATION... 8 Hydrodynamic Model Setup... 8 Numerical Grid Development... 8 Bathymetry... 8 Boundary Conditions... 9 Hydrodynamic Model Calibration and Verification Waterlevels Currents Hydrodynamic Modeling for Ship Simulation Currents for Ship Simulation Validation Plan1 Currents Plan 2 Currents Sediment Transport Modeling for Shoaling Sediment Transport Calibration Sediment Transport Alternative Channel Depth and Settling Basin Optimization Advanced Maintenance Zones and Annual Shoaling Volumes Storm Surge Modeling Introduction Modeled Storm Bathymetry Data CMS Storm Surge Modeling CMS Storm Surge Model Run REFERENCES Draft Hydrodynamic Modeling Attachment- Page 2

46 DRAFT HYDRODYNAMIC MODELING ATTACHMENT PALM BEACH HARBOR GRR, WEST PALM BEACH, FLORIDA INTRODUCTION Background Lake Worth Inlet and Palm Beach Harbor are located on the east coast of Florida in Palm Beach County. Lake Worth Inlet is the entrance to the Port of Palm Beach and is the northern most of two inlets that connect Lake Worth to the Atlantic Ocean. Lake Worth Inlet is a man-made inlet. The USACE has maintained the Palm Beach Harbor Navigation Project since 1934, which includes the jetties, channel, turning basin, inlet revetments, and settling basin to the north of the entrance channel (See Figure 1). Palm Beach Harbor consists of an entrance channel 35 feet deep, 400 feet wide, merging with an inner channel (Cuts 1 & 2) 33 feet deep, 300 feet wide, then flaring into a turning basin with a 1,200 foot turning diameter and jetties on the north and south of the inlet. This project currently requires annual maintenance dredging. The Palm Beach Harbor navigation project also includes a settling basin on the north side of the entrance channel. The settling basin was designed to catch sediment moving from the north around the north jetty and into the channel. The dimensions of the settling basin are 200 feet (north-south) by 500 feet (east-west) with a depth of 35 feet. Figure 1. Lake Worth Inlet/ Palm Beach Harbor Navigation Study Area. - Draft Hydrodynamic Modeling Attachment- Page 3
47 DRAFT Objectives The Palm Beach Harbor Navigation Project Management Plan (PMP) outlines a plan for identifying solutions for improving the navigation in federally maintained channels in the northern area of Lake Worth. Two critical elements, identified in the plan, for reaching that goal are the currents within the channels associated with each alternative and estimating project induced channel shoaling rates. The objectives of the hydrodynamic modeling were as follows: 1) To provide the hydrodynamic inputs for use in the Ship Simulation Model. In order to meet this objective, a two-dimensional hydrodynamic model was developed that is capable of simulating complex flows in a large model domain. A two-dimensional hydrodynamic model was considered appropriate for comparison of current magnitude and direction between alternatives since the Lake Worth Lagoon is a well mixed estuary and the currents are primarily driven by tidal forcing. Also the Ship Simulator Model requires two-dimensional, depth averaged, currents and can not utilize three-dimensional currents. 2) To assess changes to circulation and shoaling patterns resulting from proposed channel geometry deepening modifications. The settling basin to the north of the entrance channel is an integral part of the sediment transport dynamics in the entrance channel area. The settling basin has been expanded several times to reduce shoaling in the entrance channel. Included in this investigation is an evaluation of the present and proposed settling basin as well as recommended modification for greater reduction of shoaling in the navigation channel. Evaluation of scour and hydrodynamic forces of the north jetty stabilization sheetpile wall would require a finer scale hydrodynamic model are not included in this modeling effort. Technical Approach - Hydrodynamic Modeling The technical criteria for selecting an appropriate hydrodynamic model are based primarily on the objectives of the navigation study, which are to optimize channel modifications and to assess impacts to channel shoaling. The existing main channel is 400 ft wide and the alternatives under consideration include widening the channel to 500 ft. In order to represent these modifications in a hydrodynamic model, the horizontal grid resolution must be on the order of 50 ft. The Lake Worth Inlet/ Palm Beach Harbor Navigation Channel is about 1.7 nmi in length from the seaward limit to the port. Given the relatively small project area, it is feasible to represent the Palm Beach Harbor navigation and vicinity with a structured grid model. To represent the Lake Worth Inlet/ Palm Beach Harbor Navigation Channel and vicinity hydrodynamics and the inlet system sediment transport and its response to wave action, - Draft Hydrodynamic Modeling Attachment- Page 4
 numerical modeling package for simulating waves, current, water level, sediment transport, and morphology change at coastal inlets and entrances.")
48 DRAFT circulation, and engineering alternatives, the Coastal Inlets Research Program (CIRP) Coastal Modeling System (CMS) (Sanchez, et.al. 2011) models were applied. CMS is an integrated two-dimensional (2-D) numerical modeling package for simulating waves, current, water level, sediment transport, and morphology change at coastal inlets and entrances. The emphasis of the CMS is on navigation channel performance and sediment exchange between the inlet and adjacent settling basin area. The numerical wave and circulation models, CMS-WAVE and CMS-FLOW, were run in a coupled mode with information passed between the models at specified intervals. Figure 2. Lake Worth Inlet/ Palm Beach Harbor hydrodynamic model grid domain and bathymetry. Model grid cells are 49.2 ft (15 m) on each side. - Draft Hydrodynamic Modeling Attachment- Page 5
 on each side.")
49 DRAFT Figure 3. Lake Worth Inlet/ Palm Beach Harbor hydrodynamic model grid cell resolution. Model grid cells are 49.2 ft (15 m) on each side. - Draft Hydrodynamic Modeling Attachment- Page 6
 on each side.")
50 DRAFT Figure 4. Lake Worth Inlet/ Palm Beach Harbor wave model grid domain. Model grid cells are 164 ft (50 m) on each side. - Draft Hydrodynamic Modeling Attachment- Page 7
51 DRAFT HYDRODYNAMIC MODEL APPLICATION Hydrodynamic Model Setup Numerical Grid Development A variable rectilinear grid was used to accurately and efficiently represent the hydrodynamics of the Palm Beach Harbor Navigation Channel and Lake Worth area including the details of the navigation channel alternatives. Figure 2 shows the hydrodynamic model grid domain. Figure 3 shows the Palm Beach Harbor entrance channel model area. The existing entrance channel is 400 ft wide and the proposed alternative width is 500 ft. The CMS-FLOW model consists of a variable rectilinear grid with 40,077 cells. Cell size ranges from 50 ft (15m) on a side within the navigation channel area to 240 ft (73 m) at the north and south limits of the grid. This resolution results in eight grid cells across the width of the existing entrance channel. This approach allows the model to represent the channel widening alternative of 500 ft. The CMS-WAVE grid, shown in Figure 4, extends 8.4 nmi along the coast and 4.3 nmi in the cross shore direction and was specified to have 164 ft (50 m ) spacing over its domain. This spacing provides adequate resolution for sediment transport and shoal rate estimates. The wave model grid includes the entrance channels and surrounding coastal area. Bathymetry Bathymetry for the hydrodynamic model is based on USACE surveys of the navigation channel and the National Oceanic and Atmospheric Administration s (NOAA) LIDAR data in the project area. Figure 5 shows the base condition bathymetry used in the hydrodynamic model. - Draft Hydrodynamic Modeling Attachment- Page 8
 measured water level data in the Lake Worth inlet area.")
52 DRAFT Figure 5. Palm Beach Harbor hydrodynamic model bathymetry (depth in meters).. Boundary Conditions The water level boundary condition is based on National Ocean Service (NOS) measured water level data in the Lake Worth inlet area. NOS stations used to construct the water level boundary condition include the Port of Palm Beach Harbor, Lake Worth Pier and PGA Blvd. Water level boundary conditions for the calibration of the CMS-FLOW model used for alternative optimization were constructed for the period 17 Dec 2008 to 22 Dec Alternative sediment transport simulations were based on the period 1 Sep to 30 Nov Wave data for the sediment transport modeling was transformed in the CMS-WAVE from National Buoy Data Center (NDBC) Canaveral and Ft Pierce stations. - Draft Hydrodynamic Modeling Attachment- Page 9

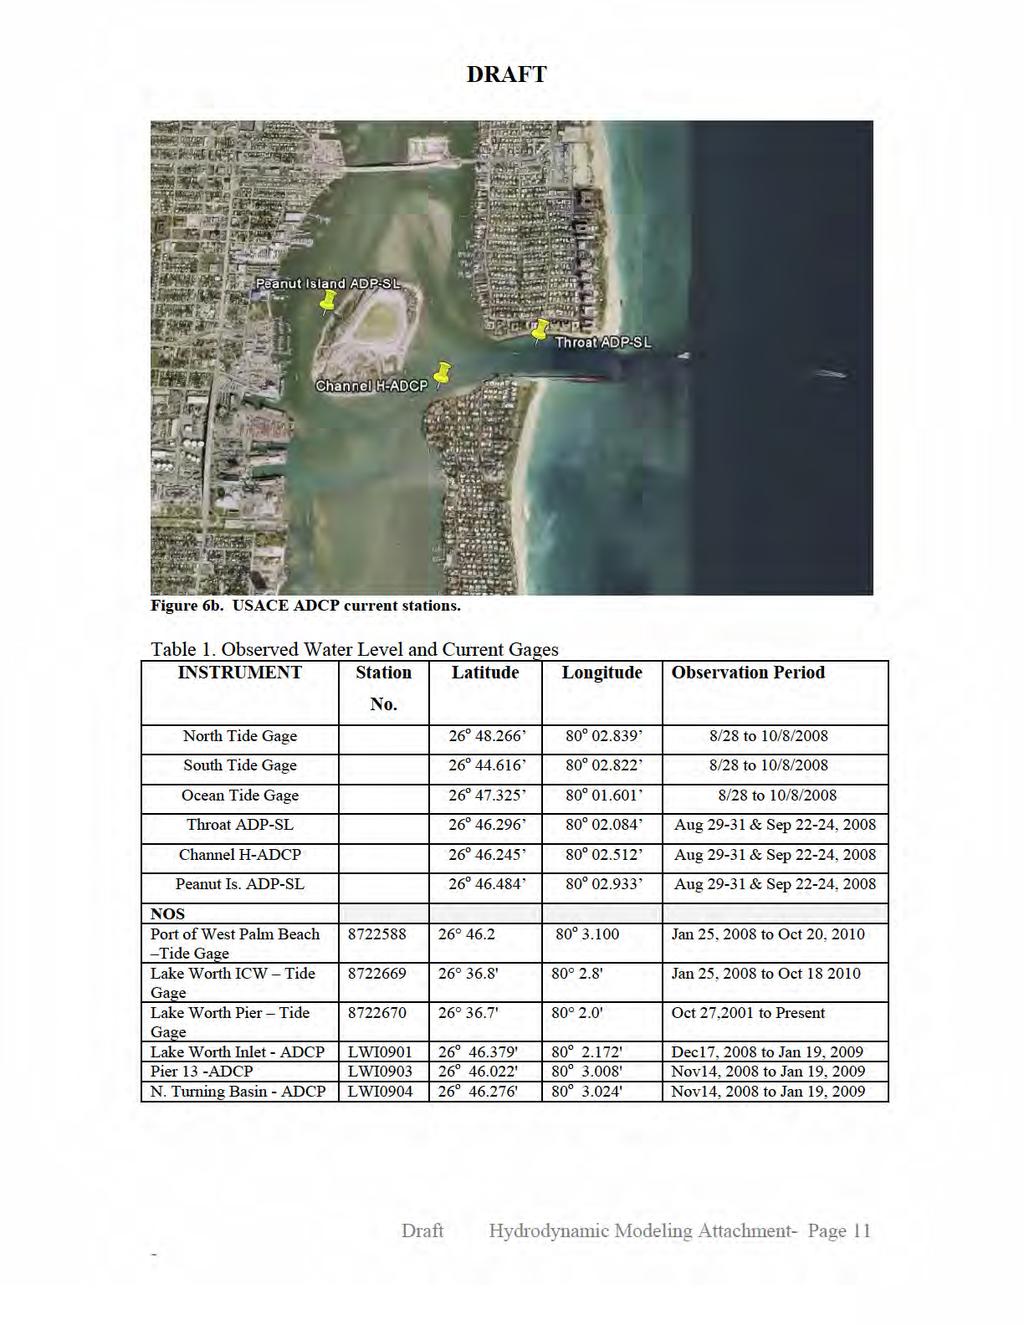
53 DRAFT Hydrodynamic Model Calibration and Verification Calibration and verification time periods were selected in order to make use of the physical oceanographic data collected in the Lake Worth Inlet area by NOS and the USACE, shown in Table 1. NOS data includes water-levels collected at the Port of Palm Beach Harbor station and ADCP currents collected at the inlet throat, Pier 3, and north of the turning basin from November 2008 to January 2009 (See Figure 7a & 7b). USACE data includes water-levels collected at stations north and south of the harbor area and offshore north of the inlet and ADCP currents collected at the inlet throat, Cut-2 from August 2008 to October 2008 (See Figure 6a & 6b). An existing conditions CMS-FLOW model was developed and calibrated to match fieldmeasured parameters such as velocities and water levels for the periods August 2008 to October 2008 and 9 to 23 December Figure 6a. USACE water-level data locations. - Draft Hydrodynamic Modeling Attachment- Page 10
54


55 DRAFT Figure 7a. NOS water-level stations. Figure 7b. NOS ADCP current stations. - Draft Hydrodynamic Modeling Attachment- Page 12

56 DRAFT Waterlevels CMS-FLOW waterlevels were calibrated at the 3 USACE stations (North, South, & OceanTide Gauges) and the NOS station number , Port of West Beach. Figure 8 shows the comparison between CMS-FLOW and NOS water levels for the period December 9th to 23 nd, Agreement between model and measured values are good, with an RMS error of 0.07 m. Figure 8. CMS-FLOW Port of West Palm Beach vs Measured Waterlevel (draft) Currents CMS-FLOW currents were calibrated at the NOS station LWI0901, in the inlet throat. Figure 9 shows the comparison between CMS-FLOW and NOS LWI0901 currents for the period December 17th to 22 nd, Agreement between model and measured values are good, with an RMS error of 0.09 m. - Draft Hydrodynamic Modeling Attachment- Page 13

57 DRAFT Figure 9. CMS-FLOW inlet throat vs Measured Depth averaged current velocities (m/s). Hydrodynamic Modeling for Ship Simulation Currents for Ship Simulation Validation In order to provide currents for the validation of the Ship simulation model, the existing Palm Beach Harbor Navigation Channel configuration consisting of a 400 ft wide, 35 ft entrance channel project depth, a 33 feet deep, 300 feet wide inner channel and a 1,200 foot turning diameter turning basin as well as the 200 feet (north-south) by 500 feet (eastwest), 35 ft existing settling basin was simulated. - Draft Hydrodynamic Modeling Attachment- Page 14

58 DRAFT Figure 10. Existing Condition- Palm Beach Harbor Figure 11. Ship Simulation Current Point Locations. - Draft Hydrodynamic Modeling Attachment- Page 15
59 DRAFT Plan1 Currents CMS-FLOW hydrodynamic simulations provided currents for simulations of Alternative Plan 1 Ship Simulations. Alternative Plan 1 consists of an entrance channel flare (A-1), entrance channel widening (B-1, B-2), an inner channel widener (C), and expansion of the turning basin (D, F, & G). Figure 11. Ship Simulation- Alternative Plan1 - Draft Hydrodynamic Modeling Attachment- Page 16


60 DRAFT Figure 13. Ship Simulation Plan 1 CMS-FLOW bathymetry and detail of Turning Basin. - Draft Hydrodynamic Modeling Attachment- Page 17

61 DRAFT Figure 14. Existing Flow vectors for maximum spring flood tide. - Draft Hydrodynamic Modeling Attachment- Page 18

62 DRAFT Figure 15. Plan1 Flow vectors for maximum spring flood tide. - Draft Hydrodynamic Modeling Attachment- Page 19

63 DRAFT Figure 15. Existing Flow vectors for maximum spring flood tide. - Draft Hydrodynamic Modeling Attachment- Page 20

64 DRAFT Figure 17. Plan1 Flow vectors for maximum spring flood tide. - Draft Hydrodynamic Modeling Attachment- Page 21

65 DRAFT Figure 18. Existing Flow vectors for maximum spring ebb tide. - Draft Hydrodynamic Modeling Attachment- Page 22

66 DRAFT Figure 19. Plan1 Flow vectors for maximum spring ebb tide. - Draft Hydrodynamic Modeling Attachment- Page 23

67 DRAFT Figure 20. Existing Flow vectors for maximum spring ebb tide. - Draft Hydrodynamic Modeling Attachment- Page 24

68 DRAFT Figure 21. Plan 1 Flow vectors for maximum spring ebb tide. - Draft Hydrodynamic Modeling Attachment- Page 25

, a reduced inner channel widener (C), and reductions of areas F and G. Figure 22.")
69 DRAFT Plan 2 Currents CMS-FLOW hydrodynamic simulations provided currents for simulations of Alternative Plan 2 Ship Simulations. Alternative Plan 2 consists of a reduced entrance channel flare (A-1), entrance channel widening (B-1, B-2), a reduced inner channel widener (C), and reductions of areas F and G. Figure 22. Alternative Plan 2 and detail of Turning Basin. - Draft Hydrodynamic Modeling Attachment- Page 26

70 DRAFT Figure 23. Plan 2 Flow vectors for maximum spring flood tide. - Draft Hydrodynamic Modeling Attachment- Page 27

71 DRAFT Figure 24. Plan2 Flow vectors for maximum spring flood tide. - Draft Hydrodynamic Modeling Attachment- Page 28

72 DRAFT Figure 25. Plan 2 Flow vectors for maximum spring ebb tide. - Draft Hydrodynamic Modeling Attachment- Page 29

73 DRAFT Figure 26. Plan 2 Flow vectors for maximum spring ebb tide. - Draft Hydrodynamic Modeling Attachment- Page 30
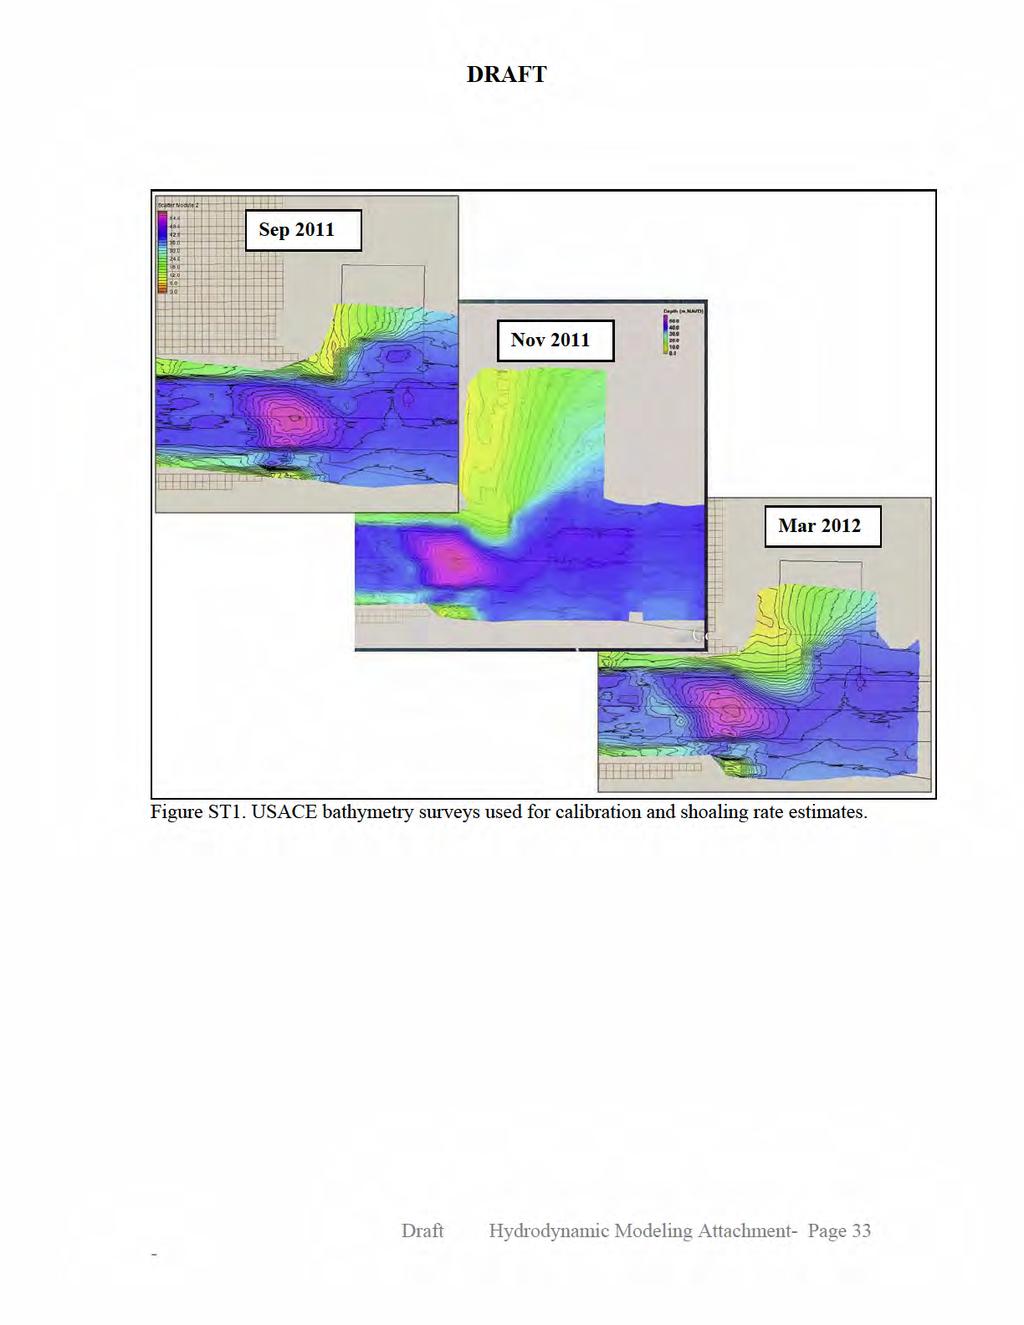
74 DRAFT Sediment Transport Modeling for Shoaling CMS simulations conducted for this study included coupled CMS-FLOW and CMS WAVE simulations of bed changes to estimate the shoaling rate for the project alternative as well as to optimize the settling basin design. Sediment Transport Calibration The simulation periods selected for this analysis span USACE bathymetry surveys conducted in September 2011, November 2011 and March The existing condition channel bathymetry in September 2011 was used as the initial condition for a 3 month calibration simulation which ends at the USACE November 2011 bathymetry survey (Figure ST1). The simulation period used for calibration from September 1st to November 30 th, 2011 represents an energetic wave climate with the mean Hs= 1.24 m during this period and four (4) storm events with two (2) exceeding Hs =3.0m. The calibration period mean Hs is similar to the Wave Information Study (WIS) mean Hs = 1.3 m for station Figure ST2 shows the model results for existing condition channel shoaling and bed elevation change for the September to November 2011 time period. The shoaling volumes from the model were compared to the measured shoal volume based on the September to November 2011 surveys. Sediment Transport Alternative Channel Depth and Settling Basin Optimization Existing channel depths with the existing settling basin and the scheduled expanded settling basin were simulated and evaluated for channel shoaling volumes. Neither of these configurations results in channel shoaling volumes that would obviate the need for unscheduled maintenance dredging. Based on these results, simulations were conducted to optimize the expanded settling basin for both the existing channel depth (35/37 ft, MLLW) and the selected project alternative depth (47/ 50 ft, MLLW). Existing project feature constraints including the north and south jetties and beach area adjacent to the expanded settling basin limit both the alternative channel width and depth and the western extent of the settling basin. Figure ST3 shows these features including the location of the jetty toe. Both the channel and settling basin are constrained by a minimum distance from the jetty toe due to potential jetty instability caused by foundation failure from channel or settling basin encroachment (See Geotechnical Attachment C). After a number of iterative simulations an optimum settling basin configuration was determined that would trap enough sediment during storm events to reduce channel shoaling to allow for longer scheduled maintenance dredging cycles. Figure ST4 shows the Existing Channel and Optimized Settling Basin shoaling. This combination reduces - Draft Hydrodynamic Modeling Attachment- Page 31
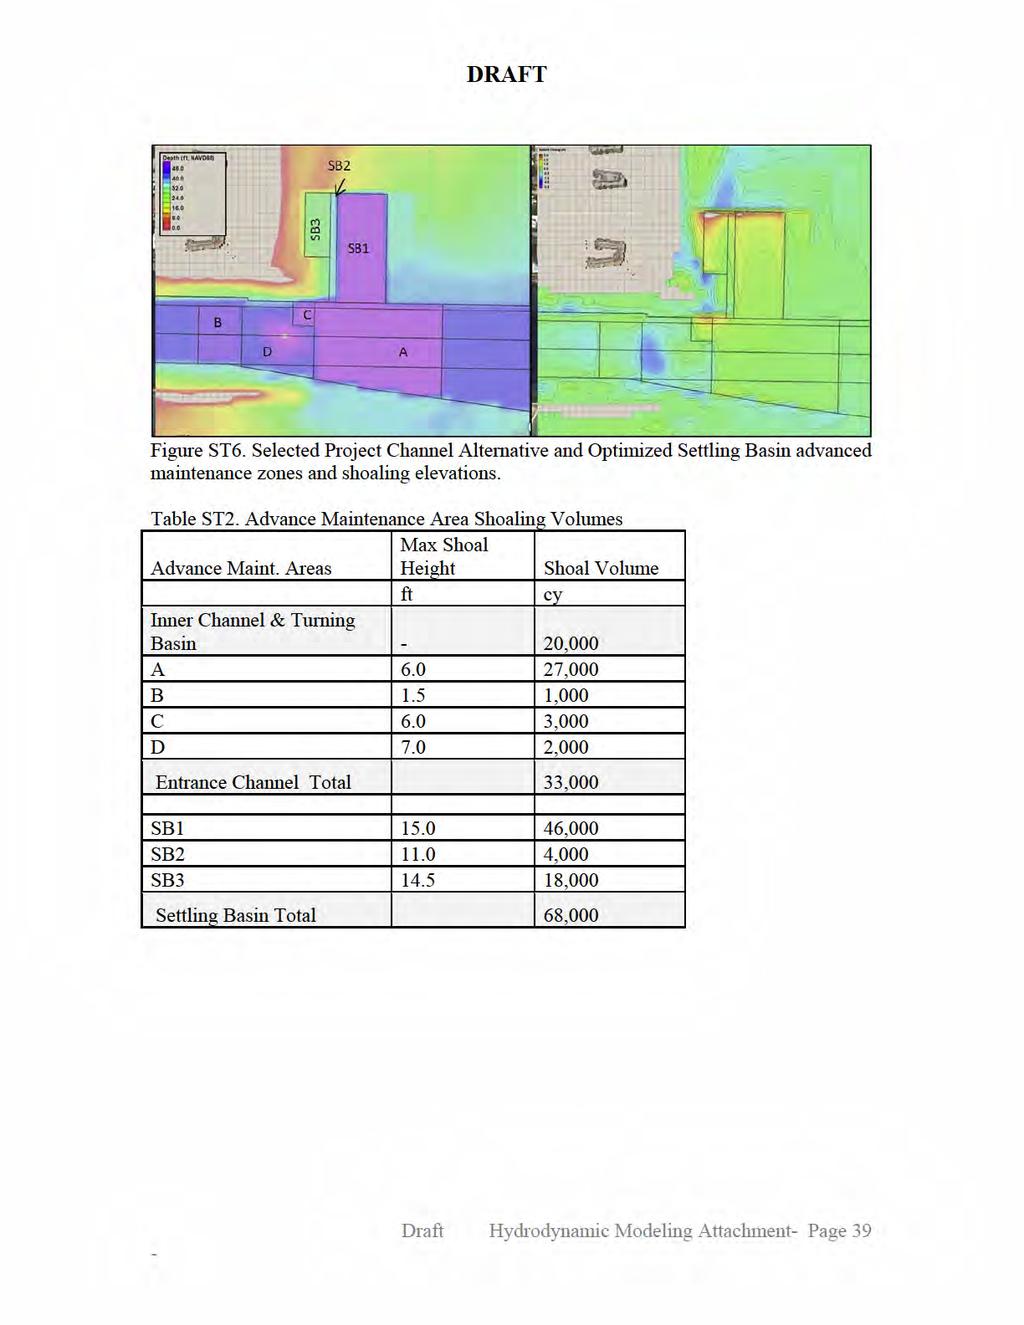
75 DRAFT channel shoaling but not to the extent which would lengthen the dredging cycle. Figure ST5 shows the Selected Project Channel Depth and Optimized Settling Basin Shoaling. This configuration reduces the channel shoaling enough to lengthen the dredging cycle to 2 years when combined with advanced maintenance. This configuration doesn t reduce the volume required to be dredged but does trap more of the volume in the settling basin rather than the channel and saves cost by reducing the number of required maintenance dredging events, on average, over the life of the project. Note that no significant shoaling was observed in the Inner Channel or Turning Basin. Therefore shoaling volumes estimates in these areas are based on historical rates and the increased area of the project features in these areas. Advance Maintenance Zones and Annual Shoaling Volumes In order to accommodate shoaling that occurs in the selected project alternative channel depth, advanced maintenance zones were established. Figure ST6 and Table ST2 shows the Advance Maintenance Zones and the corresponding annual shoal volumes and elevations. Future maintenance requirements based on model results and historical shoaling volumes for the Inner Harbor, which include the Inner Channel and Turning Basin is estimated to be a 17% increase of the historical volume of 17,224 cy, as shown in the historical dredging records in Table ST1, which corresponds to the increase in project footprint. Since this area is not dredged as often as the Entrance Channel and Settling Basin, it should not affect the dredging frequency. Future maintenance requirements based on model results for the Entrance Channel (including Adv. Maint.) predict a shoaling rate of 30,000 cy/yr and for the Settling Basins a rate of 70,000 cy/yr. That is similar to the current shoaling rate, however, a significant portion of the volume is trapped in the settling basin rather than the channel. The dredge cycle for the project is once every 2 years (it is 1 year currently) as the new capacity of these optimized features prevents the project from shoaling significantly above the project depth. Therefore, the total maintenance volume estimate is 200,000 cy/2 yr. This is based on an average basis, depending upon storm activity or lack thereof, where there may be periods when dredging is required dredge and others where dredging is not required until 3 years. The overall estimate is 24 Maintenance Dredging events over the 50-year project life. - Draft Hydrodynamic Modeling Attachment- Page 32
76

77 DRAFT Figure ST2. Existing Channel and Settling Basin Shoaling - Draft Hydrodynamic Modeling Attachment- Page 34

78 DRAFT Figure ST3.Project features- Existing Channel, Alternative channel geometry, Planned Expanded Settling Basin, and toe of jetty (black dotted line). - Draft Hydrodynamic Modeling Attachment- Page 35
79 DRAFT Figure ST4. Existing Channel and Optimized Settling Basin Shoaling. - Draft Hydrodynamic Modeling Attachment- Page 36

80 DRAFT Figure ST5. Selected Project Channel Depth and Optimized Settling Basin Shoaling. - Draft Hydrodynamic Modeling Attachment- Page 37
81 DRAFT Table ST1. Historic Dredging Records JOB KEY JOB NAME END DATE VOLUME DREDGED (CY) Volume (%) 00SAJ065 PALM BEACH HBR, '00 3/27/ ,000 01SAJ160 Palm Beach Hbr, MD 1/11/ ,332 02SAJ003 Palm Beach Hbr, MD 3/25/ ,450 03SAJ002 Palm Beach Hbr 03, MD 4/29/ ,624 04SAJ050 Palm Beach Harbor 5/7/ ,285 04SAJ141 Palm Beach Hurricane Emer MD 10/2/ SAJ292 Palm Beach Harbor 7/28/ ,467 06SAJ005 Palm Beach Harbor 12/9/ ,689 06SAJ017 Palm Beach Harbor Emergency 10/3/2006 2,312 07SAJ003 Palm Beach Harbor (FY 07) 4/20/ ,000 08SAJ005 PALM BEACH HARBOR 5/20/ ,828 09SAJ009 Palm Beach Harbor 12/30/ ,068 10SAJ007 PALM BEACH HBR O&M 5/11/ ,340 Total CY = 1,377,899 Annual Average Dredged Volume (CY) = 114,825 Entrance Channel & Sediment Basins = 97,601 85% Turning Basins = 17,224 15% - Draft Hydrodynamic Modeling Attachment- Page 38
82
83
84 DRAFT et al., 1992). The 100-yr Storm modeled was the Combined Total Storm Tide, which is the storm surge due to the astronomical tide, wind stress and barometric pressure effects combined with the dynamic wave set-up. All meteorological forcing and wave climate forcing are included in the calculation for the Combined Total Storm Tide. Available historical hurricane statistics were combined with a set of numerical models to simulate the storm tides at Palm Beach County. Available statistics included tidal recordings during the hurricanes of 1926, 1945, 1947 and September 1979 (Hurricane David). Values in the report were converted from NGVD to NAVD88 by subtracting feet using the NOAA NOS gauge at Palm Beach, FL, Station ID: (Figure 2). The Combined Total Storm Tide (Figure 3) was used for the storm surge model. Figure 2: Datum Station Palm Beach - Draft Hydrodynamic Modeling Attachment- Page 41

 (Figure 4).")
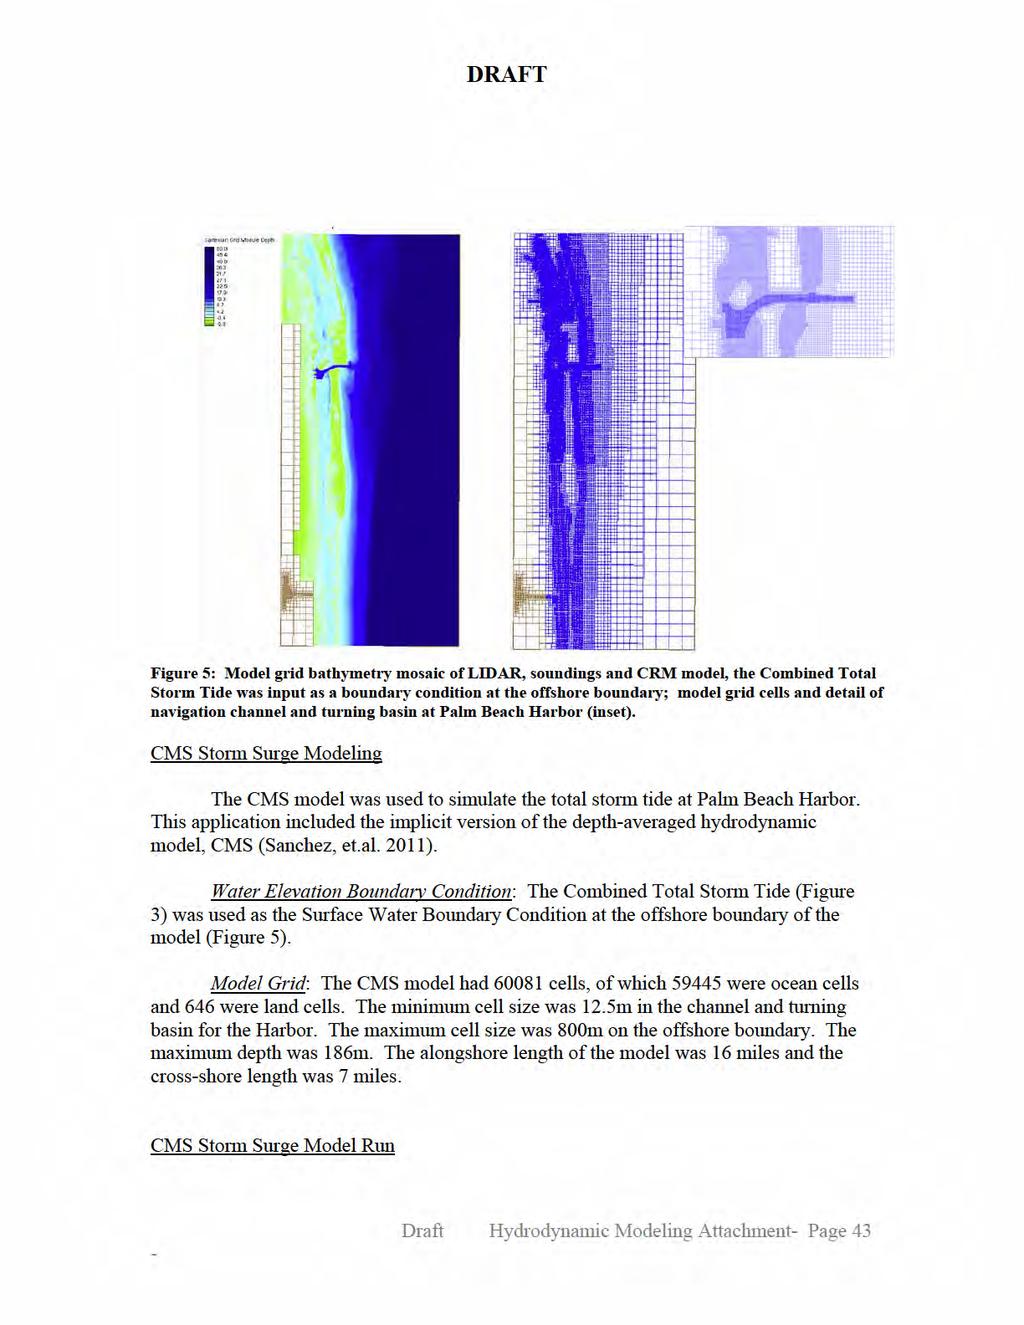
85 DRAFT Figure 3: Total Storm Tide for Palm Beach County; 100-yr Storm Bathymetry Data The model grid was populated with LIDAR elevation data collected in 2006 and 2007 for the region. These data were also combined with NOS soundings for the regions including the entire navigation channel and inlet system, a 1-mile reach in the intracoastal waterway both north and south of the turning basin at the Harbor, and in the nearshore and offshore to deep water well beyond 100m depth. Areas where no LIDAR or NOS soundings exist were populated using the Coastal Relief Model, developed by and available from the NOAA National Geophysical Data Center (NGDC) (Figure 4). Figure 4: LIDAR and NOS data coverage (red dots) and NOAA CRM raster depths Draft Hydrodynamic Modeling Attachment- Page 42 -
86
87
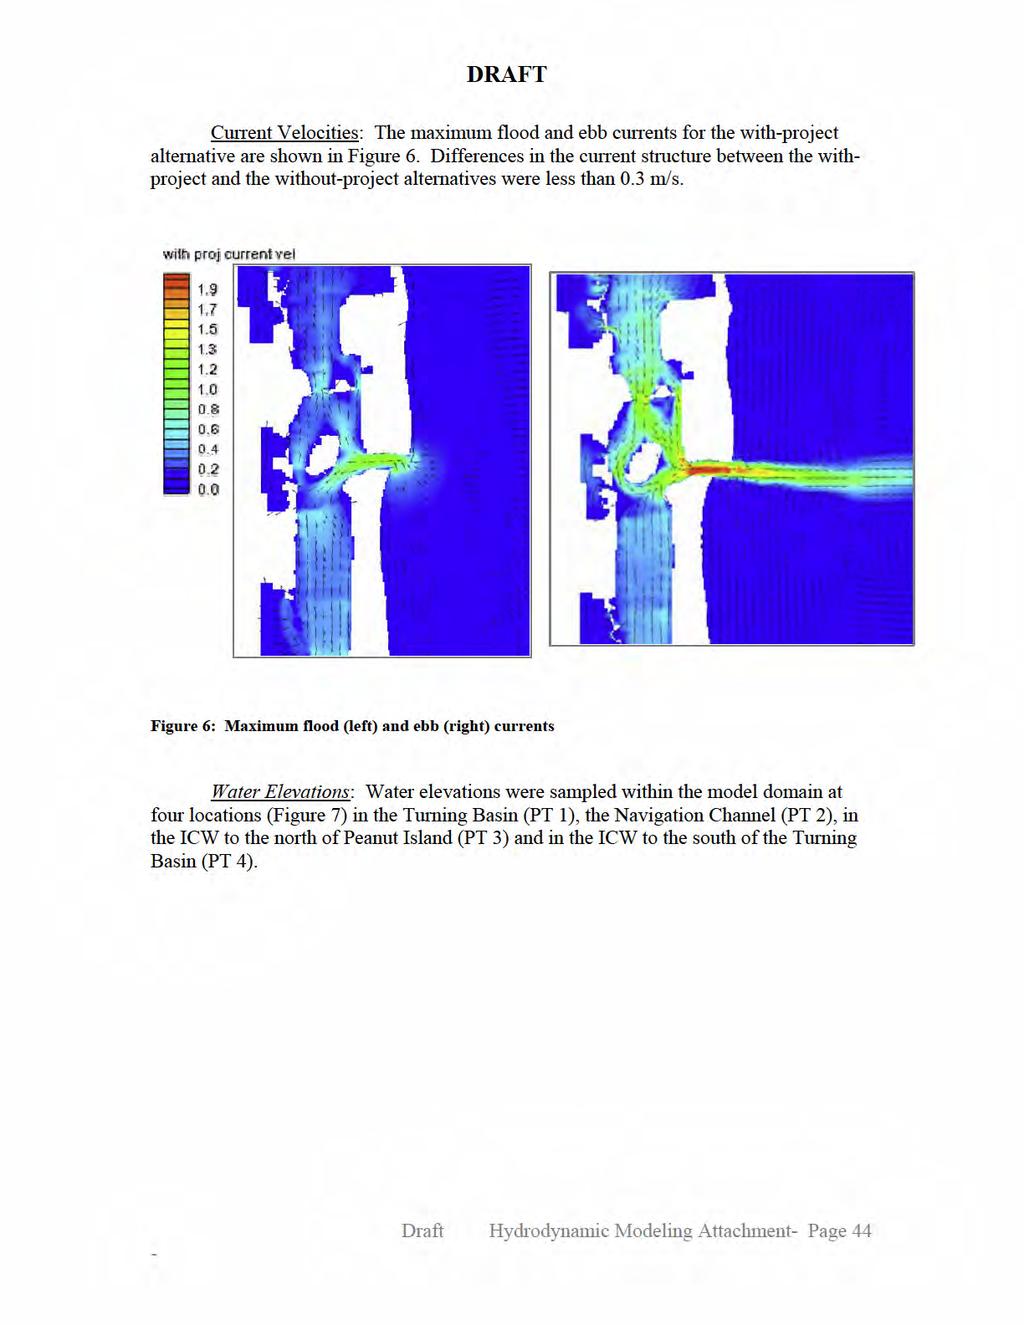
.")
88 DRAFT Figure 7: Sample locations for time-series analysis of water surface elevation At the peak phase of the tide, when water levels offshore were maximum, the water level at the project site was the same for both alternatives, with and without the project (Figure 8; a,b,c&d). What was different between the scenarios was the phase of the water elevation; the phase for the with project alternative consistently lead the without project alternative both on the flood and ebb tides. This is due to the reduction in friction for the with-project scenario due to harbor deepening. Because the friction was reduced, the navigation channel, the turning basin and the ICW both filled with water sooner on the flood tide, and were emptied of water on the ebb tide sooner than the without-project scenario (Figure 8; a,b,c&d). - Draft Hydrodynamic Modeling Attachment- Page 45
89 DRAFT Draft Hydrodynamic Modeling Attachment- Page 46 Figure 8 (a b & c): Water levels for the with and without project scenario. With project - without project water levels were subtracted (grey dashed line). Note the positive spike before hour 40 denoting the faster -rate of flooding for the with project scenario and the negative spike after hour 40 denoting the faster rate of ebbing for the with project scenario.
90 DRAFT Figure 8d: Water levels for the with and without project scenario - Draft Hydrodynamic Modeling Attachment- Page 47

91 LAKE WORTH FEASIBILITY STUDY OVERVIEW The U. S. Army Corp of Engineers (USACE) is considering port expansion in the port of Palm Beach, Florida. This expansion involves widening and deepening of the entrance channel, inner channel, and turning basin. Some modification of the vessels berthing areas may also be indicated, however, the pier areas were not part of our examination. Two channel plans were submitted for consideration. In order to test the boundaries of these proposed plans, two bulk carrier vessels were selected as the design vessels, in addition to a cruise vessel. The goal of these plans is to enable safe transits, and ample maneuver room for these vessels, especially the bulk carrier vessels when in a fully loaded condition. Selecting the plan that best provides this access during wind and tidal current conditions normally experienced at the port is the focus of the study. STAR Center, located in Dania Beach, Florida, was tasked with accomplishing this evaluation. An existing geographic database of the Port of Palm Beach, already available in STAR Center s database library, was updated using USACE provided depth and tidal current information. This existing database was modified to represent the two proposed harbor expansion plans. These prospective plans are identified as Plan 1 and Plan 2, and along with the existing harbor configuration, provided the basis for our testing. The project was conducted using STAR Center s 360 degree field of view, full mission simulator during the period 18 September through 2 October This report summarizes the methodology, results, and conclusions of that project. PARTICIPANTS Four experienced pilots from the Port of Palm Beach actively participated in the project and operated the bulk carriers and cruise vessel during all simulation exercises. In addition to the pilots, representatives from the U.S. Army Corp of Engineers (USACE), the client, observed simulation runs and provided valuable insight into design strategies and background information. The run matrix, which provided the general scope and details of the project, was provided by USACE, which also selected the design vessels used in simulations. STAR provided a Senior Researcher to manage the project, a simulator operator to operate the equipment, and also monitor and record data, and a technician to ensure STAR Center admits students of any race, color, national and ethnic origin or sex. 1 of 13

92 proper operation of the simulator. A bridge officer was provided to assist the pilot, carry out his steering and engine orders, and relay orders to assisting tug boats as necessary. A project facilitator observed and monitored simulations, noted conditions and results, briefed and debriefed the participating shiphandlers between simulation exercises. GEOGRAPHIC DATABASE The geographic database used in simulations was constructed from information based on C-Map electronic charts, NOAA Charts and 11466, up-to-date nautical publications, and tide and current tables. Digital photographs of the immediate area were included to provide an accurate and realistic visual reference for the shiphandlers. Details in these photographs included the pier area, shore installations, navigational aids, breakwaters, and shorelines. Bathymetric information of area depths and currents was provided by USACE, and included in the database. The Port of Palm Beach is accessed through Lake Worth Inlet using a feet wide entrance channel. Charted depth in this channel, through the breakwaters is feet, and continues at feet in the inner channel and turning basin. These dimensions are represented in our existing channel database. The existing database is presented in Figure 1 Existing Channel below. STAR Center admits students of any race, color, national and ethnic origin or sex. 2 of 13
93 FIGURE 1 EXISTING CHANNEL The existing database plan of the Port was modified to incorporate changes and modifications in depth and channel widths provided in design Plan 1. While both proposed design plans offer the same entrance channel ( ft.), inner channel and turning basin depths ( ft.), Plan 1 offers the widest channel and turning basin options of either plan. The Plan 1 database is presented in Figure 2 Plan 1 Design below. FIGURE 2 Plan 1 Design The existing database plan of the Port was also modified to incorporate changes and modifications in channel and turning basin design provided in design Plan 2. Channel and turning basin depths are the same as Plan 1; however, widening of those areas is less. The Plan 2 database is presented in Figure 3 Plan 2 Design below. STAR Center admits students of any race, color, national and ethnic origin or sex. 3 of 13
94 SHIP RESPONSE MODEL FIGURE 3 Plan 2 Design The ship response hydrodynamic models provided for the study came from STAR s library of vessel models, or in the case of the Palm Beach Brewer were specifically constructed for this project. The bulk carrier vessels were selected as the design vessels as they represent vessels that may access the Port of Palm Beach in the future. The cruise vessel represents the same approximate size of a vessel now in use at the port, but would also benefit from an expanded channel and turning basin. Particulars for each vessel are presented in Table 1 Ship Particulars below. STAR Center admits students of any race, color, national and ethnic origin or sex. 4 of 13
95 Table 1 SHIP PARTICULARS Ship Name Palm Beach Black Rose Norwegian Sea Black Rose Brewer Condition Loaded Loaded Design Ballasted Tonnage 62,820 65,085 19,810 33,140 LOA (ft) Beam (ft) Draft Fwd (ft) Draft Aft (ft) Propulsion Diesel Diesel Diesel Diesel Bow Thruster hp none none 2,682 none Stern Thruster hp none none 2,682 none Shaft HP 13,357 13,512 14,161 13,512 Propeller 1 Fixed 1 Fixed 2 Variable 1 Fixed Propeller Direction CW CW Inward CW Max Rudder SHIP ASSIST TUGBOATS The Port of Palm Beach has at its disposal two conventional, twin propeller tug boats. The horsepower of these tugs is 2,000 and 900 respectively. The participating shiphandlers indicate that current practice is to augment these tugs when necessary, with the more powerful tugs available at nearby Port Everglades. Bulk Carriers, with their deep draft, and minimum horsepower propulsion, are probably the least maneuverable vessels to visit the port. Their lack of maneuverability and sluggish steering capabilities at low channel transit speeds is amplified when the vessel is in a fully loaded condition. This fact dictates the use of reliable and powerful ship assist tug boats when in the entrance channel, the turning basin, and during docking and undocking maneuvers. Discussions conducted with the participating shiphandlers, prior to commencement of simulation exercises, stressed the need for more powerful tugs for use when maneuvering the bulk carriers. A 2,000 and a 3,000 horsepower tug boat configuration was tested. This 2,000/3,000 horsepower tug boat combination proved, in the opinion of the shiphandlers, to be inadequate in the conditions tested (runs 1 thru 9). It was decided, and was demonstrated in simulations, that the current 2,000hp tug when supplemented by a 5,000hp tug boat from Port Everglades, was adequate for all required transits and maneuvers. This 2,000/5,000 horsepower tug boat combination was used for all remaining simulations utilizing the bulk carriers. Tug boat assistance is not normally required for arriving or departing cruise vessels due to their exceptional maneuverability, therefore, assist tugs were not used for the Norwegian Sea. STAR Center admits students of any race, color, national and ethnic origin or sex. 5 of 13
96 ENVIRONMENTAL CONDITIONS Wind Wind direction and velocity used in simulations are those winds normally experienced in the area. Average light wind situations, generally Easterly, were incorporated in exercises involving both the Palm Beach Brewer, and the Black Rose. Wind effects are normally minimal for a loaded Bulk Carrier. Wind velocities were slightly higher when Norwegian Sea was used in simulations, because Cruise vessel susceptibility to wind effects is more pronounced. Winds from the North, Northeast, East, Southeast, and South were used. Tidal Currents The effects of tidal currents within the entrance channel, inner channel, and turning basin play an important roll in vessel performance. Current velocities up to or exceeding 1 knot in these areas, can be challenging, especially at the minimum transit speeds dictated for a laden bulk carrier. Current direction and velocities were supplied by USACE for inclusion in simulation exercises. They are generally described as Ebb or Flood currents, and the direction and velocity of their set adjusted accordingly. Slack water (no current) conditions were also used in simulations. Prior to the start of our 14 day examination of the Port of Palm Beach, one additional day was devoted to adjustment of these currents. An experienced Palm Beach Pilot participated in this current validation effort by operating a Black Rose into and out of, the port during both ebb and flood conditions. His assessment as to the effects of the current on that vessel, were the basis of our validation. Slight current modifications dictated by that effort were accomplished during that one-day session, and were used throughout the project. Currents and their perceived effect on various vessels are subjective with each shiphandler. With this in mind, currents used were made to represent average conditions, accurate in direction of set, and based on USACE provided current data in their effect on vessels. In addition to ebb and flood current, a slack current was also used within the confines of the harbor. Gulf Stream Currents Immediately outside the breakwater at the Lake Worth Inlet, the entrance channel is swept by the Gulf Stream Current. This current runs from South to North at varying velocities. Participating shiphandlers report that this Northerly current can be expected to run at between 1.0 and 2.5 knots immediately adjacent to the breakwaters. The challenge for the shiphandler when entering the channel is to maintain enough vessel speed, and enough course angle to overcome the effects of this current, and at the same time, immediately slow to safe channel transit speeds. STAR Center admits students of any race, color, national and ethnic origin or sex. 6 of 13
97 Tidal currents of ebb and flood within the channel blend with the Gulf Stream currents immediately outside, and duplicating these effects to the satisfaction of each shiphandler proved challenging. The effective simulated resultant current produced in simulations elicited shiphandler comments ranging from too strong, to too weak. In order to overcome this difficulty, it was decided to maintain the directionality, but decrease the Gulf Stream Current to 1.5 knots at the sea buoy and taper velocity to approximately 1 knot or less at the breakwater. This adjustment enabled the shiphandlers to continue their vessel course and speed strategies, with somewhat reduced effects. In order that the full effect of this Gulf Stream current not be overlooked however, a brief series of exercises were included in simulations, and are identified as Gulf Stream currents. Wind and Current conditions for each exercise are identified in Table 2 Run Matrix see Appendix B. TEST PROCEDURES The shiphandler operated the vessel from the simulator pilot house, which is a replica of a vessel bridge. The bridge contains all the navigation and control equipment available to the shiphandler in actual practice. An additional display was made available to the shiphandler as part of this equipment. This display provided a bird s eye view of the vessel and its position in the channel/harbor. Its inclusion was necessitated by the fact that the Electronic Chart Display (ECDIS) did not reflect changes made by dredge plans 1 and 2. Each shiphandler was assisted by a STAR Center provided mate to carry out his steering and engine orders, and relay verbal orders to the tugboats operated by the simulator operator, via VHF radio. The general practice, followed throughout the simulation exercises, was to brief the shiphandler, identifying wind and current conditions used in each upcoming run. Also agreed upon, were the run start position and end point prior to the commencement of each run. The shiphandler selected the vessel s starting course, speed, and tug boat placement (if used) at that time. At the completion of each exercise run, debriefing the just completed run included the completion of a Run Evaluation Form. This form solicited his opinions and comments regarding the just completed exercise. It included questions relating to: adherence to intended track line, vessel controllability, adequacy of bow thrusters (if available), effectiveness of tug boats, and overall safety and task difficulty. Following completion of all exercises, participating shiphandlers were provided a Pilot s Final Evaluation form. This form solicited specific project related questions, and provided a forum for any additional comments or remarks participating shiphandlers wished to express. Completed copies of both these forms are attached to this report. STAR Center admits students of any race, color, national and ethnic origin or sex. 7 of 13
98 All inbound exercises, for the bulk carriers and Norwegian Sea, commenced outside the inlet breakwater, just south of the PB buoy (sea buoy), or just south of channel buoy number 2. Participants stated that the shortened starting point, South of buoy 2, was more practical, and in keeping with their strategy of entering the channel at, or just west of that point. Bulk Carrier Inbound/Outbound Exercises Inbound transits for Palm Beach Brewer and Black Rose ended when the vessel was parallel to Slip 3, slowed, and under comfortable control of the shiphandler. Both bow in and bow out approaches were examined. Shortened inbound runs concluded when the vessels cleared the inner channel turn at dredge Area C. All outbound runs commenced in Slip 3 with mooring lines released, and ended at the entrance breakwaters. Both bow in and bow out departures were examined.** Cruise Ship Inbound/Outbound Exercises Inbound transits for Norwegian Sea ended when the vessel was parallel to Slip 1, slowed, and under comfortable control of the shiphandler. Both bow in and bow out approaches were examined. A number of shortened inbound runs were also conducted with Norwegian Sea, and ended when the vessel cleared the Inner Channel turn at dredge Area C. All outbound runs commenced in Slip 1 with mooring lines released, and ended at the entrance breakwaters. Both bow in and bow out departures were examined. DATA COLLECTION Track plots are a visual representation of vessel position, trajectory, and track history. After each simulation run a track plot was recorded. Also recorded and archived, was a parameter log, a numerical dataset listing items such as vessel heading, course and speed, information relating to control settings, and the resultant forces acting on the vessel. STAR Center s staff maintained observation notes and discussed results with the participating shiphandlers after each test run. Simulator specific factors that might influence the interpretation of results were noted and taken into account when evaluating results. These track plots and numerical dataset were used in post-project analysis, in conjunction with Run Evaluation Forms, Pilot Final Evaluations and observation notes. Copies of theses track plots, Parameter Logs, Run Evaluation Forms, and Pilot Final Evaluations are attached to this report. **Note: One inbound and one outbound special run were conducted in the Existing Channel using Black Rose in a ballasted condition. With a maximum draft (aft) of 25.6 feet, these runs were completed successfully. These runs are identified as 55B and 56B in the Matrix table (see Appendix B). Their successful completion briefly demonstrates the fact that vessel draft, not vessel length, is the major limiting factor in safe access to the port. STAR Center admits students of any race, color, national and ethnic origin or sex. 8 of 13
99 FINDINGS Dredge Depth The fact that channel and harbor dredging would be required to provide safe access for Palm Beach Brewer, and Black Rose, each with a loaded draft of feet, was apparent from the start of our examination given that the controlling depth of the channel is less than the deep draft of these ships. The depth of dredging would be dictated by the fact that approximately 3.28 feet of under-keel-clearance is normally accepted as the minimum clearance required for safe maneuvering when operating slower than approximately 5 knots of vessel speed. Common practice dictates that dredge depths should therefore be at least 43.3 feet, as per standard guidelines. Simulations indicate that a 43.3 feet depth proved to provide adequate and safe under-keel-clearance for vessel operations when in the turning basin and in the inner channel where slow speeds were maintained. In the entrance channel however, shiphandlers use speed and drift angle 1 to overcome the North setting effects of the Gulf Stream current. Speeds of approximately 7 to 8 knots were used in simulations, and are considered conservative speeds to overcome these effects. These higher vessel transit speeds, with resultant squat 2, increase depth requirements. Palm Beach Brewer, for instance, at a 7 knot speed would increase its draft by approximately 1.31 feet. Black Rose is in the same range. Depth in the entrance channel during simulations was feet for this reason, and provided ample under-keel-clearance in all conditions tested. Simulations involving the operation of Norwegian Sea contributed little to the determination of channel and turning basin depths. Its feet draft easily maneuvered in the tested channel depths of 43 and 46 feet. Channel and Turning Basin Widths The limits of channel widening are determined by observation of usage of these areas, and the comments of the participating, experienced mariners. Both Plan 1 and, to a lesser extent, Plan 2 provide widening in areas critical to vessel operations, as identified by planning engineers in consultation with participating shiphandlers. The use of those areas in ebb, flood and slack water conditions, and the extent of that use, were examined here. Both of the bulk carrier vessels and the cruise vessel are affected by channel and turning basin widening and each contributed to our findings. 1 Drift Angle or crab angle, the angular difference between course steered and the course made good. 2 Squat is the increase of a vessels draft due to the effects of its speed through the water. STAR Center admits students of any race, color, national and ethnic origin or sex. 9 of 13
100 Norwegian Sea results demonstrated maneuvers unassisted by tug boats, but it cannot be stressed enough that both Palm Beach Brewer and Black Rose results depend heavily on maneuver assistance provided by the 2,000hp and the 5,000hp tug boats used in simulations. These tug boats are called into service, during average weather conditions, when an arriving vessel is inside the breakwaters. In the case of both bulk carriers, their first, and primary use, involves slowing the vessels speed prior to entering the turn at the inner channel. The turning basin, after run 18, included the addition of moored vessels along the pier faces just south of slips 1 and 3. This was done in order to evaluate available maneuver room when these berths may be occupied, and as a worse-case scenario for shiphandlers. RESULTS Expansion Areas Area A1 Used in almost all simulation runs for all three vessels. Its recommended dredging is based on the shiphandlers preferred strategy for approaching the entrance channel at that point, as opposed to entering at or near the sea buoy. This area is subject to greater drift angle to overcome effects of the Gulf Stream Current. A 10 degree drift angle, seen in some simulations, can produce an increased swept path of as much as 230 feet wide for the bulk carriers. Advantage: provides a much wider channel entrance. It adds maneuver room. It is consistent with shiphandlers entrance strategies. Comment: Would remain unmarked as part of the channel. No visible navigation aid to identify this area. Area B1 Expands and widens the entrance channel areas Southern boundary adjacent to the south breakwater. Advantage: Wider channel. Comments: Rarely used for transits. Area B2 Widens the usable entrance channel area, especially in an area where Gulf Stream currents may set a vessel North of the intended center channel approach. Advantage: Gives shiphandlers additional maneuver room for safety. Increased channel width (especially North side) provides additional maneuver room at a time when course angle, used to compensate for Gulf Stream set effects is most likely. Comments: Any channel width increase in this area will improve the margin of safety. Area C Widens and provides needed maneuver room at a critical point in the inner channel to slow and turn the vessel. Provides maneuver room for attending tug boats to assist in this maneuver. STAR Center admits students of any race, color, national and ethnic origin or sex. 10 of 13


101 Advantage: Adds to overall safety. It is a necessity for inbound and outbound Bulk Carriers. Comments: Most used area of the Plans. It is critical for vessel and tug boat maneuverability. Of the 38 inbound runs conducted with Palm Beach Brewer, 32 required the use of Area C. Inbound and Outbound runs by Black Rose demonstrated similar run to area usage ratios. Area D Increases the approach and turning room for Norwegian Sea when using Slip 1 while docking or undocking. Advantage: Added safety, especially when turning. Comments: Of the 24 inbound and outbound runs conducted in plans 1 and 2, Area D was entered or brushed 19 times. Area F Increases the width of the turning basin by expanding the Eastern boundary. Advantage: Added turning area maneuvering room. Comments: This area was rarely used, even with the inclusion of moored vessels at the pier causing a further restriction of usable turning and maneuver space. Area G Used sparingly by inbound vessels to Slip 3 when arriving bow in. When backing from the slip in the bow in configuration, however, use of this area was most critical. Advantage: Increased room to turn and increased tug boat maneuver room to assist, especially when backing from slip. Comments: Backing from the slip in bow in configuration demonstrated a need for this area. Area G was used 5 of the 6 runs requiring backing out and turning. Representations of Area G usage are presented in Figure 4 Area G Usage below. Image 1- Run 22 Image 2- Run 26 Image 3- Run 24 FIGURE 4 Area G Usage Image 1 depicts entry into G in run 22. Image 2 depicts slight entry in run 26, and finally, Image 3 depicts results of run 24, when the shiphandler was asked to avoid the area if possible. STAR Center admits students of any race, color, national and ethnic origin or sex. 11 of 13
MOREHEAD CITY HARBOR, NC. Dredged Material Management Plan (DMMP)
") MOREHEAD CITY HARBOR, NC Dredged Material Management Plan (DMMP) Public Meeting/Info Session 15 January 2014 US Army Corps of Engineers Morehead City Harbor DMMP Presentation Topics Morehead City Harbor
MOREHEAD CITY HARBOR, NC Dredged Material Management Plan (DMMP) Public Meeting/Info Session 15 January 2014 US Army Corps of Engineers Morehead City Harbor DMMP Presentation Topics Morehead City Harbor
APPENDIX C. Fluvial and Tidal Hydraulics Report
 APPENDIX C Fluvial and Tidal Hydraulics Report BUENA VISTA LAGOON ENHANCEMENT PROJECT FLUVIAL AND TIDAL HYDRAULICS ANALYSES Prepared for: SANDAG 401 B Street, Suite 800 San Diego, California 92101 Contact:
Evaluation of June 9, 2014 Federal Emergency Management Agency Flood Insurance Study for Town of Weymouth, Norfolk, Co, MA
 Evaluation of June 9, 2014 Federal Emergency Management Agency Flood Insurance Study for Town of Weymouth, Norfolk, Co, MA Prepared For: Woodard & Curran 95 Cedar Street, Suite 100 Providence, RI 02903
APPENDIX M DREDGED MATERIAL MANAGEMENT PLAN (DMMP) FINAL INTEGRATED FEASIBILITY REPORT AND ENVIRONMENTAL ASSESSMENT
 FINAL INTEGRATED FEASIBILITY REPORT AND ENVIRONMENTAL ASSESSMENT") APPENDIX M DREDGED MATERIAL MANAGEMENT PLAN (DMMP) Brazos Island Harbor, Texas Channel Improvement Study FINAL INTEGRATED FEASIBILITY REPORT AND ENVIRONMENTAL ASSESSMENT This page is intentionally left
APPENDIX M DREDGED MATERIAL MANAGEMENT PLAN (DMMP) Brazos Island Harbor, Texas Channel Improvement Study FINAL INTEGRATED FEASIBILITY REPORT AND ENVIRONMENTAL ASSESSMENT This page is intentionally left
North Shore of Long Island, Feasibility Study
 North Shore of Long Island, Asharoken New York Asharoken, Feasibility Study Asharoken, NY Public Meeting June 30, 2015 US Army Corps of Engineers US Army Corps of Engineers New York BUILDING STRONG BUILDING
CALCASIEU SALINITY STRUCTURES. HYDRODYNAMIC MODELING (To Support Design of Salinity Barriers)
") CALCASIEU SALINITY STRUCTURES HYDRODYNAMIC MODELING (To Support Design of Salinity Barriers) Presentation Overview 1 2 3 4 5 Project Overview and CEA Circulation Modeling Vessel Hydrodynamics Modeling
CALCASIEU SALINITY STRUCTURES HYDRODYNAMIC MODELING (To Support Design of Salinity Barriers) Presentation Overview 1 2 3 4 5 Project Overview and CEA Circulation Modeling Vessel Hydrodynamics Modeling
Nearshore Dredged Material Placement Pilot Study at Noyo Harbor, CA
 1 Nearshore Dredged Material Placement Pilot Study at Noyo Harbor, CA Noyo Cove N 2011 National Conference on Beach Preservation Technology 9-11, February 2011 Lihwa Lin, Honghai Li, Mitchell Brown US
Ninilchik Harbor Page 2 of 11
 Ninilchik Harbor Ninilchik Harbor Page 2 of 11 Condition of Improvements 31 December 2017 Ninilchik Harbor, Alaska (CWIS No. 012640, 087345) Authorization Rivers and Harbors Act, 3 July 1958 (P.L. 85-500
Assateague Island National Seashore North End Restoration Project Timeline
 Assateague Island National Seashore North End Restoration Project Timeline Date Event Some information provided in the Project Introduction document. Detailed events are available in a timeline compiled
Coastal Sediment Transport Modeling Ocean Beach & San Francisco Bight, CA
 1 Coastal Sediment Transport Modeling Ocean Beach & San Francisco Bight, CA Honghai Li and Lihwa Lin Engineering Research and Development Center U.S. Army Corps of Engineers Frank Wu, Lisa Andes, and James
HURRICANE SANDY LIMITED REEVALUATION REPORT UNION BEACH, NEW JERSEY DRAFT ENGINEERING APPENDIX SUB APPENDIX D SBEACH MODELING
 HURRICANE SANDY LIMITED REEVALUATION REPORT UNION BEACH, NEW JERSEY DRAFT ENGINEERING APPENDIX SUB APPENDIX D SBEACH MODELING Rev. 18 Feb 2015 1 SBEACH Modeling 1.0 Introduction Following the methodology
Figure 4, Photo mosaic taken on February 14 about an hour before sunset near low tide.
 The Impact on Great South Bay of the Breach at Old Inlet Charles N. Flagg and Roger Flood School of Marine and Atmospheric Sciences, Stony Brook University Since the last report was issued on January 31
Tanya M. Beck. Kelly Legault. Research Physical Scientist Coastal & Hydraulics Lab, ERDC Vicksburg, MS
 Inlet And Adjacent Shoreline Processes at Cascading Time Scales Using the Coastal Modeling System and GenCade Tanya M. Beck Research Physical Scientist Coastal & Hydraulics Lab, ERDC Vicksburg, MS Kelly
Sediment Management Plan Rehoboth Bay
 Sediment Management Plan Rehoboth Bay STAC Meeting November 16, 2007 Goals of the Study Improve planning for future dredging needs Reduce the dependency on dredging Study Tasks Environmental data Historical
Nome Harbor Page 2 of 12
 Nome Harbor Nome Harbor Page 2 of 12 Condition of Improvements 30 December 2015 Nome Harbor, Alaska (CWIS No. 010422, 012270, 072742, 087755) Authorization (1) Rivers and Harbors Act, 8 August 1917 (House
1-32 NOME HARBOR, ALASKA (CWIS NOS , 87755, 12270, & 10422) Condition of Improvement 30 September 2012
 Condition of Improvement 30 September 2012") NOME HARBOR 1-32 NOME HARBOR, ALASKA (CWIS NOS. 72742, 87755, 12270, & 10422) Condition of Improvement 30 September 2012 AUTHORIZATION: (1) Rivers and Harbors Act, 8 August 1917 (House Doc. 1932, 64th
NOME HARBOR 1-32 NOME HARBOR, ALASKA (CWIS NOS. 72742, 87755, 12270, & 10422) Condition of Improvement 30 September 2012 AUTHORIZATION: (1) Rivers and Harbors Act, 8 August 1917 (House Doc. 1932, 64th
FINAL ENVIRONMENTAL IMPACT STATEMENT ON BROWARD COUNTY SHORE PROTECTION PROJECT SEGMENTS II AND III BROWARD COUNTY, FLORIDA
 FINAL ENVIRONMENTAL IMPACT STATEMENT ON BROWARD COUNTY SHORE PROTECTION PROJECT SEGMENTS II AND III BROWARD COUNTY, FLORIDA 1. PROJECT PURPOSE AND NEED 1.1. PROJECT AUTHORITY. 1.1.1. INITIAL AUTHORIZATION.
UPPER BEACH REPLENISHMENT PROJECT RELATED
 ASSESSMENT OF SAND VOLUME LOSS at the TOWNSHIP of UPPER BEACH REPLENISHMENT PROJECT RELATED to the LANDFALL OF HURRICANE SANDY - PURSUANT TO NJ-DR 4086 This assessment is in response to Hurricane Sandy
Evaluation of Placement Alternatives for Matagorda Ship Channel Bottleneck Removal
 Evaluation of Placement Alternatives for Matagorda Ship Channel Bottleneck Removal James Rosati III Ashley E. Frey CPT Grays Harbor, WA Wood Wood chips Flour Other CMS Shark River Inlet, NJ US Army Corps
DRAFT. October 17, 2014 File No Mr. Brendhan Zubricki Town Administrator Essex Town Hall 30 Martin Street Essex, MA.
 GZA GeoEnvironmental, Inc. Engineers and Scientists October 17, 2014 File No. 18.0171857.00 Mr. Brendhan Zubricki Town Administrator Essex Town Hall 30 Martin Street Essex, MA. 01929 DRAFT Re: Essex River
Follets Island Nearshore Beach Nourishment Project
 Coast & Harbor Engineering A division of Hatch Mott MacDonald Follets Island Nearshore Beach Nourishment Project Arpit Agarwal, P.E. April 1, 2016 Project Site!"#$% &'(% &)*+% )#,'-+% Shoreline Erosion
City of Port Aransas Shoreline Analysis and Improvements
 City of Port Aransas Shoreline Analysis and Improvements FINAL Technical Report August 24, 2016 Submitted To: City of Port Aransas Prepared for: City of Port Aransas This document is intended for planning
Mouth of the Columbia River Jetties Three-Phase Construction Plan
 Mouth of the Columbia River Jetties Three-Phase Construction Plan Project Overview October 9, 2012 US Army Corps of Engineers MCR Jetties Major Rehabilitation Sand Island pile dikes 1930-1935 Columbia
Passage Key Inlet, Florida; CMS Modeling and Borrow Site Impact Analysis
 Passage Key Inlet, Florida; CMS Modeling and Borrow Site Impact Analysis by Kelly R. Legault and Sirisha Rayaprolu PURPOSE: This Coastal and Hydraulics Engineering Technical Note (CHETN) describes the
Inlet Management Study for Pass-A-Grille and Bunces Pass, Pinellas County, Florida
 Inlet Management Study for Pass-A-Grille and Bunces Pass, Pinellas County, Florida Final Report Submitted By Ping Wang, Ph.D., Jun Cheng Ph.D., Zachary Westfall, and Mathieu Vallee Coastal Research Laboratory
Chapter 4 EM THE COASTAL ENGINEERING MANUAL (Part I) 1 August 2008 (Change 2) Table of Contents. Page. I-4-1. Background...
 1 August 2008 (Change 2) Table of Contents. Page. I-4-1. Background...") Chapter 4 EM 1110-2-1100 THE COASTAL ENGINEERING MANUAL (Part I) 1 August 2008 (Change 2) Table of Contents I-4-1. Background... Page I-4-1 a. Shore Protection Planning and Design, TR 4... I-4-1 b. Shore
Chapter 4 EM 1110-2-1100 THE COASTAL ENGINEERING MANUAL (Part I) 1 August 2008 (Change 2) Table of Contents I-4-1. Background... Page I-4-1 a. Shore Protection Planning and Design, TR 4... I-4-1 b. Shore
Town of Duck, North Carolina
 Tracking No. 00.00.2010 Erosion Mitigation And Shoreline Management Feasibility Study Town of Duck, North Carolina Coastal Planning & Engineering of North Carolina August 15, 2012 Tom Jarrett Robert Neal
OECS Regional Engineering Workshop September 29 October 3, 2014
 B E A C H E S. M A R I N A S. D E S I G N. C O N S T R U C T I O N. OECS Regional Engineering Workshop September 29 October 3, 2014 Coastal Erosion and Sea Defense: Introduction to Coastal/Marine Structures
CLAM PASS RESTORATION AND MANAGEMENT PLAN BATHYMETRIC MONITORING REPORT NO. 7 Including Interior Bay Dredge Cuts and Tidal Data
 CLAM PASS RESTORATION AND MANAGEMENT PLAN BATHYMETRIC MONITORING REPORT NO. 7 Including Interior Bay Dredge Cuts and Tidal Data Submitted to: Florida Department of Environmental Protection DEP File No.
Comparison of Predicted and Measured Shoaling at Morro Bay Harbor Entrance, California
 Comparison of Predicted and Measured Shoaling at Morro Bay Harbor Entrance, California by Edward F. Thompson, Inocencio P. DiRamos, and Robert R. Bottin, Jr. PURPOSE: This Coastal and Hydraulics Engineering
1-32 NOME HARBOR, ALASKA (CWIS NOS , 87755, & 10422) Condition of Improvement 30 September 2009
 Condition of Improvement 30 September 2009") NOME HARBOR 1-32 NOME HARBOR, ALASKA (CWIS NOS. 72742, 87755, & 10422) Condition of Improvement 30 September 2009 AUTHORIZATION: (1) Rivers and Harbors Act, 8 August 1917 (House Doc. 1932, 64th Congress,
NOME HARBOR 1-32 NOME HARBOR, ALASKA (CWIS NOS. 72742, 87755, & 10422) Condition of Improvement 30 September 2009 AUTHORIZATION: (1) Rivers and Harbors Act, 8 August 1917 (House Doc. 1932, 64th Congress,
APPENDIX A Hydrodynamic Model Qualicum Beach Waterfront Master Plan
 Page 1 of 21 CLIENT: Town of Qualicum Beach PROJECT: SIGNATURE DATE CONTRIBUTORS : M. Marti Lopez REVIEWED BY : P. St-Germain, EIT APPROVED BY: J. Readshaw, P.Eng ISSUE/REVISION INDEX Issue Details Code
Appendix E Cat Island Borrow Area Analysis
 Appendix E Cat Island Borrow Area Analysis ERDC/CHL Letter Report 1 Cat Island Borrow Area Analysis Multiple borrow area configurations were considered for Cat Island restoration. Borrow area CI1 is located
Boothbay Harbor Rotary Club May 12, 2016
 Mapping Potential Sea Level Rise and Storm Surge in Boothbay Harbor, ME Boothbay Harbor Rotary Club May 12, 2016 Peter A. Slovinsky, Marine Geologist Maine Geological Survey S.M. Dickson, MGS Quickly,
SACO RIVER AND CAMP ELLIS BEACH SACO, MAINE SECTION 111 SHORE DAMAGE MITIGATION PROJECT APPENDIX F ECONOMIC ASSESSMENT
 SACO RIVER AND CAMP ELLIS BEACH SACO, MAINE SECTION 111 SHORE DAMAGE MITIGATION PROJECT APPENDIX F ECONOMIC ASSESSMENT Department of the Army New England District, Corps of Engineers 696 Virginia Road
Condition of Improvements 30 December 2014 Wrangell Harbors, Alaska (CWIS No , )
") Wrangell Harbors Condition of Improvements 30 December 2014 Wrangell Harbors, Alaska (CWIS No. 010435, 021500) Authorization (1) Rivers and Harbors Act, 22 September 1922 (House Doc. 161, 67th Congress,
Wrangell Harbors Condition of Improvements 30 December 2014 Wrangell Harbors, Alaska (CWIS No. 010435, 021500) Authorization (1) Rivers and Harbors Act, 22 September 1922 (House Doc. 161, 67th Congress,
Figure 1 Example feature overview.
 1. Introduction This case focuses on the northeastern region of Onslow Bay, NC, and includes an initial shoreline, regional contour, wave gauges, inlets, dredging, and beach fills. Most of the features
Modeling Sediment Transport Along the Upper Texas Coast
 Modeling Sediment Transport Along the Upper Texas Coast David B. King Jr. Jeffery P. Waters William R. Curtis Highway 87 roadbed, Jefferson County Galveston District Corps Sabine Pass to San Luis Pass
Cline s Point Marina Ship Wave Analysis
 Cline s Point Marina Ship Wave Analysis Draft Technical Report April 13, 2015 Submitted To: Port of Corpus Christi Authority Prepared for: Port of Corpus Christi Authority This document is intended for
CLAM PASS ANNUAL RESTORATION & MANAGEMENT PLAN TIDAL ANALYSIS ELEMENT REPORT NO. 13
 CLAM PASS ANNUAL RESTORATION & MANAGEMENT PLAN TIDAL ANALYSIS ELEMENT REPORT NO. 13 Submitted to: Pelican Bay Services Division Prepared by: Humiston & Moore Engineers H&M File No. 13-078 November 2012
CROSS-SHORE SEDIMENT PROCESSES
 The University of the West Indies Organization of American States PROFESSIONAL DEVELOPMENT PROGRAMME: COASTAL INFRASTRUCTURE DESIGN, CONSTRUCTION AND MAINTENANCE A COURSE IN COASTAL DEFENSE SYSTEMS I CHAPTER
Atlantic Coast of Long Island, Jones Inlet to East Rockaway Inlet, Long Beach Island, NY Construction Update
 Atlantic Coast of Long Island, Jones Inlet to East Rockaway Inlet, Long Beach Island, NY Construction Update June 2016 US Army Corps of Engineers Project Purpose Three specific damage mechanisms of coastal
OFFICE OF STRUCTURES MANUAL FOR HYDROLOGIC AND HYDRAULIC DESIGN CHAPTER 11 APPENDIX B TIDEROUT 2 USERS MANUAL
 OFFICE OF STRUCTURES MANUAL FOR HYDROLOGIC AND HYDRAULIC DESIGN CHAPTER 11 APPENDIX B TIDEROUT 2 USERS MANUAL APRIL 2011 APRIL 2011 Page 1 Preface TIDEROUT 2, Build 1.22 dated June 29, 2006 is the current
Planning Considerations for Nearshore Placement of Mixed Dredged Sediments
 Planning Considerations for Nearshore Placement of Mixed Dredged Sediments PURPOSE: Dredging planning and management decisions are based on a combination of engineering and economic factors tempered by
Implications of proposed Whanganui Port and lower Whanganui River dredging
 PO Box 637 Wanganui 4540 Attention: Rowan McGregor Dear Rowan 1 Summary We understand that it has been proposed to bring large vessels into the Port at Whanganui requiring the excavation of a channel up
LOCAL COASTAL PROGRAM UPDATE
 LOCAL COASTAL PROGRAM UPDATE Agenda Meeting #1 General Information (1 1:45 pm) Introductions and Background Grants involved What is a Local Coastal Program? What is required? LCP Update tasks and schedule
New Orleans Municipal Yacht Harbor
 New Orleans Municipal Yacht Harbor Marina Schematic Design Update 601 Poydras St., Suite 1860 New Orleans, LA, 70130 504-648-3560 Post-Katrina Municipal Yacht Harbor: Introduction The MYH was an approximate
INTRODUCTION TO COASTAL ENGINEERING
 The University of the West Indies Organization of American States PROFESSIONAL DEVELOPMENT PROGRAMME: COASTAL INFRASTRUCTURE DESIGN, CONSTRUCTION AND MAINTENANCE A COURSE IN COASTAL DEFENSE SYSTEMS I CHAPTER
SHORE PROTECTION AND HABITAT CREATION AT SHAMROCK ISLAND, TEXAS ABSTRACT
 SHORE PROTECTION AND HABITAT CREATION AT SHAMROCK ISLAND, TEXAS M. Cameron Perry, P.E., and Daniel J. Heilman, P.E. Coastal Engineer Shiner Moseley & Associates., Inc. 555 N. Carancahua Corpus Christi,
Beach Nourishment Impact on Beach Safety and Surfing in the North Reach of Brevard County, Florida
 Beach Nourishment Impact on Beach Safety and Surfing in the North Reach of Brevard County, Florida Prepared by John Hearin, Ph.D. Coastal Engineering Vice Chairman Cocoa Beach Chapter Port Canaveral Patrick
V. HARBOR DEPTHS, CHANNEL DESIGN AND PROPOSED CONSTRUCTION AND DREDGING
 V. HARBOR DEPTHS, CHANNEL DESIGN AND PROPOSED CONSTRUCTION AND DREDGING A. DISCUSSION: For the most part, projects that involve dredging and construction require a comprehensive design and review process
Request Number IR1-12: Flow Passage. Information Request
 Request Number IR1-12: Flow Passage Information Request Provide additional information about the 100 metre flow passage channel scenario between the Westshore Terminals and the proposed Project terminal
La Quinta Channel Extension Port of Corpus Christi Ingleside, Texas. Mark Coyle
 La Quinta Channel Extension Port of Corpus Christi Ingleside, Texas Mark Coyle Corpus Christi Navigation Channel PCCA La Quinta Expansion Project History Corpus Christi Ship Channel Improvement Projects
Comparisons of Physical and Numerical Model Wave Predictions with Prototype Data at Morro Bay Harbor Entrance, California
 Comparisons of Physical and Numerical Model Wave Predictions with Prototype Data at Morro Bay Harbor Entrance, California by Robert R. Bottin, Jr. and Edward F. Thompson PURPOSE: This Coastal and Hydraulics
1-44. SITKA HARBOR, ALASKA (Western Channel, Crescent Bay Basin, Channel Rock Breakwaters) (CWIS NOS , 16840, 10322, 55030, 13787)
 (CWIS NOS , 16840, 10322, 55030, 13787)") SITKA 1-44 SITKA HARBOR, ALASKA (Western Channel, Crescent Bay Basin, Channel Rock Breakwaters) (CWIS NOS. 72845, 16840, 10322, 55030, 13787) Condition of Improvement 30 September 2011 AUTHORIZATION:
SITKA 1-44 SITKA HARBOR, ALASKA (Western Channel, Crescent Bay Basin, Channel Rock Breakwaters) (CWIS NOS. 72845, 16840, 10322, 55030, 13787) Condition of Improvement 30 September 2011 AUTHORIZATION:
COUPLED MANAGEMENT STRATEGY LAKE CATHIE ESTUARY & COAST
 Lake Cathie Progress Association Inc. ABN 28 251 433 854 P.O. Box 247 Lake Cathie NSW 2445 PHONE/FAX: 02 6584 8211 EMAIL: r3packag@bigpond.com 20 th October 2009 Port Macquarie Hastings Council PO Box
Impact of Dredging the Lower Narrow River on Circulation and Flushing
 Impact of Dredging the Lower Narrow River on Circulation and Flushing Craig Swanson Ph.D. Swanson Environmental Alex Shaw Ocean Engineering, URI Prof. Malcolm L. Spaulding Ocean Engineering, URI 29 January
North Half Moon Bay Shoreline Improvement Project, Pillar Point Harbor, CA Coastal Engineering Appendix
 Engineer Research & Development Center / San Francisco District U. S. Army Corps of Engineers North Half Moon Bay Shoreline Improvement Project, Pillar Point Harbor, CA Coastal Engineering Appendix Photograph
U.S. Army Engineer Institute for Water Resources
 Sea Level Change Curve Calculator (2014.88) (DRAFT) U.S. Army Engineer Institute for Water Resources Table of Contents 1. INTRODUCTION... 2 1.1 BACKGROUND... 2 1.1.1 INFORMATION QUALITY ACT... 2 1.2 OVERVIEW...
Effect of Hydrodynamics on Sediment Transport near a Coastal Inlet
 ICHE 2014, Hamburg - Lehfeldt & Kopmann (eds) - 2014 Bundesanstalt für Wasserbau ISBN 978-3-939230-32-8 Effect of Hydrodynamics on Sediment Transport near a Coastal Inlet H. Li, M. Brown, J. Rosati & Z.
BILLY BISHOP TORONTO CITY AIRPORT PRELIMINARY RUNWAY DESIGN COASTAL ENGINEERING STUDY
 Bâtiment Infrastructures municipales Transport Industriel Énergie Environnement BILLY BISHOP TORONTO CITY AIRPORT PRELIMINARY RUNWAY DESIGN COASTAL ENGINEERING STUDY N. Guillemette 1, C. Glodowski 1, P.
Bob Battalio, PE Chief Engineer, ESA September 8, 2016
 RELATING FUTURE COASTAL CONDITIONS TO EXISTING FEMA FLOOD HAZARD MAPS Technical Methods Manual Bob Battalio, PE Chief Engineer, ESA September 8, 2016 FMA 2016 Sacramento, California DWR-OST-SIO PILOTING
RE: Hurricane Matthew Beach Damage Assessment and Recommendations [CSE 2416]
![RE: Hurricane Matthew Beach Damage Assessment and Recommendations [CSE 2416]](/thumbs/83/87675702.jpg "RE: Hurricane Matthew Beach Damage Assessment and Recommendations [CSE 2416]") October 25, 2016 Iris Hill Town Administrator Town of Edisto Beach 2414 Murray St Edisto Beach SC 29438 RE: Hurricane Matthew Beach Damage Assessment and Recommendations [CSE 2416] Dear Iris, Hurricane
October 25, 2016 Iris Hill Town Administrator Town of Edisto Beach 2414 Murray St Edisto Beach SC 29438 RE: Hurricane Matthew Beach Damage Assessment and Recommendations [CSE 2416] Dear Iris, Hurricane
SOUTH LAKE WORTH INLET: INLET MODIFICATION FEASIBILITY STUDY
 ABSTRACT SOUTH LAKE WORTH INLET: INLET MODIFICATION FEASIBILITY STUDY John Duchock, P.E., Project Engineer Michael Jenkins, PhD., P.E., Coastal Engineering Team Leader Applied Technology & Management,
Preliminary Wake Wash Impact Analysis Redwood City Ferry Terminal, Redwood City, CA
 Technical Memorandum Preliminary Wake Wash Impact Analysis Redwood City Ferry Terminal, Redwood City, CA 1. Introduction The following preliminary wake wash impact analysis was initiated by the Port of
Long Beach Island Holgate Spit Little Egg Inlet Historical Evolution Introduction Longshore Transport Map, Survey and Photo Historic Sequence
 Appendix B Long Beach Island Holgate Spit Little Egg Inlet Historical Evolution Introduction The undeveloped southern end of Long Beach Island (LBI) is referred to as the Holgate spit as it adjoins the
EVALUATION OF BEACH EROSION UP-DRIFT OF TIDAL INLETS IN SOUTHWEST AND CENTRAL FLORIDA, USA. Mohamed A. Dabees 1 and Brett D.
 EVALUATION OF BEACH EROSION UP-DRIFT OF TIDAL INLETS IN SOUTHWEST AND CENTRAL FLORIDA, USA Mohamed A. Dabees 1 and Brett D. Moore 1 The paper discusses the analysis of up-drift beach erosion near selected
Technical Brief - Wave Uprush Analysis Island Harbour Club, Gananoque, Ontario
 Technical Brief - Wave Uprush Analysis RIGGS ENGINEERING LTD. 1240 Commissioners Road West Suite 205 London, Ontario N6K 1C7 October 31, 2014 Table of Contents Section Page Table of Contents... i List
DUXBURY WAVE MODELING STUDY
 DUXBURY WAVE MODELING STUDY 2008 Status Report Duncan M. FitzGerald Peter S. Rosen Boston University Northeaster University Boston, MA 02215 Boston, MA 02115 Submitted to: DUXBURY BEACH RESERVATION November
Sussex County, DE Preliminary Study Overview
 Sussex County, DE Preliminary Study Overview Coastal study scope: 102 miles of entire County shoreline Revised 102 panels for coastal study Riverine study scope: 14 streams, 67.1 miles, within the Nanticoke
APPENDIX D W-19 FLUVIAL AND TIDAL HYDRAULIC, SEDIMENTATION, WATER QUALITY AND SEA LEVEL RISE MODELING STUDIES
 APPENDIX D W-19 FLUVIAL AND TIDAL HYDRAULIC, SEDIMENTATION, WATER QUALITY AND SEA LEVEL RISE MODELING STUDIES Final EIR November 2018 Appendices Executive Summary Background: The San Dieguito Lagoon W19
ATLANTIC COAST OF LONG ISLAND, JONES INLET TO EAST ROCKAWAY INLET, LONG BEACH ISLAND, NY. Contract #2 Construction Scope. April 18th-19th 2018
 ATLANTIC COAST OF LONG ISLAND, JONES INLET TO EAST ROCKAWAY INLET, LONG BEACH ISLAND, NY Contract #2 Construction Scope April 18th-19th 2018 New York District PLAN COMPONENTS Length of Beachfill 35,000
A Modeling Study of Coastal Sediment Transport and Morphology Change
 A Modeling Study of Coastal Sediment Transport and Morphology Change Honghai Li 1, Alejandro Sanchez 1, Mitchell E. Brown 1, Irene M. Watts 2, Zeki Demirbilek 1, Julie D. Rosati 1, and David R. Michalsen
Feasibility Study for Restoration of Titlow Lagoon Fish Passage. South Puget Sound Salmon Enhancement Group
 Feasibility Study for Restoration of Titlow Lagoon Fish Passage South Puget Sound Salmon Enhancement Group January 2010 Feasibility Study for Restoration of Titlow Lagoon Fish Passage Prepared for South
Hydraulic Modeling Analysis
 Final Report Photograph: http://www.newington-dover.com Newington to Dover, New Hampshire Prepared for: Vanasse Hangen Brustlin, Inc. 6 Bedford Farms Drive, Suite 607 Bedford, New Hampshire 03110-6532
VENICE LOCAL COASTAL PROGRAM UPDATE: COASTAL HAZARDS WELCOME
 VENICE LOCAL COASTAL PROGRAM UPDATE: COASTAL HAZARDS WELCOME 1 Introducing the Team Hosted by the Department of City Planning and grant funded in part by the California Coastal Commission 2 Workshop Purpose
LITTLE LAGOON & LITTLE LAGOON PASS: RESEARCH UPDATES & DIRECTIONS
 LITTLE LAGOON & LITTLE LAGOON PASS: RESEARCH UPDATES & DIRECTIONS Bret M. Webb, PhD, PE, DCE Professor Department of Civil, Coastal, and Environmental Engineering October 19, 2017 LLPS Meeting Acknowledgments
WATERWAYS AND HARBORS DIVISION Proceedings of the American Society of Civil Engineers. EQUILIBRIUM FLOW AREAS OF INLETS ON SANDY COASTS a
 6405 February, 1969 WWl J oumal of the WATERWAYS AND HARBORS DIVISION Proceedings of the American Society of Civil Engineers EQUILIBRIUM FLOW AREAS OF INLETS ON SANDY COASTS a By Morrough P. O'Brien,!
# Post Consultation and Submissions Resource Consent Conditions for Surfing Impact Mitigation August 2016
 # Post Consultation and Submissions Resource Consent Conditions for Surfing Impact Mitigation August 2016 Surf Mitigation Management Plan 1 1 Not less than 6 months prior to the commencement of the construction
Plan B Dam Breach Assessment
 Plan B Dam Breach Assessment Introduction In support of the Local Sponsor permit applications to the states of Minnesota and North Dakota, a dam breach analysis for the Plan B alignment of the Fargo-Moorhead
Volume and Shoreline Changes along Pinellas County Beaches during Tropical Storm Debby
 Volume and Shoreline Changes along Pinellas County Beaches during Tropical Storm Debby Ping Wang and Tiffany M. Roberts Coastal Research Laboratory University of South Florida July 24, 2012 Introduction
TRANSPORT OF NEARSHORE DREDGE MATERIAL BERMS
 Proceedings of the 6 th International Conference on the Application of Physical Modelling in Coastal and Port Engineering and Science (Coastlab16) Ottawa, Canada, May 10-13, 2016 Copyright : Creative Commons
City of Del Mar Local Coastal Plan (LCP) Amendment for Sea Level Rise and Coastal Flooding
 Amendment for Sea Level Rise and Coastal Flooding") City of Del Mar Local Coastal Plan (LCP) Amendment for Sea Level Rise and Coastal Flooding 6/22/17 Presentation to Sea Level Rise Stakeholder- Technical Advisory Committee (STAC) Nick Garrity, P.E. Lindsey
City of Del Mar Local Coastal Plan (LCP) Amendment for Sea Level Rise and Coastal Flooding 6/22/17 Presentation to Sea Level Rise Stakeholder- Technical Advisory Committee (STAC) Nick Garrity, P.E. Lindsey
ABSTRACT. KEY WORDS: Navigation safety; numerical modeling; waves; current; sediment transport; channel infilling; morphology change.
 The 25th (2015) International Polar and Engineering Conference Li, H., L. Lin, Z. Demirbilek, T. M. Beck, and H. R. Moritz (2015). Wave-Current Conditions and Navigation Safety at an Inlet Entrance. The
Bay County, MI Coastal Hazard Analysis Flood Risk Review Meeting. May 14, 2018
 Bay County, MI Coastal Hazard Analysis Flood Risk Review Meeting May 14, 2018 Agenda Introductions Coastal Flood Risk Study and Mapping Program Current Status Technical Overview of Study and Mapping Floodplain
Wave energy converter effects on wave and sediment circulation
 Wave energy converter effects on wave and sediment circulation Grace Chang and Craig Jones Integral Consulting Inc. cjones@integral-corp.com; gchang@integral-corp.com Jesse Roberts, Kelley Ruehl, and Chris
Chapter 10 Lecture Outline. The Restless Oceans
 Chapter 10 Lecture Outline The Restless Oceans Focus Question 10.1 How does the Coriolis effect influence ocean currents? The Ocean s Surface Circulation Ocean currents Masses of water that flow from one
New Jersey Coastal Zone Overview. The New Jersey Beach Profile Network (NJBPN) 3 Dimensional Assessments. Quantifying Shoreline Migration
 3 Dimensional Assessments. Quantifying Shoreline Migration") New Jersey Coastal Zone Overview The New Jersey Beach Profile Network (NJBPN) Objectives Profile Locations Data Collection Analyzing NJBPN Data Examples 3 Dimensional Assessments Methodology Examples Quantifying
New Jersey Coastal Zone Overview The New Jersey Beach Profile Network (NJBPN) Objectives Profile Locations Data Collection Analyzing NJBPN Data Examples 3 Dimensional Assessments Methodology Examples Quantifying
APPENDIX D-2. Sea Level Rise Technical Memo
 APPENDIX D-2 Sea Level Rise Technical Memo 2185 N. California Blvd., Suite 500 Walnut Creek, CA 94596 (925) 944-5411 Fax: (925) 944-4732 www.moffattnichol.com DRAFT MEMORANDUM To: From: Neil Nichols,
USING A LABYRINTH WEIR TO INCREASE HYDRAULIC CAPACITY. Dustin Mortensen, P.E. 1 Jake Eckersley, P.E. 1
 USING A LABYRINTH WEIR TO INCREASE HYDRAULIC CAPACITY Dustin Mortensen, P.E. 1 Jake Eckersley, P.E. 1 Plum Creek Floodwater Retarding Structure No. 6 is located in an area of Kyle, Texas, that is currently
ARTIFICIAL REEF CONSTRUCTION: AN ENGINEERED APPROACH. Timothy K. Blankenship, P.E. R. Harvey Sasso, P.E.
 ARTIFICIAL REEF CONSTRUCTION: AN ENGINEERED APPROACH Timothy K. Blankenship, P.E. R. Harvey Sasso, P.E. Coastal Systems International, Inc. 464 South Dixie Highway Coral Gables, Florida 33146 Stephen Higgins
Marine Renewables Industry Association. Marine Renewables Industry: Requirements for Oceanographic Measurements, Data Processing and Modelling
 Marine Renewables Industry Association Marine Renewables Industry: Requirements for Oceanographic Measurements, Data Processing and Modelling October 2009 Table of Contents 1. Introduction... 1 2. Measurements
Delaware Chapter Surfrider Foundation - Indian River Inlet Monitoring
 Delaware Chapter Surfrider Foundation - Indian River Inlet Monitoring In 2012, the Delaware Surfrider Foundation Chapter formed the Surf Quality and Access Committee to focus on issues such as surf spot
Response of a Newly Created Marsh-Wetland Affected by Tidal Forcing, Upland Discharge, and Groundwater Interaction
 Response of a Newly Created Marsh-Wetland Affected by Tidal Forcing, Upland Discharge, and Groundwater Interaction Mouth of Columbia River, Cape Disappointment State Park, Washington 12 Hans R. Moritz
Wave Transformation, Prediction, and Analysis at Kaumalapau Harbor, Lanai, Hawaii
 Wave Transformation, Prediction, and Analysis at Kaumalapau Harbor, Lanai, Hawaii Jessica H. Podoski, P.E. Coastal Engineer, USACE Honolulu District Christopher Goody, P.E. Sea Engineering, Inc. Thomas
CHAPTER 281 INFLUENCE OF NEARSHORE HARDBOTTOM ON REGIONAL SEDIMENT TRANSPORT
 CHAPTER 281 INFLUENCE OF NEARSHORE HARDBOTTOM ON REGIONAL SEDIMENT TRANSPORT Paul C.-P. Lin, Ph.D., P.E. 1 and R. Harvey Sasso, P.E. 2 ABSTRACT The influence of nearshore hardbottom on longshore and cross-shore
FEMA Region V. Great Lakes Coastal Flood Study. Pilot Study Webinar. Berrien County, Michigan. February 26, 2014
 FEMA Region V Great Lakes Coastal Flood Study Pilot Study Webinar Berrien County, Michigan February 26, 2014 2 Pilot Study Webinar Agenda Great Lakes Coastal Flood Study Background Demonstration Project
TOWN OF DENNIS 10 YR COMPREHENSIVE DREDGE PERMIT SEPTEMBER 10, 2013
 TOWN OF DENNIS 10 YR COMPREHENSIVE DREDGE PERMIT SEPTEMBER 10, 2013 WHAT IS IT? ALL NECESSARY PERMITS FOR DREDGING FOR PORTIONS OF BASS RIVER, SWAN POND RIVER, SESUIT HARBOR AND CHASE GARDEN CREEK ONE
Impacts of breakwaters and training walls
 Across the eastern seaboard of Australia, breakwaters and training walls have instigated fundamental perturbations to coastal and estuary processes. This has induced long-term changes to foreshore alignments,
The Islands. Barbados. A prefeasibility study. R. Drieman M. Hinborch M. Monden E.A.J. Vendrik
 The Islands Barbados A prefeasibility study R. Drieman M. Hinborch M. Monden E.A.J. Vendrik General notice to the reader: In the academic programme for Hydraulic Engineering we have in the 4th year (i.e.