SURFLINE TEAHUPOO, TAHITI SURF REPORT
|
|
|
- Marybeth Jennings
- 6 years ago
- Views:
Transcription

1 SURFLINE TEAHUPOO, TAHITI SURF REPORT Historical Analysis of Swell Patterns in April & May, Prepared for Billabong ~ by Sean Collins, July 2009 Billabong has requested assistance to choose improved dates during the months of April and May for their ASP World Tour event at Teahupoo, Tahiti. The event traditionally has been scheduled for a 10 day waiting period in May, and was held during the May 9-20 th period in Unfortunately, in the last few years the event has struggled with less than optimum surf, which prompted Billabong to explore a possible better time period to run the event. In this analysis our goal will be to help choose an improved future 10 day swell window during the months of April and May. Historical swell patterns for the south shore of Tahiti were reviewed in this analysis. All significant swells for this area are generated by storms in the South Pacific, and surface pressure and swell analysis charts were reviewed during the April- May periods to study large scale high pressure and low pressure patterns. These pressure patterns control all storm development and possible swell generation for Teahupoo, Tahiti. Additionally, Surfline LOLA and Wavewatch III archived swell data between 1997 and 2009 was used to develop a statistical foundation for our expectations of future swell patterns. The exact swell model data point was located at South and West, approximately 10 nautical miles southwest of Teahupoo, Tahiti. The final conclusion of this report is that the best time period for significant swell for Teahupoo, Tahiti during the months of April and May, are during the last two weeks of April and the first week of May. WEATHER ANALYSIS OF SURFACE PRESSURE AND WAVE HEIGHT CHARTS April-May, The April to May period in the southern hemisphere tropics is Fall, when water and air temperatures are generally the warmest after the long Summer. Tropical cyclone activity has typically winded down somewhat but there is still the possibility of late season tropical activity. The jet streams near Antarctica and the Roaring 50 s latitude region begin to shift north in April and May, also bringing cooler air masses farther north to mix with warmer air closer to the tropics. The mixing of the cold air from Antarctica and the warmer tropical air create atmospheric instability and deepening low pressure systems between degrees South latitude. The developing low pressure systems in this region break the typical southern hemisphere west to east flow of winds and seas, to develop more south to north flow of winds and seas resulting in increased swell for Tahiti. The ideal swell window for Teahupoo, Tahiti is displayed in the chart on the right. This swell window is the region that extends from just east of New Zealand to directly south of Tahiti, between degrees West Longitude. As storms move underneath New Zealand, the storm fetch will extend northward throughout this region with strong winds and seas aimed at Tahiti. During April and May, a prevalent high pressure system is typically located over New Zealand and will extend eastward at variable times. Typically this high pressure system will help to generate strong winds on the back side of the storm with lots of swell.

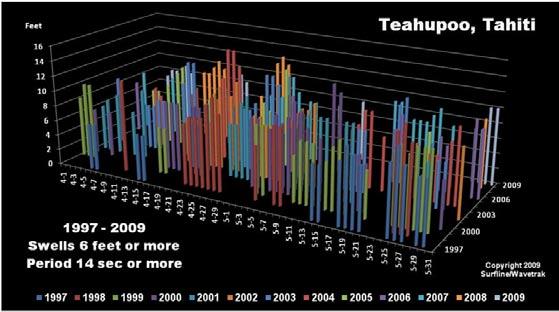
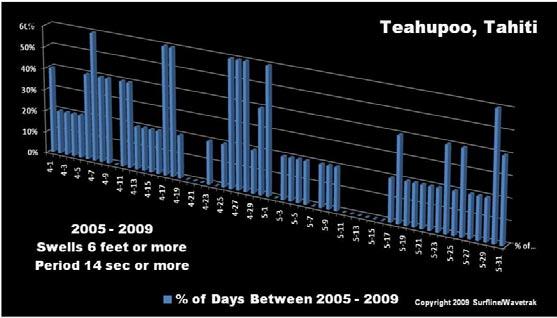
2 Strong high pressure systems follow storms around the globe and can occasionally lock themselves down in specific areas for a month or more. If one of these strong high pressure systems happens to lock down in the middle of the swell window for Tahiti as per the example in the chart at the right, it will block swell generation by forcing the storm tracks to stay far to the south in a west to east flow of winds and swell. This is exactly the poor swell situation that happened this year in 2009 when a strong high pressure system blocked the storm track during the waiting period of May 9-20 th. The primary goal in long range forecasting is to calculate where the high pressure systems will lock down because their location will also dictate the storm tracking patterns. The April and May period in the South Pacific is a transitional period when the jet streams, high pressure systems, and storm tracks will be adjusting from their Summer to Winter patterns. The high pressure location over New Zealand is fairly consistent during April and May, and the eastern boundary of that high pressure system will bulge eastward with the ebb and flow of the passing storms. Historically, April through May are good months for South Pacific swell activity due to the increased mixing of cold and warm air masses, and a receded ice pack off Antarctica also allows more swell generating fetch in the storms. After reviewing the charts archives for , there is a noticeable pattern of a sub-transitional period in May when the New Zealand high pressure will extend eastward as another high pressure system develops in the mid South Pacific. As this situation develops the Tahiti swell window may be temporarily blocked, and the time period might vary between a few days or a few weeks depending on the strength and location of the high pressure systems. It s really impossible with today s technology to accurately forecast a year in advance when the New Zealand high pressure system might extend eastward to block the storm track resulting in smaller swell for Tahiti. But we can identify general periods when the odds are more likely for this not to happen and where there would be more swell for Tahiti. The analysis of the historical charts indicate that mid April through June are the most consistent periods of swell for Tahiti, but very difficult to pin down the 1-2 week transitional period that seems to occur in May when the New Zealand high pressure system may extend out to block swell. ANALYSIS OF SWELL DATA FOR TEAHUPOO, TAHITI April-May, Wave data was retrieved for the swell model point located just southwest of Teahupoo, Tahiti. The first step was to eliminate all swell data that did not fall into the parameters to generate possible good swell for Teahupoo (North swells, East/southeast trade wind swell, etc.). The data studied for this project was: all swells 6 feet of deep water swell height or greater; AND only swells with periods of 12 seconds or greater; AND only swells with a specific directional range between south/southeast and southwest ( degrees True) at the swell model location. Using these parameters all potentially good April and May swell events for Teahupoo were isolated throughout the 1997 through 2009 period. The swell data was displayed in a series of graphs to allow easier analysis and presentation within this report, and additional filters were added to gain more resolution into the data. A shorter time period between 2005 and 2009 also displays a more near-term trend over the last 5 years versus the entire 13 year period to avoid long term skewed data. Swell heights were filtered from 6, 8, and 10 feet with 12 and 14 second periods to help isolate the larger swells. The source of swells for Tahiti is usually within 1,500 miles, so the second period filters are the most significant to review and would also contain the longer second period energy of the largest swells.

3 The graph to the right displays the overall swell trend for April and May throughout the entire period, and the number of days of deep water swell 6 feet or greater, 8 feet or greater, and 10 feet or greater - but only when the period is 12 seconds or greater and the swell within the directional parameters for Teahupoo. This data indicates very good years of swell during April and May for 1999 through 2004, and Generally poor years of swell during April and May were 1997, 1998, and 2005 through 2009 with the exception of When comparing these graphs of swell model data to the historical Weather Analysis covered in the previous section, the swell results in Tahiti are very clearly affected by the location of the high pressure system over New Zealand and whether it was blocking in the swell window or allowing the swell window to be open. Additionally, the swell model data seems to be validated by the history of swell for the Billabong Teahupoo event. Many of the following swell graphs were probably unnecessary to include for the scope of this report but are very interesting to review and many people may like to see them. These graphs below display two views of the data: the first view showing the actual maximum swell heights for each day during April and May, and the second view showing the overall percentage of the time throughout the period that a specific day was over 6 feet, 8 feet, or 10 feet. Additional filters for the 12 and 14 second swell periods show even more detail into the more significant swells. The graphs that strongly reflect the detail that helps to determine the best historical period of waves in the months of April and May, are the 8 foot swell charts. These swells are significant swell events and the filtered 12 and 14 second period charts add even more resolution. This view of the data between , and especially over the last five years between , strongly indicates that the best periods for significant swell for Teahupoo have been during the last two weeks in April and into the first week of May. An additional glaring result from the swell data shows how poor the current waiting period has been during for the Billabong Pro at Teahupoo, May 9-20 th. As discussed in the previous Weather Analysis section, the sub transitional period in May when the high pressure over New Zealand shifts into Tahiti s swell window, may occur more often during the second week in May as reflected by the data.

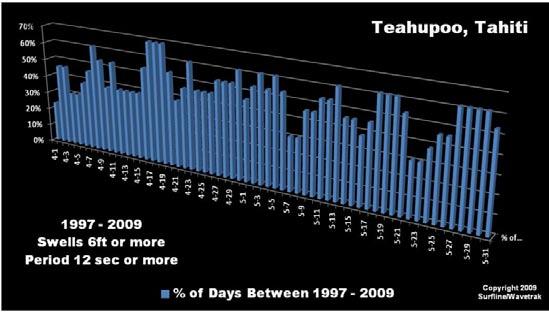

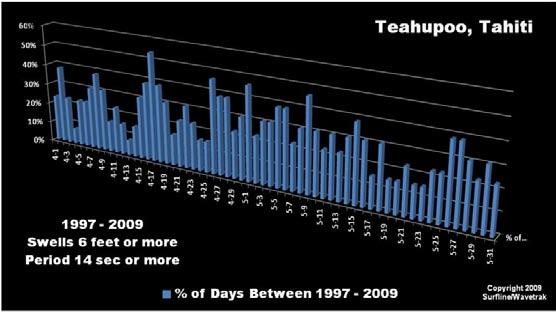
4 Following are additional graphs of the swell data that help to confirm the swell climate of Tahiti.
5


6 Additional data reviewed and compared for analysis in this report included local Tahiti moon phases, local tides, El Nino and La Nina oscillations, and even sunspot historical data, to explore what other variables might possibly exist that could have additional effects on the swell. At this time, none of these other factors showed significant possibilities to add valuable input for future long term forecasts. Although there did seem to be more consistent swell during the transition from New Moon to Full moon phases for some reason. Hmmmm I hope you enjoyed this report. I enjoyed doing the study and certainly keep learning more and more the deeper we get into the science and art of wave forecasting. Hope you score great surf! Sean Collins
The Setting - Climatology of the Hawaiian Archipelago. Link to Video of Maui Waves
 The Setting - Climatology of the Hawaiian Archipelago Link to Video of Maui Waves What caused this week s weather? What caused this weekend s weather? Today s Objective: Provide overview and description
Class Notes: Week 10. April 9 th,2019. Topics: Front and Mid-Latitude Wave Cyclones El Niño / La Niña Mid-term 2 review
 Class Notes: Week 10 April 9 th,2019 Topics: Front and Mid-Latitude Wave Cyclones El Niño / La Niña Mid-term 2 review Front- is a boundary between 2 different types of air masses Air masses with different
Historical Analysis of Montañita, Ecuador for April 6-14 and March 16-24
 Historical Analysis of Montañita, Ecuador for April 6-14 and March 16-24 Prepared for the ISA by Mark Willis and the Surfline Forecast and Science Teams Figure 1. Perfect Right- hander at Montañita, Ecuador
Recent Atmospheric and Oceanic Circulation Changes Affecting Winter Weather in North America. Dr. Art Douglas Professor Emeritus Creighton University
 Recent Atmospheric and Oceanic Circulation Changes Affecting Winter Weather in North America Dr. Art Douglas Professor Emeritus Creighton University Outline 1. The 2018 El Nino: A Northern Hemisphere induced
The General Circulation and El Niño. Dr. Christopher M. Godfrey University of North Carolina at Asheville
 The General Circulation and El Niño Dr. Christopher M. Godfrey University of North Carolina at Asheville Global Circulation Model Air flow broken up into 3 cells Easterlies in the tropics (trade winds)
REMINDERS: UPCOMING REVIEW SESSIONS: - Thursday, Feb 27, 6:30-8:00pm in HSS 1330
 REMINDERS: Midterm 2: Friday, February 28 - lecture material covering chapters 6, 7, and 15 (since first midterm and through Wed lecture) - same Format as first midterm UPCOMING REVIEW SESSIONS: - Thursday,
Lecture 13. Global Wind Patterns and the Oceans EOM
 Lecture 13. Global Wind Patterns and the Oceans EOM Global Wind Patterns and the Oceans Drag from wind exerts a force called wind stress on the ocean surface in the direction of the wind. The currents
Chapter 22, Section 1 - Ocean Currents. Section Objectives
 Chapter 22, Section 1 - Ocean Currents Section Objectives Intro Surface Currents Factors Affecting Ocean Currents Global Wind Belts (you should draw and label a diagram of the global wind belts) The Coriolis
Surfline s Long Beach Breakwater Surf Report
 Surfline s Long Beach Breakwater Surf Report Surf and Surfer Visit Analysis and Forecasts After Removal of Long Beach Breakwater By Sean Collins / Surfline June 23, 2009 This report has been requested
Lecture 13 El Niño/La Niña Ocean-Atmosphere Interaction. Idealized 3-Cell Model of Wind Patterns on a Rotating Earth. Previous Lecture!
 Lecture 13 El Niño/La Niña Ocean-Atmosphere Interaction Previous Lecture! Global Winds General Circulation of winds at the surface and aloft Polar Jet Stream Subtropical Jet Stream Monsoons 1 2 Radiation
Global Circulations. GEOG/ENST 2331 Lecture 15 Ahrens: Chapter 10
 Global Circulations GEOG/ENST 2331 Lecture 15 Ahrens: Chapter 10 Last lecture Microscale (turbulence) Mesoscale (land/sea breeze) Synoptic scale (monsoon) Global scale (3 cell circulation) Three Cell Model
Trade winds How do they affect the tropical oceans? 10/9/13. Take away concepts and ideas. El Niño - Southern Oscillation (ENSO)
") El Niño - Southern Oscillation (ENSO) Ocean-atmosphere interactions Take away concepts and ideas What is El Niño, La Niña? Trade wind and Walker circulation. What is the Southern Oscillation? Tropical
El Niño - Southern Oscillation (ENSO) Ocean-atmosphere interactions Take away concepts and ideas What is El Niño, La Niña? Trade wind and Walker circulation. What is the Southern Oscillation? Tropical
Appendix E Mangaone Stream at Ratanui Hydrological Gauging Station Influence of IPO on Stream Flow
 NZ Transport Agency Peka Peka to North Ōtaki Expressway Hydraulic Investigations for Expressway Crossing of Mangaone Stream and Floodplain Appendix E Mangaone Stream at Ratanui Hydrological Gauging Station
McKnight's Physical Geography 11e
 Chapter 2 Lecture McKnight's Physical Geography 11e Lectures Chapter 5 Atmospheric Pressure and Wind Michael Commons Ohio Northern University Atmospheric Pressure and Wind The Nature of Atmospheric Pressure
APPENDIX B NOAA DROUGHT ANALYSIS 29 OCTOBER 2007
 APPENDIX B NOAA DROUGHT ANALYSIS 29 OCTOBER 2007 ENSO Cycle: Recent Evolution, Current Status and Predictions Update prepared by Climate Prediction Center / NCEP October 29, 2007 Outline Overview Recent
El Niño / Southern Oscillation (ENSO) and inter-annual climate variability
 and inter-annual climate variability") El Niño / Southern Oscillation (ENSO) and inter-annual climate variability seasonal cycle what is normal? monthly average conditions through a calendar year sea level pressure and surface winds surface
El Niño / Southern Oscillation (ENSO) and inter-annual climate variability seasonal cycle what is normal? monthly average conditions through a calendar year sea level pressure and surface winds surface
Pacific Climate Variability
 Pacific Climate Variability Pacific Islands Climate Education Partnership You may have heard the term climate variability. What does the term climate variability mean? What are the causes and effects of
ENSO Cycle: Recent Evolution, Current Status and Predictions. Update prepared by Climate Prediction Center / NCEP 8 March 2010
 ENSO Cycle: Recent Evolution, Current Status and Predictions Update prepared by Climate Prediction Center / NCEP 8 March 2010 Outline Overview Recent Evolution and Current Conditions Oceanic Niño Index
8 th Grade Science Meteorology Review
 8 th Grade Science Meteorology Review #1 Where does Earth get the energy that produces global weather patterns? A: The sun B: Humidity C: Air masses D: Cyclones A. The Sun #2 Do all of the areas on Earth
Tropical Pacific Ocean remains on track for El Niño in 2014
 1 of 10 3/06/2014 3:33 PM ENSO Wrap-Up Current state of the Pacific and Indian Ocean Tropical Pacific Ocean remains on track for El Niño in 2014 Issued on Tuesday 3 June 2014 Product Code IDCKGEWWOO The
Current: large mass of continuously moving ocean water
 Ocean Currents Current: large mass of continuously moving ocean water Surface Currents--Wind Circulation These waters make up about 10% of all the water in the ocean. These waters are the upper 400 meters
9/25/2014. Scales of Atmospheric Motion. Scales of Atmospheric Motion. Chapter 7: Circulation of the Atmosphere
 Chapter 7: Circulation of the Atmosphere The Atmosphere: An Introduction to Meteorology, 12 th Lutgens Tarbuck Lectures by: Heather Gallacher, Cleveland State University Scales of Atmospheric Motion Small-
Fluid Circulation (Student Mastery Objectives) -The most frequent type of heat transfer of energy in the atmosphere is convection.
 -The most frequent type of heat transfer of energy in the atmosphere is convection.") Fluid Circulation (Student Mastery Objectives) -The most frequent type of heat transfer of energy in the atmosphere is convection. -Differences in density affect the circulation of fluids. Cold air is
Fluid Circulation (Student Mastery Objectives) -The most frequent type of heat transfer of energy in the atmosphere is convection. -Differences in density affect the circulation of fluids. Cold air is
OCN 201 Lab Fall 2009 OCN 201. Lab 9 - El Niño
 OCN 201 Lab Fall 2009 OCN 201 Lab 9 - El Niño El Niño is probably one of the most widely publicized oceanic phenomena. If there s one single reason for that it s probably the fact that El Niño s presence
OCEANS. Main Ideas. Lesson 2: Ocean Currents Ocean Currents help distribute heat around Earth.
 Oceans Chapter 10 OCEANS Main Ideas Lesson 2: Ocean Currents Ocean Currents help distribute heat around Earth. Lesson 3: The Ocean Shore The shore is shaped by the movement of water and sand. OCEANS SO
Equatorial upwelling. Example of regional winds of small scale
 Example of regional winds of small scale Sea and land breezes Note on Fig. 8.11. Shows the case for southern hemisphere! Coastal upwelling and downwelling. Upwelling is caused by along shore winds, that
GEOS 201 Lab 13 Climate of Change InTeGrate Module Case studies 2.2 & 3.1
 Discerning Patterns: Does the North Atlantic oscillate? Climate variability, or short term climate change, can wreak havoc around the world. Dramatic year to year shifts in weather can have unanticipated
Level 3 Earth and Space Science, 2018
 91413 914130 3SUPERVISOR S Level 3 Earth and Space Science, 2018 91413 Demonstrate understanding of processes in the ocean system 2.00 p.m. Thursday 22 November 2018 Credits: Four Achievement Achievement
ATS150: Global Climate Change. Oceans and Climate. Icebergs. Scott Denning CSU 1
 The Oceans Wind-Driven Gyre Circulations Icebergs Scott Denning CSU 1 Surface Balance of Forces friction coriolis wind stress resultant current Wind stress accelerates surface water Friction couples surface
3.1 (Read section 3.1), starts p.80
, starts p.80") 3.1 (Read section 3.1), starts p.80 Write down these definitions in your notes as you find them when you read: 1. 2. 3. 4. Climate Convection specific heat capacity weather Then turn to p 87 READING CHECK
3.1 (Read section 3.1), starts p.80 Write down these definitions in your notes as you find them when you read: 1. 2. 3. 4. Climate Convection specific heat capacity weather Then turn to p 87 READING CHECK
Currents. History. Pressure Cells 3/13/17. El Nino Southern Oscillation ENSO. Teleconnections and Oscillations. Neutral Conditions
 Teleconnections and Oscillations Teleconnection climate anomalies being related to each other over a large scale Oscillations: Macroscale movement of atmospheric systems that can influence weather, climate,
Atomspheric Waves at the 500hPa Level
 Atomspheric Waves at the 5hPa Level Justin Deal, Eswar Iyer, and Bryce Link ABSTRACT Our study observes and examines large scale motions of the atmosphere. More specifically it examines wave motions at
Ocean Currents that Redistribute Heat Globally
 Ocean Currents that Redistribute Heat Globally Ocean Circulation Ocean Currents Fig. CO7 OCEAN CURRENTS Surface ocean currents are similar to wind patterns: 1. Driven by Coriolis forces 2. Driven by winds
APPENDIX G WEATHER DATA SELECTED EXTRACTS FROM ENVIRONMENTAL DATA FOR BCFS VESSEL REPLACEMENT PROGRAM DRAFT REPORT
 APPENDIX G WEATHER DATA SELECTED EXTRACTS FROM ENVIRONMENTAL DATA FOR BCFS VESSEL REPLACEMENT PROGRAM DRAFT REPORT Prepared for: B.C. Ferries Services Inc. Prepared by: George Roddan, P.Eng. Roddan Engineering
Ocean Inter-annual Variability: El Niño and La Niña. How does El Niño influence the oceans and climate patterns?
 Name: Date: Guiding Question: Ocean Inter-annual Variability: El Niño and La Niña How does El Niño influence the oceans and climate patterns? Introduction What is El Niño/La Niña? The El Niño/La Niña cycle
ENSO Wrap-Up. Current state of the Pacific and Indian Ocean
 18-11-2014 ENSO Wrap-Up Current state of the Pacific and Indian Ocean Tropical Pacific Ocean moves closer to El Niño The Pacific Ocean has shown some renewed signs of El Niño development in recent weeks.
ORESU-G ORESU-G
 ORESU-G-97-008 ORESU-G 97-008 The Pacific Northwest: a Region of Transitions The unusual oceanic and atmospheric conditions of the Pacific Northwest create a remarkable and dynamic setting unlike any other
Variability in the tropical oceans - Monitoring and prediction of El Niño and La Niña -
 Variability in the tropical oceans - Monitoring and prediction of El Niño and La Niña - Jun ichi HIROSAWA Climate Prediction Division Japan Meteorological Agency SST anomaly in Nov. 1997 1 ( ) Outline
ESCI 485 Air/sea Interaction Lesson 9 Equatorial Adjustment and El Nino Dr. DeCaria
 ESCI 485 Air/sea Interaction Lesson 9 Equatorial Adjustment and El Nino Dr. DeCaria Reference: El Nino, La Nina, and the Southern Oscillation, Philander THE TWO-LAYER SHALLOW WATER MODEL The ocean can
Name Date L.O: SWBAT explain what breezes, planetary winds, ocean currents & monsoons are.
 Name Date L.O: SWBAT explain what breezes, planetary winds, ocean currents & monsoons are. 1. A cool breeze is blowing toward the land from the ocean on a warm, cloudless summer day. This condition is
Module 3, Investigation 1: Briefing 1 What are the effects of ENSO?
 Background The changing temperatures of the tropical Pacific Ocean affect climate variability all over Earth. Ocean warming and cooling dramatically affect human activities by changing weather patterns
Unit 11 Lesson 2 How Does Ocean Water Move? Copyright Houghton Mifflin Harcourt Publishing Company
 Unit 11 Lesson 2 How Does Ocean Water Move? Catch a Wave A wave is the up-and-down movement of surface water. Catch a Wave Catch a Wave (wave effects) Surface waves are caused by wind pushing against
Lecture 13 March 24, 2010, Wednesday. Atmospheric Pressure & Wind: Part 4
 Lecture 13 March 24, 2010, Wednesday Atmospheric Pressure & Wind: Part 4 Synoptic scale winds Mesoscale winds Microscale winds Air-sea interactions The largest synoptic scale wind. Monsoon: Arabic for
 1 2 http://ds.data.jma.go.jp/tcc/tcc/index.html http://ds.data.jma.go.jp/tcc/tcc/index.html Climate in Japan World Climate Extratropics Tropics Oceanograhpic conditions World Climate Page 2 Extratropics
The Child. Mean Annual SST Cycle 11/19/12
 Introduction to Climatology GEOGRAPHY 300 El Niño-Southern Oscillation Tom Giambelluca University of Hawai i at Mānoa and Pacific Decadal Oscillation ENSO: El Niño-Southern Oscillation PDO: Pacific Decadal
Climate briefing. Wellington region, February Alex Pezza and Mike Thompson Environmental Science Department
 Climate briefing Wellington region, February 2016 Alex Pezza and Mike Thompson Environmental Science Department For more information, contact the Greater Wellington Regional Council: Wellington PO Box
ENSO Cycle: Recent Evolution, Current Status and Predictions. Update prepared by Climate Prediction Center / NCEP 4 September 2012
 ENSO Cycle: Recent Evolution, Current Status and Predictions Update prepared by Climate Prediction Center / NCEP 4 September 2012 Outline Overview Recent Evolution and Current Conditions Oceanic Niño Index
Atmospheric Circulation. Recall Vertical Circulation
 Today s topics: Atmospheric circulation: generation of wind patterns on a rotating Earth Seasonal patterns of climate: Monsoons and El Niño Tropical Cyclones: Hurricanes and typhoons Atmospheric Circulation
El Niño Unit (2.5 pts)
") T. James Noyes, El Camino College El Niño Unit (Topic 9B) page 1 Name: Section: El Niño Unit (2.5 pts) El Niño is a warm ocean current that flows along the Equator and towards the west coast of South America
T. James Noyes, El Camino College El Niño Unit (Topic 9B) page 1 Name: Section: El Niño Unit (2.5 pts) El Niño is a warm ocean current that flows along the Equator and towards the west coast of South America
The Movement of Ocean Water. Currents
 The Movement of Ocean Water Currents Ocean Current movement of ocean water that follows a regular pattern influenced by: weather Earth s rotation position of continents Surface current horizontal movement
Applied Earth Science Climate Exam Practice Questions Page 1
 Name: 1. Which combination of climate factors generally results in the coldest temperatures? A) low elevation and low latitude B) low elevation and high latitude C) high elevation and low latitude D) high
El Niño Lecture Notes
 El Niño Lecture Notes There is a huge link between the atmosphere & ocean. The oceans influence the atmosphere to affect climate, but the atmosphere also influences the ocean, which can also affect climate.
Quiz name: Oceanography - Land and Sea Interaction - Quiz #2
 Name: Quiz name: Oceanography - Land and Sea Interaction - Quiz #2 ate: 1. What is the direction of spin for gyres in the northern hemisphere? clockwise counter clockwise northern oscillation southern
Weather drivers in South Australia
 August 2008 Key facts Weather drivers in South Australia Major weather drivers in South Australia are: El Niño - Southern Oscillation frontal systems cut-off lows blocking highs Indian Ocean Dipole cloudbands
Atmosphere & Weather. Earth Science
 Atmosphere & Weather Earth Science Energy Transfer in the Atmosphere Earth s energy is provided by the SUN! Energy is important to us because it 1. Drives winds and ocean currents. 2. Allows plants to
ENSO Jigsaw [Key Science Knowledge Module]
![ENSO Jigsaw [Key Science Knowledge Module]](/thumbs/83/88958439.jpg "ENSO Jigsaw [Key Science Knowledge Module]") ` 3 Teacher Edition 2-3 days ENSO Jigsaw [Key Science Knowledge Module] Activity Overview This module is the most important learning module in terms of the physical science aspects associated with the
` 3 Teacher Edition 2-3 days ENSO Jigsaw [Key Science Knowledge Module] Activity Overview This module is the most important learning module in terms of the physical science aspects associated with the
Introduction to Oceanography OCE 1001
 Introduction to Oceanography OCE 1001 Lecture Notes Chantale Bégin & Jessica Fry Version 2.1 10. Ocean Circulation (Trujillo, Chapter 7) Major ocean currents are stable and predictable; they have been
Notepack 41. Aim: What factors determine the climate of a certain area? Do Now: What is the difference between weather and climate?
 Notepack 41 Aim: What factors determine the climate of a certain area? Do Now: What is the difference between weather and climate? WEATHER VS. CLIMATE Weather atmospheric conditions at a certain location
Ocean Currents Unit (4 pts)
") Name: Section: Ocean Currents Unit (Topic 9A-1) page 1 Ocean Currents Unit (4 pts) Ocean Currents An ocean current is like a river in the ocean: water is flowing traveling from place to place. Historically,
Name: Section: Ocean Currents Unit (Topic 9A-1) page 1 Ocean Currents Unit (4 pts) Ocean Currents An ocean current is like a river in the ocean: water is flowing traveling from place to place. Historically,
Your web browser (Safari 7) is out of date. For more security, comfort and the best experience on this site: Update your browser Ignore
 is out of date. For more security, comfort and the best experience on this site: Update your browser Ignore") Your web browser (Safari 7) is out of date. For more security, comfort and the best experience on this site: Update your browser Ignore L A NIÑA El Niño-Southern Oscillation (ENSO) For the complete encyclopedic
Your web browser (Safari 7) is out of date. For more security, comfort and the best experience on this site: Update your browser Ignore L A NIÑA El Niño-Southern Oscillation (ENSO) For the complete encyclopedic
2015 Evelyn Browning Garriss. El Niño, the Twisted Atlantic and the Effect on Global Agriculture
 2015 Evelyn Browning Garriss El Niño, the Twisted Atlantic and the Effect on Global Agriculture Conclusions Climate change is not linear. It ebbs and flows. Recent polar volcano eruptions created a cool
Atmospheric Waves James Cayer, Wesley Rondinelli, Kayla Schuster. Abstract
 Atmospheric Waves James Cayer, Wesley Rondinelli, Kayla Schuster Abstract It is important for meteorologists to have an understanding of the synoptic scale waves that propagate thorough the atmosphere
General Introduction to Climate Drivers and BoM Climate Services Products
 General Introduction to Climate Drivers and BoM Climate Services Products Climate Information Services Australian Bureau of Meteorology Yuriy Kuleshov El Niño Southern Oscillation (ENSO) El Niño Southern
Air Pressure and Wind
 Air Pressure and Wind 19.1 Understanding Air Pressure Air Pressure Defined Air pressure is the pressure exerted by the weight of air. Air pressure is exerted in all directions down, up, and sideways. The
ENSO: El Niño Southern Oscillation
 ENSO: El Niño Southern Oscillation La Niña the little girl El Niño the little boy, the child LO: explain a complete ENSO cycle and assess the net affects on fish recruitment John K. Horne University of
Directed Reading. Section: Ocean Currents. a(n). FACTORS THAT AFFECT SURFACE CURRENTS
. FACTORS THAT AFFECT SURFACE CURRENTS") Skills Worksheet Directed Reading Section: Ocean Currents 1. A horizontal movement of water in a well-defined pattern is called a(n). 2. What are two ways that oceanographers identify ocean currents? 3.
Skills Worksheet Directed Reading Section: Ocean Currents 1. A horizontal movement of water in a well-defined pattern is called a(n). 2. What are two ways that oceanographers identify ocean currents? 3.
Assessment Schedule 2016 Earth and Space Science: Demonstrate understanding of processes in the ocean system (91413)
") NCEA Level 3 Earth & Space Science (91413) 2016 page 1 of 6 Assessment Schedule 2016 Earth and Space Science: Demonstrate processes in the ocean system (91413) Evidence Statement Q Evidence with with Excellence
NCEA Level 3 Earth & Space Science (91413) 2016 page 1 of 6 Assessment Schedule 2016 Earth and Space Science: Demonstrate processes in the ocean system (91413) Evidence Statement Q Evidence with with Excellence
Chapter: Atmosphere Section 3: Air Movement
 Table of Contents Chapter: Atmosphere Section 3: Air Movement We will learn about Air Movement=Wind -Why different latitudes on Earth will receive different amounts of Solar Energy -The Coriolis Effect
5. El Niño Southern Oscillation
 5. El Niño Southern Oscillation Copyright 2006 Emily Shuckburgh, University of Cambridge. Not to be quoted or reproduced without permission. EFS 5/1 Ocean-Atmosphere Coupling Tropical atmosphere/ocean,
- terminology. Further Reading: Chapter 07 of the text book. Outline. - characteristics of ENSO. -impacts
 (1 of 14) Further Reading: Chapter 07 of the text book Outline - terminology - characteristics of ENSO -impacts (2 of 14) Today: Introduction We want to look at another source of variability in the atmosphere
3. Climatic Variability. El Niño and the Southern Oscillation Madden-Julian Oscillation Equatorial waves
 Georges (1998) 3. Climatic Variability El Niño and the Southern Oscillation Madden-Julian Oscillation Equatorial waves ENVIRONMENTAL CONDITIONS FOR TROPICAL CYCLONES TO FORM AND GROW Ocean surface waters
Summary of Lecture 10, 04 March 2008 Introduce the Hadley circulation and examine global weather patterns. Discuss jet stream dynamics jet streams
 Summary of Lecture 10, 04 March 2008 Introduce the Hadley circulation and examine global weather patterns. Discuss jet stream dynamics jet streams arise because the Coriolis force prevents Hadley-type
Chapter. Air Pressure and Wind
 Chapter Air Pressure and Wind 19.1 Understanding Air Pressure Air Pressure Defined Air pressure is the pressure exerted by the weight of air. 19.1 Understanding Air Pressure Air Pressure Defined Air pressure
CHAPTER 7 Ocean Circulation
 1 2 3 4 5 6 7 8 9 10 11 12 13 14 CHAPTER 7 Ocean Circulation Words Ocean currents Moving seawater Surface ocean currents Transfer heat from warmer to cooler areas Similar to pattern of major wind belts
El Nino and Global Warming
 El Nino and Global Warming El Niño and Global Warming El Niño Climate Trade winds Barometric pressure Southern oscillation WHAT YOU WILL LEARN 1. You will identify the cause of El Niño events. 2. You will
Lecture Outlines PowerPoint. Chapter 15 Earth Science, 12e Tarbuck/Lutgens
 Lecture Outlines PowerPoint Chapter 15 Earth Science, 12e Tarbuck/Lutgens 2009 Pearson Prentice Hall This work is protected by United States copyright laws and is provided solely for the use of instructors
Tracking of Large-Scale Wave Motions
 Tracking of Large-Scale Wave Motions Nikki Barbee, Adam Cale, Justin Wittrock Dr. William Gutowski Meteorology 44 Fall 29 This semester we have observed large scale wave patterns in both the Northern and
Earth s oceans covers 71 % _ of the planet s surface. In reality, Earth s ocean waters are all. interconnected as part of a single large global ocean.
 Ocean Motion Met 101: Introduction to the World's Oceans Produced by The COMET Program Geography: Name Pd. Earth s oceans covers 71 % _ of the planet s surface. In reality, Earth s ocean waters are all
Weather drivers in Victoria
 August 2008 Weather drivers in Victoria Key facts Major weather drivers in Victoria are: El Niño - Southern Oscillation frontal systems cut-off lows blocking highs Southern Annular Mode cloudbands Figure
ESS15 Lecture 12. Review, tropical oceans & El Nino, and the thermohaline ocean circulation. Please see new reading material on website.
 ESS15 Lecture 12 Review, tropical oceans & El Nino, and the thermohaline ocean circulation. Please see new reading material on website. Review. I-clicker exercise: In this graph of Earth s energy imbalances
Chapter 9: Circulation of the Ocean
 Chapter 9: Circulation of the Ocean Tropical gardens on Britain s Scilly Isles. Only 48 kilometers (30 miles) off the coast of Cornwall at 50 N, these scenic islands lie in the path of the warm waters
Chapter 10: Global Wind Systems
 Chapter 10: Global Wind Systems Three-cell model of atmospheric circulation Intertropical Convergence Zone (ITCZ) Typical surface wind patterns Upper-level pressure and winds Climatological sea-level pressure
(20 points) 1. ENSO is a coupled climate phenomenon in the tropical Pacific that has both regional and global impacts.
 1. ENSO is a coupled climate phenomenon in the tropical Pacific that has both regional and global impacts.") SIO 210 Problem Set 4 Answer key December 1, 2014 Due Dec. 12, 2014 (20 points) 1. ENSO is a coupled climate phenomenon in the tropical Pacific that has both regional and global impacts. (2 points) a)
SIO 210 Problem Set 4 Answer key December 1, 2014 Due Dec. 12, 2014 (20 points) 1. ENSO is a coupled climate phenomenon in the tropical Pacific that has both regional and global impacts. (2 points) a)
Oceanography 10. Tides Study Guide (7A)
") Tides Study Guide (Topic 7A) page 1 Oceanography 10 Name: Tides Study Guide (7A) Note: Do not forget to include the units of your answers. 1. Use the tide chart below to determine the height and time of
Tides Study Guide (Topic 7A) page 1 Oceanography 10 Name: Tides Study Guide (7A) Note: Do not forget to include the units of your answers. 1. Use the tide chart below to determine the height and time of
New Normal and La Niñas: Dealing with Natural Climate Now and in the Future James Jackson Garriss /Browning Media
 New Normal and La Niñas: Dealing with Natural Climate Now and in the Future 2018 James Jackson Garriss /Browning Media Conclusions Climate change is not linear. It ebbs and flows. Long term climate conditions
March 4 th, 2019 Sample Current Affairs
 March 4 th, 2019 Sample Current Affairs 1. A weak El Niño is developing in the equatorial Pacific Ocean, which is expected to continue for a few months at least. What is El Nino? What causes El Nino? What
Becky Bolinger NIDIS IMW Drought Early Warning System Webinar November 21, 2017
 NIDIS Intermountain West Dec-Feb Winter Outlook Becky Bolinger NIDIS IMW Drought Early Warning System Webinar November 21, 2017 COLORADO CLIMATE CENTER La Niña Advisory And associated impacts from La Niña
Atmospheric Circulation. Recall Vertical Circulation
 Today s topics: Atmospheric circulation: generation of wind patterns on a rotating Earth Seasonal patterns of climate: Monsoons and Sea Breezes Tropical Cyclones: Hurricanes and typhoons Atmospheric Circulation
GROWING SEASON TEMPERATURES
 Ag-Weather Update: Review of Summer Growing Season & Update on the Wet Forecast for Fall & Winter Paul W. Brown Extension Specialist, Biometeorology College of Agriculture & Life Sciences University of
Chart Discussion: Fri-25-May-2018 Rainfall Last Week
 Chart Discussion: Fri-25-May-2018 Rainfall Last Week 1 Last Week s Charts 2 MSL Analysis / Sat Image (Thu) 3 MSL Analysis / Sat Image (Fri) 4 Last Week s Model Forecasts OBSERVED Chart Discussion: Fri-25-May-2018
Canada s vast size creates a diverse range of weather conditions and climatic conditions. Warming trend for last 10 years Wet Spring Dry five summers
 Chapter 4 Weather and Climate Canada s vast size creates a diverse range of weather conditions and climatic conditions. Weather examples: Rainy today Snow tomorrow Fog on Wednesday 23 degree C today High
Section 3: Atmospheric Circulation
 Section 3: Atmospheric Circulation Preview Key Ideas The Coriolis Effect Global Winds Local Winds Maps in Action Key Ideas Explain the Coriolis effect. Describe the global patterns of air circulation,
EARTH, PLANETARY, & SPACE SCIENCES 15 INTRODUCTION TO OCEANOGRAPHY. LABORATORY SESSION #6 Fall Ocean Circulation
 EARTH, PLANETARY, & SPACE SCIENCES 15 INTRODUCTION TO OCEANOGRAPHY LABORATORY SESSION #6 Fall 2017 Ocean Circulation The focus of the Lab this week is circulation of the ocean and atmosphere. Here, you
Lecture 18: El Niño. Atmosphere, Ocean, Climate Dynamics EESS 146B/246B
 Lecture 18: El Niño Atmosphere, Ocean, Climate Dynamics EESS 146B/246B El Niño Transient equatorial motions: Kelvin and Rossby waves. Positive feedback mechanism associated with air-sea coupling. Atmospheric
Pohnpei surf club. Pohnpei, FSM
 Pohnpei surf club Pohnpei, FSM 691.320.7845 P-Pass It s a perfect right hander. P-Pass is a short for Palikir Pass. Palikir is the name of the area in which this wave is located, a district of Pohnpei.
Chapter 7: Circulation And The Atmosphere
 Chapter 7: Circulation And The Atmosphere Highly integrated wind system Main Circulation Currents: series of deep rivers of air encircling the planet Various perturbations or vortices (hurricanes, tornados,
Climate Variability OCEA 101
 Climate Variability OCEA 101 Why should you care? - the associated atmospheric and oceanic changes accompanying climate variability yield significant changes in the distribution of nutrients and marine
Forecasting of Lower Colorado River Basin Streamflow using Pacific Ocean Sea Surface Temperatures and ENSO
 Forecasting of Lower Colorado River Basin Streamflow using Pacific Ocean Sea Surface Temperatures and ENSO Glenn A. Tootle 1 and Thomas C. Piechota 2 1 Dept. of Civil and Environmental Engineering, University
3/22/11. General Circulation of the Atmosphere. General Circulation of the Atmosphere
 Chapter 10 General refers to the average air flow, actual winds will vary considerably. Average conditions help identify driving forces. The basic cause of the general circulation is unequal heating of
Denise L Seman City of Youngstown
 Denise L Seman City of Youngstown The control chart is one of the most important tools of quality control for laboratory data. A control chart is a specific kind of run chart that allows unusual change