SHORELINE ASSESSMENT OF JEFFERSON COUNTY, TEXAS. A Thesis HOO IL LEE
|
|
|
- Hester Charles
- 6 years ago
- Views:
Transcription
1 SHORELINE ASSESSMENT OF JEFFERSON COUNTY, TEXAS A Thesis by HOO IL LEE Submitted to the Office of Graduate Studies of Texas A&M University in partial fulfillment of the requirements for the degree of MASTER OF SCIENCE August Major Subject: Ocean Engineering
2 SHORELINE ASSESSMENT OF JEFFERSON COUNTY, TEXAS A Thesis by HOO IL LEE Submitted to Texas A&M University in partial fulfillment of the requirements for the degree of MASTER OF SCIENCE Approved as to style and content by: Billy L. Edge (Chair of Committee) Robert E. Randall (Member) Achim Stoessel (Member) Paul N. Roschke (Head of Department) August Major Subject: Ocean Engineering
3 iii ABSTRACT Shoreline Assessment of Jefferson County, Texas. (August ) Hoo Il Lee, B.S., Hongik University, Korea Chair of Committee: Dr. Billy L. Edge Shoreline erosion is an issue of economic and environmental concern on the Texas coast. Texas State Highway 87, located in Jefferson County, Texas, has been repeatedly destroyed by storms and rebuilt in the past 5 years. Reconstruction of State Highway 87 cannot be successfully achieved without an exact assessment of shoreline erosion. This report describes a shoreline assessment to obtain a comprehensive data set that will be used to define the coastal erosion problem and assist in the reconstruction of the roadway. Eight field surveys were conducted that included offshore survey and beach survey (beach profiles). The offshore system utilizes a Real-Time Kinematic Differential Global Positioning System (RTK-DGPS) mounted on a personal watercraft and integrated with a survey quality echo sounder. The beach survey utilizes RTK-DGPS equipment carried by the surveyor in a backpack. The system is an accurate, mobile and efficient method to obtain beach profiles. The two surveys (beach and offshore surveys) are combined to provide a complete beach profile. Data gathered from beach profile surveys enabled the calculation of sediment erosion or accretion rate and direction.
4 iv ACKNOWLEDGEMENTS I would like to express my sincere gratitude to Dr. Billy Edge for his tireless efforts in the field, guidance, assistance and generosity during my studies at Texas A&M University. I also would like to thank Dr. Robert Randall and Dr. Achim Stoessel for serving on my thesis committee. I am thankful to Joshua Toepfer, Kwanghyo Jung and Younghyun Park for their help and friendship in the field. Finally, I want to thank, with the heart of Jesus, my parents, my wife Mijung Chon and my lovely daughter Hannah Lee for their love, patience, and sacrifice.
5 v TABLE OF CONTENTS Page ABSTRACT...iii ACKNOWLEDGEMENTS...iv TABLE OF CONTENTS.... v LIST OF FIGURES......vii LIST OF TABLES... viii CHAPTER I INTRODUCTION Background.. Objectives... II PREVIOUS WORK IN JEFFERSON COUNTY.. III COLLECTING DATA Method...6. Benchmarks 7. Beach and offshore profile surveys Sand samples.... IV ANALYSIS Waves Storm surge Sediment erosion estimate Equilibrium profiles..9 V CONCLUSIONS AND RECOMMENDATION.. REFERENCES APPENDIX A 5 APPENDIX B...6 APPENDIX C 89
6 VITA.. 97 vi
7 vii LIST OF FIGURES FIGURE Page. Survey area - Highway 87 in the Jefferson County (Wamsley, 999).... Survey system (Wamsley, 999) Sorted RSA results from east to west (Howard, 999).. 4. Three types of breaking waves ( 5. Illustration of storm surge (NOAA web site) Historic tide data of Sabine Pass north Comparison of three profiles at line Near CATT where road is destroyed, picture taken October 5, Line onshore data Near VASTAR where the beach no longer exists, picture taken May 4, 4. Line 4 onshore data Near CLAM where the beach is wide, picture taken May 4, Line 44 onshore data Change in shoreline comparing the Fall99 and Fall Graph of the erosion rate based on the distance of the MSL Equilibrium beach profile at line
8 viii LIST OF TABLES TABLE Page. Net shoreline change between Sabine Pass and Bolivar Roads, (Morton, 997)...5. Base point coordinates (WGS-84)...8. Comparison of d5 grain size of two different sample periods List of wave heights above meters (All data taken from NOAA database) Hurricanes impacting SH87 between 886 and % confidence interval (lower bound (m) upper bound (m)) Percent chance of storm event occurrence.. 8. Summary of extreme storm event analysis Comparison of net shoreline changes Summary of recommended A value (Units of A parameter are m / ) -Dean () Comparison of d5 grain size and A values of two different samples collection.....
9 CHAPTER I INTRODUCTION.. Background Texas State Highway 87 is located on the most northeast corner of the Texas Coast, connecting the southern tip of Bolivar Peninsula to Sabine Pass. A survey area is shown in figure. In the 9 s SH87 received its first layer of asphalt concrete (Howard 999). This section of SH87 lays on a very unstable stretch of beach that has historically eroded at a rate of to meters a year. According to Howard (999) the road has been destroyed and rebuilt seven times over the last 5 or years. So the original section of paved road now lies around 5 meters offshore. In 989, SH87 was closed because Tropical Storm Chantal and Hurricane Jerry touched down and SH87 between Texas Highway 4 and Clam Lake road was washed away at that time. Texas A&M University is assisting Jefferson County by conducting a shorelinemonitoring program, starting in the summer of 999 continuing into the fall of. In order to get a practical engineering solution to the SH87 erosion problem, a comprehensive baseline data set was collected and analyzed. The data set obtained from these surveys will be the used to understand the processes at work in the study area. This thesis follows the style and format of the Journal of Ocean Engineering

10 Fig.. Survey area - Highway 87 in the Jefferson County (Wamsley, 999)... Objectives The primary objective of this study is to determine the change of the Jefferson County shoreline and the rate at which the beach is either eroding or accreting every year. In order to achieve an understanding of the problem, beach surveying was completed from the summer of 999 to the fall of. Using the summer of 999 survey, the original shoreline position, we can compare the original survey with the other seven surveys. The distance that the shoreline changes at a particular elevation in the horizontal shows the amount of erosion or accretion that occurs at an individual profile. These profiles include walking surveys beginning in the freshwater marsh into about one meter of water and jetski surveys extending about 6 meters offshore.
11 CHAPTER II PREVIOUS WORK IN JEFFERSON COUNTY Beach erosion between Sabine Pass and Bolivar Roads has been the subject of numerous reports and investigation which originated as early as 947 when Sheets commented on the beach erosion of meters near High Island and subsequent relocation of State Highway 87 (Morton, 997). LeBlanc and Hodgson (959) also described shoreline recession west of Sabine Pass and the subsequent relocation of State Highway 87 (Morton, 997). They speculated that during the past several thousand years, the shoreline west of Sabine Pass had eroded several hundred meters. Shoreline changes a mile on either side of Rollover Pass between 9 and 96 (post- Carla) were summarized by Feray who reported net erosion of 6 and meter northeast and southwest, respectively, of the fish pass. Short-term accretion and erosion at Sabine Pass, High Island, and Bolivar Roads have been recorded by beach surveys conducted by the U.S. Army Corps of Engineers ( ) (Morton, 997). Beach profile changes at Rollover Pass between 96 and 97 were presented by Prather and Sorensen who concluded that the beach in that area was stabilized and changes occurred only seasonal or in response to storms. Additional data presented herein indicate that the beach near Rollover Pass is not stable but erosional. Beach profiles from Sabine Pass to Bolivar Roads have been surveyed intermittently since 974 (Morton, White, and Gibeaut, 996). The most recent shoreline movement between Sabine Pass and Bolivar Roads was documented by comparing shoreline positions in June 974 and February 996. The 974 shoreline was already in the
12 4 Bureau s GIS, whereas the 996 shoreline was derived from a real-time kinematic DGPS survey that was later incorporated into the GIS shoreline coverage. Distances between the 974 and 996 were measured at each transect, then rates of change were calculated for the.7 year period and Table was generated. From Table it is evident that from the years between 974 to996 this area was eroding more than accreting. From transects 5 through 58, the entire Gulf shoreline retreated. Shoreline recession was highest, more than m/yr, in the area between transects 8 and, which includes the beach segment where Highway 87 was destroyed by erosion. This beach segment is characterized by a marrow, relatively steep beach and washover terrace composed of sand and shell and underlain by mud. The crest of the washover terrace or edge of the destroyed road is the shoreline feature for this beach segment. Transects 5 6 coincide with the survey area of Texas A&M University from the summer of999 to the fall of.
13 5 Table Net shoreline change between Sabine Pass and Bolivar Roads, (Morton, 997) Net Average Net Average Transect Change Rate Transect Change Rate (m) (m/yr) (m) (m/yr)
14 6 CHAPTER III COLLECTING DATA.. Method The beach profile shows that the beach responds to storm tides and waves. Defining the topography enables the shoreline movement to be quantified. Measuring beach profiles is a challenging task for such a long stretch of shoreline. A Global Positioning System was chosen as the most accurate and expeditious method of completing a land and hydrographic survey. The hydrographic survey was conducted with a boat-mounted echo sounder. This procedure is fast and can be performed in a variety of bottom conditions. A Differential Global Positioning System (DGPS) is combined with an echo sounder to obtain a threedimensional position. This compensates for the tide, waves and other fluctuations in the still water level. This equipment is mounted on a personal watercraft which decreases the draft requirements of a conventional survey boat and provides excellent maneuverability in the surf zone. The GPS is portable, can be deployed and recovered with a small crew, and is cost effective. The survey on the beach utilizes Real-Time Kinematic Differential Global Positioning System (RTK-DGPS) equipment carried by the surveyor in a backpack. For our purposes, the beach survey includes measurements from a surf zone wading depth to the wetlands area just landward of the overwash fans. The nearshore bathymetry is monitored by mounting the RTK-DGPS equipment on a personal watercraft and integrating it with an echo sounder. Using navigation software, repeatable beach survey lines are traversed in the nearshore zone. The hydrographic survey includes measurements from the point where the wading survey ends to approximately 6 meters offshore. The two surveys are combined to provide a complete profile from the depth of closure to the start of the wetlands behind the dune field. Figure is a schematic of the profiling system.
15 7 Beach Survey Nearshore Survey h a h t d t Fig.. Survey system (Wamsley, 999). When using GPS technology, the location of the base station and the height of the GPS antennas are known, as well as the distance from the base station. Therefore the topography of profiles are calculated based on that information. For the beach surveys, the antenna height, h a, is subtracted from the antenna location to get the X, Y, and Z coordinates of the beach topography. The nearshore bathymetry is obtained by reducing the measured antenna elevation by the height of the antenna above the echo sounder transducer and measured depth below the transducer, h t +d t... Benchmarks Permanent benchmarks were established with a known and non-changing position. Reconnaissance of the study area that was conducted prior to the first set of surveys in Jefferson County before the summer of 999 reveled that all of the United States Geological Survey (USGS) and the United States Coast and Geodetic Survey markers had all been lost or damaged due to erosion. Because of this damage it was necessary for the replacement of these markers with ones that were stamped at Texas A&M University. These benchmarks were then set up at various points along the survey area to insure
16 8 uninterrupted and continuous surveying. To ensure that there was adequate radio transmission the benchmarks were placed less than ten kilometers apart from each other. Lastly these benchmarks were placed in stable areas that were far enough removed from the eroding areas to ensure that they will be in place for the time period that surveys are conducted. Four Benchmarks were selected to provide radio coverage over the entire survey area. The first benchmark named CLAM is located at the corner of Clam Lake Road and SH 87. It is directly across from the old entrance to the shore just west of the entrance off Sea Rim State Park, and west to the entrance to the McFaddin Wild Life Refuge. VASTAR is approximately.7 km southwest of CLAM at what was VASTAR Resources shore base. Finally CATT is located in an abandoned cattle corral approximately 5 km southwest of VASTAR. In order to obtain an accurate base point location, the position of each benchmark is calculated using static baseline processing. This coordinate is confirmed with a static position each time it is occupied. Coordinates that are calculated using this process are accurate to the centimeter level. Table lists the calculated coordinates of the three base stations. Table Base point coordinates (WGS-84) Benchmark Latitude Longitude CLAM 9 o N 94 o W.856 VASTAR 9 o N 94 o W.964 CATT 9 o N 94 o W.46 The coordinates given in table are in World Geodetic System- 984 (WGS 84). The WGS-84 is the mathematical ellipsoid used by GPS since 987. The raw DGPS data were converted to Texas State Plane coordinates 44, South Central Zone, NAD 8
17 9 horizontal datum, survey meter. The elevations are converted to the NAVD 88 datum by applying the GEOID96 model. Errors of a few centimeters may have a significant impact on the sand volume because it is applied to such a large horizontal sand area. The accuracy of the beach and nearshore survey systems has been completed in field tests in (Wamsley, ). The beach survey system has a vertical accuracy of + 4cm. The hydrographic survey system was tested by repeating transects in the nearshore at Jefferson County, and the repeatability of the profiles demonstrated a standard deviation of 6. cm from the mean absolute difference of 8. cm (Edge, Tuttle, and Hutchinson )... Beach and offshore profile surveys Prior to initiating a monitoring plan, it is necessary to establish a baseline which can be used to calculate distance of a position on the survey line. If the x, y coordinates of starting and ending points are known, it is possible to create the baseline. Coordinates that are calculated using this process are Texas State Plane coordinates 44, South Central Zone, survey meter. In this study, the x, y coordinates of starting point are meters and meters, ending point is meters and meters. The surveys of beach and offshore profiles form the heart of the physical monitoring and can be accomplished by a number of approaches. Profiles are obtained every 4 meters throughout the survey area. Each of the nearshore profiles corresponds to a beach profile. The onshore and hydrographic surveys are combined to provide a complete profile from the start of the wetlands out to the depth of closure. For the beach survey, lines were established every 4 meters along the entire study area. Each line extends from an approximate safe wading depth to the beginning of the marsh. The 56 lines were defined from coordinates obtained during an initial survey and keyed
18 into the Trimble TSC. Each line extends perpendicular to the shoreline and defines the survey transects that will be used for every Jefferson County survey. The lines do not need to be physically marked on the beach since they are stored in the data collector. When the data at Jefferson County is collected it is stored and analyzed. This entails taking data from both the onshore and offshore portions of the survey and analyzing them separately. Once the onshore and offshore data are analyzed separately they are then combined into the final product which shows the overall beach profiles. Once all the lines have been reduced to their final product, the approximate mean sea level (MSL) is determined. Mean sea level is approximated by the surface of the geoid as determined at.m North American Vertical Datum (NAVD) 988. From here, the MSL of the summer of 999 survey can be subtracted from the MSL position for the fall of survey to show the difference from the initial survey over the entire period. This number is the change in position of the MSL and indicates if the profile has eroded or accreted the fall profile is used to determine the net loss of sand over the entire survey area..4. Sand samples In the spring of 999 Steven Howard completed the report entitled Impact of Shoreline Changed Proposed Texas Highway 87 Reconstruction. In this study Howard defines a research project that is responsible for collecting a comprehensive set of base line data including sediment samples over the damaged section of SH87. He accomplishes this task by achieving the following tasks. The first phase of the project was to acquire data to determine the storm surge and wave set up in the Gulf of Mexico. The next step was to obtain 76 core samples that were then taken to the University of Florida to be run through a rapid sand analyzer. The figure shows the grain size distribution as resulting from the RSA. The samples were taken at every 8m from east to west along the beach on the berm, beach face, and off shore. Line zero is located in 5.6km from the Clam Lake Road.
19 D5 Graine Size vs Station Number.4 d5 (mm) Berm Beach face Off shore..5 e6 e4 e w w4 w6 w8 w w w4 w6 w8 w w w4 Station Number Fig.. Sorted RSA results from east to west (Howard, 999). Howard was able to determine that the beach was made of fine sands and silts. From this information he determined that quarterly surveys were to be taken along shore position, and cross-shore profiles to the depth of closure, which is around 6 meters off shore. Sand samples were collected again along the survey region in the fall of. These samples were analyzed using the RSA to obtain the d5. Unfortunately, table Shows just seven comparisons of d5 grain size of two sand samples at the same profile line because the samples were taken at each. km along the beach on the berm, beach face and in.6- meter of water in the fall of so just seven locations of sand samples agree with that of 999 sand samples in survey area.
20 Table Comparison of d5 grain size of two different sample periods Sand samples 999 Sand samples (Howard) Line No Location d5 (mm) Line No Location d5 (mm) Berm.8 Berm Beach Face.94 w4 Beach Face Offshore.68 Offshore Berm.968 Berm Beach Face.9 w Beach Face.79 Offshore clay Offshore Berm.567 Berm Beach Face.7559 w5 Beach Face.859 Offshore clay Offshore Berm.46 Berm Beach Face.5 w Beach Face.7 Offshore clay Offshore.78 Berm.75 Berm Beach Face clay w5 Beach Face.987 Offshore clay Offshore Berm.8576 Berm.57 8 Beach Face.468 Beach Face Offshore clay Offshore.89 Berm.5 Berm.57 8 Beach Face.6889 e5 Beach Face.697 Offshore clay Offshore.8
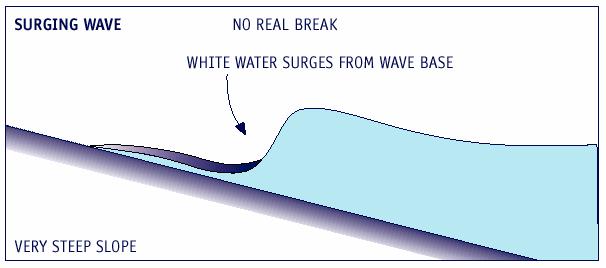
21 CHAPTER IV ANALYSIS 4.. Waves Waves are an everyday occurrence in the physical process that effect beach morphology. Although they are a constant factor that affects the changing beach surface, it is not the waves that occur during the weather that occur every day that can cause the most damage to the beach. Instead the waves that most affect the beaches are caused during severe weather events such as tropical storms or depressions. Breaking waves cause turbulence which disturbs the sediment which causes sediment movement. There are three types of breaking waves also known as breakers (Figure 4). They are the spilling breakers where each wave gradually peaks until the crest becomes unstable and cascades down known as white water. Plunging breakers occurs when the shore ward face of the wave becomes vertical, curls over, and plunges forward and downward as intact mass of water. Finally Surging breakers peak up as if to plunge, but then the face of the wave surges up the beach face so that the crest collapses and disappears (Komar, 998).


22 4 Fig. 4. Three types of breaking waves (
23 5 Offshore wave conditions are determined from the historical data recorded at NOAA. This particular data was obtained from the NOAA buoy Station 45 located outside of Galveston Bay approximately mile south west of the survey area. Table 4 lists the dates, and the wave heights that affected the area during the time of study. In order to determine the effects of waves on the area wave heights above meters were taken the data that is in the time frame of the surveys, i.e. that used for data from January 999 to December. Table 4 List of wave heights above meters (All data taken from NOAA database) Strart Time End Time YYYY MM DD hh WVHT(m) YYYY MM DD hh WVHT(m) Hmax (m) Over the last three years there were thirteen events of waves two meters or higher lasting for greater than six hours. The historical storm data show that tropical storm Allison reached the Texas coast south of Galveston on June 6, and tropical storm Fay passed during September 5 and 8,. The storm dates correlate with the highest wave

24 6 record during tropical storm Allison. The storm with greatest heights occurred during June with H max of 4.5 meters. 4.. Storm surge Storm surge is simply water that is pushed toward the shore by the force of the winds swirling around the storm. This advancing surge combines with the normal tides to create the hurricane storm tide, which can increase the predicted water level. Figure 5 shows storm surge. Storm surge allows larger waves to pass over the offshore zone since the depth is greater and then dissipate the increased energy contained in the storm waves onto the beach. The remaining energy is spent in erosion of the beach, berm, and sometimes dunes which are now exposed to wave attack by virtue of the storm surge. The eroded material is carried offshore in large quantities where it is deposited on the nearshore bottom. Fig. 5. Illustration of storm surge (NOAA web site). Estimations of surge have been performed. Due to the low berm elevation, frequent overtopping may occur even under mild water level rise. The berm in this particular area is largely made up of sediment deposited as water overtopped into the wetlands, this has been defined by Dr. Robert Morton as a washover terrace (Morton, 997). Washover
25 7 terraces are deposited where beaches are highly erosional and adjacent ground elevations are lower than the highest storm surges. Historical storm surges were estimated by the Coastal Engineering Research Center (CERC), Waterways Experiment Station in Vicksburg, Mississippi. The work done at CERC used a finite element based model to predict storm surge at stations along the United States coast for 4 historically based hurricanes. All of the historic data was obtained from the HURDAT databases developed by the National Oceanic and Atmospheric Administration (NOAA). The storm surge predictions from WIS station 59 were used to estimate statistical water levels in the SH 87 area. WIS 59 is located approximately miles off the Texas coast at latitude 9.68N, longitude 9.76W. Table 5 lists hurricanes that have impacted the SH87 with storm surge between the years of 886 and 994. Three tropical storms made landfall on the Texas coast during the study period. Tropical storm Frances on September 998 recorded.8 m storm surge at Sabine Pass and.8 m storm tide at Bolivar Roads. The second tropical storm is Allison on June and the third one is Fay on September. Figure 6 shows predicted and actual tidal record when these tropical storms passed through Sabine Pass and suddenly increased water level (Top to bottom, Tropical Storm Frances, Tropical Storm Allison and Tropical Storm Fay). All of the historic tidal data were obtained from the Center for Operational Oceanographic Products and Services (CO-OPS) National Tidal Datum Epoch.
26 8 Table 5 Hurricanes impacting SH87 between 886 and 994 Date Name HURDAT # Surge (m) 8//886 Not Named 5.4 8/7/9 Not Named 7. 7//99 Not Named 8 8/5/95 Not Named.6 8//98 Not Named.4 6/7/99 Not Named /5/9 Not Named 4.5 8//94 Not Named /6/94 Not Named 45. 8/4/945 Not Named /7/957 Audrey /5/959 Debra 586 9//96 Carla 6. 8//97 Celia /6/97 Edith 7.9 9/9/97 Fern /4/97 Delia 7.8 9/8/974 Carmen 7.6 9///98 Chris /8/98 Alicia 8.4 8/5/985 Danny 8. 6/6/986 Bonnie 84. 8//989 Chantal /5/989 Jerry 874.


27 Fig. 6. Historic tide data of Sabine Pass north. 9
28 The water level data has been fit to Weibull and Gumble distributions using 95% confidence limits. Calculations were done with the use of the USACE s Automated Coastal Engineering System (ACES) program. The Weibull distribution with k=. was used for design purpose due to its highest correlation coefficient. The correlation coefficient is simply a measure of how well the data set fit the intended distribution. A perfect fit would require a coefficient equal to one. Table 6 presents the 95% confidence limit results for the Weibull Distribution. Table 6 95% confidence interval (lower bound (m)-upper bound (m)) Weibull Distribution Return Period (Yr) FT-I k=.75 k=. k=.4 k= The final statistical tool developed is Table 7 which gives the percent chance of occurrence of a specific storm event during a given time period. Table 7 is able to give insight into how much risk a given design elevation assumes. Table 7 Percent chance of storm event occurrence Period of Concern (Yr) Return Period (Yr)
29 Applying a fifty years storm to the SH 87 problem, it is evident that over the next twentyfive years there is a forty percent chance of water levels reaching between. and 4.5 meters. The next essential step in the design process is to determine the average berm height along the survey area and assess its likelihood of breach during a storm. From beach profiles summarized in this study, the berm height is approximately.5 meters above mean sea level. Using this estimation, Table 8 clearly shows that the wetlands behind the beach will flood during a ten-year event. Table 8 Summary of extreme storm event analysis Return Period (Yr) Weibull Distribution (meter above MSL) Chance of Occurrence Period of Concern Predicted 95% Limits 5yrs 5 yrs
30 4.. Sediment erosion estimate Data gathered from beach profile surveys enabled the calculation of sediment erosion rate and direction. All data in this study were collected and analyzed by Texas A&M University from the Summer of 999 to the Fall of. Eight beach profile surveys were done in the Jefferson county area. In the first survey, there were 56 lines every meters along the entire survey area but survey lines were established again every 4 meters since the fall of 999 so just even line profile data are listed in Appendix A and B. Figure 7 shows comparison of on and offshore profile for three surveys. In case of the data of on and offshore profile, there are three surveys. A full presentation of all of the data is listed in Appendix B. A brief presentation of the data is given below Line 4 fall spr Fig. 7. Comparison of three profiles at line 4. The survey location is divided into three areas according to the erosion rate. The west section of the survey area is roughly line through where erosion rates are relatively low. The profile line starting at line one contains larger dunes, then they taper out around line eight. On these dunes there is tall grass which inhibits the sand from being washed away from storm surge, or the every day occurrence of wind. At line eight this small dune system completely tapers out to around line where there is less vegetation in that area. Line is located in front of the survey monument CATT. Figure 8 shows near CATT

31 area. At line there are small dunes, but there are also trees, and shrubs on the beach which help the sand from eroding at a quicker rate. Fig. 8. Near CATT where road is destroyed, picture taken October 5,. When looking at the overall data at line that is presented in figure 9, it is clear that the formation of a small berm has migrated there over the seasons and rate of erosion averaged about 4m/yr. The small berms could have been created either from storm activity such as storm surge or the natural movement of the sand through the season. Then at line the dunes and vegetation disappears as the rate of erosion increases. Line WI SP SU FA SP FA Fig. 9. Line onshore data.

32 4 The midsection of survey area from line through includes the beach segment where Highway 87 has been destroyed by erosion. In the middle section where the most continuous erosion occurs there is very little vegetation to be found on the beach. This beach segment is characterized by a narrow, relatively steep beach and washover terrace composed of sand and shell and underlain by mud. The crest of the washover terrace or edge of the destroyed road is the shoreline feature for this beach segment. There are no dunes to prevent the pasture or wetlands from flooding during heavy weather. The only change in topography was created by farmers fixing their fences and scraping a dirt road in January of. From line 9 eastward, there is more mud to be found than sand (physically observed). Fig.. Near VASTAR where the beach no longer exists, picture taken May 4,. Figure shows line 4 onshore profile with roughly 5 meters of erosion over a fouryear period. Line 4 is located near the survey monument VASTAR (Figure ). It is the most eroded region in the survey area.

33 5 Line WI SP SU FA SP FA Fig.. Line 4 onshore data. The east section of survey area consists of lines to lines 56, which includes the survey monument CLAM. Figure views near CLAM. The beach of this segment is relatively wide, exhibits low vegetated dunes, and is composed of sand over mud. Fig.. Near CLAM where the beach is wide, picture taken May 4,. At line the vegetation between the beach and the pasture starts to increase and small dunes start to develop at around.5 meters in height. At line 4 the beach looks wider
34 6 and healthier. This coincides with the dunes in this area, as they also start to increase as well as the vegetation on the dunes. There are also shrubs in this area where inhibit the movement of sand during heavy weather. Figure shows line 44 onshore profile with wide and gentle slope beach. Line Fig.. Line 44 onshore data. WI SP SU FA SP The shoreline is defined as mean sea level (MSL), which corresponds to an orthometric height of zero using the NAVD 88 datum. Using the measured profiles, a zero elevation was interpolated using an Excel spreadsheet at each transect creating a continuous MSL contour. Figure 4 shows the change of shoreline position. Comparing the shoreline position shows how much erosion occurred over four years. But since the shoreline is not a uniform line we can use the change in position of the zero elevations from the summer of 999 to the fall to determine the total amount of erosion that has occurred over the last four years.
35 7 Shoreline Position Distance from Baseline (m) fall Line Number Fig. 4. Change in shoreline comparing the Fall99 and Fall. The figure 5 shows the middle region of the survey area has the highest amount of sediment transported away from the site. This supports the hypothesis that maximum beach recession is occurring at the central survey area. Change in the Distance of the MSL 5 Distance from Sum 99 (m) Sum 99 Sum Sum Sum Line Number Fig. 5. Graph of the erosion rate based on the distance of the MSL. The maximum erosion occurred at line with roughly 8 meters of loss over a fouryear period. Whereas line 56 shows more than meters of accretion over a four-year
36 8 period. This accretion could be a result in response to the sand supplied by alongshore transport. The midsection conversely has no dunes, and there is no vegetation on the sand area to prevent the sand from being removed into the overwash area, and permanently lost from the system. Near profile 4, the sand transport is divergent, called a nodal area. The nodal area refers to a location along the shoreline that experiences excessive erosion because the sediment is being transported both east and west divergently. The current location of a nodal area is near profile 4. The advance or retreat of the shoreline varies across the study area. Net change rate was calculated from the erosion rate based on the distance of the MSL (Fig 5). Table 9 details shoreline movement from 999 to at the western edge of the study area and each of the three benchmarks from west to east. The erosion is relatively low at Chambers County and then gets abruptly worse near the Jefferson County line. Table 9 Comparison of net shoreline changes 999- Location Chambers county Morton Transect Net change (m) Average rate (m/yr) Net change (m) Average rate (m/yr) CATT VASTAR CLAM The shoreline historically has receded across the entire study area except at the eastern region. The 999- yearly average erosion rate at Chambers County increased two times from surveys but CATT erosion rate agrees closely with the
37 9 survey data. On the other hand it has remained constant over the last six years. Erosion rate at VASTAR a little bit increased from the survey. At VASTAR, visual evidence collected suggests a significant amount of the erosion since 999. In June of, tropical storm Allison made landfall at Jefferson County and in the next fall tropical storm Fay and hurricane Lili affected the Texas shoreline. The evidence strongly suggests that the erosion is primarily a result of the storm and not due to normal tide and wave activity. Finally CLAM s accretion rate has slowed by half from the surveys to just over 4 m/yr, but the beach is still advancing and has not retreated since Equilibrium profiles A sediment size correlates to a useful simple equation for the equilibrium profile of the form h(y)=ax / in which h is the water depth at a distance x from the shoreline and A is a so-called profile scale parameter with dimensions of length to the / power. The grain size d5 can be got from sand sample data and the parameter A can be estimated directly from table. Dean () showed the A parameter to be related approximately linearly to fall velocity w, and recommended these A values. Table Summary of recommended A value (Units of A parameter are m / )-Dean () D(mm)
38 Table Shows comparison of d5 grain size and A values of sand samples at corresponding profile line 5. Table Comparison of d5 grain size and A values of two different samples collection Sand samples 999 Sand samples (Howard) Line No Location d5 (mm) A values Line No Location d5 (mm) A values Berm.8.5 Berm Beach Face w4 Beach Face Offshore Offshore Berm Berm Beach Face.9.97 w Beach Face Offshore clay Offshore Berm Berm Beach Face w5 Beach Face Offshore clay Offshore Berm.46.4 Berm Beach Face.5. w Beach Face.7.74 Offshore clay Offshore.78.5 Berm.75.5 Berm Beach Face clay w5 Beach Face Offshore clay Offshore Berm Berm Beach Face Beach Face Offshore clay Offshore Berm Berm Beach Face e5 Beach Face Offshore clay Offshore.8.4 Figure 6 shows native profiles and computed equilibrium profiles. In this study, seven equilibrium profiles were compared with measured profiles listed in table. The rest of the equilibrium profiles are listed in Appendix C. The A parameter was taken on the berm from table. In figure 6, the slope of equilibrium profile is much steeper than that of native profile and it diverges roughly after meter water depth area. The other approach
39 to determining the A value is based on depths (Dean, ). Application of the method of least squares in which the sum of squares of the deviations between the calculated (based on h(y)=ax / ) and the measured depths are minimized in A N = I I hy i y / i 4/ i in which I is the total number of depths available. Applying above equation to the available data for profile 8 results in an A =.55 m / which is significantly smaller than A value estimated from table. That means there exist different grain size or different material on the seabed such as mud, clay or fine sand beyond the meter depth. This characteristic of profile exists in the entire survey area. Line fall Equil-f99 Equil-f A=.55 Fig 6. Equilibrium beach profile at line 8.
40 CHAPTER V CONCLUSIONS AND RECOMMENDATION The beach profile data taken during the past four years of the SH 87 area in Jefferson County were processed and analyzed to provide information regarding the coastal processes effecting the upper Texas Coast. Comparison of all surveys shows how much the SH 87 area in Jefferson County is accreting or retreating throughout the survey area. The highest rates of recession are in the central region from line through including VASTAR. The maximum erosion occurred at line with roughly 8 meters of loss over a four-year period. The nodal point where the sand transport is divergent is assumed to occur at line4. The midsection conversely has no dunes, and there is no vegetation on the sand area to prevent the sand from being removed into the overwash area. During storm event, the sand on the beach face is washed up and over the berm because of storm surge. These storms cause the dune to roll back on itself as the clay is exposed. Without a protective layer of sand to absorb wave energy, the substrate is eroded. Beach survey data and wave data confirm that the greatest shoreline recession coincides with the highest waves. On the other hand line 56 shows more than meters of accretion over a four-year period. This accretion could be a factor of the beach nourishment, and dune nourishment that has been in affect in that area over the last year. In view of the results so far achieved, there exists a sand deficit along the entire survey area excluding the most eastern area. The most likely solution to the erosion problem appears to be geotubes and beach nourishment. Geotubes are tubes that have an ovalshaped cross section made of geotextile fabric. When filled with sand they have a cross section of about.7m. They are placed parallel to the shoreline with the intent of protecting property from storm surge and erosion. Beach nourishment involves the
41 placement of material offshore with the normal action of waves or will provide protection to the shore from erosion by reducing the effects of waves. A nourishment project would require the identification of a suitable borrow site. Further research is required on a possible source in the Sabine Banks to determine its viability as a borrow site. Then the sand volume must be quantified both on the beach face and to the depth of closure. Further additional accurate surveys and investigations will provide information and solution that can be used for the design of the new highway.
42 4 REFERENCES Coastal Engineering Data Retrieval System.,. Available WIS Station Gulf of Mexico. Accessed at Dean, R.G.,. Beach Nourishment: Theory and Practice. World Scientific, River Edge, New Jersey. Edge, B.L., Tuttle, M., Hutchinson, R.N.,. Jefferson County Shoreline Assessment Summary Year One. Texas A&M University, College Station, Texas. Howard, S.A., 999. Impact of Shoreline Change on Proposed Texas Highway 87 Reconstruction. M.S. thesis, Texas A&M University, College Station, Texas. Joshua, T.,. Jefferson County Highway 87 Shoreline Assessment Summary Year. Texas A&M University, College Station, Texas. Komar, P.D., 998. Beach Processes and Sedimentation ( nd ed). Prentice-Hall Upper Saddle River, New Jersey. Morton, R.A., 997. Gulf Shoreline Movement Between Sabine Pass and Brazos River, Texas, The University of Texas, Bureau of Economic Geology, Geological Circular 97-. Austin, Texas. Morton, R.A., White, W.A., Gibeaut, J.C., 996. East Texas and Western Louisiana Coastal Erosion Study. U.S. Department of Interior, U.S. Geological Survey, Austin, Texas. National Hurricane Center.,. Hurricane History - TPC Archive of Past Hurricane Seasons, Gulf of Mexico. Accessed at NOAA Oceanographic Products and Service Division.,. Station 45 Galveston PleasurePier. TX, USA Accessed at station_page.phtml?station=45 Retrieve Verified / Historic (Tides) Water Level Data., Sabine Pass North. TX, USA. Accessed at =vwl Wamsley, Ty V.,. Shoreline Monitoring Program on the Upper Texas Coast Utilizing a Real Time Kinematic Differential Global Positioning System. M. S. thesis, Texas A&M University, College Station, Texas.
43 5 APPENDIX A BEACH SURVEY PROFILES
44 6 Line WI SP SU FA SP FA Line 4 WI SP SU FA SP Line 6 WI SP SU FA SP FA
45 Line 8 WI SP SU FA SP Line WI SP SU FA SP FA Line WI SP SU FA SP
46 Line 4 WI SP SU FA SP FA Line 6 WI SP SU FA SP Line 8 WI SP SU FA SP FA
47 Line WI SP SU FA SP Line WI SP SU FA SP FA Line 4 WI SP SU FA SP
48 Line 6 WI SP SU FA SP FA Line 8 WI SP SU FA SP Line WI SP SU FA SP FA
49 Line WI SP SU FA SP Line 4 WI SP SU FA SP FA Line 6 WI SP SU FA SP
50 Line 8 WI SP SU FA SP FA Line 4 WI SP SU FA SP Line 4 WI SP SU FA WI SP
51 Line WI SP SU FA WI SP Line WI SP SU FA WI SP Line WI SP SU FA WI SP
52 Line 5 WI SP SU FA WI SP Line 5 WI SP FA SP Line 54 WI SP SU FA SP FA
53 Line WI SU FA SP Line WI SP SU FA SP FA Line WI SP SU FA SP
54 Line WI SP SU FA SP FA Line WI SP SU SP Line WI SP SU SP FA
55 Line WI SP SU SP Line WI SP SU SP FA Line WI SP SU SP
56 Line 74 WI SP SU SP FA Line 76 WI SP SU SP Line 78 WI SP SP FA
57 Line WI SP SU SP Line WI SP SU SP FA Line 84 WI SP SU SP
58 Line 86 WI SP SU SP FA Line 88 WI SP SU SP Line 9 WI SP FA SP FA
59 Line 9 WI SP SU FA SP Line 94 WI SP SU FA SP FA Line 96 WI SP SU FA SP
60 Line 98 WI SP SU FA SP FA Line WI SP SU FA SP Line WI SP SU FA SP FA
61 Line 4 WI SP SU FA SP Line WI SP SU FA SP FA Line 8 WI SP SU FA SP
62 Line WI SP SU FA SP FA Line WI SP SU FA SP Line 4 WI SP SU FA SP FA
63 Line 6 WI SP SU FA SP Line 8 WI SP SU FA SP FA Line WI SP SU FA SP
64 56 Line WI SP SU FA SP FA Line WI SP SU FA SP Line WI SP SU FA SP FA
65 Line WI SP SU FA SP Line WI SP SU FA SP FA Line WI SP FA SP
66 Line WI SP SU FA SP FA Line WI SP SU FA SP Line 8 WI SP SU FA SP FA
67 Line 4 WI SP SU FA SP Line WI SP SU FA SP FA Line 44 WI SP SU FA SP
68 Line 46 WI SP SU FA SP FA Line 48 WI SP SU FA SP Line 5 WI SP SU FA SP FA
69 Line 5 WI SP SU FA SP Line 54 WI SP SU FA SP FA Line WI SP SU FA SP
70 6 APPENDIX B ON AND OFFSHORE SURVEY PROFILES
71 Line spr Line 4 spr Line 6 fa99 fa spr
72 64 Line 8 spr Line fa99 fa spr Line spr
73 Line 4 fall spr Line 6 spr Line 8 fall spr
74 66 Line spr Line fall spr Line 4 spr
75 Line 6 fall spr Line 8 spr Line fall spr
76 68 Line spr Line 4 fall spr Line 6 spr
77 Line 8 fall spr Line 4 spr Line 4 fall spr
78 7 Line 44 spr Line 46 fall spr Line 48 spr
79 Line 5 fall spr Line 5 spr Line 54 fall spr
80 7 Line 56 spr Line 58 fall spr Line 6 spr
81 Line 6 fall spr Line 64 spr Line 66 fall spr
82 74 Line 68 spr Line 7 fall spr Line 7 spr
83 Line 74 fall spr Line 76 spr Line 78 fall spr
84 76 Line 8 spr Line 8 fall spr Line 84 spr
85 Line 86 fall spr Line 88 spr Line 9 fall spr
86 Line 9 spr Line 94 fall spr Line 96 spr
87 Line 98 fall spr Line spr Line fall spr
88 Line 4 spr Line 6 fall spr Line 8 spr
89 8 Line fall spr Line spr Line 4 fall spr
90 Line 6 spr Line 8 fall spr Line spr
91 Line fall spr Line 4 spr Line 6 fall spr
92 Line 8 spr Line fall spr Line spr
93 85 Line 4 fall spr Line 6 spr Line 8 fall
94 Line 4 spr Line 4 fall spr Line 44 spr
95 87 Line 46 fall spr Line 48 spr Line 5 fall spr
96 88 Line 5 spr Line 54 fall spr Line 56 spr
97 89 APPENDIX C EQUILIBRIUM PROFILES
98 9 Line 8 (Fall 99) Equil-f99 (A=.98) Line 8 (Spring ) spr Equil-s (A=.968) Line 8 (Fall ) fall Equil-f (A=.968)
99 Line 8 (Fall 99) Equil-f99 (A=.984) Line 8 (Fall ) fall Equil-f (A=.98)
100 Line 58 (Fall 99) Equil-f99 (A=.7) Line 58 (Spring ) spr Equil-s (A=.9) Line 58 (Fall ) fall Equil-f (A=.9)
Volume and Shoreline Changes along Pinellas County Beaches during Tropical Storm Debby
 Volume and Shoreline Changes along Pinellas County Beaches during Tropical Storm Debby Ping Wang and Tiffany M. Roberts Coastal Research Laboratory University of South Florida July 24, 2012 Introduction
Investigation of the Impact of Beach Raking on Beach Accretion/Erosion: West End Beaches of Galveston Island, Texas 2007/ 2008
 Investigation of the Impact of Beach Raking on Beach Accretion/Erosion: West End Beaches of Galveston Island, Texas 2007/ 2008 By Robert Webster 1, Timothy Dellepenna Ph.D. 1, 1 Texas A&M at Galveston
Figure 4, Photo mosaic taken on February 14 about an hour before sunset near low tide.
 The Impact on Great South Bay of the Breach at Old Inlet Charles N. Flagg and Roger Flood School of Marine and Atmospheric Sciences, Stony Brook University Since the last report was issued on January 31
Appendix E Cat Island Borrow Area Analysis
 Appendix E Cat Island Borrow Area Analysis ERDC/CHL Letter Report 1 Cat Island Borrow Area Analysis Multiple borrow area configurations were considered for Cat Island restoration. Borrow area CI1 is located
Performance of Upham Beach T-Groin Project and Its Impact to the Downdrift Beach
 Performance of Upham Beach T-Groin Project and Its Impact to the Downdrift Beach Progress Report for the Period of October 2008 to April 2009 Submitted by Ping Wang, Ph.D., and Tiffany M. Roberts Department
HURRICANE SANDY LIMITED REEVALUATION REPORT UNION BEACH, NEW JERSEY DRAFT ENGINEERING APPENDIX SUB APPENDIX D SBEACH MODELING
 HURRICANE SANDY LIMITED REEVALUATION REPORT UNION BEACH, NEW JERSEY DRAFT ENGINEERING APPENDIX SUB APPENDIX D SBEACH MODELING Rev. 18 Feb 2015 1 SBEACH Modeling 1.0 Introduction Following the methodology
Modeling Sediment Transport Along the Upper Texas Coast
 Modeling Sediment Transport Along the Upper Texas Coast David B. King Jr. Jeffery P. Waters William R. Curtis Highway 87 roadbed, Jefferson County Galveston District Corps Sabine Pass to San Luis Pass
Hurricane Rita Impacts on the Texas Shoreline A Summary Report
 Hurricane Rita Impacts on the Texas Shoreline A Summary Report James Gibeaut, Tiffany Hepner, John Andrews, Roberto Gutierrez, and Becky Smyth Prepared for the Texas General Land Office under GLO Interagency
RE: Hurricane Matthew Beach Damage Assessment and Recommendations [CSE 2416]
![RE: Hurricane Matthew Beach Damage Assessment and Recommendations [CSE 2416]](/thumbs/83/87675702.jpg "RE: Hurricane Matthew Beach Damage Assessment and Recommendations [CSE 2416]") October 25, 2016 Iris Hill Town Administrator Town of Edisto Beach 2414 Murray St Edisto Beach SC 29438 RE: Hurricane Matthew Beach Damage Assessment and Recommendations [CSE 2416] Dear Iris, Hurricane
October 25, 2016 Iris Hill Town Administrator Town of Edisto Beach 2414 Murray St Edisto Beach SC 29438 RE: Hurricane Matthew Beach Damage Assessment and Recommendations [CSE 2416] Dear Iris, Hurricane
Beach Nourishment Impact on Beach Safety and Surfing in the North Reach of Brevard County, Florida
 Beach Nourishment Impact on Beach Safety and Surfing in the North Reach of Brevard County, Florida Prepared by John Hearin, Ph.D. Coastal Engineering Vice Chairman Cocoa Beach Chapter Port Canaveral Patrick
UPPER BEACH REPLENISHMENT PROJECT RELATED
 ASSESSMENT OF SAND VOLUME LOSS at the TOWNSHIP of UPPER BEACH REPLENISHMENT PROJECT RELATED to the LANDFALL OF HURRICANE SANDY - PURSUANT TO NJ-DR 4086 This assessment is in response to Hurricane Sandy
Beach Profiles. Topics. Module 9b Beach Profiles and Crossshore Sediment Transport 3/23/2016. CE A676 Coastal Engineering
 Beach Profiles AND CROSS-SHORE TRANSPORT Orson P. Smith, PE, Ph.D., Professor Emeritus Topics Features of beach and nearshore profiles Equilibrium profiles Cross-shore transport References Text (Sorensen)
Figure 1. Schematic illustration of the major environments on Mustang Island.
 STOP #1: PACKERY CHANNEL BEACH TO BAY We will start this field guide near the north jetty of Packery Channel and hike across the island to Corpus Christi Bay (fig. 1). The island emerges from the Gulf
INTRODUCTION TO COASTAL ENGINEERING
 The University of the West Indies Organization of American States PROFESSIONAL DEVELOPMENT PROGRAMME: COASTAL INFRASTRUCTURE DESIGN, CONSTRUCTION AND MAINTENANCE A COURSE IN COASTAL DEFENSE SYSTEMS I CHAPTER
DUNE STABILIZATION AND BEACH EROSION
 DUNE STABILIZATION AND BEACH EROSION CAPE HATTERAS NATIONAL SEASHORE NORTH CAROLINA ROBERT DOLAN PAUL GODFREY U. S. DEPARTMENT OF INTERIOR NATIONAL PARK SERVICE OFFICE OF NATURAL SCIENCE WASHINGTON, D.
Reading Material. Inshore oceanography, Anikouchine and Sternberg The World Ocean, Prentice-Hall
 Reading Material Inshore oceanography, Anikouchine and Sternberg The World Ocean, Prentice-Hall BEACH PROCESSES AND COASTAL ENVIRONMENTS COASTAL FEATURES Cross section Map view Terminology for Coastal
Inlet Management Study for Pass-A-Grille and Bunces Pass, Pinellas County, Florida
 Inlet Management Study for Pass-A-Grille and Bunces Pass, Pinellas County, Florida Final Report Submitted By Ping Wang, Ph.D., Jun Cheng Ph.D., Zachary Westfall, and Mathieu Vallee Coastal Research Laboratory
CHAPTER 281 INFLUENCE OF NEARSHORE HARDBOTTOM ON REGIONAL SEDIMENT TRANSPORT
 CHAPTER 281 INFLUENCE OF NEARSHORE HARDBOTTOM ON REGIONAL SEDIMENT TRANSPORT Paul C.-P. Lin, Ph.D., P.E. 1 and R. Harvey Sasso, P.E. 2 ABSTRACT The influence of nearshore hardbottom on longshore and cross-shore
Cove Point Beach Restoration: Utilization of a Spawning Habitat by Horseshoe Crabs (Limulus polyphemus)
") Cove Point Beach Restoration: Utilization of a Spawning Habitat by Horseshoe Crabs (Limulus polyphemus) Paul Bushmann, Jessica Peterson, Bethany Enyeart and Deborah Smith Anne Arundel Community College
Cove Point Beach Restoration: Utilization of a Spawning Habitat by Horseshoe Crabs (Limulus polyphemus) Paul Bushmann, Jessica Peterson, Bethany Enyeart and Deborah Smith Anne Arundel Community College
Cross-shore sediment transports on a cut profile for large scale land reclamations
 Cross-shore sediment transports on a cut profile for large scale land reclamations Martijn Onderwater 1 Dano Roelvink Jan van de Graaff 3 Abstract When building a large scale land reclamation, the safest
New Jersey Coastal Zone Overview. The New Jersey Beach Profile Network (NJBPN) 3 Dimensional Assessments. Quantifying Shoreline Migration
 3 Dimensional Assessments. Quantifying Shoreline Migration") New Jersey Coastal Zone Overview The New Jersey Beach Profile Network (NJBPN) Objectives Profile Locations Data Collection Analyzing NJBPN Data Examples 3 Dimensional Assessments Methodology Examples Quantifying
New Jersey Coastal Zone Overview The New Jersey Beach Profile Network (NJBPN) Objectives Profile Locations Data Collection Analyzing NJBPN Data Examples 3 Dimensional Assessments Methodology Examples Quantifying
Delaware Chapter Surfrider Foundation - Indian River Inlet Monitoring
 Delaware Chapter Surfrider Foundation - Indian River Inlet Monitoring In 2012, the Delaware Surfrider Foundation Chapter formed the Surf Quality and Access Committee to focus on issues such as surf spot
CHAPTER 179. Performance of a Submerged Breakwater for Shore Protection
 CHAPTER 179 Abstract Performance of a Submerged Breakwater for Shore Protection Albert E. Browder',A. Member, ASCE; Robert G. Dean 2, Member, ASCE; and Renjie Chen 3 A summary is presented of the results
Nearshore Placed Mound Physical Model Experiment
 Nearshore Placed Mound Physical Model Experiment PURPOSE: This technical note describes the migration and dispersion of a nearshore mound subjected to waves in a physical model. The summary includes recommendations
Real Time Surveying GPS and HYDRO Software for Tide and Swell Compensation
 Real Time Surveying GPS and HYDRO Software for Tide and Swell Compensation by Mr Michael Walker, B.Surv. (Otago) HYDRO Division Trimble Navigation New Zealand Ltd. Abstract This paper focuses on the use
Chapter 4 EM THE COASTAL ENGINEERING MANUAL (Part I) 1 August 2008 (Change 2) Table of Contents. Page. I-4-1. Background...
 1 August 2008 (Change 2) Table of Contents. Page. I-4-1. Background...") Chapter 4 EM 1110-2-1100 THE COASTAL ENGINEERING MANUAL (Part I) 1 August 2008 (Change 2) Table of Contents I-4-1. Background... Page I-4-1 a. Shore Protection Planning and Design, TR 4... I-4-1 b. Shore
Chapter 4 EM 1110-2-1100 THE COASTAL ENGINEERING MANUAL (Part I) 1 August 2008 (Change 2) Table of Contents I-4-1. Background... Page I-4-1 a. Shore Protection Planning and Design, TR 4... I-4-1 b. Shore
CROSS-SHORE SEDIMENT PROCESSES
 The University of the West Indies Organization of American States PROFESSIONAL DEVELOPMENT PROGRAMME: COASTAL INFRASTRUCTURE DESIGN, CONSTRUCTION AND MAINTENANCE A COURSE IN COASTAL DEFENSE SYSTEMS I CHAPTER
OECS Regional Engineering Workshop September 29 October 3, 2014
 B E A C H E S. M A R I N A S. D E S I G N. C O N S T R U C T I O N. OECS Regional Engineering Workshop September 29 October 3, 2014 Coastal Erosion and Sea Defense: Introduction to Coastal Dynamics David
Data Collection and Processing: Elwha Estuary Survey, February 2013
 Data Collection and Processing: Elwha Estuary Survey, February 2013 Ian Miller, WA Sea Grant Olympic Peninsula Field Office, 1502 E. Lauridsen Blvd #82, Port Angeles, WA 98362 immiller@u.washington.edu
The Dynamic Coast. Right Place Resources. A presentation about the interaction between the dynamic coast and people
 The Dynamic Coast Houses threatened by coastal erosion in California Right Place Resources A presentation about the interaction between the dynamic coast and people For the rest of the presentations in
Severe Beach Erosion Caused by Permanent Beach Sand Loss Through Rollover Fish Pass Bolivar Peninsula, Texas
 DRAFT DRAFT DRAFT DRAFT DRAFT DRAFT DRAFT DRAFT Severe Beach Erosion Caused by Permanent Beach Sand Loss Through Rollover Fish Pass Bolivar Peninsula, Texas September, 1999 For J. Martin Green and Alan
HARBOUR SEDIMENTATION - COMPARISON WITH MODEL
 HARBOUR SEDIMENTATION - COMPARISON WITH MODEL ABSTRACT A mobile-bed model study of Pointe Sapin Harbour, in the Gulf of St. Lawrence, resulted in construction of a detached breakwater and sand trap to
UNDERSTANDING STORM SURGE
 The Education Program at the New Jersey Sea Grant Consortium 22 Magruder Road, Fort Hancock, NJ 07732 (732) 872-1300 www.njseagrant.org UNDERSTANDING STORM SURGE ACTIVITY 6 SURGE OF THE STORM http://secoora.org/classroom/virtual_hurricane/surge_of_the_storm>
Chapter 10 Lecture Outline. The Restless Oceans
 Chapter 10 Lecture Outline The Restless Oceans Focus Question 10.1 How does the Coriolis effect influence ocean currents? The Ocean s Surface Circulation Ocean currents Masses of water that flow from one
Dune Monitoring Data Update Summary: 2013
 Dune Monitoring Data Update Summary: 13 Shoreline Studies Program Virginia Institute of Marine Science College of William & Mary Gloucester Point, Virginia September 13 Dune Monitoring Data Update Summary:
A Preliminary Review of Beach Profile and Hardbottom Interactions
 A Preliminary Review of Beach Profile and Hardbottom Interactions Douglas W. Mann, P.E., D.CE. CB&I A World of Solutions Presentation Goal Lead to a better understanding of the challenges regarding the
CLAM PASS ANNUAL RESTORATION & MANAGEMENT PLAN TIDAL ANALYSIS ELEMENT REPORT NO. 13
 CLAM PASS ANNUAL RESTORATION & MANAGEMENT PLAN TIDAL ANALYSIS ELEMENT REPORT NO. 13 Submitted to: Pelican Bay Services Division Prepared by: Humiston & Moore Engineers H&M File No. 13-078 November 2012
NEED FOR SUPPLEMENTAL BATHYMETRIC SURVEY DATA COLLECTION
 305 West Grand Avenue, Suite 300 Montvale, New Jersey 07645 Phone 201.930.9890 Fax 201.930.9805 www.anchorqea.com M EMORANDUM To: Caroline Kwan and Nica Klaber U.S. Environmental Protection Agency Region
Table 4. Volumetric Change Rates Pre-Project and Post-Project for the Town of Duck
 V. VOLUMETRIC CHANGES General Volumetric changes measured over the entire monitoring area for various time periods are provided in Table 4. The volume changes are given in terms of cubic yards/foot of
Chapter 15 SEASONAL CHANGES IN BEACHES OP THE NORTH ATLANTIC COAST OF THE UNITED STATES
 Chapter 15 SEASONAL CHANGES IN BEACHES OP THE NORTH ATLANTIC COAST OF THE UNITED STATES By John M. Darling Hydraulic Engineer, Research Division U. S. Army Coastal Engineering Research Center Corps of
IMPACTS OF COASTAL PROTECTION STRATEGIES ON THE COASTS OF CRETE: NUMERICAL EXPERIMENTS
 IMPACTS OF COASTAL PROTECTION STRATEGIES ON THE COASTS OF CRETE: NUMERICAL EXPERIMENTS Tsanis, I.K., Saied, U.M., Valavanis V. Department of Environmental Engineering, Technical University of Crete, Chania,
STUDY REPORT W&AR-03 RESERVOIR TEMPERATURE MODEL ATTACHMENT B DON PEDRO RESERVOIR BATHYMETRIC STUDY REPORT
 STUDY REPORT W&AR-03 RESERVOIR TEMPERATURE MODEL ATTACHMENT B DON PEDRO RESERVOIR BATHYMETRIC STUDY REPORT DON PEDRO RESERVOIR BATHYMETRIC STUDY REPORT Prepared for: TURLOCK IRRIGATION DISTRICT MODESTO
April 7, Prepared for: The Caribbean Disaster Emergency Response Agency Prepared by: CEAC Solutions Co. Ltd.
 April 7, 2006 Prepared for: The Caribbean Disaster Emergency Response Agency Prepared by: Introduction CEAC Solutions Co. Ltd was commissioned in May 2005 to prepare coastal beach erosion hazard maps for
Beach Profiles: Monitoring Sea Level Rise. Student Activity Sheet. Name Date Class
 Beach Profiles: Monitoring Sea Level Rise Student Activity Sheet Name Date Class A shoreline is the area where the water and land meet. This is where we find beach: areas where sediments (sand or other
LAB: WHERE S THE BEACH
 Name: LAB: WHERE S THE BEACH Introduction When you build a sandcastle on the beach, you don't expect it to last forever. You spread out your towel to sunbathe, but you know you can't stay in the same spot
SPECIAL SPRING 2018 STORM REPORT ON THE CONDITION OF THE MUNICIPAL BEACHES FOR THE BOROUGH OF STONE HARBOR, CAPE MAY COUNTY, NEW JERSEY
 SPECIAL SPRING 2018 STORM REPORT ON THE CONDITION OF THE MUNICIPAL BEACHES FOR THE BOROUGH OF STONE HARBOR, CAPE MAY COUNTY, NEW JERSEY Aerial photograph taken April 21, 2018 showing the view up the beach
EVALUATION OF BEACH EROSION UP-DRIFT OF TIDAL INLETS IN SOUTHWEST AND CENTRAL FLORIDA, USA. Mohamed A. Dabees 1 and Brett D.
 EVALUATION OF BEACH EROSION UP-DRIFT OF TIDAL INLETS IN SOUTHWEST AND CENTRAL FLORIDA, USA Mohamed A. Dabees 1 and Brett D. Moore 1 The paper discusses the analysis of up-drift beach erosion near selected
Technical Brief - Wave Uprush Analysis Island Harbour Club, Gananoque, Ontario
 Technical Brief - Wave Uprush Analysis RIGGS ENGINEERING LTD. 1240 Commissioners Road West Suite 205 London, Ontario N6K 1C7 October 31, 2014 Table of Contents Section Page Table of Contents... i List
Deep-water orbital waves
 What happens when waves approach shore? Deep-water orbital waves Fig. 9.16, p. 211 Wave motion is influenced by water depth and shape of the shoreline wave buildup zone surf zone beach Wave base deepwater
Overview. Beach Features. Coastal Regions. Other Beach Profile Features. CHAPTER 10 The Coast: Beaches and Shoreline Processes.
 Overview CHAPTER 10 The Coast: Beaches and Shoreline Processes Coastal regions constantly change. The beach is a dominant coastal feature. Wave activity continually modifies the beach and coastal areas.
INTRODUCTION TO COASTAL ENGINEERING AND MANAGEMENT
 Advanced Series on Ocean Engineering Volume 16 INTRODUCTION TO COASTAL ENGINEERING AND MANAGEMENT J. William Kamphuis Queen's University, Canada World Scientific Singapore New Jersey London Hong Kong Contents
To: William Woods, Jenni Austin Job No: CentrePort Harbour Deepening Project - Comments on community queries
 Memo To: William Woods, Jenni Austin From: Richard Reinen-Hamill Date: Subject: cc: 1 Purpose This memo sets out our response to issues raised at and after Seatoun community consultation sessions held
COASTAL ENVIRONMENTS. 454 lecture 12
 COASTAL ENVIRONMENTS Repeated movement of sediment & water constructs a beach profile reflecting the balance between average daily or seasonal wave forces and resistance of landmass to wave action Coasts
SHORE PROTECTION AND HABITAT CREATION AT SHAMROCK ISLAND, TEXAS ABSTRACT
 SHORE PROTECTION AND HABITAT CREATION AT SHAMROCK ISLAND, TEXAS M. Cameron Perry, P.E., and Daniel J. Heilman, P.E. Coastal Engineer Shiner Moseley & Associates., Inc. 555 N. Carancahua Corpus Christi,
Wind Blow-out Hollow Generated in Fukiage Dune Field, Kagoshima Prefecture, Japan
 R. Nishi Wind Blow-out Hollow Generated in Fukiage Dune Field, Kagoshima Prefecture, Japan Ryuichiro Nishi, Li Elikson and Myokhin PREFACE A sand dune is vulnerable to severe waves and wind. Therefore,
FINAL REPORT FOR 2013 ON THE CONDITION OF THE MUNICIPAL OCEANFRONT BEACHES THE BOROUGH OF AVALON, CAPE MAY COUNTY, NEW JERSEY
 FINAL REPORT FOR 2013 ON THE CONDITION OF THE MUNICIPAL OCEANFRONT BEACHES THE BOROUGH OF AVALON, CAPE MAY COUNTY, NEW JERSEY View from 12 th Street to the south taken February 28, 2013, following completion
A REVIEW OF THE CONDITION OF THE MUNICIPAL BEACHES AS A RESULT OF HURRICANE SANDY IN THE BOROUGH OF STONE HARBOR, CAPE MAY COUNTY, NEW JERSEY
 A REVIEW OF THE CONDITION OF THE MUNICIPAL BEACHES AS A RESULT OF HURRICANE SANDY IN THE BOROUGH OF STONE HARBOR, CAPE MAY COUNTY, NEW JERSEY View along the dune scarp from 103 rd Street on October 31,
SURGE SUPPRESSION ACHIEVED BY DIFFERENT COASTAL SPINE (IKE DIKE) ALIGNMENTS. Bruce A. Ebersole, Thomas W. Richardson and Robert W.
 ALIGNMENTS. Bruce A. Ebersole, Thomas W. Richardson and Robert W.") SURGE SUPPRESSION ACHIEVED BY DIFFERENT COASTAL SPINE (IKE DIKE) ALIGNMENTS Abstract Bruce A. Ebersole, Thomas W. Richardson and Robert W. Whalin, Jackson State University, Jackson, Mississippi The primary
SURGE SUPPRESSION ACHIEVED BY DIFFERENT COASTAL SPINE (IKE DIKE) ALIGNMENTS Abstract Bruce A. Ebersole, Thomas W. Richardson and Robert W. Whalin, Jackson State University, Jackson, Mississippi The primary
MIAMI BEACH 32ND STREET HOT SPOT: NUMERICAL MODELING AND DESIGN OPTIMIZATION. Adam Shah - Coastal Engineer Harvey Sasso P.E.
 ABSTRACT MIAMI BEACH 32ND STREET HOT SPOT: NUMERICAL MODELING AND DESIGN OPTIMIZATION Adam Shah - Coastal Engineer Harvey Sasso P.E. - Principal Coastal Systems International, Inc. 464 South Dixie Highway
Exemplar for Internal Assessment Resource Geography Level 3. Resource title: The Coastal Environment Kaikoura
 Exemplar for internal assessment resource Geography 3.5A for Achievement Standard 91430 Exemplar for Internal Assessment Resource Geography Level 3 Resource title: The Coastal Environment Kaikoura This
SORTING AND SELECTIVE MOVEMENT OF SEDIMENT ON COAST WITH STEEP SLOPE- MASUREMENTS AND PREDICTION
 SORTING AND SELECTIVE MOVEMENT OF SEDIMENT ON COAST WITH STEEP SLOPE- MASUREMENTS AND PREDICTION Toshiro San-nami 1, Takaaki Uda 2, Masumi Serizawa 1 and Toshinori Ishikawa 2 Conveyer belts carrying gravel
Chapter 11. Beach Fill and Soft Engineering Structures
 Chapter 11 Beach Fill and Soft Engineering Structures Solutions to Coastal Erosion Soft Structures Hard Structures Retreat No such thing as low cost coastal protection Beach Nourishment Beach Filling Beach
Sussex County, DE Preliminary Study Overview
 Sussex County, DE Preliminary Study Overview Coastal study scope: 102 miles of entire County shoreline Revised 102 panels for coastal study Riverine study scope: 14 streams, 67.1 miles, within the Nanticoke
EROSION CRITERION APPLIED TO A SHORELINE ADJACENT TO A COASTAL INLET
 EROSION CRITERION APPLIED TO A SHORELINE ADJACENT TO A COASTAL INLET By Brian Batten and Henry Bokuniewicz Marine Sciences Research Center State University of New York Stony Brook, New York 11794-5000
CHAPTER 8 ASSESSMENT OF COASTAL VULNERABILITY INDEX
 124 CHAPTER 8 ASSESSMENT OF COASTAL VULNERABILITY INDEX 8.1 INTRODUCTION In order to assess the vulnerability of the shoreline considered under this study against the changing environmental conditions,
CHAPTER 148. Abstract
 CHAPTER 148 Abstract STATISTICALLY SIGNIFICANT BEACH PROFILE CHANGE WITH AND WITHOUT THE PRESENCE OF SEAWALLS. David R. Basco 1, Douglas A. Bellomo 2, and Cheryl Pollock 3 The interaction of beaches and
Activity #1: The Dynamic Beach
 Activity #1: The Dynamic Beach Beach Profiling By Betsy Sheffield, COASTeam Program, College of Charleston, Charleston, SC Subjects: Science, Math Skills: Analysis, description, listing, research, small
Texas passes, longshore transport, hurricanes, beach erosion and sea level
 Texas passes, longshore transport, hurricanes, beach erosion and sea level Richard L. Watson, Ph.D. (361) 749-4152 Field work can be strange! 120,000 years of sea level Years each zone exposed above S/L
Figure79. Location map for the 10 NJBPN profile sites in Atlantic County, NJ 155
 154 Figure79. Location map for the 10 NJBPN profile sites in Atlantic County, NJ 155 ATLANTIC COUNTY SPRING 2009 to FALL 2010 The Atlantic County coastline consists of three barrier islands. Between Little
SURFACE CURRENTS AND TIDES
 NAME SURFACE CURRENTS AND TIDES I. Origin of surface currents Surface currents arise due to the interaction of the prevailing wis a the ocean surface. Hence the surface wi pattern (Figure 1) plays a key
A Summary of the 2017 State of Maine s Beaches Report
 Maine Geologic Facts and Localities July, 2017 A Summary of the 2017 State of Maine s Beaches Report William Van Benthuysen, Kennebunkport, Maine Text by Peter A. Slovinsky, Department of Agriculture,
CLAM PASS RESTORATION AND MANAGEMENT PLAN BATHYMETRIC MONITORING REPORT NO. 7 Including Interior Bay Dredge Cuts and Tidal Data
 CLAM PASS RESTORATION AND MANAGEMENT PLAN BATHYMETRIC MONITORING REPORT NO. 7 Including Interior Bay Dredge Cuts and Tidal Data Submitted to: Florida Department of Environmental Protection DEP File No.
Figure 106. Locations of the 28 NJBPN profile stations in Ocean County, NJ.
 130 Figure 106. Locations of the 28 NJBPN profile stations in Ocean County, NJ. 131 2016-2017 Beach Fills in Ocean County: The federal/state/local storm damage reduction project (beachfill) between Manasquan
OFFICE OF STRUCTURES MANUAL FOR HYDROLOGIC AND HYDRAULIC DESIGN CHAPTER 11 APPENDIX B TIDEROUT 2 USERS MANUAL
 OFFICE OF STRUCTURES MANUAL FOR HYDROLOGIC AND HYDRAULIC DESIGN CHAPTER 11 APPENDIX B TIDEROUT 2 USERS MANUAL APRIL 2011 APRIL 2011 Page 1 Preface TIDEROUT 2, Build 1.22 dated June 29, 2006 is the current
Boothbay Harbor Rotary Club May 12, 2016
 Mapping Potential Sea Level Rise and Storm Surge in Boothbay Harbor, ME Boothbay Harbor Rotary Club May 12, 2016 Peter A. Slovinsky, Marine Geologist Maine Geological Survey S.M. Dickson, MGS Quickly,
Evaluation of June 9, 2014 Federal Emergency Management Agency Flood Insurance Study for Town of Weymouth, Norfolk, Co, MA
 Evaluation of June 9, 2014 Federal Emergency Management Agency Flood Insurance Study for Town of Weymouth, Norfolk, Co, MA Prepared For: Woodard & Curran 95 Cedar Street, Suite 100 Providence, RI 02903
New Jersey Beach Profile Network Atlantic County Profile Site Locations
 215 RICHARD STOCKTON COLLEGE OF NEW JERSEY New Jersey Beach Profile Network Atlantic County Profile Site Locations COASTAL RESEARCH CENTER Figure 128 There are nine NJBPN survey sites on the Atlantic County
BEACH PROCESSES AND COASTAL ENVIRONMENTS
 BEACH PROCESSES AND COASTAL ENVIRONMENTS COASTAL FEATURES Cross section Map view TOPICS: Terminology Waves Beach Morphology Barriers Coastal Migration Tides Tidal Flats and Marshes Sediment Budgets Human
Lecture Outlines PowerPoint. Chapter 15 Earth Science, 12e Tarbuck/Lutgens
 Lecture Outlines PowerPoint Chapter 15 Earth Science, 12e Tarbuck/Lutgens 2009 Pearson Prentice Hall This work is protected by United States copyright laws and is provided solely for the use of instructors
2016 NC Coastal Local Governments Annual Meeting
 2016 NC Coastal Local Governments Annual Meeting Coastal Flood Study Modeling and Mapping 101 April 21, 2016 Tom Langan, PE, CFM Engineering Supervisor NCEM Floodplain Mapping Program FEMA Coastal Flood
ENVIRONMENT AGENCY GREAT OUSE AND 100 FT DRAIN QUARTERLY BATHYMETRIC SURVEY DECEMBER 2013 SITE SURVEY REPORT NO. H6787
 ENVIRONMENT AGENCY GREAT OUSE AND 100FT DRAIN QUARTERLY BATHYMETRIC SURVEY DECEMBER 2013 NO. H6787 LONGDIN & BROWNING (SURVEYS) LIMITED CHERRY TREE HOUSE CARMARTHEN ROAD SWANSEA SA1 1HE H6787 1 Measured
National Shoreline Erosion Control Demonstration Program Overview
 National Shoreline Erosion Control Demonstration Program Overview William R. Curtis 1 (Phone: (601) 634-3040, Fax: (601) 634-3080, CURTISW@wes.army.mil), Joan Pope 1 (Phone: (601) 634-3040, Fax: (601)
Wade Reynolds 1 Frank Young 1,2 Peter Gibbings 1,2. University of Southern Queensland Toowoomba 4350 AUSTRALIA
 A Comparison of Methods for Mapping Golf Greens Wade Reynolds 1 Frank Young 1,2 Peter Gibbings 1,2 1 Faculty of Engineering and Surveying 2 Australian Centre for Sustainable Catchments University of Southern
Julebæk Strand. Effect full beach nourishment
 Julebæk Strand Effect full beach nourishment Aim of Study This study is a part of the COADAPT funding and the aim of the study is to analyze the effect of beach nourishment. In order to investigate the
DUXBURY WAVE MODELING STUDY
 DUXBURY WAVE MODELING STUDY 2008 Status Report Duncan M. FitzGerald Peter S. Rosen Boston University Northeaster University Boston, MA 02215 Boston, MA 02115 Submitted to: DUXBURY BEACH RESERVATION November
BEACH NOURISHMENT COMBINED WITH SIC VERTICAL DRAIN IN MALAYSIA. Claus Brøgger 1 and Poul Jakobsen 2
 BEACH NOURISHMENT COMBINED WITH SIC VERTICAL DRAIN IN MALAYSIA. Claus Brøgger 1 and Poul Jakobsen 2 The present paper presents measurements and results from a three year full scale Pilot Project with the
General Coastal Notes + Landforms! 1
 General Coastal Notes + Landforms! 1 Types of Coastlines: Type Description Primary Coast which is essentially in the same condition when sea level stabilized Coastline after the last ice age, younger.
Shorelines Earth - Chapter 20 Stan Hatfield Southwestern Illinois College
 Shorelines Earth - Chapter 20 Stan Hatfield Southwestern Illinois College The Shoreline A Dynamic Interface The shoreline is a dynamic interface (common boundary) among air, land, and the ocean. The shoreline
Assateague Island National Seashore North End Restoration Project Timeline
 Assateague Island National Seashore North End Restoration Project Timeline Date Event Some information provided in the Project Introduction document. Detailed events are available in a timeline compiled
First Year Morphological Evolution of an Artificial Berm at Fort Myers Beach, Florida
 University of South Florida Scholar Commons Geology Faculty Publications Geology 1-2012 First Year Morphological Evolution of an Artificial Berm at Fort Myers Beach, Florida Katherine Brutsche University
Chapter 20 Lecture. Earth: An Introduction to Physical Geology. Eleventh Edition. Shorelines. Tarbuck and Lutgens Pearson Education, Inc.
 Chapter 20 Lecture Earth: An Introduction to Physical Geology Eleventh Edition Shorelines Tarbuck and Lutgens The Shoreline: A Dynamic Interface The Coastal Zone The shoreline is constantly modified by
Shore - place where ocean meets land Coast - refers to the larger zone affected by the processes that occur at this boundary.
 Waves, Beaches, and Coasts Shore - place where ocean meets land Coast - refers to the larger zone affected by the processes that occur at this boundary. Waves: energy moving through water The height of
CMS Modeling of the North Coast of Puerto Rico
 CMS Modeling of the North Coast of Puerto Rico PRESENTED BY: Dr. Kelly Rankin Legault, Ph.D., P.E. 1 Dr. Alfredo Torruella, Ph.D. 2 1 USACE Jacksonville District 2 University of Puerto Rico October 2016
Techniques for Measuring and Analyzing Inlet Ebb-Shoal Evolution
 US Army Corps of Engineers Coastal Engineering Technical Note IV-13 Techniques for Measuring and Analyzing Inlet Ebb-Shoal Evolution by Donald K. Stauble PURPOSE: The Coastal Engineering Technical Note
STORM RESPONSE SIMULATION
 APPENDIX V STORM RESPONSE SIMULATION Final Environmental Impact Statement Village of Bald Head Island Shoreline Protection Project Brunswick County, North Carolina Delft3D Storm Response Simulations With
WIND SPEED LENGTH OF TIME WIND BLOWS (Duration) DISTANCE OVER WHICH IT BLOWS (Fetch)
 DISTANCE OVER WHICH IT BLOWS (Fetch)") WAVES Up and down movement of ocean surface Transportation of energy across the water over vast distances If not stopped by anything, waves can travel entire oceans Size and speed depend upon: WIND SPEED
WAVES Up and down movement of ocean surface Transportation of energy across the water over vast distances If not stopped by anything, waves can travel entire oceans Size and speed depend upon: WIND SPEED
The Composition of Seawater
 The Composition of Seawater Salinity Salinity is the total amount of solid material dissolved in water. Most of the salt in seawater is sodium chloride, common table salt. Element Percent Element Percent
STATUS REPORT FOR THE SUBMERGED REEF BALL TM ARTIFICIAL REEF SUBMERGED BREAKWATER BEACH STABILIZATION PROJECT FOR THE GRAND CAYMAN MARRIOTT HOTEL
 August 23 STATUS REPORT FOR THE SUBMERGED REEF BALL TM ARTIFICIAL REEF SUBMERGED BREAKWATER BEACH STABILIZATION PROJECT FOR THE GRAND CAYMAN MARRIOTT HOTEL performed by Lee E. Harris, Ph.D., P.E. Consulting
Nearshore Dredged Material Placement Pilot Study at Noyo Harbor, CA
 1 Nearshore Dredged Material Placement Pilot Study at Noyo Harbor, CA Noyo Cove N 2011 National Conference on Beach Preservation Technology 9-11, February 2011 Lihwa Lin, Honghai Li, Mitchell Brown US
CALCASIEU SALINITY STRUCTURES. HYDRODYNAMIC MODELING (To Support Design of Salinity Barriers)
") CALCASIEU SALINITY STRUCTURES HYDRODYNAMIC MODELING (To Support Design of Salinity Barriers) Presentation Overview 1 2 3 4 5 Project Overview and CEA Circulation Modeling Vessel Hydrodynamics Modeling
CALCASIEU SALINITY STRUCTURES HYDRODYNAMIC MODELING (To Support Design of Salinity Barriers) Presentation Overview 1 2 3 4 5 Project Overview and CEA Circulation Modeling Vessel Hydrodynamics Modeling