Minor changes. Updated for comments. Issued to inform
|
|
|
- Derek Weaver
- 6 years ago
- Views:
Transcription


1
2 Minor changes Updated for comments Issued to inform
3 Early November 2015 two weeks of 3D scale model tests have been carried out at MARIN s Offshore Basin, one of the worlds most renowned test facilities for floating structures. With the test setup it was possible to simulate barrier lengths of up to 3600m using a prototype length of 360m long, with a scale of approximately 1/18, leading to a scale model of approximately 20m long. Tests were conducted mostly in regular waves, as the response in these waves enables to efficiently understand the system dynamic characteristics and load response. Also a number of irregular wave tests have been carried out; one test that closely resembles a Pacific Ocean sea state, with long waves and relatively mild current, and one test that is similar to a North Sea storm condition, governed by short and steep waves with high current. In order to learn as much as possible about the system, various configurations are tested: a low, high and secondary mooring concept. This indicates the location of the tension wire in the system: placed underneath the floater, at the ballast weight location or externally, i.e. by usage of an external subsea wire. Furthermore, the high mooring concept has been tested for increased pretensions, in order to simulate a boom much longer than the actual barrier in the tank. By considering the model as a section of a virtually longer barrier span, the loads for this virtual barrier can be derived by simulating the loads of the adjoining structures by increased pretension in the mooring lines. This report presents the main results and findings from this test campaign, which was the first model testing campaign of its kind; with a 3D floating barrier subject to waves and currents from various directions. Before the tests were carried out there were many unknowns with respect to the 3D motions of the barrier. For instance, how the system performs in waves: do waves run over the barrier (overtopping)? Do gaps appear underneath the screen (bridging)? Measurements from the various tests are used to: 1. Study the: a. Hydrodynamic Response of a floating barrier system b. Plastic capturing efficiency (bridging and overtopping occurrences) 2. Calibrate and validate numerical models This report focusses on understanding the physics of the system, such that in a numerical environment parametric variation leading to an optimized design can be performed. As such, even though no extreme Pacific storm has been carried out (this was not feasible in the basin), the situation can be accurately modelled. The three mooring configurations behave in terms of hydrodynamics highly similar, especially in waves. In high current velocities, the low mooring and secondary mooring boom are subjected to higher loads than the high mooring. The most important finding of tests is that loads in waves are lower than what was expected. By smart engineering the forces in a Pacific Ocean barrier in storm conditions can be kept lower than expected,
4 reducing the amount of mooring lines required and greatly impacting the costs. In order to realize this, the system has to be flexible. A flexible system can move along with the 2D wave surface and governing loads are caused by current. Even more so, a flexible system will also show less overtopping and bridging. It is therefore highly recommended that the tension member of the Pacific array in a high or low mooring system is made out of stretchable material such as Polyester or Nylon. The system responds excellent in long waves: no bridging and overtopping is observed and loads are mild. In the Pacific Ocean 97.5% of the waves are long, promising high workability of the Pacific array. The wave loading can be decomposed in a low, wave and high frequent component. The low frequent phenomena cause the highest loads and is more dominant in low pretensions. It oscillates with a much lower frequency than the wave frequency. Two types of low frequency motions are observed: transient motions during wave build-up, and low frequent motions in irregular sea states. Wave frequent loads remain low, even in higher pretensions. At a certain threshold the system cannot flexibly follow the waves anymore and wave frequent loads increase. Even though these loads were found to be higher for the highest pretension, relative to the current load they are small. A high frequent component (at twice or three times the wave frequency) is observed in all configurations. It is thought to be caused by a pitching motion (rotation about the length axis) of the floater. The magnitude of this component is relatively low: in some cases equal to the wave frequent component, but in most lower. Even though the magnitude is low, due to the high frequency it may cause local fatigue damage. This effect should be investigated, it may be mitigated by installing an additional tension wire on top of the floater. Effects such as the low frequent and transient motion, which cause high loads and offsets, or the high frequent pitch, have not been found as such in numerical simulations. The model test campaign has shown to be of key importance in understanding the dynamics of a floating barrier. Furthermore, the results provide confidence in further strengthening the feasibility of an ultra-long floating barrier type of artificial coastline in the Pacific Ocean, in order to retrieve ocean plastics.
5 Table of Contents
6
7 List of Figures Figure 1-1: Great Pacific Garbage Patch Location Figure 1-2: Artist Impression of Ocean Cleanup Barrier Figure 1-3: The Effects of Ocean Plastic Waste to Marine Life Figure 1-4: Tank conventions Figure 1-5: Model axis convention Figure 2-1: Cross section model Figure 2-2: High mooring configuration Figure 2-3: Low mooring configuration Figure 2-4: Secondary mooring configuration Figure 2-5: Cross section secondary mooring configuration Figure 2-6: High mooring concept with instrumentation Figure 2-7: Location of wave and current measurement sensors during calibration Figure 4-1: Example frequency domain plot Figure 4-2: Example fluid velocity Figure 4-3: Expected response to a regular wave Figure 4-4: Spectral density of system excursion and Morison load in a regular wave Figure 4-5: System excursion and Morison force in two regular waves Figure 4-6: Spectral density of system excursion and Morison load in two regular waves Figure 4-7: Example of bridging and overtopping Figure 4-8: Quasi-static vertical load component in system under pretension Figure 4-9: Quasi-static vertical load component in system under pretension for a Stokes wave Figure 4-10: Bridging or overtopping expected behaviour example for a single system configuration. 35 Figure 5-1: 0.3m/s current calibrated time signal (upper) and energy density (lower) Figure 5-2: 1.0m/s current calibrated time signal (upper) and energy density (lower) Figure 5-3: Regular wave modelling Figure 5-4: 225 and 270 degrees SLS wave cases (blue measured and red theoretical) Figure 5-5: 225 and 270 degrees ULS wave cases (blue measured and red theoretical) Figure 5-6: Wave spectra at various locations and fluid velocity (REF) for ULS 225 sea state Figure 5-7: Decline in fluid velocity (REF) for SLS 225 case Figure 5-8: Centre displacement for all configurations Figure 5-9: Starboard and port side mean tension for all configurations Figure 5-10: Transverse load due to current (total) Figure 5-11: Unit load (transversal load normalized with span) Figure 5-12: Drag coefficient (constant area assumption) Figure 5-13: 270 degree (parallel to system) regular wave spectral density plots: filter placed at 1.5 rad/s Figure 5-14: Horizontal motion snapshot for 0.3 and 1.0 m/s current cases (equal wave conditions).. 48 Figure 5-15: Surge motion time trace of high mooring low pretension regular wave test Figure 5-16: Low pass surge for high mooring low pretension 3m waves in 0.3 m/s current... 50
8 Figure 5-17: Low pass surge for high mooring low pretension 6m waves in 0.3 m/s current Figure 5-18: H6 T deg surge for different configurations Figure 5-19: H6 T deg surge for different configurations (normalized for starting position to see differences between configurations) Figure 5-20: H6m T6.5s 225 deg surge for different configurations Figure 5-21: H6m T6.5s 225 deg surge for different configurations (normalized for starting position) 52 Figure 5-22: Maximum surge motion for high mooring low pretension cases Figure 5-23: Transient motion maximum Figure 5-24: Surge wave frequent response Figure 5-25: Surge high frequent (twice the wave frequency) response Figure 5-26: Wave frequent surge response for various configurations in 0.3 m/s current Figure 5-27: Wave frequent surge response for various configurations in 1.0 m/s current Figure 5-28: Transient motions in 0.3 m/s current Figure 5-29: Transient motions in 1.0 m/s current Figure 5-30: Starboard wave frequent accelerations in x-direction Figure 5-31: Starboard high frequent (twice the wave frequency) accelerations in x-direction Figure 5-32: Wave frequent sway motion Figure 5-33: High frequent (twice the wave frequency) sway motion Figure 5-34: Wave frequent accelerations in boom direction Figure 5-35: High frequent (twice wave frequency) accelerations in boom direction Figure 5-36: Pitch motion of centre cross section Figure 5-37: Time trace of pitch motion for test (H3m, T5.2s, 270deg) Figure 5-38: Mean pitch angle (high mooring, low pretension) Figure 5-39: Mean pitch angle (low mooring, low pretension) Figure 5-40: Wave frequent pitch amplitude (high mooring, low pretension) Figure 5-41: High frequent pitch amplitude (high mooring, low pretension) Figure 5-42: High frequent pitch amplitude for all configurations in 0.3m/s current Figure 5-43: High frequent pitch amplitude for all configurations in 1m/s current Figure 5-44: Unit load for H6 T6.5 deg Figure 5-45: Unit load for H6 T6.5 deg225 (filtered and normalized to start at zero) Figure 5-46: Unit load for H6 T7.3 deg Figure 5-47: Unit load for H6 T7.3 deg180 (filtered and normalized to start at zero) Figure 5-48: Transverse wave frequent load component (high mooring low pretension) Figure 5-49: Transversal high frequent load component (twice the wave frequency, high mooring low pretension) Figure 5-50: Wave frequent transverse load in 0.3 m/s current for various configurations Figure 5-51: Transverse load in 0.3 m/s as a function of the relative wave velocity squared Figure 5-52: Wave frequent transverse load in 1.0 m/s current for various configurations Figure 5-53: Transverse load in 1.0 m/s as a function of the relative wave velocity squared Figure 5-54: Transient transverse peak load in 0.3 m/s current... 71
9 Figure 5-55: Transient transverse peak load in 1.0 m/s current Figure 5-56: Wave frequent unit load amplitude in 0.3 m/s current for various configurations Figure 5-57: Wave frequent unit load amplitude in 1.0 m/s current for various configurations Figure 5-58: High frequency amplitude in port side mooring line Figure 5-59: Low frequent subsea mooring wire load time traces (225&180 deg waves) Figure 5-60: Wave frequent tension in port side part of submerged mooring line Figure 5-61: High frequent (twice wave frequency) tension in port side part of submerged mooring line Figure 5-62: Time trace of secondary mooring lines tension (0.3 m/s current, 6m 7.3s 225 deg waves) Figure 5-63: Spectral density load (0.3 m/s current, 6m 7.3s 225 deg waves) Figure 5-64: Low frequent load of secondary mooring line 5 time traces (225&180 deg waves)...77 Figure 5-65: Secondary mooring line linear amplitude (0 m/s current)...77 Figure 5-66: Secondary mooring line linear amplitude (0.3 m/s current) Figure 5-67: Secondary mooring line linear amplitude (1.0 m/s current) Figure 5-68: Secondary mooring high freq. amplitude (0 m/s current) Figure 5-69: Secondary mooring high freq. amplitude (0.3 m/s current) Figure 5-70: Secondary mooring high freq. amplitude (1.0 m/s current) Figure 5-71: Snapshot of test showing both bridging and overtopping Figure 5-72: Typical time trace loads in springs Figure 5-73: Spectral density of load signal (left) and input wave spectrum (right) ULS 225 degrees high mooring setup Figure 5-74: Time trace of starboard unfiltered load, on the left the transient ramp-up time and on the right the filtered signal including selected peaks Figure 5-75: Extreme value fit with 95% confidence interval Figure 5-76: Surge motion significant values, including mean current contribution Figure 5-77: Surge motion significant values, current contribution removed Figure 5-78: Comparison of displacement contributions: mean, low, wave and high frequency Figure 5-79: Time trace of pitch motion of test (high mooring, high ballast, medium pretension, ULS 225 deg) Figure 5-80: 3hr MPM (low frequency) of port and starboard side loads Figure 5-81: Load contributions (port side) Figure 5-82: Normalized loads (port side) Figure 5-83: Fitted MPM and extrapolated 3hr MPM of low frequent transverse load Figure 5-84: Transverse load contributions Figure 5-85: Relative transverse loads Figure 5-86: Time trace of secondary mooring line 3 and 6 in 225deg ULS Figure 5-87: Significant amplitude of secondary mooring lines Figure 5-88: Load components of highest loaded line (number 3) Figure 5-89: Load components of port side subsea tension line... 92
10 Figure 5-90: Comparison of mean (including pretension) and low frequent 3 hour MPM of subsea mooring line tension Figure 5-91: High mooring (low pretension) 270 deg ULS Figure 5-92: Low mooring 270 deg ULS Figure 5-93: Secondary mooring 270 deg ULS Figure 6-1: Rough load component ratio in a transient and steady state (irregular seas 1m/s and 6m Hs) condition Figure 7-1: High mooring low pretension 225 deg ULS Figure 7-2: High mooring med pretension 225 deg ULS Figure 7-3: High mooring high pretension 225 deg ULS Figure 7-4: Low mooring 225 deg ULS Figure 7-5: Secondary mooring 225 deg ULS List of Tables Table 2-1: Main dimension properties Table 2-2: System mechanical properties Table 2-3: Pretensions used in model test Table 2-4: Overview of current cases Table 2-5: Irregular wave parameters Table 2-6: Regular wave parameters Table 5-1: Regular wave calibration summary Table 5-2: Irregular wave calibration summary Table 5-3: Quality of realized wave spectra at various locations Table 5-4: Overtopping and bridging events in irregular waves Table 6-1: Configuration hydrodynamic response performance Table 6-2: Configuration plastic holding performance Table 6-3: Pretension hydrodynamic performance Table 6-4: Pretension plastic holding performance... 99
 in 2020.")

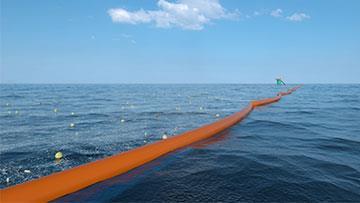
11 The Ocean Cleanup (TOC) is developing a permanent floating barrier, to extract harmful plastic debris from the ocean. The aim of TOC is to install a barrier in the great pacific garbage patch (Figure 1-1) in Plastic that doesn t beach ends up in one of the five patches, the biggest patch today is found in the Pacific gyre. The system is a passive system that relies on the mean surface current to intercept plastics in the top level of the ocean, see Figure 1-2. This way, substantial amounts of plastic can be removed. This way the system acts as an artificial coastline. It is, as for today, not yet possible to give an accurate estimation of the total amount of plastics that can be removed as this is determined by: the total mass of the great pacific garbage patch, the distribution of the debris over the sea surface and the efficiency of the boom. The problem is widely acknowledged, as the consequences for coastal communities, the ecosystem, marine life and shipping become more and more visible. Examples of the impact of plastics for marine species are given in Figure 1-3.


12
13 A key aspect to designing of a permanently moored floating barrier is understanding of the hydrodynamic forces that act on such a flexible system. Previously, model testing has been carried out for a simplified 2D boom at Deltares. However, 3D aspects play a crucial role in the motions and loads occurring in a barrier subjected to current and waves. There exists very limited literature on this subject, as no other mission of this scale 100 km long system moored at least 10 years has been performed. Particularly challenging in terms of hydrodynamics, is that the motions of the barrier disturb the flow, which then again influences the system: the fluid and structure are strongly coupled. In order to better understand this phenomenon, multiple configurations of a floating barrier have been tested at MARIN s Offshore Basin. This basin provides dimensions that can accommodate a 360m section at a scale of 1:18 and has good possibilities to generate different current speeds and wave conditions from different directions. This document presents measurements and more important interpretation of these results: The tension in the boom in transverse current and varying wave parameters The forces in the suspension points The gaps (bridging and overtopping) between boom and water surface Tests have been carried out for three different configurations: a high, low and secondary mooring. In the first the system is suspended right underneath the cylindrical floater where a tension line runs, in the second the ballast weight is used for this purpose. The secondary mooring system decouples the high loads in current from the dynamic wave induced loads, by having a secondary subsea tension member that connects to the screen at multiple locations. Furthermore, by subjecting the system to a pretension, the barrier behaves as it was part of a much longer system, enabling the possibility to simulate a barrier of more than 2 km with only 360 m boom in the basin. Lastly, the mooring system is not considered in these tests, as it is not possible to have a scaled 4 km mooring system in the basin and more importantly: the mooring design is not sufficiently mature for model testing. This test focusses on flexible barrier hydrodynamics. The model tests provide understanding of the response of a barrier in waves and current and also serves to calibrate and validate the numerical hydrodynamic models that are being developed to design the barrier and its mooring system. Calibrated models are key to designing a permanent system, as they ensure various sea states can be simulated in order to determine governing loads and motions, which determine the design of the system. The Ocean Cleanup Wave and Current Load Model Tests, OB-2.0

14 Tank conventions are provided in Figure 1-4. Boom
15 Model axes conventions are shown in Figure 1-5. Port side corresponds with the upper part of Figure 1-4 (positive surge points towards the current outlet, sway towards the wave maker side of the basin). Barrier motions are expressed relative to any point on the floater (as the system is flexible and deforms consequently). In the figure above, the six (6) motion components are indicated as follows: surge x: translation along x-axis, positive in positive x direction sway y: translation along y-axis, positive in positive y direction heave z: translation along z-axis, positive in positive z direction roll φ : rotation around x-axis, positive with positive y down pitch θ: rotation around y-axis, positive with positive x down yaw ψ: rotation around z-axis, positive x to portside

 of the barrier (floater diameter, screen length, etc.")
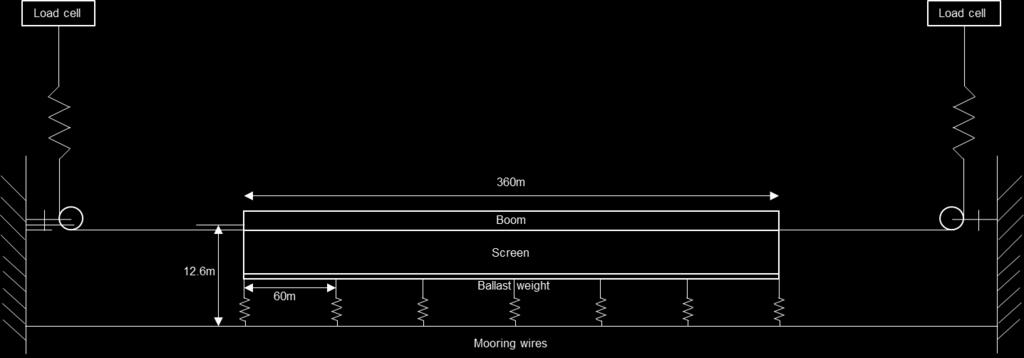
16 Three mooring layout or system setups have been tested. The barrier design remains equal, consisting of a flexible floater, a screen and a ballast weight. A schematic cross section of the boom is provided in Figure 2-1. The main dimensions (prototype scale) of the barrier (floater diameter, screen length, etc.) are provided in Table 2-1. The barrier is scaled by Froude law, at a geometric scale of 18.8.
17 s Three different suspensions will be tested: 1. High suspension: on both ends of the boom a connection is made, with the suspension point at the screen/floater connection point. 2. Low suspension: also on both ends of the boom, however the suspension point is in this case the ballast chain/wire. 3. Secondary suspension: an extra tension cable is suspended to which the lower end of the boom is connected with a cable, every other 60m. Schematic representations of these three models are presented on the following pages. The distance from the suspension points that are mounted to the basin carriage is also provided in these figures.
18 Load cell Load cell Boom Screen Ballast weight 25m 360m 25m Load cell Load cell Boom Screen Ballast weight 25m 360m
19
20 Mechanical properties of the system can be found in Table 2-2, taken from reference [ER.1]. F S TC BW F S BW 2 T F S BW T s ss sm The system is setup such that the bending stiffness is as low as reasonably possible for multiple reasons. Bending stiffness scales with the scale parameter to the power five. It is very difficult to specify a realistic material to accurately model the flexible boom. Another reason is that the material that will be used for the floater and other components is still unknown. Axial stiffness in the tension cable is very large; the actual axial stiffness of the system is modelled with the two springs on both sides of the model (see previous section). The axial stiffness of other components other than the tension cable is low in comparison. Note that the spring stiffness given in Table 2-2 is the spring stiffness of an individual spring. The total system stiffness is given by:
21 F = EA L x = 2k s x One spring k s models half of the total system axial stiffness EA L. As described in the previous chapter, by introducing pretension effectively the modelled segment becomes part of a bigger system. This has been validated using numerical tools. Table 2-3 provides three lengths of the total section for which the pretension has been computed. Note that this only holds for high/low mooring, as the secondary mooring interval will be sufficiently small, such that loads are transferred often and mean tension remains low. The following properties are measured with respective sensors positioned on the model: Displacement (position): 3 DoF optic position measurements are taken on five points on the mid-section of the model. Accelerations: 3&6 DoF accelerations measurements by accelerometers and gyrometers. Loads: on both sides of the mooring connections of the barrier (3 DoF) and in the secondary mooring lines (1 DoF) loads are measured. Angles: the planar orientation of the pulleys that guide the mooring wire to the model is measured with a potentiometer. Figure 2-6 shows the location of the sensors in the high mooring concept. In the low mooring concept the only change is the connection point of the mooring lines. Note that the secondary mooring lines of the third concept are not shown in this figure.
22 The mid segment, that contains most of the sensors, is consequently heavier. This addition is significant and shall be considered in the validation of the numerical models. Furthermore, a number of wires run from all these sensors to the carriage, suspended in a catenary to the downstream side of the model. The wires are partly suspended in the water. It is expected that the cables exert small disturbances to the motions of the barrier. The wave and current sensors are placed close to the location of the model. Four more wave sensors are used in order to calibrate phases of the two wave maker sides for the oblique waves. These sensors are not shown here, as they were only used to correct phases and not amplitudes. All other sensors are presented in Figure 2-7.

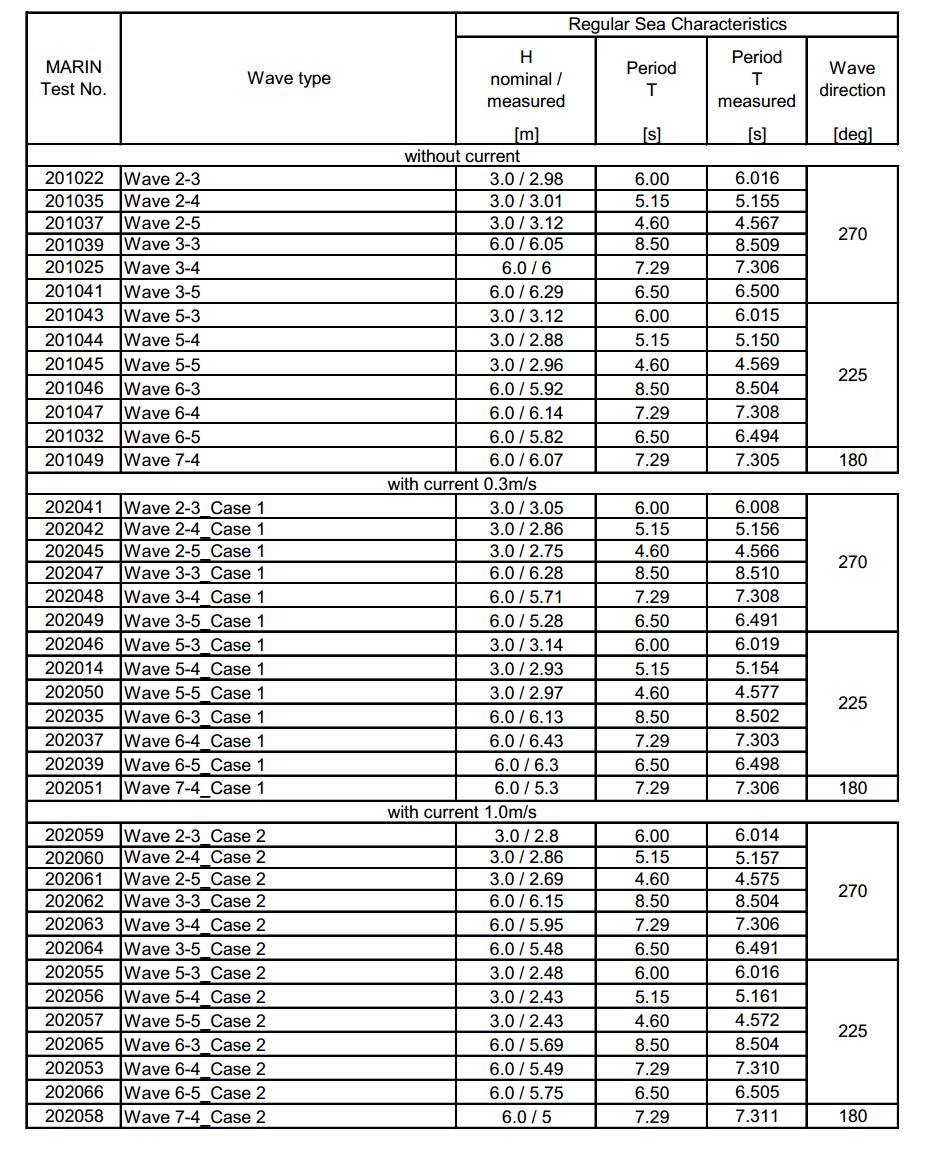
23 Tests are carried out in current and waves. Two types of waves are tested: regular and irregular waves. Regular waves resemble most a simple sinusoidal waves with a single amplitude and wave length/period. These types of waves do not exist on the ocean, but enable the hydrodynamics of the system to be understood much better. Irregular waves resemble sea states and can be thought to exist of infinite sinusoidal wave components. Two different current cases will be tested, all having the same relative direction to the model: perpendicular to the boom. An extreme current speed is taken, in order to amplify any unexpected behaviour, this velocity is expected to occur in the North Sea in a five year storm, but in the Pacific Ocean such a speed will not be observed. Also a relatively low current velocity is tested, which is somewhat
24 higher than the day-to-day velocity in the Pacific: a too low speed leads to a high noise/error ratio and is furthermore difficult to produce in the tank. An overview is provided in Table 2-4. The system is tested in a number of irregular sea states. Sea state parameters and corresponding current conditions are provided in Table 2-5. Note that the ULS resembles a North Sea storm conditions, and the SLS the longer swell waves that one would encounter in the Pacific. The steep waves of the ULS are very unlikely to be encountered in the Pacific Ocean. This condition was with the relatively large scale of tests the maximum wave height that could be generated.
25 In order to find linear system response, and bridging and overtopping characteristics, a number of regular wave tests are performed. The wave heights, periods, directions and steepness are given in Table 2-6. During testing it was decided to limit the number of regular wave tests, as in the longer regular waves response was predictable the system followed the waves well. An overview of load cases can be found in Appendix B -.
26 The tests to be carried out are: Decay tests (in surge only, by giving the model an initial displacement) Current load tests (no waves) Regular wave tests (combined with current) Irregular wave tests (combined with current) The order of the tests is as follows: Static load tests (in order to test sensors) Decay tests (surge) Current tests (no waves) with velocities (0.3 & 1.0 m/s as per Table 2-6) as per Table 2-4. Regular waves with no current (wave ID 5-4, 6-4 and 7-4) 13 Regular waves from Table 2-6 with the 2 current velocities from Table 2-6. In total 26 tests. Irregular wave tests with currents as described in Table 2-6. The test program is to be carried out with three configurations: High mooring with three pretensions and low spring stiffness Low mooring with pretension corresponding to 360m and low spring stiffness Secondary mooring with pretension corresponding to 360m The total test programme is presented in Appendix B -.Not all cases have been carried out due to time restrictions. For instance the high mooring with high pretension is not tested in 0.3 m/s currents. Furthermore, the highest pretension was not realized due to time constraints: a value of approximately 880 kn instead of 1600 kn was realized.
27 In the post-processing of the results use is made of Fourier transforms, to transform the measured signals into the frequency domain. This is relevant, as it shows at which frequencies a response is present and the magnitude of said response. For instance, moored tankers show a large low-frequent response outside of the wave spectra frequencies. This indicates non-linearity, in this case low-frequent drift due to a structure s ability to cause waves. Figure 4-1 shows an example frequency domain plot, where three signals are shown which shown a peak at approximately 0.8 rad/s, which is also the wave frequency. A small peak can be seen at twice the wave frequency, indicating a second order harmonic. Filtering can be performed in the frequency domain, cutting of certain bands of frequencies. In regular sea states amplitudes can be computed straight forward: amplitudes and mean values can be identified. In irregular sea states, this is not the case. The maximum event corresponds to the realization of the spectrum that was used in the tank. Running a different realization, yields a different extreme. Therefore statistical values are used: significant values and most probable maxima (MPM) that correspond to the duration of a sea state, commonly three hours. Most probable maximum values are calculated by using a Peak Over Threshold (POT) method. In this method individual peaks are identified (one peak per certain cycle, a peak period or mean zero crossing
28 period for instance). The peaks are identified if they are over a certain threshold, and a distribution model is fitted; in this case the most general distribution, the Generalized Pareto. In the tank the irregular test was limited to one hour, to safe time. The distribution is fitted over the extremes in this duration and extrapolated to a three hour maximum. As the floating barrier is small with respect to the wave length, it can be expected to behave as a Morison element. Morison s equation describes the forces exerted by a flow on a structure and exists of quadratic drag and linear added mass/inertia: F = ρc M Vu ρc DAu u Where the first term denotes the inertia part and the second a drag term. Furthermore: ρ is the density C M is the inertia coefficient V denotes the volume u is the derivative of the flow velocity u C D is the drag coefficient A reference area of drag The system thus responds to the fluid velocity. Therefore it is important to know local particle velocity. The velocity is measured on a fixed location, below the water line. We expect the horizontal velocity components of a regular wave to be fairly of the same characteristic, except if a current is present which should lead to a mean increase. The horizontal velocities are written as follows, assuming linear Airy wave theory and deep water: u x = A(z, ω, U) cos(kx ωt) With A = a k (ω ku) e kz Where a is the wave amplitude, k the wave number, ω the wave frequency, U current velocity, x and z the respective horizontal and vertical fixed position, and t the time. Based on this, we would expect the local velocity in a point located slightly below the free surface, to take the shape as shown in Figure 4-2.
29 Consequently it is expected that the response shows similar characteristics. Low frequent response can be expected, although not in the conventional form of drift. It is unlikely that this system reflects waves that are so much longer than the diameter of the boom and especially due to its flexible nature. However, a non-linear term is present in the waves: Stokes drift. Stokes drift is a constant velocity that a fluid particle experiences, in line with the wave heading. This velocity is as a function of the frequency, for a regular Airy wave the Stokes drift reads: u S ωka 2 e 2kz In the derivation of this results, higher order terms have been neglected. In irregular seas this will lead to a slowly varying velocity, superimposed of all component loads. In order to prove this statement, a numerical experiment is carried out. The Morison equation is solved for a light object with high drag and low stiffness. At the instantaneous position the velocity and acceleration of wave particles is used to calculate loading on the boom. Note that merely a single DoF system is solved, which can be thought to be a 2D boom, neglecting 3D effects. The equation is solved in the time domain using the Newmark-beta method for time integration. First one wave is taken into consideration, leading to the excursion as shown in Figure 4-3.
30 A transient motion is seen, leading to a steady state response. The transient motion originates from Stokes drift. The spectral response of the excursion and Morison load is shown in Figure 4-4. Higher order harmonics are seen: notably the largest at three time the wave frequency.
31 Now a simulation is carried out with two waves with equal amplitude, but different frequencies: 0.5 and 0.75 rad/s. The total velocity can now be written as: V(t, x) = A 1 cos ((kx ω 1 t) + A 2 cos ((kx ω 2 t) Unfortunately, it is not straightforward to plug this into the Morison equation and find an analytic solution, due to the absolute value present. Resulting time traces of the displacement and the Morison load are provided in Figure 4-5. Also here a similar transient motion is visible. Furthermore, spectral density plots of said signals are given in Figure 4-6. Note that since the figure is plotted on a logarithmic axis, small amplitudes are exaggerated. Multiple observances can be made: 1. Two peaks are present at the wave frequencies, in both excursion and loading. These contain most energy. 2. A small peak is observed at a difference frequency of =0.25 rad/s. Although the energy is low, if this excites a natural period response can be high. Interestingly, this peak is relatively low in the Morison load, but due to the low stiffness of the system it yields a significant response. 3. Multiple peaks are found in the Morison load time trace at either multitudes of the wave frequency or sum frequencies: 1, 1.25, 1.5, 2, 2.25, 2.5 rad/s and further on. Most energy is in the 2 rad/s peak. A response is found at the following frequencies, in order of magnitude: ω 1, ω 2, (ω 1 ω 2 ), 2ω 1, 2ω 2, (ω 1 + ω 2 ),
32 It can be concluded that responses can be expected at different frequencies than the wave frequencies in bot regular and irregular waves. It depends on the system characteristics (stiffness, mass, added mass, etc.) at which frequency largest response is found. However, the following can be expected: In regular waves response at two and three times the wave frequency, where loading at three times the wave frequency is higher than two times. In irregular waves both low and high frequency effects are to be expected. This consists of difference, sum and double frequencies. The difference frequency loading is approximately two order of magnitude lower than the wave frequent loading, furthermore the difference frequency is again an order lower than the sum frequency loading. Limiting criteria in terms of plastic capturing are bridging and overtopping. When bridging, the screen is lifted out of the water as the floater rests on two wave crests and is not sufficiently flexible to follow the waves. During overtopping, the system is pulled under water in a wave crest, allowing plastic to wash over the barrier. An example is provided in Figure 4-7.
33 Overtopping and bridging are influenced by the following parameters: 1. Buoyancy force: this is the main force that keeps the system afloat. As the system is pulled down, the buoyancy force increases greatly due to the cylindrical shape of the floater. Once the system is half submerged, the increase decreases. 2. Static weight: the static weight of the system consists of ballast chain (which may be submerged) and the weight of the floater. This load is equally distributed over the system and pointing downwards (if the ballast chain is fully submerged once it is out of the water the weight increases). 3. Pretension force: as the pretension increases, the system gets more resistant towards bending. 4. Dynamic forces: drag in the vertical plane and mass cause the system to respond out of phase with respect to the wave. In a system dominated by stiffness (buoyancy) the dynamic loads will be low. However, then the load pointing downwards is low as well. Note that in the low mooring configuration a vertical component is introduced, where the screen pulls the floater down. An example of the quasi static vertical loads is presented in Figure 4-8, where the system is subjected to the medium pretension (300 kn) and a wave with 6m height and 6.5s period. Note that the bend
34 stiffness has been neglected in this case: assuming the bend stiffness is much lower than the resistance to bending due to pretension. The loads have been computed with a finite element numerical model. Two interesting aspects can be observed: if the system is lifted out of the water, at the through, the buoyancy load is zero and consequently the vertical component of the pretension load is equal to the constant weight. At the crest, the buoyancy load steeply increases, due to the cylindrical shape of the floater. In order to maintain statics the vertical pretension component decreases. If the diameter of the floater is large with respect to the weight, then the plastic capturing limiting behaviour is bridging. The other way around holds as well: with large weight and small buoyancy, the system will be pulled into the wave crest easier. Another important aspect is nonlinearity of waves: in the tank steep waves tend to look slightly more trochoid shaped than sinusoidal. This implies wave crests are sharper and higher, and troughs shallower and flatter. The same case as presented in Figure 4-8 is ran with a Stokes 5 th order wave. Results are presented in Figure 4-9. The vertical loads are larger; consequently the distance between the wave crest and top of the floater is smaller. It can therefore be expected in waves that get more non-linear, the occurrence of overtopping will increase.
35 It is important to be able to compare configurations (span, mooring configuration, dimensions, etc.) quantitatively in terms of overtopping and bridging. The three most governing parameters for a certain configuration are: wave steepness, significant wave height and current velocity. Using these parameters it is envisioned an area of operation can be determined, where no bridging and overtopping occurs. Indeed, this is not something binary, as plastic might already escape once the screen is lifted a meter out of the water. Therefore this should be combined with the local plastic capturing efficiency, which is still being determined numerically and empirically. An example of such a figure can be found in Figure 4-10, where the coloured area is the area in which can be operated. This figure can be generated for different designs (floater dimension, weight, span, etc.) enabling a quantitative comparison and optimizing the design.
36
 and reference (REF) locations, as show in Figure 2-7. In the 0.")

37 Two current velocities have been tested: 0.3 and 1.0 m/s. Current is calibrated without waves and the obtained signals are used for wave calibration. The time signals and power spectra of these two currents are presented in Figure 5-1 and Figure 5-2 for the centre line (CL) and reference (REF) locations, as show in Figure 2-7. In the 0.3 m/s case the mean of the CL signal is m/s, slightly lower than that of the REF signal; m/s. The signals are, as expected, not entirely constant: the standard deviation of both signals is and m/s. This is small, yet significant for the REF signal the standard deviation is more than 10% of the mean. In the power spectra a peak can be observed at around 1 rad/s; response of the system can be expected here as well.

38 Regular waves without current are fairly straight forward to calibrate and the error is consequently low. The combination of waves and current is more complex, especially the oblique waves. A phase difference occurs between waves propagating from the two different wave makers that needs to be corrected. Therefore the error between nominal and realized (measured) waves in these cases is larger. An overview of all these cases is presented in Table 5-1. Steep waves tend to get more nonlinear than relatively long waves. In order to check the nonlinear effects, three periods for the 6m regular wave are shown and compared with a regular Airy and Stokes 5 th order wave in Figure 5-3. The longest wave is approximated best by an Airy wave, however, the steeper two waves show more nonlinear behaviour and are better modelled by a Stokes wave.
39 The nominal values of these signals are not of great important: as there is no clear design case yet and the goal of this campaign is to understand the response of the system; it is of more importance to know the exact wave/current input and to be able to compare that to slightly different cases.
40
41 Two irregular wave conditions are carried out: SLS and ULS (note that these are not SLS and ULS of the Pacific system, but representative cases within the tank capabilities). The wave parameters are shown in Table 5-2. The theoretical and realized spectra are shown in Figure 5-4 and Figure 5-5.
42 A number of observations can be made: The SLS condition is a better fit than the ULS ULS contains less energy than theoretical: actually Hs 5.62 m instead of 6.5 m. Less energy is present in the high frequency range of the ULS spectrum, likely due to wave breaking at higher frequencies (steeper waves). Wave height measurements were carried out at a number of positions (see Figure 2-7). The spectra for the ULS at 225 degrees is shown for the various positions in Figure 5-6. The spectra show significant differences over the width of the tank. The significant wave heights of the various positions are listed in Table 5-3.
43 A decline in fluid velocity is observed in the SLS cases (see Figure 5-7), likely leading to lower response in the system. This was communicated with MARIN, who state that it is a sensor issue and not a physical observance from the basin.
44 The centre displacement for all configurations in current without waves is shown in Figure 5-8. Unfortunately the results in medium pretension with the original ballast weight were not usable, as the targets rotated out of view of the optical measurement device. The offset is an important aspect to the working principle of the barrier, as it should concentrate plastic to one central point, meaning the plastic has to be able to travel along the barrier. Too much offset disables this mechanism. A second option is to retrieve plastic at multiple points along the barrier. The mean excursion reduces as pretension increases. However, as the ballast weight was increased in the high mooring configuration, the screen is pulled down more in 1 m/s current leading again to a higher excursion. The secondary mooring configuration is limited in surge due to the length of the secondary mooring lines. Limiting offsets can thus be achieved by increasing pretension, by for instance tensioning the system between two mooring buoys. The downside of this option is that overtopping and bridging will occur more often. A second option is working with a secondary tension wire that is relatively stiff and tensioned.
45 Tension [kn] Displacement centre [m] m/s 1 m/s High mooring - Low ballast - Low pret High mooring - Low ballast - Mid pret High mooring - High ballast - Mid pret High mooring - High ballast - High pret Low mooring - Low pret Secondary mooring - Low pret Tensions are measured starboard and portside. The mean tensions for the various configurations are shown in Figure 5-9. It should be noted that the pretension configuration has a significant impact on the tension of the mooring line m/s Tsb m/s Tps 1 m/s Tsb m/s Tps 0 High mooring - Low ballast - Low pret High mooring - Low ballast - Mid pret High mooring - High ballast - Mid pret High mooring - High ballast - High pret Low mooring - Low pret The transverse load, pointing the current direction, is presented in Figure The transverse load in the medium and high pretension is equal to that of the low mooring. As the ballast weight was increased the high mooring system is more similar to that of the low mooring. In 0.3 m/s loads for all
46 Ft [kn] configurations are equal. In 1.0 m/s the transverse load almost doubles if the ballast weight is increased or the connection point fixed at the ballast weight (low mooring). Furthermore, the exposed area of the boom to current is larger for higher pretensions, this effect is not visible as an increase in transversal load m/s 1 m/s 0 High mooring - Low ballast - Low pret High mooring - Low ballast - Mid pret High mooring - High ballast - Mid pret High mooring - High ballast - High pret Low mooring - Low pret The unit load (distributed load per meter span) for various configurations in current only is shown in Figure The unit load is a useful figure as it allows for quick comparison and calculation of design loads for a certain length of boom. The unit load is derived by dividing the transversal loads of Figure 5-10 by the span. The span varies per configuration and can be estimated based on the horizontal azimuth of the two connection points and the elongation of the two springs. Based on the unit load, an effective drag coefficient can be calculated. This is done with a constant area assumption: the projected area remains the same. This is not the case as the screen rotates away from the current in the high mooring configuration. However, the orientation of the screen is unknown. The drag coefficient is presented in Figure 5-12.
47 Drag coefficient [-] Unit load-mean [kn] 1,8 1,6 1,4 1,2 1 0,8 0,6 0,4 0.3 m/s 1 m/s 0,2 0 High mooring - Low ballast - Low pret High mooring - Low ballast - Mid pret High mooring - High ballast - Mid pret High mooring - High ballast - High pret Low mooring - Low pret 2,5 2 1, m/s 1 m/s 0,5 0 High mooring - Low ballast - Low pret High mooring - Low ballast - Mid pret High mooring - High ballast - Mid pret High mooring - High ballast - High pret Low mooring - Low pret In order to find the linear wave response of the system, a bandpass filter is applied. The low pass frequency is 0.3 rad/s and the high pass frequency is 1.5 rad/s. The high pass frequency is taken relatively low because of higher order effects occurring at twice the wave frequency. These higher order effects are visible in Figure 5-13, where spectral density plots are given of the starboard and port side
48 loads. In this case even more energy is present in the first higher order harmonic than in the wave frequent component. Note that this frequency domain plot is made of the high mooring low pretension configuration in 270 degree (parallel) waves. In order to study the higher order harmonics a second bandpass filter is applied between 1.5 and 3 rad/s. A top view is given for the high mooring and low pretension mean positions in 0.3 and 1.0 m/s current, in Figure 5-14.
49 The surge motion of the barrier is presented in the centre position. This value is highly transient/ or low frequent: i.e. the motions are dominated by a component that is not linear with the waves. See Figure 5-15 for an example time trace, with a low pass filtered signal overlapped. Note the irregularities in the filtered signal at the beginning and end, which should be ignored. Furthermore, we see a decrease in the mean excursion of the system in waves with respect to its initial position. In various wave conditions the low frequent behavior is different. First a look is taken to the low frequent characteristics, after which wave- and high-frequent behavior is studied.
50 Multiple wave and current conditions for the high mooring low pretension configuration are shown in Figure 5-16 and Figure An error is present in the 6m 6.5s wave from 225 deg in 0.3 m/s current, from approximately 600s. Different configurations for equal wave and current conditions are shown Figure 5-19 and Figure Note that the initial position has been set to zero, in order to have an easier comparison for different configurations, as the initial position differs. Low frequent motions are observed in all cases and correlations are present: In 225 and 180 deg waves the centre of the systems moves away from the mean current position during the first wave occurrences. The motion builds up to a peak from which a slow decline takes place, which seems to be continuing after the test stops. The steep increase and slow decrease of the mean position in observed in all mooring configurations and pretensions. In 0.3 m/s current the decrease is either slower or likely stagnates. In 1.0 m/s the decrease is to approximately to the position the system started the test in. In one case (high mooring, med pretension) the decrease is such that the system moves further back than the position it started in. In 0.3 m/s the transient motion is larger than in 1.0 m/s current, the difference is approximately a factor 2. In 1.0 m/s the system is subjected to more tension, leading to a higher resistance to bending. In higher pretensions lower transient motions are observed. In 270 deg waves no increase is observed. Even more so, the system slowly moves in the current direction. This can be caused by lowering of the effective drag area of the boom, as the screen compresses part of a wave cycle. Possibly the transient loads cause excitation of a very low frequent natural mode. As these tests were carried out with a regular wave, which consists only of a single wave component with a frequency and amplitude, no slow difference frequency drift can be present. It is concluded this is transient behaviour due to the sudden build-up of waves. It is expected this will not take place in the same order in ocean waves, as build-up of waves is much more gradual. However, during engineering special attention should be paid towards the build-up of a storm in confused seas, instead of simulating merely steady state situations.
51
52
53
54 Surge transient [m] Surge max [m] Maximum surge motions for all regular waves and current conditions of the high mooring low pretension configuration are shown in Figure Wave and high frequent amplitudes can be found in Figure 5-24 and Figure Furthermore, results for different configurations are presented in Figure 5-26 and Figure The wave frequent surge amplitude is low relative to the deflection due to current and even more so to the low frequent motion. High frequency surge is even smaller, but may lead to high accelerations as accelerations increase with respect to the motion in frequencies larger than 1 rad/s dir [deg] H [m] T [s] [m/s] 1.0 [m/s] dir [deg] H [m] ,2 4,6 7,3 6,5 5,2 4,6 7,3 6,5 7,3 T [s] 0.3 [m/s] 1.0 [m/s]
55 Surge (high freq) amp [m] Surge (wave freq) amp [m] 3 2,5 2 1,5 1 0,5 0 5,2 4,6 7,3 6,5 5,2 4,6 7,3 6,5 7,3 T [s] H [m] dir [deg] 0.3 [m/s] 1.0 [m/s] 0,35 0,3 0,25 0,2 0,15 0,1 0,05 0 5,2 4,6 7,3 6,5 5,2 4,6 7,3 6,5 7,3 T [s] H [m] dir [deg] 0.3 [m/s] 1.0 [m/s]
56 Surge (wave freq) amp [m] Surge (wave freq) amp [m] 3 2,5 2 1,5 1 0,5 0 5,2 4,6 7,3 6,5 5,2 4,6 7,3 6,5 7,3 T [s] H [m] dir [deg] High mooring - low ballast - Low pretension - 0,3 m/s High mooring - low ballast - Med pretension - 0,3 m/s High mooring - high ballast - Med pretension - 0,3 m/s High mooring - high ballast - High pretension - 0,3 m/s Low mooring - Low pretension - 0,3 m/s Secondary mooring - Low pretension - 0,3 m/s 3 2,5 2 1,5 1 0,5 0 5,2 4,6 7,3 6,5 5,2 4,6 7,3 6,5 7,3 T [s] H [m] dir [deg] High mooring - low ballast - Low pretension - 1 m/s High mooring - low ballast - Med pretension - 1 m/s High mooring - high ballast - Med pretension - 1 m/s High mooring - high ballast - High pretension - 1 m/s Low mooring - Low pretension - 1 m/s Secondary mooring - Low pretension - 1 m/s
57 Surge transient [m] Surge transient [m] dir [deg] H [m] 5,2 4,6 7,3 6,5 5,2 4,6 7,3 6,5 7,3 T [s] High mooring - low ballast - Low pretension - 0,3 m/s High mooring - low ballast - Med pretension - 0,3 m/s High mooring - high ballast - Med pretension - 0,3 m/s Low mooring - Low pretension - 0,3 m/s Secondary mooring - Low pretension - 0,3 m/s dir [deg] H [m] 5,2 4,6 7,3 6,5 5,2 4,6 7,3 6,5 7,3 T [s] High mooring - low ballast - Low pretension - 1 m/s High mooring - low ballast - Med pretension - 1 m/s High mooring - high ballast - Med pretension - 1 m/s High mooring - high ballast - High pretension - 1 m/s Low mooring - Low pretension - 1 m/s Secondary mooring - Low pretension - 1 m/s Starboard accelerations are used as this sensor proved to be more reliable. Results are presented in Figure 5-30 and Figure Accelerations are measured in a model fixed reference frame. Due to rotation of the floater about the local y-axis the x-axis points partly towards the water surface. In some cases rotations larger than 90 degrees are found and the x and z-axis are consequently swapped. This means a gravity component is included (which is in the case of the results presented filtered out). High accelerations in 225 degrees, 6m and 7.3s observed. This might be a natural mode. However, due to the many errors present in the acceleration sensors it is not unlikely that it is a sensor error. According to reference [ER.1] the sensor should, however, operate well in this test case.
58 Acc. X SB (high freq) Amp [m/s 2 ] Acc. X SB (wave freq) Amp [m/s 2 ] 3,5 3 2,5 2 1,5 1 0,5 0 5,2 4,6 7,3 6,5 5,2 4,6 7,3 6,5 7,3 T [s] H [m] dir [deg] 0.3 [m/s] 1.0 [m/s] 3,5 3 2,5 2 1,5 1 0,5 0 5,2 4,6 7,3 6,5 5,2 4,6 7,3 6,5 7,3 T [s] H [m] dir [deg] 0.3 [m/s] 1.0 [m/s] Sway motions and accelerations, having once wave and twice the wave frequency, are shown in Figure 5-32 to Figure 5-35 for the high mooring and low pretension. Overall, the sway motion is low, and the high frequency component is unlikely to cause the large high frequent component observed in the loads.
59 Sway (high freq) amp [m] Sway (wave freq) amp [m] 0,6 0,5 0,4 0,3 0,2 0,1 0 5,2 4,6 7,3 6,5 5,2 4,6 7,3 6,5 7,3 T [s] H [m] dir [deg] 0.3 [m/s] 1.0 [m/s] 0,18 0,16 0,14 0,12 0,1 0,08 0,06 0,04 0,02 0 5,2 4,6 7,3 6,5 5,2 4,6 7,3 6,5 7,3 T [s] H [m] dir [deg] 0.3 [m/s] 1.0 [m/s]
60 Acc. Y SB (high freq) Amp [m/s2] Acc. Y SB (wave freq) Amp [m/s 2 ] 2,5 2 1,5 1 0,5 0 5,2 4,6 7,3 6,5 5,2 4,6 7,3 6,5 7,3 T [s] H [m] dir [deg] 0.3 [m/s] 1.0 [m/s] 0,8 0,7 0,6 0,5 0,4 0,3 0,2 0,1 0 5,2 4,6 7,3 6,5 5,2 4,6 7,3 6,5 7,3 T [s] H [m] dir [deg] 0.3 [m/s] 1.0 [m/s] The pitch motion (around the axial axis of the system) is stronger with a frequency twice the wave frequency. This motion causes the loads in that frequency. The motion of the centre cross section is shown below.
61 Note that the motion of the screen is unknown, this is visualized as a line always pointing downwards; which in reality will have an orientation depending on the mooring (this is for visualization purposes only). The wave conditions are regular oblique 6m waves. The path is not circular but closer to elliptic, it is unknown at this stage why this is the case. Some of the pitch time traces show very inconsistent and non-linear behavior. See for instance the center pitch of test , high mooring low pretension with a 3m and 5.2s regular parallel wave in 0.3m/s current in Figure The pitch drops to around 30 degrees, after some time it drops even further to 90 degrees.
62 Pitch Mean [deg] The mean pitch angle for various regular wave tests in the high mooring low pretension setup is shown in Figure A negative pitch angle corresponds to a rotation away from the current. Note that for the large rotations over 90 degrees the sensor becomes invisible for the carriage based sensing system. These cases have been removed from the database. The barrier rotates in some cases a large angle away from the current heading. This is remarkable, as the force exerted on the screen causes a moment in the opposite direction. It might be caused by wave loading on the cylindrical floater ,2 4,6 7,3 6,5 5,2 4,6 7,3 6,5 7,3 T [s] H [m] dir [deg] 0.3 [m/s] 1.0 [m/s]
63 Pitch Mean [deg] The low mooring mean pitch angle is shown in Figure In this setup a small negative angle is expected, as the moment about the tension wire rotates the floater away from the current direction. However, also in this setup sometimes angles close to -90 degrees are seen, meaning the floater is lifting the screen effectively. Care should be taken with these numbers as they are indicative, since the process is not a steady-state one (see Figure 5-37). A mean angle of -45 degrees could still indicate that somewhere in the test the angle is -90 degrees for a significant duration ,2 4,6 7,3 6,5 5,2 4,6 7,3 6,5 7,3 T [s] H [m] dir [deg] 0.3 [m/s] 1.0 [m/s] The wave and high frequent component are provided in Figure 5-40 and Figure 5-41 for the high mooring and low pretension cases. For all other setups the high frequent part of the pitch motion is shown in Figure 5-42 and Figure It is observed that in one wave condition the high frequency pitch motion is significantly larger; in 6m and 7.3s 225 degree waves in 1.0 m/s current. It appears this condition excites a natural frequency, although similar behavior is not seen in 180 and 270 degree waves. In all configurations and current speeds high frequent pitch is observed, although the secondary mooring configuration has the smallest amplitude. No clear change in pitch with respect to pretension is observed.
64 Pitch (high freq) Amp [deg] Pitch (wave freq) Amp [deg] ,2 4,6 7,3 6,5 5,2 4,6 7,3 6,5 7,3 T [s] H [m] dir [deg] 0.3 [m/s] 1.0 [m/s] ,2 4,6 7,3 6,5 5,2 4,6 7,3 6,5 7,3 T [s] H [m] dir [deg] 0.3 [m/s] 1.0 [m/s]
65 Pitch (high freq) Amp [deg] Pitch (high freq) Amp [deg] ,2 4,6 7,3 6,5 5,2 4,6 7,3 6,5 7,3 T [s] H [m] dir [deg] High mooring - low ballast - Low pretension - 0,3 m/s High mooring - low ballast - Med pretension - 0,3 m/s High mooring - high ballast - Med pretension - 0,3 m/s Low mooring - Low pretension - 0,3 m/s Secondary mooring - Low pretension - 0,3 m/s ,2 4,6 7,3 6,5 5,2 4,6 7,3 6,5 7,3 T [s] H [m] dir [deg] High mooring - low ballast - Low pretension - 1 m/s High mooring - high ballast - Med pretension - 1 m/s High mooring - high ballast - High pretension - 1 m/s Low mooring - Low pretension - 1 m/s Secondary mooring - Low pretension - 1 m/s In this section the loads taking place in regular waves are analysed. The secondary mooring configuration is analysed separately, as loads are transferred from the boom to the tank in four locations through the tension wire beneath the floater and the subsea mooring line. Furthermore, seven secondary mooring line loads are measured. First a look is taken to the low frequent loads. In Figure 5-45 and Figure 5-47 a low pass filter is applied to the tension and azimuth to compute the unit load. Note that the unit load is computed for the total
66 length (360m) and not the instantaneous length. The initial value is deducted from the time traces, for a better visual comparison. These figures look very similar to the centre position measurements, as shown in Section Again an error is present in the 6m 6.5s wave from 225 deg in 0.3 m/s current in the high mooring low pretension case, from approximately 600s. The low mooring configuration has the same pretension as the low pretension high mooring cases. Low frequent motions are dominated by displacement (stiffness), with low influence of damping and mass/inertia. In Section it can be seen that in some cases the system moves transiently away from its initial position to a maximum offset, and then back again to a smaller offset than its initial deflection. This is reflected in a drop in unit load in Figure 5-45 and Figure 5-47, as the initial load in current has been set to zero.
67
68 The transient loads are caused by the slow surge of the boom. It has been concluded in section regarding the surge motion that this effect is caused by the build-up of the waves, forcing the boom first to move from its mean position, slowly returning or even overshooting from said position. Note that damping in the system is quadratic: leading to high damping in large frequencies (high velocities), as the square of a large number is even larger. However, the square of a number smaller than 1 becomes even smaller. In low frequencies velocities are low and consequently damping is low. The wave frequent and second harmonic transversal force amplitude are shown in the Figure 5-48 and Figure Wave and high frequent transversal load amplitudes are presented for various configurations in Figure 5-50 to Figure In Figure 5-54 and Figure 5-55 the transient part of the transveral load is shown (initial value distracted from dynamic low frequent max). In Figure 5-51 and Figure 5-53 the transversal load is shown as a function of the square of the wave double amplitude divided by the period, which serves as an indication of the wave particle velocities the wave period is related to the wave length. If the response is caused predominantly by drag, the response will be linear over the velocity squared. The following is observed: Remarkably, the order of both response harmonics (wave and twice the wave frequency) is equal: the amplitudes are similar. The component at twice the wave frequency, which was
69 Ft (wave freq) Amp [kn] expected to be small, is significant. It is likely this component is caused by the pitching motion of the boom. The higher the wave velocity (related to amplitude and period), the higher the load. Even though the 270 degree waves are parallel to the boom, a very small transversal component is present. Wave loads for different configurations are equal for the low and high mooring configurations with a low pretension. As the pretension increases, the wave loading slightly increases. The cases with higher pretension were carried out with a higher ballast weight which surprisingly lowers the wave loading slightly. In 1.0 m/s the high pretension high mooring configuration cannot follow the waves well anymore, leading to higher wave frequent loads that stand out in terms of characteristics. Wave frequent loads are similar in terms of amplitude in 0.3 and 1.0 m/s current. If the system is flexible, the overall wave frequent loading is low with respect to the mean load. Wave and high frequent loads are generally larger in oblique waves than in In all configurations and currents transient peaks are observed in the loads. The 6m 6.5s wave at 225 degrees causes the highest transient loads. High frequency loads are present in all setups. In the low mooring the amplitude remain relatively lowest, whilst the high mooring with low pretension gives highest forcing ,2 4,6 7,3 6,5 5,2 4,6 7,3 6,5 7,3 T [s] H [m] dir [deg] 0.3 [m/s] 1.0 [m/s]
70 Ft(wave freq) Amp [kn] Ft (high freq) Amp [kn] ,2 4,6 7,3 6,5 5,2 4,6 7,3 6,5 7,3 T [s] H [m] dir [deg] 0.3 [m/s] 1.0 [m/s] ,2 4,6 7,3 6,5 5,2 4,6 7,3 6,5 7,3 T [s] H [m] dir [deg] High mooring - low ballast - Low pretension - 0,3 m/s High mooring - low ballast - Med pretension - 0,3 m/s High mooring - high ballast - Med pretension - 0,3 m/s Low mooring - Low pretension - 0,3 m/s
71 Ft (wave freq) Amp [kn] Ft (wave freq) Amp [kn] High mooring - low ballast - Low pretension - 0,3 m/s High mooring - low ballast - Med pretension - 0,3 m/s High mooring - high ballast - Med pretension - 0,3 m/s Low mooring - Low pretension - 0,3 m/s 0 0,20 0,30 0,40 0,50 0,60 0,70 0,80 0,90 1,00 (H/T)^ ,2 4,6 7,3 6,5 5,2 4,6 7,3 6,5 7,3 T [s] H [m] dir [deg] High mooring - low ballast - Low pretension - 1 m/s High mooring - high ballast - Med pretension - 1 m/s High mooring - high ballast - High pretension - 1 m/s Low mooring - Low pretension - 1 m/s
72 Ft Max [kn] Ft (wave freq) Amp [kn] 80 High mooring - low ballast - Low pretension - 1 m/s High mooring - high ballast - Med pretension - 1 m/s High mooring - high ballast - High pretension - 1 m/s Low mooring - Low pretension - 1 m/s ,00 0,10 0,20 0,30 0,40 0,50 0,60 0,70 0,80 0,90 (H/T)^ T [s] H [m] dir [deg] High mooring - low ballast - Low pretension - 0,3 m/s High mooring - low ballast - Med pretension - 0,3 m/s High mooring - high ballast - Med pretension - 0,3 m/s High mooring - high ballast - High pretension - 0,3 m/s Low mooring - Low pretension - 0,3 m/s
73 Unit load Amp [kn/m] Ft Max [kn] T [s] H [m] dir [deg] High mooring - low ballast - Low pretension - 1 m/s High mooring - low ballast - Med pretension - 1 m/s High mooring - high ballast - Med pretension - 1 m/s High mooring - high ballast - High pretension - 1 m/s Low mooring - Low pretension - 1 m/s Unit load, or the transverse load per unit span of the system is shown in the following figures for 0.3 and 1.0 m/s current. Also here the high pretension high mooring case stands out. For this case the barrier is so stiff that it cannot move with the waves anymore. 0,16 0,14 0,12 0,1 0,08 0,06 0,04 0,02 0 5,2 4,6 7,3 6,5 5,2 4,6 7,3 6,5 7,3 T [s] H [m] dir [deg] High mooring - low ballast - Low pretension - 0,3 m/s High mooring - low ballast - Med pretension - 0,3 m/s High mooring - high ballast - Med pretension - 0,3 m/s Low mooring - Low pretension - 0,3 m/s
74 T_ps (high freq) Amp [kn] Unit load Amp [kn/m] 0,2 0,18 0,16 0,14 0,12 0,1 0,08 0,06 0,04 0,02 0 5,2 4,6 7,3 6,5 5,2 4,6 7,3 6,5 7,3 T [s] H [m] dir [deg] High mooring - low ballast - Low pretension - 1 m/s High mooring - high ballast - Med pretension - 1 m/s High mooring - high ballast - High pretension - 1 m/s Low mooring - Low pretension - 1 m/s A comparison of the high frequency loads (in the port side line) is provided for all configurations in Figure ,2 4,6 7,3 6,5 5,2 4,6 7,3 6,5 7,3 T [s] H [m] dir [deg] High mooring - low ballast - Low pretension - 0,3 m/s High mooring - low ballast - Med pretension - 0,3 m/s High mooring - high ballast - Med pretension - 0,3 m/s Low mooring - Low pretension - 0,3 m/s Secondary mooring - Low pretension - 0,3 m/s The wave and high frequent amplitude of the tension in the submerged mooring line is presented in Figure 5-60 and Figure Results of the secondary tension wires are shown in Figure 5-62 to Figure Snatching loads in these lines are of particular interest, where the line goes from slack to taut rapidly. The following is concluded based on these results: Similar to the high and low mooring large low frequent transient response is observed. It is likely that in most cases the system has not found a mean position yet in the test duration, as the loads are steadily decreasing in most cases up to the end of the test. In shorter periods the mean loads
75 remain higher than in the longer waves. In 0.3 m/s current the amplification with respect to the initial value is larger than in 1.0 m/s current. Overall wave dynamic loads remain low, except in the 180 deg case, where high loads are observed. High frequent loads are found in 6m oblique waves. The secondary mooring wires go from slack to taut in 0.3 m/s current. However, this does not lead to high loads. The load in the secondary mooring lines reaches a steady state during the test. The mean is equal to that in current, no additional loading is observed due to the waves. In 6m waves dynamic loads in the secondary mooring wires are much higher than in 3m. This is likely due to the length of the wires being such that the system cannot flexibly follow the waves but the secondary wires become taut and limit the movement, as orbital paths of the waves are larger in diameter in 6m waves.
76
77
78
79
80
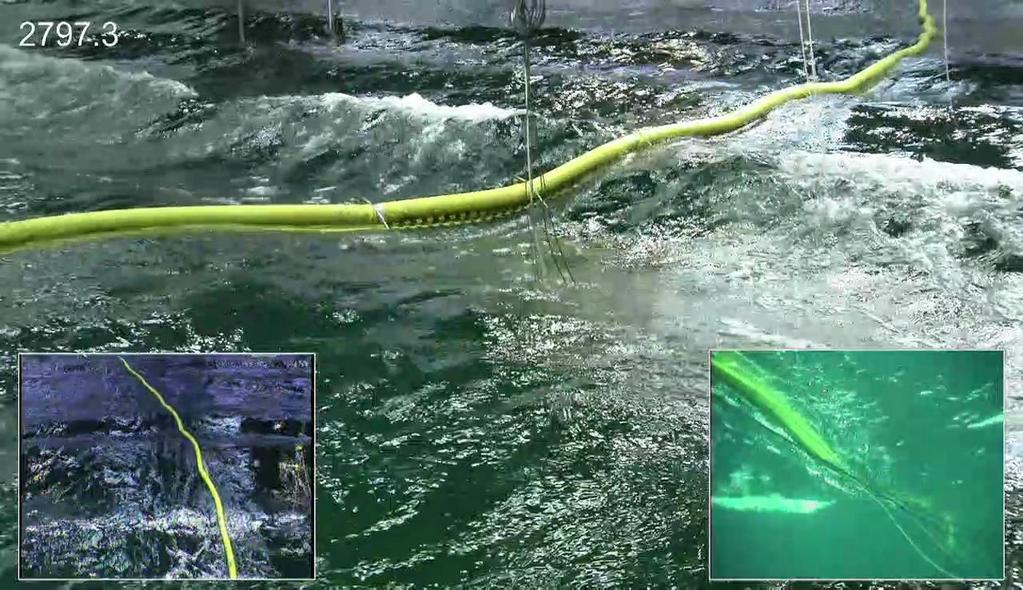
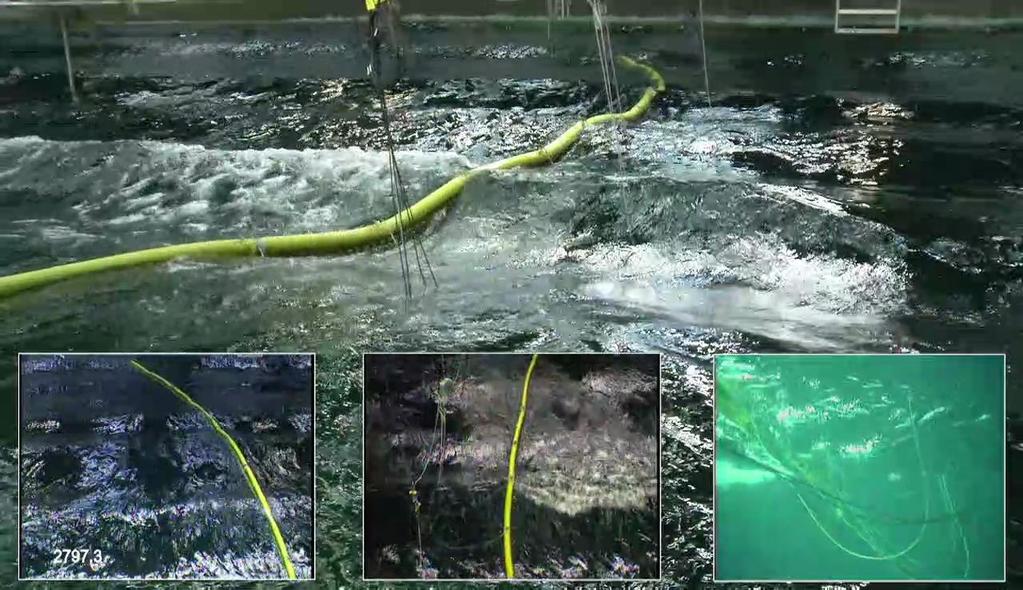
81 In the regular wave tests we see very little overtopping and bridging, which is remarkable and a positive result, as these cases have the most defined through and crest, which does not happen often in an irregular sea state with a similar maximum wave height (which occurs only once in a three hour sea state). Furthermore, the periods were selected to be small, leading to short and steep waves. Overtopping and bridging events are extracted from the test videos, making it a subjective result. It was, however, impossible to quantify or measure during the test campaign. Even though the bend stiffness of the system was minimized as much as was reasonably possible, due to the scaling laws it is much larger than what is expected full scale. The bend stiffness scales with the power five. An overview of all overtopping and bridging interpretations can be found in Appendix C -. Some overtopping is observed, most notable in the secondary mooring and high pretension high mooring configuration. In the medium pretension and high ballast cases in 1 m/s current overtopping is also observed, which is not the case in the 0.3 m/s current cases. Due to the current more tension is present in the system, leading to less flexibility. Bridging is in only one case clearly visible (test number , high mooring ballasted medium pretension 6m shortest wave, see Figure 5-71). In the high pretension and high mooring ballasted cases events that may be identified as bridging are observed.

82 In short: Overtopping is observed more than bridging (likely caused by the high weight of the floater with all the sensors (~160 kg/m without the ballast weight). The higher the pretension, the more overtopping and bridging is found. Even in the lowest pretension in all mooring configurations overtopping is observed in 1.0 m/s current. No bridging is found. In the low and secondary mooring in more cases overtopping is found, evenly distributed over 225 and 270 degree wave headings. This includes cases with a 3m wave height, although with the 6m waves more often overtopping is observed. In only two cases in the medium pretension high mooring setup in 0.3 m/s current overtopping (no bridging) is observed. For the high pretension cases no runs with 0.3 m/s were performed. The response in irregular waves consists of multiple components: Mean current Mean wave Low frequency Wave frequency High frequency (>wave frequencies)
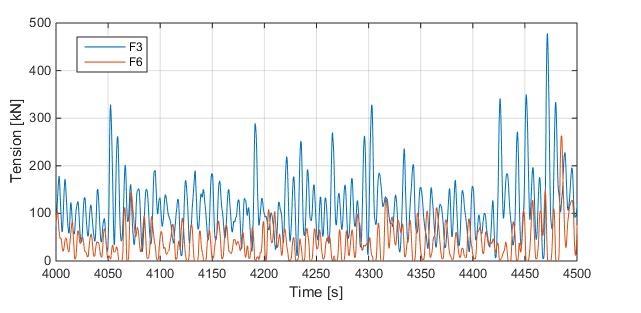
83 An example time trace can be found in Figure In Figure 5-73 the spectral density of the port and starboard side tensions is shown. Most of the energy is located in the lower frequencies, i.e. below 0.3 rad/s. Notice that equal to the regular waves a peak is seen at higher frequencies than the wave frequency. This peak is not at twice but three times the wave frequency. Note also that the wave frequent component differs for the port and starboard side sensors. Also frequencies lower than rad/s are filtered out, as some time traces show for instance a mean drop in the signal (see Figure 5-7). We fit the MPM through the mean and low frequencies and fit a Generalized Pareto Distribution. As the high frequencies are filtered out, there is no need for declustering of extreme values exists. The following steps are taken: 1. Select time trace larger than 600s to get rid of any transient effects. 2. Filter out response over 0.3 rad/s and under 0.005rad/s.
84 3. Find extremes over a certain threshold (Peak Over Threshold method) 4. Fit Generalized Pareto distribution by maximizing the log-likelihood. 5. Estimate 3 hour most probable maximum The centre displacement is shown in Figure 5-77 and Figure The following is observed:
85 The displacement decreases as pretension increase. Displacement in the high mooring (low pretension) setup shows a large low-frequency contribution that is not seen in the other cases. In medium and high pretension the low-frequent part is approximately equal. Wave induced motions are approximately equal for the low and high moorings. Current is by far the largest contributor to the surge motion.
86 A time trace of the pitch motions of test (high mooring ballasted, medium pretension ULS 225 degrees) is shown in Figure A mean pitch angle of maybe -10 degrees is present, but in some instances the angle almost reaches -90 degrees (smaller values than ~-80 degrees are not measured and recorded as the max value). This likely means that the system switches between two equilibriums: a small negative pitch angle (equilibrium in current), or a very large one (close to -90 degrees). The pitch

87 goes from the mean value to a large peak and back in approximately 30s, which means it is not wave frequent related. Unfortunately for many irregular wave cases the pitch measurement is not usable and consequently it cannot be presented in this document. In the swell cases extreme pitch angles such as the ones mentioned above are not observed. In this section the loads taking place in irregular seas are analysed. The secondary mooring configuration is analysed separately, as loads are transferred from the boom to the tank in four locations through the tension wire beneath the floater and the subsea mooring line. Furthermore, seven secondary mooring line loads are measured. The loads in the two springs on the sides of model are studied in this section. Furthermore, the transversal part of the load is investigated as well. With respect to the tensions shown in Figure 5-80, Figure 5-81 and Figure 5-82 the following is learned: Loads in parallel irregular seas are significantly lower than in oblique seas (as opposed to regular waves, where smaller differences are observed). The long SLS case yields very small wave induced loads. This is due to the relatively low wave particle velocity. A significant low-frequency response is observed in the tensions, which also is observed in the displacement, for the high mooring and low pretension set-up. What excites this motion
88 remains unclear. Drift is not expected to occur, as wave drift requires diffraction of waves which is highly unlikely for the flexible boom. Stokes drift is expected to be observed in all cases. The low natural period of the system is likely caused by the low stiffness of the springs and a very large amount of added mass (water moving with the screen in lower frequencies). The resonance does not occur when larger pretensions are present. Starboard loads are lower than port side, as the waves either come from port side or partially come from that direction (oblique). The wave and high frequency wave loads are presented in significant value, as the maxima are smaller than extrema in the slow motions (adding all MPM together would yield a much larger extreme, as it is unlikely that they occur at the same time). The significant values are small and difficult to recognize in the figures. Tensions in the low mooring set-up are larger for the current only load (as expected, since the screen isn t able to fold away in higher currents). However, the dynamic loads are approximately equal.
89 With respect to the transversal load, see Figure 5-83, Figure 5-84 and Figure 5-85, the following is observed: The transversal load increases as the pretension increases, which is also seen in regular waves (except for the resonance seen in the high mooring, low pretension case) In the low mooring configuration the transversal load is approximately equal to the high mooring ballasted cases.
90 Wave induced loads are much lower for the longer waves, although their relative contribution to the total load increases (higher daf).

91 Measurements of the loading were taken in the secondary mooring wires and in the subsea tension line on both sides of the basin. Statistical and spectral results of these measurements are shown in Figure 5-86 to Figure The following can be concluded: Snatching of the secondary mooring lines occurs, but no sharp peaks are observed. The largest part of the total load in the lines is wave frequent. Due to the low frequency motion of the barrier low frequency loads are found in the secondary mooring lines. In the SLS cases the loads in the secondary mooring lines can be neglected. In the subsea tension wire large low frequent loads are measured in the 225 deg ULS. In all other cases this load is lower.
92
93
94 An overview of bridging and overtopping events, which have been obtained visually from video footage of the model tests, is provided in Table 5-4. Little bridging is observed in the irregular wave tests, overtopping is found more often. This is due to two main reasons: the skirt is longer than the floater is high and the bending stiffness of the barrier upwards in vertical direction is higher due to the presence of the screen and more important the axially stiff tension wire. In the SLS cases for both wave headings in no case significant overtopping and bridging was found. Even though the significant wave height is 4m, with a maximum wave height of approximately 7m, due to the long waves the system is able to follow the waves well. As in the ULS breaking waves were present, often washing over the floater takes place. In Figure 5-91 to Figure 5-93 snap shots during the same time in the tests are shown of the three configurations during the 270 degree wave heading ULS. In all three photos the checkerboard pattern is well visible, indicating bridging or close to bridging. In appendix B photos from the 225 degree (oblique) ULS condition are shown.
95
96
97
98 During the test three suspension configurations were tested: low, high and secondary mooring. Furthermore, the influence of pretension on the system has been tested. In this chapter a qualitative comparison is made based on the following performance parameters: 1. Hydrodynamic response a. Current b. Waves 2. Plastic holding a. Flexibility with respect to waves (bridging/overtopping) b. Screen orientation The loading on the system due to current and waves is given as follows (note that this holds for the sea states and current velocities used in the basin tests; for lower current velocity and steeper high waves loading these ratios change): 1. Current induced load (can be expected to be ~60-80% of the total load in a steady state situation) 2. Transient (can be as large as the current component but slowly fades) 3. Irregular: low frequent component in steady state irregular seas (~10-20% of the total load in an extreme event) 4. Wave frequent (a few percent of the total load) 5. High frequent (a few percent of the total load) 100% 80% 60% 40% 20% High frequent Wave frequent Low frequent/transient Current 0% Transient Steady state The hydrodynamic performance of the three configurations is compared in Table 6-1 using Harvey balls: if the balls is fully coloured, the results is positive (i.e. a low response, or high flexibility).
99 Current Wave Mean Transient Irregular Wave frequent High frequent Mooring High Low 2nd For all cases the current load is dominant. In extreme cases current loading is lower for the high mooring, in daily conditions they are highly similar, almost equal. The mean loading due to waves is for all cases low and consequently equal. Transient motion is the motion at the beginning of the test, when the waves are ramped. All configurations are susceptible to transient motions, although the secondary mooring is relatively limited in this motion due to the subsea mooring wire. Wave frequent loads is in all systems low. However, the secondary mooring line loading is predominantly wave frequent with a significant amplitude. Lastly, all systems experience high frequency loading, albeit with a low amplitude (slightly lower than wave frequent loads). This loading is likely caused by a pitch motion, which may be limited by adding an extra tension member on top of the system. The plastic holding performance for the three configurations is presented in Table 6-2. Note that the position of the screen is not measured and quantitatively estimated. Flexibility in waves Screen orientation Mooring High Low 2nd No large differences in flexibility, or ability to follow waves, have been observed between the three configurations: all systems followed the waves well. The high mooring configuration was better able to follow waves in 1.0 m/s current than the other configurations. The pretension has been varied for the high mooring setup only. The influence of pretension on hydrodynamic performance is shown in Table 6-3.
100 Pretension does not significantly influence the current loading, a slight increase in span may be observed, but this was found to be of relative small influence. As mentioned before, the mean load is for all cases low. For all pretensions transient behaviour leading to a peak load is observed. However, for the medium pretension even a drop in the load below the mean load due to current occurs, whilst the high pretension moves back to its initial position. Low frequency motions in irregular waves are reduced by the pretension. In high pretension the wave frequent loads become relatively higher, but are still small compared to the current induced load. Similarly to the comparison of configurations, all pretensions show high frequent loading. Pretension Low Medium High Current Mean Transient Wave Irregular Wave frequent High frequent Finally the plastic holding performance is compared for the carried out pretensions in Table 6-4. Flexibility in waves Screen orientation Pretension Low Medium High As expected, the system in low pretension can follow waves the best. However, differences between flexibility in medium and high pretension are small. Furthermore, in 0.3 m/s for all configurations and pretensions the barrier is better able to follow the waves (in the SLS conditions no overtopping and bridging is observed for any condition; unfortunately this case was not carried out for high pretension). The screen orientation is likely not influenced by pretension.
101 Model tests have been carried out to study the following: hydrodynamics of a floating boom with a screen attached and limiting characteristics for plastic capturing (overtopping/bridging). With respect to the first the following can be concluded: Loading is dominated by current. In the 0.3 m/s cases approximately 50-60% of the load is caused by the current, and in 1.0 m/s it ranges from 60-80%, depending on the sea state. Even in waves that run parallel to the system wave loading is observed, caused by the effective shortening of the path that the boom follows. The three mooring configurations behave in terms of hydrodynamics highly similar, especially in waves. In high current velocities the low mooring and secondary mooring boom are subjected to higher loads than the high mooring. The wave loading can be subdivided in a low, wave and high frequent component. The first causes the highest loads and is more dominant in low pretensions. It varies with a much lower frequency than the wave frequency. Wave frequent loads remain low, even in higher pretensions. At a certain threshold the system cannot flexibly follow the waves anymore and wave frequent loads increase. Even though these loads were found to be higher for the highest pretension, relative to the current load they are small. A high frequent component (at twice or three times the wave frequency) is observed in all configurations. It is thought to be caused by a pitching motion of the floater. The magnitude of this component is relatively low: in some cases equal to the wave frequent component, but in most lower. Even though the magnitude is low, due to the high frequency it may cause fatigue damage. The system should be engineered such that it has sufficiently low axial flexibility and bending stiffness to deform with the waves. If this is the case, loads and structural stress will remain low. This is also limited by the amount of tension that runs through the system, which also acts as a stiffness. A numerical model can be calibrated with the results of these tests and extrapolated to a design for the Pacific array. With regards to the plastic capturing capability the following can be stated: Bridging and overtopping is not quantified but dealt with visually based on the videos of the tests. In the longer sea states no bridging and overtopping is observed. Only in the steep sea states or with high current especially overtopping is seen, and less bridging.
102 In the low and secondary mooring configurations in 1.0 m/s the current induced load is higher than that of the high mooring, and consequently the ability to follow the waves is worse. However, this is likely not an operational current velocity. Low frequent/transient motions should be investigated: in combination with the current induced load, which is understood well, these will define the governing loads. A numerical model is required that can predict low frequent and transient motions on a large scale. The plastic capturing efficiency difference between a high mooring and low/secondary mooring needs to be quantified (entrainment). The load mitigation of the high mooring configuration is very beneficial in keeping loads low in extreme events, but this configuration will likely loose plastic more often. Mitigation options for the high frequency pitch should be investigated, as this may cause local fatigue damage to the permanent system. Debris induced load should be investigated, as this is left outside the scope of this report (it was not possible to test this on this model scale, due to the strong effects of surface tension). Plastics may accumulate and at some point disturb the flow, leading to different loads on the barrier.
103 Axial stiffness: Axial stiffness can be represented as: F = EA L x = 2k x Where k is the spring stiffness of the springs in the model tests, EA is the axial stiffness of the material used to keep the system in place (tension wire for instance), and L denotes the length of the material being subjected to a load F and is consequently stretched with x. According to this equation, a longer length of the same wire (or section) will lead to overall a more flexible system. However, on a longer section the load per unit length is equal and will thus lead to a larger load that needs to be taken by this wire. A higher load means a higher required MBL and consequently a larger and stiffer wire. It was found that this scales approximately linear with the section length. In short, as longer sections are used also stiffer wires are required. The ultimate consequence is that the stiffness k is equal for a system with a section length of 100m, 200m or even 2km. Two spring stiffness s are given; the most flexible one corresponds to a nylon rope and the high value is closer to polyester/aramid. Note that for the calculation of these values a unit load of 1kN/m is subjected to the system in order to find a maximum tension in the wire. In the ultimate state an angle of 45 degrees is utilized with 5% system stretch. A conservative safety factor of 1.5 is taken into account (the stiffer the system, the higher the loads and the easier it bridges). Bending stiffness: Apart from the model tests dedicated tests were conducted to determine the bending stiffness of the model. Two model segments were assessed by pulling with a known load in the model fixed X and Z directions. In both the X and Z direction positive and negative oriented loads were applied to make sure that the asymmetry due to the tension line was also taken into account. Please see [ER.1] for detailed information regarding the procedure and for the exact values.
104
105
106 Total mass [ton] Mass [ton] Weight distribution: The dry weight distribution over the length is shown in the following figures. The spikes represent the connection points and sensors. Please see [ER.1] for detailed information regarding the procedure and for the exact values. 1,6 1,4 1,2 1 0,8 0,6 0,4 0, Length [m] Length [m]
107 Mooring (end connections) Wave Current Marin Test Type Pretension Type H T Direction Velocity No. [-] [-] [kn] [-] [m] [s] [deg] [m/s] [-] Low mooring High Mooring Low 58.4 Regular Low 58.4 Regular Low 58.4 Regular Low 58.4 Regular Low 58.4 Regular Low 58.4 Regular Low 58.4 Regular Low 58.4 Regular Low 58.4 Regular Low 58.4 None Low 58.4 Regular Low 58.4 Regular Low 58.4 Regular Low 58.4 Regular Low 58.4 Regular Low 58.4 Regular Low 58.4 Regular Low 58.4 Regular Low 58.4 Regular Low 58.4 JONSWAP Low 58.4 JONSWAP Low 58.4 JONSWAP Low 58.4 JONSWAP Low 58.4 None Low 58.4 Regular Low 58.4 Regular Low 58.4 Regular Low 58.4 Regular Low 58.4 Regular Low 58.4 Regular Low 58.4 Regular Low 58.4 Regular Low 58.4 Regular Low 58.4 None Low 58.4 None
108 Mooring (end connections) Wave Current Marin Test Type Pretension Type H T Direction Velocity No. [-] [-] [kn] [-] [m] [s] [deg] [m/s] [-] High mooring Low 58.4 Regular Low 58.4 Regular Low 58.4 Regular Low 58.4 Regular Low 58.4 Regular Low 58.4 Regular Low 58.4 Regular Low 58.4 Regular Low 58.4 Regular Low 58.4 Regular Med 300 None Med 300 Regular Med 300 Regular Med 300 Regular Med 300 Regular Med 300 Regular Med 300 Regular Med 300 Regular Med 300 Regular Med 300 Regular Med 300 None Med 300 Regular Med 300 Regular Med 300 Regular Med 300 Regular Med 300 Regular Med 300 Regular Med 300 Regular Med 300 Regular Med 300 Regular Med 300 Regular Med 300 Regular Med 300 Regular Med 300 Regular Med 300 Regular Med 300 Regular Med 300 Regular
109 Mooring (end connections) Wave Current Marin Test Type Pretension Type H T Direction Velocity No. [-] [-] [kn] [-] [m] [s] [deg] [m/s] [-] High mooring Med 300 Regular High Regular High Regular High Regular High Regular High Regular High Regular High Regular High Regular High None Low 58.4 JONSWAP Med 300 None Med 300 JONSWAP High JONSWAP Low 58.4 JONSWAP Low 58.4 JONSWAP Med 300 JONSWAP Low 58.4 JONSWAP Low 58.4 Regular Secondary mooring Low 58.4 Regular Low 58.4 Regular Low 58.4 Regular Low 58.4 Regular Low 58.4 Regular Low 58.4 Regular Low 58.4 None Low 58.4 Regular Low 58.4 Regular Low 58.4 Regular Low 58.4 Regular Low 58.4 Regular Low 58.4 Regular Low 58.4 Regular Low 58.4 Regular
110 Mooring (end connections) Wave Current Marin Test Type Pretension Type H T Direction Velocity No. [-] [-] [kn] [-] [m] [s] [deg] [m/s] [-] Secondary Mooring Low 58.4 Regular Low 58.4 Regular Low 58.4 Regular Low 58.4 Regular Low 58.4 Regular Low 58.4 None Low 58.4 Regular Low 58.4 Regular Low 58.4 Regular Low 58.4 Regular Low 58.4 Regular Low 58.4 Regular Low 58.4 Regular Low 58.4 Regular Low 58.4 Regular Low 58.4 Regular Low 58.4 Regular Low 58.4 Regular Low 58.4 Regular Low 58.4 JONSWAP Low 58.4 JONSWAP Low 58.4 JONSWAP Low 58.4 JONSWAP
111 Overtopping in regular waves:
112
113
114 Overtopping in irregular waves:


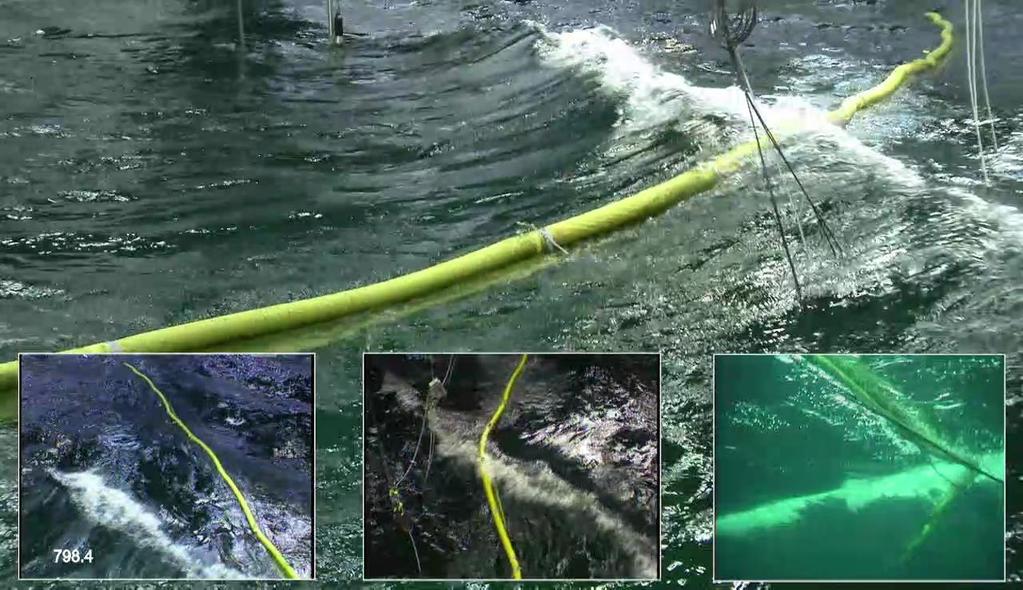
115
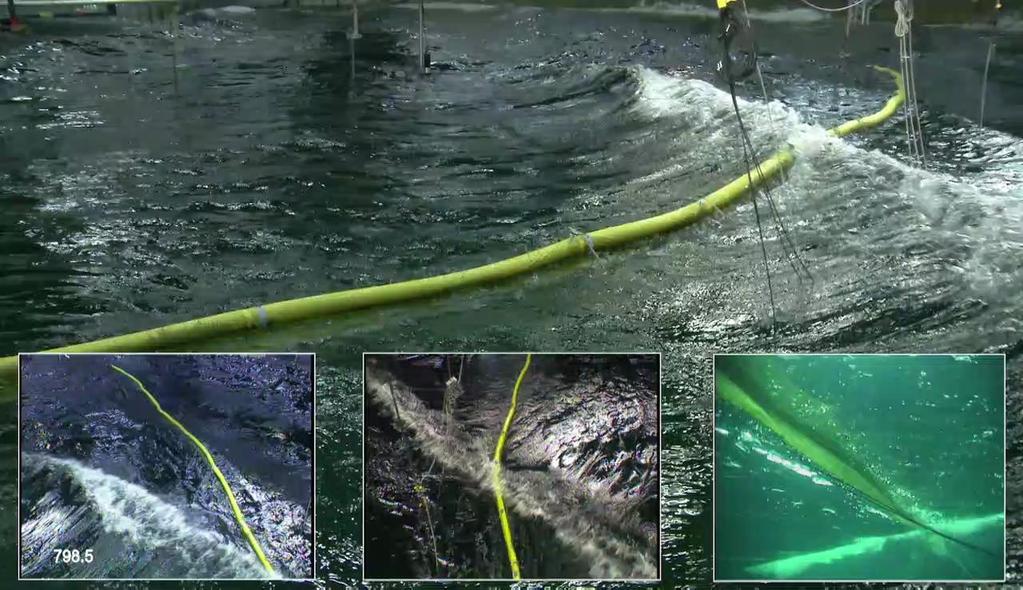
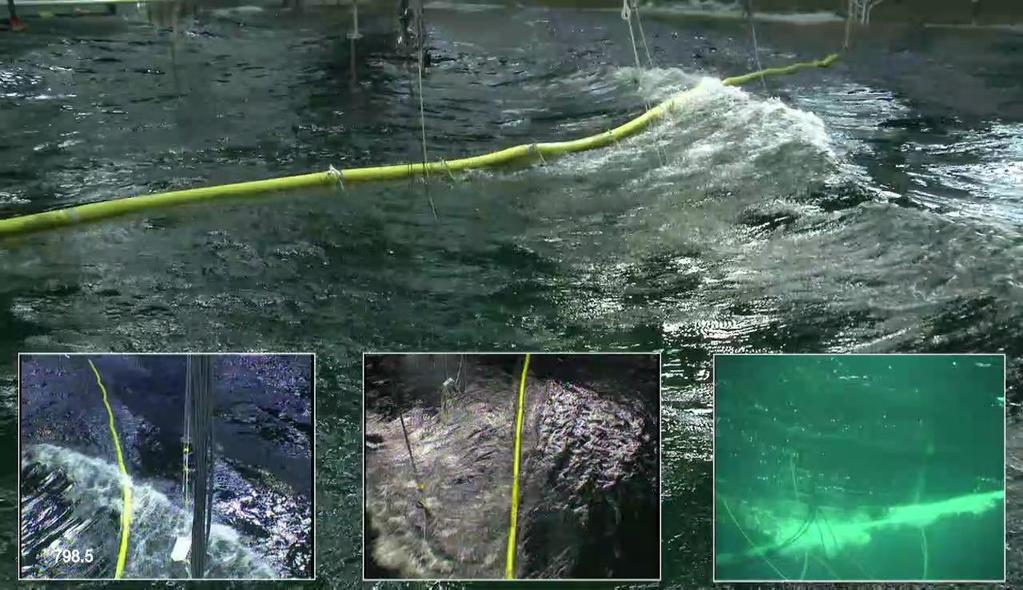
116
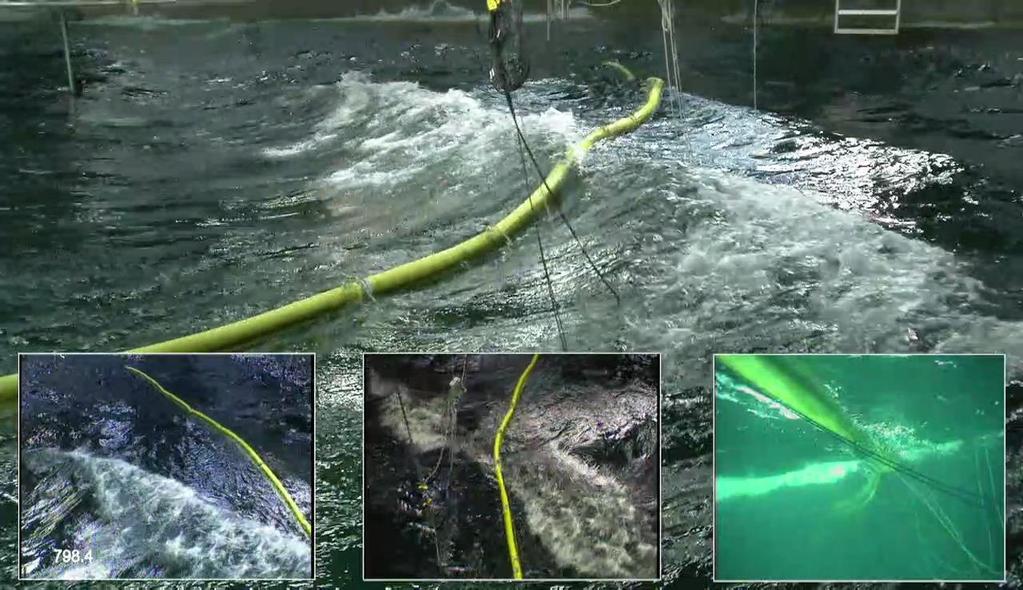
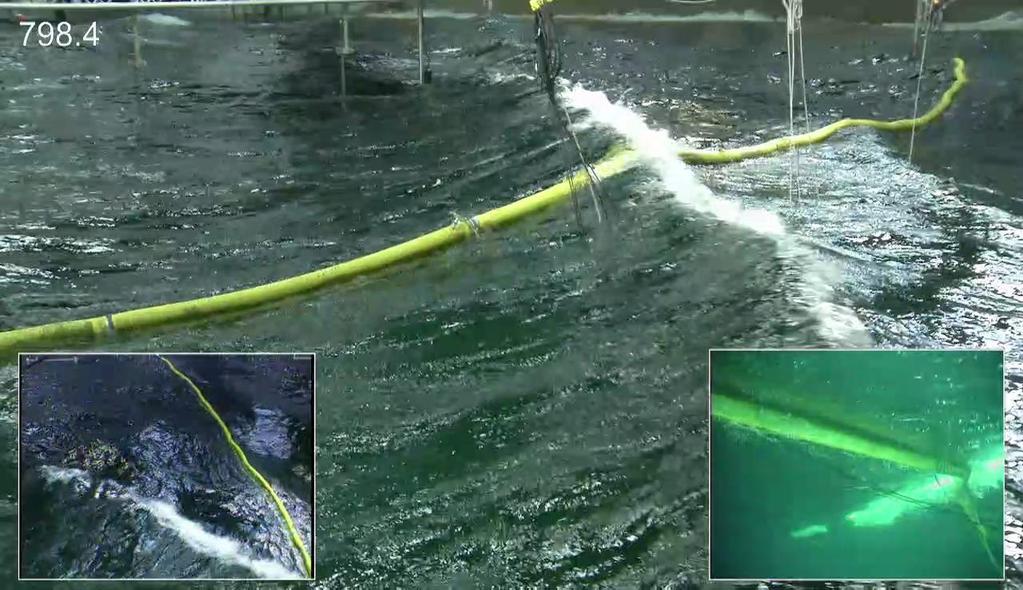
117
ITTC Recommended Procedures and Guidelines
 Page 1 of 6 Table of Contents 1. PURPOSE...2 2. PARAMETERS...2 2.1 General Considerations...2 3 DESCRIPTION OF PROCEDURE...2 3.1 Model Design and Construction...2 3.2 Measurements...3 3.5 Execution of
Catenary Mooring Chain Eigen Modes and the Effects on Fatigue Life
 Catenary Mooring Chain Eigen Modes and the Effects on Fatigue Life Tor Anders Nygaard and Jacobus de Vaal, IFE Morten Hviid Madsen and Håkon Andersen, Dr.techn Olav Olsen AS Jorge Altuzarra, Vicinay Marine
A NOVEL FLOATING OFFSHORE WIND TURBINE CONCEPT: NEW DEVELOPMENTS
 A NOVEL FLOATING OFFSHORE WIND TURBINE CONCEPT: NEW DEVELOPMENTS L. Vita, U.S.Paulsen, T.F.Pedersen Risø-DTU Technical University of Denmark, Roskilde, Denmark luca.vita@risoe.dk Abstract: A novel concept
Offshore Wind Turbine monopile in 50 year storm conditions
 TMR7 Experimental methods in marine hydrodynamics - lab exercise 3 2017 Offshore Wind Turbine monopile in 50 year storm conditions Trygve Kristiansen and Erin Bachynski, Trondheim, 20.09.2017 Background
Waves. G. Cowles. General Physical Oceanography MAR 555. School for Marine Sciences and Technology Umass-Dartmouth
 Waves G. Cowles General Physical Oceanography MAR 555 School for Marine Sciences and Technology Umass-Dartmouth Waves Sound Waves Light Waves Surface Waves Radio Waves Tidal Waves Instrument Strings How
Seakeeping Tests (with ships) Experimental Methods in Marine Hydrodynamics Lecture in week 43
 Experimental Methods in Marine Hydrodynamics Lecture in week 43") Seakeeping Tests (with ships) Experimental Methods in Marine Hydrodynamics Lecture in week 43 1 Topics Why do seakeeping tests? What to do? Activities Details of model test set-up and instrumentation Waves
Seakeeping Tests (with ships) Experimental Methods in Marine Hydrodynamics Lecture in week 43 1 Topics Why do seakeeping tests? What to do? Activities Details of model test set-up and instrumentation Waves
ITTC Recommended Procedures Testing and Extrapolation Methods Loads and Responses, Seakeeping Experiments on Rarely Occurring Events
 Loads and Responses, Seakeeping Page 1 of 5 CONTENTS 1. PURPOSE OF PROCEDURE 2. STANDARDS FOR EXPERIMENTS ON RARELY OCCURRING EVENTS 2.1 Previous Recommendations of ITTC 2.2 Model Design and Construction
REVISITING GLOBAL RESPONSE OF FPSOS IN SHALLOW WATER AND THE RISER ANALYSIS REQUIREMENTS
 REVISITING GLOBAL RESPONSE OF FPSOS IN SHALLOW WATER AND THE RISER ANALYSIS REQUIREMENTS AMIR H. IZADPARAST SENIOR RESEARCH ENGINEER, HYDRODYNAMICS AND MOORING TECHNOLOGY, SOFEC JIAXING CHEN RESEARCH ENGINEER,
Wave Forces on a Moored Vessel from Numerical Wave Model Results
 Wave Forces on a Moored Vessel from Numerical Wave Model Results ABSTRACT P W O BRIEN OMC International Pty Ltd, Melbourne, Australia O WEILER WL Delft Hydraulics, Delft, The Netherlands M BORSBOOM WL
Conventional Ship Testing
 Conventional Ship Testing Experimental Methods in Marine Hydrodynamics Lecture in week 34 Chapter 6 in the lecture notes 1 Conventional Ship Testing - Topics: Resistance tests Propeller open water tests
DP Ice Model Test of Arctic Drillship
 Author s Name Name of the Paper Session DYNAMIC POSITIONING CONFERENCE October 11-12, 211 ICE TESTING SESSION DP Ice Model Test of Arctic Drillship Torbjørn Hals Kongsberg Maritime, Kongsberg, Norway Fredrik
IMO REVISION OF THE INTACT STABILITY CODE. Proposal of methodology of direct assessment for stability under dead ship condition. Submitted by Japan
 INTERNATIONAL MARITIME ORGANIZATION E IMO SUB-COMMITTEE ON STABILITY AND LOAD LINES AND ON FISHING VESSELS SAFETY 49th session Agenda item 5 SLF 49/5/5 19 May 2006 Original: ENGLISH REVISION OF THE INTACT
EXPERIMENTAL STUDY ON THE HYDRODYNAMIC BEHAVIORS OF TWO CONCENTRIC CYLINDERS
 EXPERIMENTAL STUDY ON THE HYDRODYNAMIC BEHAVIORS OF TWO CONCENTRIC CYLINDERS *Jeong-Rok Kim 1), Hyeok-Jun Koh ), Won-Sun Ruy 3) and Il-Hyoung Cho ) 1), 3), ) Department of Ocean System Engineering, Jeju
EXPERIMENTAL INVESTIGATIONS OF BARGE FLOATER WITH MOONPOOL FOR 5 MW WIND TURBINE
 EXPERIMENTAL INVESTIGATIONS OF BARGE FLOATER WITH MOONPOOL FOR 5 MW WIND TURBINE 1 MR. G.VIJAYA KUMAR, 2 DR. R. PANNEER SELVAM 1 M.S. Research Scholar, Department of Ocean Engineering, IIT Madras, Chennai,
Offshore Oil and Gas Platforms for Deep Waters
 Offshore Oil and Gas Platforms for Deep Waters Atilla Incecik Department of Naval Architecture, Ocean and Marine Engineering University of Strathclyde, Glasgow, UK (atilla.incecik@strath.ac.uk) Summary
Chapter 11 Waves. Waves transport energy without transporting matter. The intensity is the average power per unit area. It is measured in W/m 2.
 Chapter 11 Waves Energy can be transported by particles or waves A wave is characterized as some sort of disturbance that travels away from a source. The key difference between particles and waves is a
Learn more at
 Full scale model tests of a steel catenary riser C. Bridge 1, H. Howells 1, N. Toy 2, G. Parke 2, R. Woods 2 1 2H Offshore Engineering Ltd, Woking, Surrey, UK 2 School of Engineering, University of Surrey,
Modelling and Simulation of Environmental Disturbances
 Modelling and Simulation of Environmental Disturbances (Module 5) Dr Tristan Perez Centre for Complex Dynamic Systems and Control (CDSC) Prof. Thor I Fossen Department of Engineering Cybernetics 18/09/2007
Modelling of Extreme Waves Related to Stability Research
 Modelling of Extreme Waves Related to Stability Research Janou Hennig 1 and Frans van Walree 1 1. Maritime Research Institute Netherlands,(MARIN), Wageningen, the Netherlands Abstract: The paper deals
CRITERIA OF BOW-DIVING PHENOMENA FOR PLANING CRAFT
 531 CRITERIA OF BOW-DIVING PHENOMENA FOR PLANING CRAFT Toru KATAYAMA, Graduate School of Engineering, Osaka Prefecture University (Japan) Kentarou TAMURA, Universal Shipbuilding Corporation (Japan) Yoshiho
CALCULATIONS OF THE MOTIONS OF A SHIP MOORED WITH MOORMASTER UNITS
 CALCULATIONS OF THE MOTIONS OF A SHIP MOORED WITH MOORMASTER UNITS By J. de Bont 1, W. van der Molen 2, J. van der Lem 3, H. Ligteringen 4, D. Mühlestein 5 and M. Howie 6 ABSTRACT Container ships should
U S F O S B u o y a n c y And Hydrodynamic M a s s
 1 U S F O S B u o y a n c y And Hydrodynamic M a s s 2 CONTENTS: 1 INTRODUCTION... 3 2 ACCURACY LEVELS... 3 2.1 LEVEL-0... 3 2.2 LEVEL-1... 3 2.3 PANEL MODEL... 3 3 EX 1. SINGLE PIPE. NON FLOODED... 4
High Speed Rail Tunnel Aerodynamics: Transient pressure and loadings on fixed tunnel equipment
 High Speed Rail Tunnel Aerodynamics: Transient pressure and loadings on fixed tunnel equipment Mohammad Tabarra & Richard Sturt Arup, UK Summary: Trains entering tunnels at high speeds can generate highly
Wave Motion. interference destructive interferecne constructive interference in phase. out of phase standing wave antinodes resonant frequencies
 Wave Motion Vocabulary mechanical waves pulse continuous periodic wave amplitude period wavelength period wave velocity phase transverse wave longitudinal wave intensity displacement amplitude phase velocity
WAVE IMPACTS DUE TO STEEP FRONTED WAVES
 WAVE IMPACTS DUE TO STEEP FRONTED WAVES Bas Buchner and Arjan Voogt Maritime Research Institute Netherlands (MARIN) b.buchner@marin.nl, a.j.voogt@marin.nl INTRODUCTION It is the question whether Rogue
Quantification of the Effects of Turbulence in Wind on the Flutter Stability of Suspension Bridges
 Quantification of the Effects of Turbulence in Wind on the Flutter Stability of Suspension Bridges T. Abbas 1 and G. Morgenthal 2 1 PhD candidate, Graduate College 1462, Department of Civil Engineering,
Sea State Analysis. Topics. Module 7 Sea State Analysis 2/22/2016. CE A676 Coastal Engineering Orson P. Smith, PE, Ph.D.
 Sea State Analysis Module 7 Orson P. Smith, PE, Ph.D. Professor Emeritus Module 7 Sea State Analysis Topics Wave height distribution Wave energy spectra Wind wave generation Directional spectra Hindcasting
Chapter 11 Waves. Waves transport energy without transporting matter. The intensity is the average power per unit area. It is measured in W/m 2.
 Energy can be transported by particles or waves: Chapter 11 Waves A wave is characterized as some sort of disturbance that travels away from a source. The key difference between particles and waves is
Sea State Estimation from an Advancing Ship
 Sea State Estimation from an Advancing Ship The wave buoy analogy Ulrik Dam Nielsen and Ingrid Marie Vincent Andersen Technical University of Denmark Presentation at Skibsteknisk Selskab March 5 th, 2012,
Exam Results, HW4 reminder. Wave Motion. Today: waves. What is moving? Motion of a piece of the rope. Exam Results. Average
 Exam Results, HW4 reminder Exam: Class average = 14.1/20 ( at B/BC boundary) Exam scores posted this afternoon on Learn@UW Exam solutions will be posted on course web page HW3 (short) assigned at WileyPLUS
COMPARISON OF CONTEMPORANEOUS WAVE MEASUREMENTS WITH A SAAB WAVERADAR REX AND A DATAWELL DIRECTIONAL WAVERIDER BUOY
 COMPARISON OF CONTEMPORANEOUS WAVE MEASUREMENTS WITH A SAAB WAVERADAR REX AND A DATAWELL DIRECTIONAL WAVERIDER BUOY Scott Noreika, Mark Beardsley, Lulu Lodder, Sarah Brown and David Duncalf rpsmetocean.com
STATION KEEPING EXTENSIVE MODEL TESTING OF A DRY-TREE SPREAD-MOORED BARGE IN BRAZILLIAN WATERS
 STATION KEEPING EXTENSIVE MODEL TESTING OF A DRY-TREE SPREAD-MOORED BARGE IN BRAZILLIAN WATERS Arjan Voogt (MARIN) and Mamoun Naciri (SBM) Deep Offshore Technology XIV (DOT-2002) ABSTRACT This paper describes
Thomas Lykke Andersen, Morten Kramer, Peter Frigaard November 2003
 Thomas Lykke Andersen, Morten Kramer, Peter Frigaard November 2003 HYDRAULICS & COASTAL ENGINEERING LABORATORY AALBORG UNIVERSITY DEPARTMENT OF CIVIL ENGINEERING SOHNGAARDSHOLMSVEJ 57 DK-9000 AALBORG DENMARK
Waves Part II. non-dispersive (C g =C)
") Waves Part II Previously we discussed Surface Gravity Waves Deep Water Waves Shallow Water Waves C g T 2 C g h dispersive (C g =C/2) Definitions: phase speed C= /T= /k non-dispersive (C g =C) group speed
Waves Part II Previously we discussed Surface Gravity Waves Deep Water Waves Shallow Water Waves C g T 2 C g h dispersive (C g =C/2) Definitions: phase speed C= /T= /k non-dispersive (C g =C) group speed
INTERNATIONAL JOURNAL OF CIVIL AND STRUCTURAL ENGINEERING Volume 1, No 4, 2010
 Effect of geometric dimensions on the transmission coefficient of floating breakwaters Mohammad Hosein Tadayon, Khosro Bargi 2, Hesam Sharifian, S. Reza Hoseini - Ph.D student, Department of Civil Engineering,
Gravity wave effects on the calibration uncertainty of hydrometric current meters
 Gravity wave effects on the calibration uncertainty of hydrometric current meters Marc de Huu and Beat Wüthrich Federal Office of Metrology METAS, Switzerland E-mail: marc.dehuu@metas.ch Abstract Hydrometric
A STUDY OF THE LOSSES AND INTERACTIONS BETWEEN ONE OR MORE BOW THRUSTERS AND A CATAMARAN HULL
 A STUDY OF THE LOSSES AND INTERACTIONS BETWEEN ONE OR MORE BOW THRUSTERS AND A CATAMARAN HULL L Boddy and T Clarke, Austal Ships, Australia SUMMARY CFD analysis has been conducted on a 100m catamaran hull
EXPERIMENTAL MEASUREMENT OF THE WASH CHARACTERISTICS OF A FAST DISPLACEMENT CATAMARAN IN DEEP WATER
 EXPERIMENTAL MEASUREMENT OF THE WASH CHARACTERISTICS OF A FAST DISPLACEMENT CATAMARAN IN DEEP WATER A.F. Molland, P.A. Wilson and D.J. Taunton Ship Science Report No. 124 University of Southampton December
MODELLING THE CAISSON PLACEMENT AT THE CHIOGGIA INLET, VENICE. Bas Hofland 1 and Nico Vink 2
 MODELLING THE CAISSON PLACEMENT AT THE CHIOGGIA INLET, VENICE Bas Hofland 1 and Nico Vink 2 In the summer of 2014 Strukton Immersion Projects has placed the foundation caissons of the Venice flood barrier
Aalborg Universitet. Published in: Proceedings of Offshore Wind 2007 Conference & Exhibition. Publication date: 2007
 Aalborg Universitet Design Loads on Platforms on Offshore wind Turbine Foundations with Respect to Vertical Wave Run-up Damsgaard, Mathilde L.; Gravesen, Helge; Andersen, Thomas Lykke Published in: Proceedings
Dynamic Positioning Control Augmentation for Jack-up Vessels
 DYNAMIC POSITIONING CONFERENCE October 9-10, 2012 Design and Control Session Dynamic Positioning Control Augmentation for Jack-up Vessels By Bradley Deghuee L-3 Communications 1 Introduction Specialized
SUPERGEN Wind Wind Energy Technology Rogue Waves and their effects on Offshore Wind Foundations
 SUPERGEN Wind Wind Energy Technology Rogue Waves and their effects on Offshore Wind Foundations Jamie Luxmoore PhD student, Lancaster University SUPERGEN Wind II - 7 th training seminar 3 rd - 4 th September
NUMERICAL INVESTIGATION OF THE FLOW BEHAVIOUR IN A MODERN TRAFFIC TUNNEL IN CASE OF FIRE INCIDENT
 - 277 - NUMERICAL INVESTIGATION OF THE FLOW BEHAVIOUR IN A MODERN TRAFFIC TUNNEL IN CASE OF FIRE INCIDENT Iseler J., Heiser W. EAS GmbH, Karlsruhe, Germany ABSTRACT A numerical study of the flow behaviour
PUV Wave Directional Spectra How PUV Wave Analysis Works
 PUV Wave Directional Spectra How PUV Wave Analysis Works Introduction The PUV method works by comparing velocity and pressure time series. Figure 1 shows that pressure and velocity (in the direction of
Dynamic Stability of Ships in Waves
 Gourlay, T.P. & Lilienthal, T. 2002 Dynamic stability of ships in waves. Proc. Pacific 2002 International Maritime Conference, Sydney, Jan 2002. ABSTRACT Dynamic Stability of Ships in Waves Tim Gourlay
Lesson 14: Simple harmonic motion, Waves (Sections )
") Circular Motion and Simple Harmonic Motion The projection of uniform circular motion along any ais (the -ais here) is the same as simple harmonic motion. We use our understanding of uniform circular motion
Circular Motion and Simple Harmonic Motion The projection of uniform circular motion along any ais (the -ais here) is the same as simple harmonic motion. We use our understanding of uniform circular motion
ITTC Recommended Procedures and Guidelines
 Page 1 of 12 Table of Contents... 2 1. PURPOSE OF PROCEDURE... 2 2. PROCEDURE FOR FLOATING OFFSHORE PLATFORM EXPERIMENTS... 2 2.1 Test Agenda and Run Matrix.... 2 2.2 Model Geometry... 2 2.3 Ballasting
DYNAMIC POSITIONING CONFERENCE October 7-8, New Applications. Dynamic Positioning for Heavy Lift Applications
 Return to Session Directory DYNAMIC POSITIONING CONFERENCE October 7-8, 2008 New Applications Dynamic Positioning for Heavy Lift Applications John Flint and Richard Stephens Converteam UK Ltd. (Rugby,
Abstract. 1 Introduction
 A computational method for calculatingthe instantaneous restoring coefficients for a ship moving in waves N. El-Simillawy College of Engineering and Technology, Arab Academyfor Science and Technology,
OTC Copyright 2003, Offshore Technology Conference
 OTC 54 Model Test Experience on Vortex Induced Vibrations of Truss Spars Radboud van Dijk, Maritime Research Institute Netherlands, Allan Magee, Technip Offshore, Inc., Steve Perryman, BP Americas, Inc.,
Physical Model for the Filling and Emptying System of the Third Set of Panama locks
 Physical Model for the Filling and Emptying System of the Third Set of Panama locks Roumieu P. CNR - Consorcio Pos Panamax France p.roumieu@cnr.tm.fr De Regge J Technum Consorcio Pos Panamax Belgium jdr@technum.be
INSTRUMENT INSTRUMENTAL ERROR (of full scale) INSTRUMENTAL RESOLUTION. Tutorial simulation. Tutorial simulation
 INSTRUMENTAL RESOLUTION. Tutorial simulation. Tutorial simulation") Lab 1 Standing Waves on a String Learning Goals: To distinguish between traveling and standing waves To recognize how the wavelength of a standing wave is measured To recognize the necessary conditions
Lab 1 Standing Waves on a String Learning Goals: To distinguish between traveling and standing waves To recognize how the wavelength of a standing wave is measured To recognize the necessary conditions
Comparison of coupled aero-hydro-servo-elastic simulations for floating wind turbines with model tests
 Comparison of coupled aero-hydro-servo-elastic for floating wind turbines with Georgios Chrysagis Delft University of Technology, The Netherlands Email: georgechrysagis@hotmail.com September 2016 Key words:
The Usage of Propeller Tunnels For Higher Efficiency and Lower Vibration. M. Burak Şamşul
 The Usage of Propeller Tunnels For Higher Efficiency and Lower Vibration M. Burak Şamşul ITU AYOC 2014 - Milper Pervane Teknolojileri Company Profile MILPER is established in 2011 as a Research and Development
Friction properties of the face of a hand-held tennis racket
 Available online at www.sciencedirect.com Procedia Engineering 34 (2012 ) 544 549 9 th Conference of the International Sports Engineering Association (ISEA) Friction properties of the face of a hand-held
COUPLED DYNAMIC ANALYSIS OF MOORING LINES FOR DEEP WATER FLOATING SYSTEMS
 Proceedings of International Conference in Ocean Engineering, ICOE Proceedings 2009 of ICOE 2009 Coupled Dynamic Analysis IIT Madras, of Chennai, Mooring India. Lines for Deep Water Floating Systems 1-5
Wave Generation. Chapter Wave Generation
 Chapter 5 Wave Generation 5.1 Wave Generation When a gentle breeze blows over water, the turbulent eddies in the wind field will periodically touch down on the water, causing local disturbances of the
Chapter 14. Vibrations and Waves
 Chapter 14 Vibrations and Waves Chapter 14 Vibrations and Waves In this chapter you will: Examine vibrational motion and learn how it relates to waves. Determine how waves transfer energy. Describe wave
DETRMINATION OF A PLUNGER TYPE WAVE MAKER CHARACTERISTICE IN A TOWING TANK
 The 9 th International Conference on Coasts, Ports and Marine Structures (ICOPMAS 2010) 29 Nov.-1 Dec. 2010 (Tehran) DETRMINATION OF A PLUNGER TYPE WAVE MAKER CHARACTERISTICE IN A TOWING TANK sayed mohammad
COMPUTATIONAL FLOW MODEL OF WESTFALL'S LEADING TAB FLOW CONDITIONER AGM-09-R-08 Rev. B. By Kimbal A. Hall, PE
 COMPUTATIONAL FLOW MODEL OF WESTFALL'S LEADING TAB FLOW CONDITIONER AGM-09-R-08 Rev. B By Kimbal A. Hall, PE Submitted to: WESTFALL MANUFACTURING COMPANY September 2009 ALDEN RESEARCH LABORATORY, INC.
Yasuyuki Hirose 1. Abstract
 Study on Tsunami force for PC box girder Yasuyuki Hirose 1 Abstract In this study, a waterway experiment was performed in order to understand the influence of tsunami forms on tsunami forces acting on
E02 Rigid hinged stinger with piggyback line
 E02 Rigid hinged stinger with piggyback line This model represents a rigid stinger hinged off the back of a lay vessel using the pipelay supports feature. In addition to the lay pipe, another line is included
INTRODUCTION TO WAVES. Dr. Watchara Liewrian
 INTRODUCTION TO WAVES Dr. Watchara Liewrian What are Waves? Rhythmic disturbances that carry energy without carrying matter Types of Waves Mechanical Waves need matter (or medium) to transfer energy A
Similarly to elastic waves, sound and other propagated waves are graphically shown by the graph:
 Phys 300/301 Physics: Algebra/Trig Eugene Hecht, 3e. Prepared 01/24/06 11.0 Waves & Sounds There are two fundamental waves of transporting energy and momentum: particles and waves. While they seem opposites,
Numerical Simulation of Wave Loads on Static Offshore Structures
 Numerical Simulation of Wave Loads on Static Offshore Structures Hrvoje Jasak, Inno Gatin, Vuko Vukčević Wikki Ltd, United Kingdom Faculty of Mechanical Engineering and Naval Architecture University of
The behaviour of tsunamis
 195 The behaviour of tsunamis Maurice N. Brearley 1 Introduction The behaviour of tsunamis is not easily understood. Readers comments on a recently published paper [3] show that a mathematical analysis
Design of a Linear Electrical Machine for a Wave Generation System in the Maltese Waters
 Design of a Linear Electrical Machine for a Wave Generation System in the Maltese Waters Xuereb Annalise 1, Spiteri Staines Cyril 1, Sant Tonio 1, Mule` Stagno Luciano 2 1 Faculty of Engineering 2 Institute
Control of surge and pitch motions of a rectangular floating body using internal sloshing phenomena. Minho Ha and *Cheolung Cheong 1)
") Control of surge and pitch motions of a rectangular floating body using internal sloshing phenomena Minho Ha and *Cheolung Cheong 1) School of Mechanical Engineering, PNU, Busan 609-735, Korea 1) ccheong@pusan.ac.kr
Control of surge and pitch motions of a rectangular floating body using internal sloshing phenomena Minho Ha and *Cheolung Cheong 1) School of Mechanical Engineering, PNU, Busan 609-735, Korea 1) ccheong@pusan.ac.kr
INTERACTION BETWEEN WIND-DRIVEN AND BUOYANCY-DRIVEN NATURAL VENTILATION Bo Wang, Foster and Partners, London, UK
 INTERACTION BETWEEN WIND-DRIVEN AND BUOYANCY-DRIVEN NATURAL VENTILATION Bo Wang, Foster and Partners, London, UK ABSTRACT Ventilation stacks are becoming increasingly common in the design of naturally
A.J.C. Crespo, J.M. Domínguez, C. Altomare, A. Barreiro, M. Gómez-Gesteira
 A.J.C. Crespo, J.M. Domínguez, C. Altomare, A. Barreiro, M. Gómez-Gesteira OUTLINE Oscillating Water Column - What OWC is? - Numerical modelling of OWC SPH functionalities - Wave generation (1 st order
High-Resolution Measurement-Based Phase-Resolved Prediction of Ocean Wavefields
 DISTRIBUTION STATEMENT A. Approved for public release; distribution is unlimited. High-Resolution Measurement-Based Phase-Resolved Prediction of Ocean Wavefields Dick K.P. Yue Center for Ocean Engineering
Waves. harmonic wave wave equation one dimensional wave equation principle of wave fronts plane waves law of reflection
 Waves Vocabulary mechanical wave pulse continuous periodic wave amplitude wavelength period frequency wave velocity phase transverse wave longitudinal wave intensity displacement wave number phase velocity
GEA FOR ADVANCED STRUCTURAL DYNAMIC ANALYSIS
 SMART SOLUTIONS FOR VIBRATION MONITORING GEA FOR ADVANCED STRUCTURAL DYNAMIC ANALYSIS ANALYSIS OF CIVIL STRUCTURES - EXPO MERLATA PEDESTRIAN BRIDGE ABSTRACT Civil structures and in particular bridges and
Physics 11. Unit 7 (Part 1) Wave Motion
 Wave Motion") Physics 11 Unit 7 (Part 1) Wave Motion 1. Introduction to wave Wave motion is a popular phenomenon that we observe often in our daily lives. For example, light waves, sound waves, radio waves, water waves,
Physics 11 Unit 7 (Part 1) Wave Motion 1. Introduction to wave Wave motion is a popular phenomenon that we observe often in our daily lives. For example, light waves, sound waves, radio waves, water waves,
Special edition paper
 Development of a Track Management Method for Shinkansen Speed Increases Shigeaki Ono** Takehiko Ukai* We have examined the indicators of appropriate track management that represent the ride comfort when
Airy Wave Theory 2: Wave Orbitals and Energy. Compilation of Airy Equations
 Airy Wave Theory 2: Wave Orbitals and Energy Compilation of Airy Equations 1 Orbital Motion of Water Particles Airy Wave Theory also predicts water particle orbital path trajectories. Orbital path divided
Dynamic Component of Ship s Heeling Moment due to Sloshing vs. IMO IS-Code Recommendations
 International Journal on Marine Navigation and Safety of Sea Transportation Volume 4 Number 3 September 2010 Dynamic Component of Ship s Heeling Moment due to Sloshing vs. IMO IS-Code Recommendations P.
Deepwater Floating Production Systems An Overview
 Deepwater Floating Production Systems An Overview Introduction In addition to the mono hull, three floating structure designs Tension leg Platform (TLP), Semisubmersible (Semi), and Truss Spar have been
Sea state estimation from an advancing ship - The wave buoy analogy Presentation at Skibsteknisk Selskab
 Downloaded from orbit.dtu.dk on: Nov 17, 2018 Sea state estimation from an advancing ship - The wave buoy analogy Presentation at Skibsteknisk Selskab Nielsen, Ulrik Dam; Andersen, Ingrid Marie Vincent
Coupling and Analysis of 981 Deep Water Semi-submersible. Drilling Platform and the Mooring System
 4th International Conference on Renewable Energy and Environmental Technology (ICREET 2016) Coupling and Analysis of 981 Deep Water Semi-submersible Drilling Platform and the Mooring System XuDong Wang1,
Wave phenomena in a ripple tank
 Wave phenomena in a ripple tank LEP Related topics Generation of surface waves, propagation of surface waves, reflection of waves, refraction of waves, Doppler Effect. Principle Water waves are generated
for Naval Aircraft Operations
 Seakeeping Assessment of Large Seakeeping Assessment of Large Trimaran Trimaran for Naval Aircraft Operations for Naval Aircraft Operations Presented by Mr. Boyden Williams, Mr. Lars Henriksen (Viking
Hywind. Deep offshore wind operational experience. Finn Gunnar Nielsen, Statoil RDI
 Hywind. Deep offshore wind operational experience. Finn Gunnar Nielsen, Statoil RDI The starting point -2001 Inspired by floating sailing marks. Seawind matured during 2002 Tong, K.C. OWEMES seminar, Atena,
Mechanical waves Electromagnetic waves
 Waves Energy can be transported by transfer of matter. For example by a thrown object. Energy can also be transported by wave motion without the transfer of matter. For example by sound waves and electromagnetic
A PHASE-AMPLITUDE ITERATION SCHEME FOR THE OPTIMIZATION OF DETERMINISTIC WAVE SEQUENCES
 Proceedings of the ASME 29 28th International Conference on Ocean, Offshore and Arctic Engineering OMAE29 May 31 - June, 29, Honolulu, Hawaii, USA Proceedings of the ASME 28th International Conference
Chapter # 08 Waves. [WAVES] Chapter # 08
![Chapter # 08 Waves. [WAVES] Chapter # 08](/thumbs/94/121079132.jpg "Chapter # 08 Waves. [WAVES] Chapter # 08") Chapter # 08 Waves Q2) Write short answers of the following questions. i) What is the difference between progressive and stationary waves? Answer: Progressive Waves 1 Progressive waves are the result of
Chapter # 08 Waves Q2) Write short answers of the following questions. i) What is the difference between progressive and stationary waves? Answer: Progressive Waves 1 Progressive waves are the result of
SAMPLE MAT Proceedings of the 10th International Conference on Stability of Ships
 and Ocean Vehicles 1 Application of Dynamic V-Lines to Naval Vessels Matthew Heywood, BMT Defence Services Ltd, mheywood@bm tdsl.co.uk David Smith, UK Ministry of Defence, DESSESea-ShipStab1@mod.uk ABSTRACT
A Simple Horizontal Velocity Model of a Rising Thermal Instability in the Atmospheric Boundary Layer
 A Simple Horizontal Velocity Model of a Rising Thermal Instability in the Atmospheric Boundary Layer (In other words, how to take a closer look at downwind thermal drift) Abstract This pilot, as well as
Flexible Spools Solution at Hybrid Risers Base A. Karnikian, Total and S. Tarbadar, M. Bonnissel, S. Legeay, Technip France
 DOT-2014 Flexible Spools Solution at Hybrid Risers Base A. Karnikian, Total and S. Tarbadar, M. Bonnissel, S. Legeay, Technip France Copyright 2014, Deep Offshore Technology International This paper was
g L Agenda Chapter 13 Problem 28 Equations of Motion for SHM: What if we have friction or drag? Driven Oscillations; Resonance 4/30/14 k m f = 1 2π
 Agenda Today: HW quiz, More simple harmonic motion and waves Thursday: More waves Midterm scores will be posted by Thursday. Chapter 13 Problem 28 Calculate the buoyant force due to the surrounding air
E. Agu, M. Kasperski Ruhr-University Bochum Department of Civil and Environmental Engineering Sciences
 EACWE 5 Florence, Italy 19 th 23 rd July 29 Flying Sphere image Museo Ideale L. Da Vinci Chasing gust fronts - wind measurements at the airport Munich, Germany E. Agu, M. Kasperski Ruhr-University Bochum
Numerical Simulations of a Train of Air Bubbles Rising Through Stagnant Water
 Numerical Simulations of a Train of Air Bubbles Rising Through Stagnant Water Hong Xu, Chokri Guetari ANSYS INC. Abstract Transient numerical simulations of the rise of a train of gas bubbles in a liquid
Chapter 16. Waves-I Types of Waves
 Chapter 16 Waves-I 16.2 Types of Waves 1. Mechanical waves. These waves have two central features: They are governed by Newton s laws, and they can exist only within a material medium, such as water, air,
Bending Vibration Analysis of Pipes and Shafts Arranged in Fluid Filled Tubular Spaces Using FEM
 Bending Vibration Analysis of Pipes and Shafts Arranged in Fluid Filled Tubular Spaces Using FEM By Desta Milkessa Under the guidance of : Prof. Dr.Eng. Patrick Kaeding Dipl.-Ing. Michael Holtmann Developed
Copyright: DOI link to article: Date deposited: Newcastle University eprints - eprint.ncl.ac.uk
 Yang S-H, Ringsberg JW, Johnson E, Hu Z, Bergdahl L, Duan F. Experimental and numerical investigation of a taut-moored wave energy converter: A validation of simulated buoy motions. Proceedings of the
Development of Self-Installing Deepwater Spar. Ashit Jadav February 2017
 Development of Self-Installing Deepwater Spar Ashit Jadav February 2017 Contents Introduction & Background ACE Spar breakdown Installation Sequence Main particulars, Hull design and Weight control Stability
Offshore engineering science
 Offshore engineering science In this research stream theoretical models advanced geotechnical models and new numerical techniques were used in applied offshore engineering topics such as loading, design
Lab test 4 Seakeeping test with a model of an oil tanker
 Lab test 4 Seakeeping test with a model of an oil tanker The response amplitude operators (RAO) in head seas of a 1:100 scale model of a 257 m long oil tanker shall be determined by model testing in the
Development of TEU Type Mega Container Carrier
 Development of 8 700 TEU Type Mega Container Carrier SAKAGUCHI Katsunori : P. E. Jp, Manager, Ship & Offshore Basic Design Department, IHI Marine United Inc. TOYODA Masanobu : P. E, Jp, Ship & Offshore
Section 1 Types of Waves
 CHAPTER OUTLINE Section 1 Types of Waves Key Idea questions > What does a wave carry? > How are waves generated? > What is the difference between a transverse wave and a longitudinal wave? > How do the