Westmoreland County Shoreline Management Plan
|
|
|
- Kerry Bailey
- 6 years ago
- Views:
Transcription


1 Westmoreland County Shoreline Management Plan Prepared for Westmoreland County and Virginia Coastal Zone Management Program Virginia Institute of Marine Science College of William & Mary Gloucester Point, Virginia February 2013
2


3 Westmoreland County Shoreline Management Plan Prepared for Westmoreland County and Virginia Coastal Zone Management Program Shoreline Studies Program Center for Coastal Resources Management C. Scott Hardaway, Jr. Marcia Berman Donna A. Milligan Tamia Rudnicky Christine A. Wilcox Karinna Nunez Mary C. Cox Sharon Killeen Virginia Institute of Marine Science College of William & Mary Gloucester Point, Virginia This project was funded by the Virginia Coastal Zone Management Program at the Department of Environmental Quality through Grant #NA11NOS of the U.S. Department of Commerce, National Oceanic and Atmospheric Administration, under the Coastal Zone Management Act of 1972, as amended. The views expressed herein are those of the authors and do not necessarily reflect the views of the U.S. Department of Commerce, NOAA, or any of its subagencies. February 2013
4 Westmoreland County
5 Table of Contents 1 Introduction Coastal Setting Geology/Geomorphology Coastal Hydrodynamics Wave Climate Sea-Level Rise Shore Erosion Shoreline Best Management Practices Implications of Traditional Erosion Control Treatments Shoreline Best Management Practices The Living Shoreline Alternative Non-Structural Design Considerations Structural Design Considerations Methods Shore Status Assessment Geospatial Shoreline Management Model Shoreline Management for Westmoreland County Shoreline Management Model (SMM) Results Shore Segments of Concern /Interest Stratford Harbour (Area of Concern) Betty s Neck (Area of Interest) Beach Road (Area of Concern Mouth of Rosier Creek (Area of Interest) Summary and Links to Additional Resources References Appendix 1: Shoreline Management Model Graphic...32 Appendix 2: Glossary of Shoreline Best Management Practices Appendix 3: Guidance for Structural Design and Construction in Westmoreland County Appendix 4: Description of Geologic Units Shoreline Management Plan
6 List of Figures Figure 1-1. Location of Westmoreland County within the Chesapeake Bay estuarine system. The location of National Oceanic and Atmospheric Administration tide gauges also are shown...1 Figure 2-1. Location of the shoreline features of Westmoreland County... 2 Figure 2-2. Figure 2-3. Figure 2-4. Figure 2-5. Figure 2-6. Figure 2-7. Figure 2-8. Figure 2-9. Figure Geology of the Central Reach (Mixon et al., 1989) overlain on a USGS topographic map. The complete description of the geologic formations is shown in Appendix Stratigraphic section of Nomini Cliffs in Westmoreland County (from Stephenson and MacNeil, 1954)...3 Nomini Cliffs along the Potomac River and their exposed strata...3 The cliffs along Westmoreland County have ancient upland drainages through which overland flow and groundwater enter the River...3 Geology of the Upriver Reach (Mixon et al., 1989) overlain on a USGS topographic map. The complete description of the geologic formations is shown in Appendix Exposed Pleistocene strata along the George Washington Birthplace National Monument... 4 Modified shoreline of the Upriver Reach. Top: Bulkheads and revetments protect houses built close to the shoreline. Bottom: A breakwater system with beach and vegetation at the southern end of the Town of Colonial Beach...5 Geology of the Downriver Reach (Mixon et al., 1989) overlain on a USGS topographic map. The complete description of the geologic formations is shown in Appendix Location of spits in Lower Machodoc Creek...5 Figure The deterioration of Hollis Marsh between 1937 and Figure Geology of Westmoreland County s Rappahannock River shore zone (Mixon et al., 1989) overlain on a USGS topographic map. The complete description of the geologic formations is shown in Appendix Figure The low, Pleistocene upland banks along the Rappahannock River Figure Cliffs along Westmoreland County s Rappahannock River shoreline...7 Figure Average fetch exposures along Westmoreland County s main shorelines... 8 Figure Wave heights along Potomac River summarized from Basco and Shin (1993), Milligan et al. (2002), Hardaway et al. (2009), and Hardaway and Milligan (2009)... 8 Figure Figure 3-1. Map of the FEMA floodplains for the 100 year and 500 year events (Westmoreland County, 2010)... 9 One example of forest management in Westmoreland County. The edge of the bank is kept free of tree and shrub growth to reduce bank loss from tree fall...12 Westmoreland County
7 Figure 3-2. Figure 3-3. Figure 3-4. Figure 3-5. Figure 3-6. Figure 3-7. Figure 3-8. Figure 3-9. Maintaining and enhancing the riparian and marsh buffers can maintain a stable coastal slope...12 Bank grading in Westmoreland County reduces steepness and improves growing conditions for vegetation stabilization This low-energy site had minor bank grading, and Spartina alterniflora planted. This photo shows the site after 24 years Sand fill with stone sills and marsh plantings at Poplar Grove, Mathews County, Virginia after six years and the cross-section used for construction (From Hardaway et al., 2010b)...14 Longwood University s Hull Springs Farm four years after construction and the cross-section used for construction (from Hardaway et al., 2010a)...15 High sills built along Westmoreland State Park s high energy, high bank shoreline. The material that slumps from the bank will be caught behind the sills and stabilize the base of the bank by protecting it from wave attack. A more recent photo shows that the slump material is starting to become vegetated The breakwaters at Colonial Beach provide a wide recreational beach as well as storm erosion protection for the residential upland. These structures were installed in Headland attached breakwaters at Westmoreland State Park. These structures were built relatively closely-space to provide a recreational beach as well as to protect the infrastructure including the pool and bathhouses Figure Headland attached breakwaters along the Potomac River at the Yeocomico River. The breakwaters hold a spit that protects the shoreline in its lee. A sill protects the back side of the spit. To protect breakthrough flooding, an upland revetment was built on the narrowest section of the spit Figure 5-1. Figure 5-2. Figure 5-3. Figure 5-4. Figure 5-5. Figure 5-6. Portal for Comprehensive Coastal Resource Management in Westmoreland County...21 The Map Viewer displays the preferred Shoreline BMPs in the map window. The color-coded legend in the panel on the right identifies the treatment option recommended...22 The pop-up window contains information about the recommended Shoreline BMP at the site selected. Additional information about the condition of the shoreline is also given...22 The proximity of the top of eroding bank to houses is shown at Stratford Harbour...23 Exposed, eroding bank just east of Nomini Cliffs. The Seaboxes have held the bank slump material and allowed it to become vegetated increasing the stability of the bank Site-specific application of the Shoreline Management Model recommendation for Stratford Harbour. The breakwater system will stabilize the base of the bank, but the strategy does not address top of cliff erosion Shoreline Management Plan
8 Figure 5-7. Figure 5-8. Google Earth image showing the location of Bettys Neck...25 Eroding banks along the property ready for development along Bettys Neck...25 Figure 5-9. Photo of the spit and protected bank along Bettys Neck Figure Recommended configuration of structures at Bettys Neck Figure Figure Figure Appendix 3 Captions Eroding Beach Road shoreline between two existing revetments...27 Location of spit near the mouth of Rosier Creek and the existing bulkhead and 2009 shorelines from Milligan et al. (2012) Photo showing the bulkhead along the spit in Rosier Creek with a failed section and toe stone Figure 1. Figure 2. Figure 3. Typical cross-section for a low sill that is appropriate for low to medium energy shorelines of Westmoreland County. The project utilizes clean sand on an 10:1 (H:V) slope, and the bank can be graded to a (minimum) 2:1 slope, if appropriate Typical cross-section for a high sill that is appropriate for the medium to high energy shorelines of Westmoreland County. The project utilizes clean sand on an 10:1 (H:V) slope, and the bank can be graded to a (minimum) 2:1 slope, if appropriate Typical cross-section for a breakwater system that is appropriate for the medium to high energy shorelines of Westmoreland County. Shown is the cross-section for the tombolo and rock structure. In addition, the typical cross-section for the bay beach between the structures is superimposed in a slightly different color. Note: the beach material is the same for the two cross-sections List of Tables Table year, 50 year, 100 year, and 500 year storm events. Source: Westmoreland County Flood Report, FEMA (2009) Table 2-2. Average long-term shoreline rates of change ( ). From Milligan et al., Table 3-1. Shoreline Best Management Practices Table 4-1. Shoreline Management Model (SMM) Data Sources and Applications Table 4-2. Shoreline Management Model - Preferred Shoreline Best Management Practices Table 5-2. Occurrence of descriptive Shoreline BMPs in Westmoreland County Westmoreland County

9 1 Introduction With approximately 85 percent of the Chesapeake Bay shoreline privately owned, a critical need exists to increase awareness of erosion potential and the choices available for shore stabilization that maintains ecosystem services at the land-water interface. The National Academy of Science recently published a report that spotlights the necessity of developing a shoreline management framework (NRC, 2007). It suggests that improving awareness of the choices available for erosion control, considering cumulative consequences of erosion mitigation approaches, and improving shoreline management planning are key elements to minimizing adverse environmental impacts associated with mitigating shore erosion. Actions taken by waterfront property owners to stabilize the shoreline can affect the health of the Bay as well as adjacent properties for decades. With these long-term implications, managers at the local level should have a more proactive role in how shorelines are managed. While Westmoreland County presently does not have a cohesive regional approach to shoreline management, its Comprehensive Plan (2010) recognizes the valuable natural resources of the Chesapeake Bay and its shorelines. In addition, the Plan recognizes that development on steeply sloped shorelines presents additional problems. The shores of Westmoreland County range from exposed open river to very sheltered creeks, and the nature of shoreline change varies accordingly (Figure 1-1). It has dramatic high cliffs to low, marshy shorelines. A shoreline management plan is useful for evaluating and planning shoreline management strategies appropriate for the creeks and rivers of Westmoreland County. It ties the physical and hydrodynamic elements of tidal shorelines to the various shoreline protection strategies. Much of Westmoreland County s shoreline is suitable for a Living Shoreline approach to shoreline management. The Commonwealth of Virginia has adopted policy stating that Living Shorelines are the preferred alternative for erosion control along tidal waters in Virginia ( exe?111+ful+chap0885+pdf). The policy defines a Living Shoreline as a shoreline management practice that provides erosion control and water quality benefits; protects, restores or enhances natural shoreline habitat; and maintains coastal Figure 1-1. Location of Westmoreland County within the Chesapeake Bay estuarine system. The location of National Oceanic and Atmospheric Administration tide gauges also are shown. Shoreline Management Plan 1


10 processes through the strategic placement of plants, stone, sand fill, and other structural and organic materials. The key to effective implementation of this policy at the local level is understanding what constitutes a Living Shoreline practice and where those practices are appropriate. This management plan and its use in zoning, planning, and permitting will provide the guidance necessary for landowners and local planners to understand the alternatives for erosion control and to make informed shoreline management decisions. The recommended shoreline strategies can provide effective shore protection but also have the added distinction of creating, preserving, and enhancing wetland, beach, and dune habitat. These habitats are essential to addressing the protection and restoration of water quality and natural resources within the Chesapeake Bay watershed. The final Westmoreland County Shoreline Management Plan (WMCSMP) is an educational and management reference for the County and its landholders. 2 Coastal Setting 2.1 Geology/Geomorphology Westmoreland County lies in the coastal plain of Virginia. Like many coastal localities, the county boundaries are defined by creeks, rivers and watershed. This is true of Westmoreland County where the Potomac River shoreline extends from Rosier Creek, downriver to the Yeocomico River (Figure 2-1). Along this stretch, the nature of the shoreline changes in orientation and bank height as a result of the underlying geology as well as the geomorphic evolution of the coast. One reach of shoreline on the Potomac River between Popes Creek and Curriomon Bay has eroding high bluffs. These cliffs occupy the central portion of the Potomac River coast in Westmoreland County and are designated the Central Reach. Figure 2-2 shows geology of the Central Reach. Horsehead Cliffs, Stratford Cliffs, and Nomini Cliffs reach heights of 150 feet above the river and are the oldest exposed strata in the county. They represent stratigraphy of the Chesapeake Group which are sedimentary deposits from the upper Pliocene to lower Miocene dating from 3.5 to 15 million years before present (Mixon et al., 1989). A typical stratigraphic section of Central Reach at Westmoreland State Park and Stratford Hall Plantation (Figure 2-3) is shown in relation to similar outcrops on the Rap- 2 Figure 2-1. Location of the shoreline features of Westmoreland County. Figure 2-2. Geology of the Central Reach (Mixon et al., 1989) overlain on a USGS topographic map. The complete description of the geologic formations is shown in Appendix 4. Westmoreland County
 described these near vertical, wave-cut bluffs as displaying spectacular exposures of Miocene, Pliocene and Pleistocene strata unequaled in the eastern United States (Figure 2-4).")

 consists of a high scarp created in the distant past when ancient estuaries occupied the region.")
11 Figure 2-3. Stratigraphic section of Nomini Cliffs in Westmoreland County (from Stephenson and MacNeil, 1954). pahannock River and southeast Maryland. Rohr et al. (2002) described these near vertical, wave-cut bluffs as displaying spectacular exposures of Miocene, Pliocene and Pleistocene strata unequaled in the eastern United States (Figure 2-4). They are composed of marine and deltaic sands, silts and clays and exhibit a stratigraphic sequence of beds that vary in color, thickness and resistance. A variety of marine fossils including whales, crocodiles, turtles and numerous mollusks have been excavated from the cliff faces. Erosion of the bluffs occurs at rate of about 1 to 2 feet per year. According to Miller (1983), erosion of the bluffs provides 8.3 cubic meters/meter/year of sediment to the littoral system, the greatest by far along the Virginia side of the Potomac River. The riverward boundary of the Chesapeake Group strata (Tc) consists of a high scarp created in the distant past when ancient estuaries occupied the region. This scarp undulates along Westmoreland County providing terrace regions where the younger Pleistocene sediments were deposited. This geology is exposed along Westmoreland s shoreline. No tidal creeks enter the Potomac River along the high bluff coast of Central Reach. The geology shows truncated ancient upland drainages (Figure 2-5). Bank heights along the shorelines, both on the Potomac and up the tidal creeks, rise quickly at the stratigraphic transition from 10 to 20 feet to over 80 feet creating obvious implications for shoreline management. Figure 2-4. Nomini Cliffs along the Potomac River and their exposed strata. Figure 2-5. The cliffs along Westmoreland County have ancient upland drainages through which overland flow and groundwater enter the River. Shoreline Management Plan 3

 which, in turn, transitions to the younger Lynnhaven (Qtl) strata.")
12 The Upriver Reach is similar to the Downriver Reach in geology and bank height. From an historical and geomorphic perspective, Central Reach occurred as a riverine/estuarine headland or point bar feature with older strata exposed while the adjacent reaches are depositional features of more recent times. Central Reach transitions to the lower banks of late Pleistocene strata including the Sedgefield formation (Qts) which, in turn, transitions to the younger Lynnhaven (Qtl) strata. These transitions occur where the older Chesapeake Group (Tc) bounding scarps intersect the coast. This occurs at Westmoreland State Park on the upriver side and adjacent to Curriomon Bay within the Stratford Harbor development. The Upriver Reach (Figure 2-1) extends from Popes Creek northward to Rosier Creek and includes the shores of Popes Creek, Mattox Creek, Monroe Bay and Rosier Creek along with numerous tidal creek branches that are part of these small watersheds. These tidal creeks enter the Potomac River through openings (inlets) that vary in size (width and depth) depending on tidal prism and sediment processes operating along the coast. Eroding sediments from adjacent banks (sediment source) are transported along shore and deposited in the creek mouths often resulting in tidal ebb and flood shoals. The rate of erosion, transport and deposition controls the tidal channel which acts as a sediment sink. The mouth of Popes Creek has an extensive flood shoal system that has provided area for tidal marsh development but has restricted navigation there at the same time. The shoreline from Popes Creek northward to the mouth of Mattox Creek is mostly exposed and eroding strata of the Sedgefield Member of the Tabb Formation of upper Pleistocene age (Figure 2-6) that average feet in height (Figure 2-7). These banks consist of basal highly indurated gray sandy silts and clay overlain by a sandier layer with abundant pebbles. This includes the eroding banks of George Washington Birthplace National Monument (GEWA). The Potomac River shoreline from Mattox Creek to Rosier Creek is much lower and has been developed with extensive shoreline modifications. These include shoreline bulkheads, revet- Figure 2-6. Geology of the Upriver Reach (Mixon et al., 1989) overlain on a USGS topographic map. The complete description of the geologic formations is shown in Appendix 4. Figure 2-7. Exposed Pleistocene strata along the George Washington Birthplace National Monument. 4 Westmoreland County
, beginning at Currioman Bay at Haulover Inlet extends along the Potomac River shoreline to the Yeocomico River.")


13 ments and the breakwater systems along the Town of Colonial Beach (Figure 2-8). The Downriver Reach (Figure 2-1), beginning at Currioman Bay at Haulover Inlet extends along the Potomac River shoreline to the Yeocomico River. This includes the tidal shoreline of Nomini Bay and Nomini Creek, Lower Machodoc Creek, Garner Creek, Jackson Creek, Bonum Creek and Figure 2-8. Modified shoreline of the Upriver Reach. Top: Bulkheads and revetments protect houses built close to the shoreline. Bottom: A breakwater system with beach and vegetation at the southern end of the Town of Colonial Beach. numerous smaller contiguous creeks (Figure 2-9). The Potomac River shore banks are 15 to 20 feet in height and consist of exposures of the Lynnhaven and Poquoson Members of the Tabb Formation. Nomini Bay and Lower Machodoc Creek are separated by Machodoc Neck. Each of these tidal systems has a broad mouth and an embayment that narrows southward to a narrow creek that is defined by restrictive spit features. These depositional features are sediment sinks, derived from erosion of the updrift banks (Figure 2-10) Of note is the Hollis Marsh spit which at one time extended across and down the coast to create Curriomon Bay (Figure 2-11). With time, this feature has detached from the mainland and steadily decreased in size to its present configuration. Other notable geomorphic features include the spit along the east side of Figure 2-9. Geology of the Downriver Reach (Mixon et al., 1989) overlain on a USGS topographic map. The complete description of the geologic formations is shown in Appendix 4. Figure Location of spits in Lower Machodoc Creek. Shoreline Management Plan 5
.")


14 Nomini Bay which terminates with a stone jetty and protects Buckner Creek from wave action. Without the spit feature, Buckner Creek would not exist in its present form. Westmoreland County also has shoreline on the Rappahannock River. Brockenbrough Creek at the downriver boundary separates Westmoreland County from Richmond County (Figure 2-12). This coincides with an ancient fluvial scarp where shoreline bank heights of 150 feet occur downriver of Brockenbrough Creek, known as Fones Cliffs. Just upriver, the land elevation drops dramatically across the ancient scarp to only about 5 feet. Fones Cliffs, in Richmond County are the same geologically as the Nomini Cliff sequence that is exposed on the Potomac River. The low, intermittently exposed shoreline banks just upriver in Westmoreland County are part of the upper Pleistocene strata, the Figure The deterioration of Hollis Marsh between 1937 and Lynnhaven member of the Tabb Formation, as previously described. These low upland banks (5 to 10 ft) (Figure 2-13) continue upriver to just north of Blind Point with the only interruption being headland/point bar marshes considered to be Holocene in age, the largest being Drakes Marsh. From Blind Point, the upland banks rise to 20 to 30 feet and are part of the Sedgefield Member of the Tabb Formation which consists of ancient gravel deposits that are actively mined today. The Sedgefield banks rise sharply up a scarp just downriver of Owl Hollow to over 100 feet and continue rising to 150 feet beyond Bristol Mine Run, the upriver boundary of Westmoreland County (Figure 2-14). These high bluff shorelines are exposed sections of the Chesapeake Group, the same strata exposed along the Central Reach on the Potomac River, as previously described. Figure Geology of Westmoreland County s Rappahannock River shore zone (Mixon et al., 1989) overlain on a USGS topographic map. The complete description of the geologic formations is shown in Appendix 4. 6 Figure The low, Pleistocene upland banks along the Rappahannock River. Westmoreland County

15 During the Miocene, a prolonged low stand in sea level created the modern day drainages of the Chesapeake Bay. The Potomac represents a large watershed with many sub-drainages. The Rappahannock River was a smaller drainage at that time. The sea has come and gone across the Virginia coastal plain numerous times over the past 30 million years. This is evidenced by the shallow water fauna found in the exposed strata of the Miocene Chesapeake Group. Sediments representing fluvial, estuarine and shallow sea environments are deposited during low stands and reworked by erosion during transgressive periods to be deposited Figure Cliffs along Westmoreland County s Rappahannock again as the seas recede. The shorelines are River shoreline. the upper boundary of each sedimentary phase. Therefore, the sedimentary nature of eroding shorelines is a function of the underlying geology. 2.2 Coastal Hydrodynamics Wave Climate Shoreline change (erosion and accretion) is a function of upland geology, shore orientation and the impinging wave climate (Hardaway and Byrne, 1999). Wave climate refers to averaged wave conditions as they change throughout the year. It is a function of seasonal winds as well as extreme storms. Seasonal wind patterns vary. From late fall to spring, the dominant winds are from the north and northwest. During the late spring through the fall, the dominant wind shifts to the southwest. Northeast storms occur from late fall to early spring (Hardaway and Byrne, 1999). The wave climate of a particular site depends not only on the wind but also the fetch, shore orientation, shore type, and nearshore bathymetry. Fetch can be used as a simple measure of relative wave energy acting on shorelines. Hardaway and Byrne (1999) suggested three general categories based on average fetch exposure: Low-energy shorelines have average fetch exposures of less than 1 nautical mile and are mostly found along the tidal creeks and small rivers. Medium-energy shorelines have average fetch exposure of 1 to 5 nautical miles and typically occur along the main tributary estuaries; High-energy shorelines have average fetch exposures of over 5 nautical miles and occur along the main stem of the bay and mouth of tributary estuaries; All of the Potomac River shoreline in Westmoreland County that faces north and northeast is considered high-energy shoreline with fetches greater than 5 miles (Figure 2-15). Colonial Beach and the downriver shorelines of the Upriver Reach that face due east are exposed to a longer southeasterly component. The Central Reach faces about north-northeast along its northern section but turns to face north along the downriver portion of the reach. This turn exposes the waves to a northwestern wave condition in addition to the north and northeast. During northeast storm events, the winds typically shift from northeast, to Shoreline Management Plan 7


16 north, and then to northwest during the course of the storm. These north-facing shorelines receive wind and wave impacts during the full course of the storm. The Potomac River shoreline of the Downriver reach is more complicated geomorphically. The shorelines in Currioman Bay are medium energy while exposed shorelines on Nomini Bay are high energy. The shoreline at the mouth of Lower Machodoc Creek is a medium energy shoreline. Downriver of Ragged Point, the remaining coast is high energy and is generally exposed to wind waves from the northeast, east, and southeast. There is a long fetch to the southeast down the Potomac River and across the Bay. The wind driven wave impacts decrease dramatically as one proceeds into and up the numerous tidal creeks. Fetch exposures of less than 1 mile are the norm and wave heights of about 1 foot can be expected during significant storm events. Along the Rappahannock River shoreline, the processes are dominated by the ebb and flood of tide rather than the wind/wave climate. During floods, eroded material is carried downriver. Basco and Shin (1993) described the wave climate along the Westmoreland County coast for use in planning and designing structures. Their analysis utilized moderate winds of 35 miles per hour to generate waves with characteristics that could be expected to impact the coast about once every two years. The storm surge for this event is about 2.5 feet above MHW or about 4.0 feet above MLW. Wave heights and wave periods in the Potomac River (Figure 2-16) along the Upriver and Central Reaches are about 4.5 ft with a 4.0 second period before nearshore shoaling. Along the Downriver Reach, the wave heights and periods increase from 4.5 feet/4 second to 6.0 feet/5.0 second as the average fetch increases toward the wide mouth of the Potomac River. Figure Average fetch exposures along Westmoreland County s main shorelines. Figure Wave heights along Potomac River summarized from Basco and Shin (1993), Milligan et al. (2002), Hardaway et al. (2009), and Hardaway and Milligan (2009). 8 Westmoreland County
; the George Washington Birthplace National Monument (Hardaway et al., 2009); Westmoreland State Park (Hardaway and Milligan, 2009) (Figure 2-16).")

17 Site specific wave climate has been determined at several locations along the Westmoreland County shoreline: Town of Colonial Beach (Milligan et al., 2002); the George Washington Birthplace National Monument (Hardaway et al., 2009); Westmoreland State Park (Hardaway and Milligan, 2009) (Figure 2-16). The wave climate was determined by computer modeling along the shoreline, and the results were averaged for this report. Various fetch directions were modeled, but the results were similar for each direction. The longest fetch did have slightly larger waves with longer periods. While Basco and Shin (1993) shows predicted wave parameters in the river, the results of the sitespecific modeling are wave heights and periods close to the shoreline. The analyses were performed primarily to assess the storm wave power impacting the exposed bluff shoreline under varying storm conditions as well as for determination of armor stone size on proposed coastal structures. Although smaller events will erode the base of the bluff and transport beach sands, it is generally the large storm events such hurricanes and northeasters that generate the larger wave powers against the shore. Storm surge frequencies described by FEMA (2009) are shown in Table 2-1. These show the 10%, 2% 1% and 0.2% chances of water levels attaining these elevations for any given year along the Potomac River and Rappahannock River coasts. These percentages correspond to 10 year, 50 year, 100 year, and 500 year events. The mean tide range at Colonial Beach is 1.64 feet and at Lewisetta it is 1.24 feet. For a given storm, maximum wind speeds and direction also are important when developing shoreline management strategies, particularly in regard to determining the level of shore protection needed at the site. In Westmoreland County, the 100 year and 500 year storm events described by FEMA and found in the Westmoreland County Comprehensive Plan (2010) show the coastal regions that would Table year, 50 year, 100 year, and 500 year storm events. Source: Westmoreland impacted (Figure County Flood Report, FEMA (2009). 2-17). Most of the areas impacted are found along the tidal creek shorelines. Since the areas on the open Potomac River have higher banks, they do not flood. They are, however, exposed to higher wave energies during storms Sea-Level Rise On monthly or annual time scales, waves dominate shore processes and, during storm events, leave the most obvious mark. However, on time scales approaching decades or more, sea level rise is the underlying and persistent force responsible for shoreline change. Recent trends based on wave gauge data at Colonial Beach and Lewisetta show the annual rate to be 1.57 Figure Map of the FEMA floodplains for the 100 year and 500 year events (Westmoreland County, 2010). Shoreline Management Plan 9
. This will result in water levels 2.2 feet higher by 2050.")
18 feet/100 years (4.78 mm/yr) and 1.63 feet/100 years (4.97 mm/yr). Boon (2012) predicted future sea-level rise by 2050 using tide gauge data from the East Coast of the U.S. Solomons Island, the nearest tide gauge to Westmoreland County analyzed, has a projected sea-level rise rate of 0.66 m (+/- 0.18m). This will result in water levels 2.2 feet higher by The historic rate at Solomons Island is about 1.12 feet/100 years (3.41mm/yr). This potential increase in sea-level rise rates warrant ongoing monitoring and consideration in shoreline management planning Shore Erosion Shoreline erosion results from the combined impacts of waves, sea level rise, tidal currents and, in some cases, shoreline hardening. Table 2-2 shows the average shoreline rates of change for various areas throughout the County. As expected the highest erosion rates occur along the open and exposed Potomac River shorelines with little or no erosion up the protected tidal creeks. The unconsolidated sediment at Hollis Marsh is eroding the fastest. Over the last years, shoreline hardening has been the most common management solution to shoreline erosion. After years of study and review, we now understand the short and long term consequences to those choices, and there is growing concern that the natural character of the shoreline cannot be preserved in perpetuity if shoreline management does not change. Table 2-2. Average long-term shoreline rates of change ( ). From Milligan et al., Westmoreland County

19 3 Shoreline Best Management Practices 3.1 Implications of Traditional Erosion Control Treatments Following decades of shoreline management within the constraints of Virginia s evolving regulatory program, we have been afforded the opportunity to observe, assess, monitor and ultimately revise our understanding of how the natural system responds to perturbations associated with traditional erosion control practices. Traditional practices include construction of bulkheads, concrete seawalls, stone revetments, and the use of miscellaneous materials purposefully placed to simulate the function that revetments or bulkheads perform. These structures have been effective at stabilizing eroding shoreline; however, in some places, the cost to the environment has been significant and results in permanent loss of ecosystem function and services. For example, bulkheads constructed close to the water correlate with sediment loss and high temperatures in the intertidal zone, resulting in impacts to organisms using those areas (Spalding and Jackson, 2001; Rice et al. 2004; Rice, 2006). The reduction of natural habitat may result in habitat loss if the bulkhead cannot provide substitute habitat services. The deepening of the shallow water nearshore produced by reflective wave action could reduce habitat available for submerged grass growth. Less is known about the long-term impacts of riprap revetments. Believed to be a more ecological treatment option than bulkheads, when compared with natural systems, riprap tends to support lower diversity and abundance of organisms (Bischoff, 2002; Burke, 2006; Carroll, 2003; Seitz et al., 2006). The removal of riparian vegetation as well as the intertidal footprint of riprap has led to concern over habitat loss to the coastal ecosystem (Angradi et al., 2004). 3.2 Shoreline Best Management Practices The Living Shoreline Alternative As Virginia begins a new era in shoreline management policy, Living Shorelines move to the forefront as the preferred option for erosion control. In the recent guidance developed by the Center for Coastal Resources Management at the Virginia Institute of Marine Science (CCRM,2013), Shoreline Best Management Practices (Shoreline BMPs) direct managers, planners, and property owners to select an erosion control option that minimizes impacts to ecological services while providing adequate protection to reduce erosion on a particular site. Shoreline BMPs can occur on the upland, the bank, or along the shoreline depending on the type of problem and the specific setting. Table 3-1 defines the suite of recommended Shoreline BMPs. What defines a Living Shoreline in a practical sense is quite varied. With one exception, all of the BMPs constitute a Living Shoreline alternative. The revetment is the obvious exception. Not all erosion problems can be solved with a Living Shoreline design, and in some cases, a revetment is more practical. Most likely, a combination of these practices will be required at a given site. Table 3-1. Shoreline Best Management Practices. Shoreline Management Plan 11
, shoreline length, proximity of upland infrastructure (houses, roads, etc.")

20 3.3 Non-Structural Design Considerations Elements to consider in planning shoreline protection include: underlying geology, historic erosion rate, wave climate, level of expected protection (which is based on storm surge and fetch), shoreline length, proximity of upland infrastructure (houses, roads, etc.), and the onsite geomorphology which gives an individual piece of property its observable character (e.g. bank height, bank slope). These parameters along with estimated cost help determine the management solution that will provide the best shore protection. In low energy environments, Shoreline BMPs rarely require the use of hard structures. Frequently the intent of the action is to stabilize the slope, reduce the grade and minimize under cutting of the bank. In cases where an existing forest buffer is present a number of forest management practices can stabilize the bank and prevent further erosion (Figure 3-1). Enhancing the existing forest condition and erosion stabilization services by selectively removing dead, dying and severely leaning trees, pruning branches with weight bearing load over the water, planting and/or allowing for re-generation of mid-story and ground cover vegetation are all considered Living Shoreline treatment options. Enhancement of both riparian and existing marsh buffers together can be an effective practice to stabilize the coastal slope (Figure 3-2) from the intertidal area to the upland by allowing plants to occupy suitable elevations in dynamic fashion to respond to seasonal fluctuations, shifts in precipitation or gradual storm recovery. At the upland end of the slope, forest buffer restoration and the planting of ornamental grasses, native shrubs and small trees is recommended. Enhancement of the marsh could include marsh plantings, the use of sand fill necessary to plant marsh vegetation, and/or the need for fiber logs to stabilize the bank toe and newly established marsh vegetation. In cases where the bank is unstable, medium or high in elevation, and very steep, bank grading may be necessary to reduce the steepness of bank slopes for wave run-up and to improve growing conditions for vegetation stabilization (Figure 3-3). The ability to grade a bank may be limited by upland structures, existing defense structures, adjacent property conditions, and/or dense vegetation providing desirable ecosystem services. Bank grading is quite site specific, dependent on many factors but usually takes place at a point above the level of protection provided by the shore protection method. This basal Figure 3-1. One example of forest management in Westmoreland County. The edge of the bank is kept free of tree and shrub growth to reduce bank loss from tree fall. Figure 3-2. Maintaining and enhancing the riparian and marsh buffers can maintain a stable coastal slope. 12 Westmoreland County


21 Figure 3-3. Bank grading in Westmoreland County reduces steepness and improves growing conditions for vegetation stabilization. Figure 3-4. This low-energy site had minor bank grading and Spartina alterniflora planted. This photo shows the site after 24 years. point may vary vertically and horizontally, but once determined, the bank grade should proceed at a minimum of 2:1 (2Horizontal:1Vertical). Steeper grades are possible but usually require geotechnical assistance of an expert. Newly graded slopes should be re-vegetated with different types of vegetation including trees, shrubs and grasses. In higher energy settings, toe stabilization using stone at the base of the bank also may be required. Along the shoreline, protection becomes focused on stabilizing the toe of the bank and preventing future loss of existing beach sand or tidal marshes. Simple practices such as: avoiding the use of herbicides, discouraging mowing in the vicinity of the marsh, and removing tidal debris from the marsh surface can help maintain the marsh. Enhancing the existing marsh by adding vegetation may be enough (Figure 3-4). In medium energy settings, additional shore protection can be achieved by increasing the marsh width which offers additional wave attenuation. This shoreline BMP usually requires sand fill to create suitable elevations for plant growth. Marshes are generally constructed on slopes between 8:1 and 14:1, but average about 10:1 (for every 10 ft in width, the elevation changes by 1 foot) (Hardaway et al., 2010a). Steeper systems have less encroachment into the nearshore but may not successfully stabilize the bank because the marsh may not attenuate the waves enough before they impact the bank. Shallower, wider systems have more encroachment but also have the advantage of creating more marsh and attenuating wave energy more effectively. Determining the system s level of protection, i.e. height and width, is the encroachment. If the existing riparian buffer or marsh does not need enhancement or cannot be improved, consider beach nourishment if additional sand placed on the beach will increase the level of protection. Beach nourishment is the placement of good quality sand along a beach shoreline to increase the beach width and raise the elevation of the nearshore area. New sand should be similar in grain size or coarser than the native beach sand. Enhancing and maintaining existing beaches preserves the protection that beaches offer to the upland as sands move naturally under wave forces and wind energy. This encourages beach and dune formation which can further be enhanced and stabilized with beach and dune plants. Where bank and/or shoreline actions are extremely difficult or limited in effectiveness Land Use Management may be required to reduce risk. Practices and strategies may include: relocate or elevate buildings, driveway relocation, abandon or relocate sanitary drainfields, or hook-up to public sewer. All new construction should be located 100 feet or more from the top of the bank. Re-directing stormwater runoff away from the top of the bank, or re-shaping the top of the bank may also assist in stabilizing the bank. Shoreline Management Plan 13

22 Creating a more gradual slope can involve encroaching into landward habitats (banks, riparian, upland) through grading and into nearshore habitats by converting existing sandy bottom to marsh or rock. These and other similar actions may require zoning variance requests for setbacks, and/or relief from other land use restrictions that increase erosion risk. Balancing the encroachment is necessary for overall shoreline management. 3.4 Structural Design Considerations In medium to high energy settings, suitable structural Living Shoreline management strategies may be required. For Westmoreland County these are marsh sills constructed of stone and offshore breakwaters. As fetch exposure increases beyond about 1,000 ft and the intertidal marsh width is not sufficient to attenuate wave action, the addition of sand can increase the intertidal substrate as well as the backshore region. However, as wave exposure increases, the inclusion of some sand retaining structure may be required to prevent sand from being transported away from the site. This is where a low marsh sill is appropriate. The stone sill has been used extensively in the Chesapeake Bay over the years (Figure 3-5). It is a rock structure placed parallel to the shore so that a marsh can be planted behind it. The crosssection in Figure 3-5 shows the sand for the wetlands substrate on a slope approximating 10:1 from the base of the bank to the back of the sill. The elevation of the intersection of the fill at the bank and tide range will determine, in part, the dimensions of the sill system. If the nearshore depth at the location of a sill is greater than 2 feet, it might be too Figure 3-5. Sand fill with stone sills and marsh plantings at Poplar Grove, expensive for a sill relative to Mathews County, Virginia after six years and the cross-section used for a revetment at that location. construction (From Hardaway et al., 2010b). Nevertheless, the preferred approach would still be the marsh sill. Hardaway and Byrne (1999) indicate that in low wave energy environments, a sill should be placed at or near MLW with sand fill extending from about mean tide level on a 10:1 to the base of an eroding bank. The height of the rock sill should be at least equal to mean high water to provide adequate backshore protection. Armor stone should be VA Class I. A recent installation of a sill in a low energy environment in Westmoreland County was on Glebe Creek at Hull Springs Farm (Figure 3-6). The Hull Springs Farm sill was built in 2008 along about 300 feet of shoreline. The sand fill begins at +3 feet on the bank and old bulkhead and extends on a 10:1 slope to about mid-tide (+0.8 ft mean low water) at the back of the sill. This provides planting widths of about 10 feet for Spartina alterniflora and 12 feet for Spartina patens (Hardaway et al., 2010b). The sill system was built in August 2008 and went through the Veteran s Day Northeaster (2009) with no impacts to the unprotected base of bank. Marsh fringes were heavily covered with snow and ice during the winter of 2009 but reemerged intact. 14 Westmoreland County

 to Class III (up to 5 miles).")
23 For medium energy shorelines, sills should be placed far enough offshore to provide a 40 foot wide (low bank) to 70 foot wide (high bank) marsh fringe (Hardaway and Byrne, 1999). This distance includes the sill structure and is the width needed to attenuate wave action during seasonal storms. During extreme events when water levels exceed 3 feet above mean high water, some wave action (>2 feet) may penetrate the system. For this reason, a sill height of a least 1 foot above mean high water should be installed. Armor stone may be Class II (< 2 miles) to Class III (up to 5 miles). Sills on high energy sites need to be very robust. Impinging wave heights can exceed 3 feet. Maintaining a vegetative fringe can be difficult. Therefore sill heights should be at least 2 feet above mean high water (MHW). The minimum size for armor stone should be Class III. A sill used along a high energy Figure 3-6. Longwood University s Hull Springs Farm four years after construction and the cross-section used for construction (from Hardaway et al., 2010a). coast occurs at Westmoreland State Park (Figure 3-7). Placed along a very high eroding bluff this system will act to capture bank slump and may eventually lead to some bluff stability. Figure 3-7. High sills built along Westmoreland State Park s high energy, high bank shoreline. The material that slumps from the bank will be caught behind the sills and stabilize the base of the bank by protecting it from wave attack. A more recent photo shows that the slump material is starting to become vegetated. Shoreline Management Plan 15

24 Any addition of sand or rock seaward of mean high water (MHW) requires a permit. A permit may be required landward of MHW if the shore is vegetated. As the energy environment increases, shoreline management strategies must adapt to counter existing erosion problems. While this discussion presents structural designs that typically increase in size as the energy environment increases, designs remain consistent with the Living Shoreline approach wherever possible. In all cases, the option to do nothing and let the landscape respond naturally remains a choice. In practice, under this scenario, the risk to private property frequently outweighs the benefit for the property owner. Along medium energy and high energy shorelines, a breakwater system can be a cost-effective alternative for shoreline protection. Breakwaters are a series of large rock structures placed strategically offshore to maintain stable pocket beaches between the structures. The wide beaches provide most of the protection, so beach nourishment should be included as part of the strategy and periodic beach re-nourishment may be needed. Although single breakwaters can be used, two or more are recommended to address several hundred feet of coast. For breakwaters, the level of protection changes with the system dimensions such that larger dimensions generally correspond to bigger fetches and where a beach and dune shoreline is desired. Hardaway and Gunn (2010) and Hardaway and Gunn (2011) provide detailed research on the use of breakwaters in Chesapeake Bay. Hardaway and Byrne (1999) suggest that breakwater systems in medium energy environments should utilize at least 200 feet of shoreline, preferably more, because individual breakwater units should have crest lengths of 60 to 150 feet with crest heights 2 to 3 feet above mean high water. Minimum midbay beach width should be feet above mean high water. On high energy coasts, the mid-bay beach widths should be 45 to 65 feet especially along high bank shorelines (Figure 3-8). Crest lengths should be 90 to 200 feet. Armor stone of Class III (500 lbs.) is a minimum, but up to Type I (1500 to 4000 lbs.) may be required especially where a deep near shore exists. Several breakwater examples occur along the Potomac River in Westmoreland County. The two breakwater systems at Colonial Beach are among the oldest in the Bay. The Central Beach breakwaters (Figure 3-8) were installed in For over 30 years, this system has provided a wide recreation beach as well as shore protection with only several minor renourishment projects necessary to maintain its planform. Other headland breakwater systems in Westmoreland occur at the mouth of Monroe Bay, at Westmoreland State Park, and at the mouth of the Yeocomico River. These three systems exist in very different shore situations. The breakwaters at Monroe Creek (Figure 2-8) were constructed along a wide spit to protect the eroding shoreline in front of a marina. These low structures create a heavily vegetated shoreline for protection. A recently-constructed series of breakwaters along a low bank coast at Westmoreland State Park (Figure 3-9) protect infrastructure at the park and creates a recreational beach for park users. The breakwater system at the mouth of the Yeocomico occurs along a low spit that provides protec- Figure 3-8. The breakwaters at Colonial Beach provide a wide recreational beach as well as storm erosion protection for the residential upland. These structures were installed in Westmoreland County


25 tion to the shore in its lee (Figure 3-10). This site is an example of a composite shore protection plan which incorporates several different types of shore protection structures that serve to provide excellent erosion control for the varying sections of the property. In most cases, breakwater construction includes the addition of sand between the stone breakwater and the shore. In lower energy settings, sand may be vegetated. The backshore region should be planted in appropriate dune vegetation. In higher energy settings, the nourished sand will be re-distributed, naturally under wave conditions. In some areas, additional nourishment may be required periodically in response to storms, or on some regular schedule. Figure 3-9. Headland attached breakwaters at Westmoreland State Park. These structures were built relatively closely-space to provide a recreational beach as well as to protect the infrastructure including the pool and bathhouses. Figure Headland attached breakwaters along the Potomac River at the Yeocomico River. The breakwaters hold a spit that protects the shoreline in its lee. A sill protects the back side of the spit. To protect breakthrough flooding, an upland revetment was built on the narrowest section of the spit. Shoreline Management Plan 17
26 4 Methods 4.1 Shore Status Assessment The shore status assessment was made from a small, shallow draft vessel, navigating at slow speeds parallel to the shoreline during five field days between July and September Existing conditions and suggested strategies were noted on maps which were transcribed in the office to display in GIS. Once the data were compiled and evaluated, the preferred strategies were subjected to further analysis utilizing other collected data, including the condition of the bank face and toe, marsh width, landscape type, and GPS-referenced photos. The results of this analysis were compared to the results of the model described below. 4.2 Geospatial Shoreline Management Model The Shoreline Management Model (SMM) is a geo-spatial tool that was developed to assess Shoreline Best Management Practices (Shoreline BMPs) comprehensively along tidal shoreline in Virginia. It is now necessary to provide recommended shoreline strategies that comply with an ecosystem based approach. The SMM has the capacity to assess large geographic regions quickly using available GIS data The model is constructed using multiple decision-tree pathways that lead the user to a final recommended strategy or strategies in some cases. There are four major pathways levels. The pathways are determined based on responses to questions that determine onsite conditions. Along the upland and the bank, the model queries a site for bank stability, bank height, presence of existing infrastructure, land use, and whether the bank is defended to arrive at an upland management strategy. At the shore the model queries a site for presence and condition of beaches, marshes, the fetch, nearshore water depth, presence of specific types of erosion control structures, and creek setting to drive the shore recommendations. Appendix 1 illustrates the logic model structure. The responses are generated by searching site specific conditional geospatial data compiled from several sources representing the most current digital data available in shapefile and geodatabase formats (Table 4-1). As indicated in Table 4-1, the majority of these data are collected and maintained for the Westmoreland County Shoreline Inventory ( westmoreland/westmorelandva_disclaimer.html) developed by CCRM (Berman et al., 2007). The model is programmed in ESRI s (Environmental Systems Research Institute) ArcGIS version and version 10 software. The shoreline inventory dataset contains several attributes required for the SMM that pertain to riparian land use, bank height, bank erosion, presence of beach, existing shoreline protection structures and marshes. Other data sources provide information on nearshore depth, exposure to wave energy, marsh condition, location of beaches, and proximity of roads and permanent structures to the shoreline. The model is built using ArcGIS Model Builder and has 13 major processing steps. Through the stepwise process specific conditions, buffers, and offsets may be delineated to accurately assess the impact that a specific condition may have on the model output. For example, a permanent structure built close to the shoreline could prevent a recommendation of bank grading as a best management practice. To determine if bank grading is appropriate a rough estimate formula that incorporates a 3:1 slope with some padding for variability within a horizontal distance of shoreline and bank top was developed. The shoreline was buffered based on the formula: ((3*mh) + 20) * where: 18 Westmoreland County
 20 = is the padding for variability in the horizontal distance between the shoreline and")
27 Table 4-1. Shoreline Management Model (SMM) Data Sources and Applications. mh is the maximum height within the inventory height field (0-5 = 5ft; 5-10 = 10ft; = 30ft; >30 = 40ft) 20 = is the padding for variability in the horizontal distance between the shoreline and the top of the bank in feet is the conversion from feet to meters. Shoreline was coded for presence of permanent structures such as roads, houses, out buildings, swimming pools, etc. where observed in recent high resolution imagery to be within the computed buffer. In the case of determining fetch or exposure to wave energy, the shoreline was divided into 50m segments, and represented by a single point on the line. Fetch distance was measured from the point to Shoreline Management Plan 19
 or width (beaches and marshes) in many cases.")
28 the nearest shoreline in 16 directions following the compass rose. The maximum distance over water was selected for each point to populate the model s fetch variable. Field data from the Shoreline Inventory provided criteria to classify attributes assessed based on height (banks) or width (beaches and marshes) in many cases. Some observations were collected from other datasets and/or measured from high resolution aerial imagery. For example, the Non-Jurisdictional Beach Assessment dataset provided additional beach location data not available in the inventory. To classify beaches for the model as wide or narrow, a visual inspection of imagery from the Virginia Base Map Program (VBMP), Bing, and Google Maps was used to determine where all beaches were wider than 10 feet above the high tide line. Limitations to the model are primarily driven by available data to support the model s capacity to make automated decisions. If an existing structure is in place and the shoreline is stable, the model bases its decision on a stable shoreline. If an existing structure is in place and the shoreline is unstable, the model will return a recommendation based on the most ecological approach and will not consider the presence of the existing structure. In places where sufficient data are not available to support an automated decision, the shoreline is designated as an Area of Special Concern. This includes shorelines that are characterized by man-made canals, marinas, or commercial or industrial land uses with bulkheads or wharfs. Marsh islands or areas designated as paved public boat ramps receive a No Action Needed recommendation. The model output defines 14 unique treatment options (Table 4-2), but makes 16 different recommendations which combine options to reflect existing conditions on site and choices available based on those conditions. The unique treatment options can be loosely categorized as Upland BMPs or Shore BMPs based on where the modification or action is expected to occur. Upland BMPs pertain to actions which typically take place on the bank or the riparian upland Shore BMPs pertain to actions which take place on the bank and at the shoreline. Table 4-2. Shoreline Management Model - Preferred Shoreline Best Management Practices. 20 Westmoreland County


29 5 Shoreline Management for Westmoreland County 5.1 Shoreline Management Model (SMM) Results In Westmoreland County, the SMM was run on 280 miles of shoreline. The SMM provides recommendations for preferred shoreline best management practices along all shoreline. At any one location, strategies for both the upland and the shore may be recommended. It is not untypical to find two options for a given site. By and large, the majority of shoreline management in Westmoreland County can be achieved without the use of traditional erosion control structures, and with few exceptions, very little structural control. Nearly 75% of the shoreline can be managed simply by enhancing the riparian buffer or the marsh if present. Since the majority of the shoreline resides within protected waters with medium to low energy Table 5-1. Occurrence of descriptive Shoreline BMPs in Westmoreland County. conditions, Living Shoreline approaches are applicable. Along the open Potomac River shoreline the use of breakwaters with beach nourishment is commonly recommended. However, in some cases beach nourishment alone may be preferred. Table 5-1 summarizes the model output for Westmoreland County based on strategy(s) and shoreline miles. The glossary in Appendix 2 gives meaning to the various Shoreline BMPs listed in Table 5-1. To view the model output, the Center for Coastal Resources Management has developed a Comprehensive Coastal Resource Management portal (Figure 5-1) which includes a pdf file depicting the SMM output as well as an interactive map viewer that illustrates the SMM output as well as the baseline data for the model ( edu/ccrmp/westmoreland/index.html). The pdf file is found under the tab for Shoreline Best Management Practices. The Map Viewer is found in the CountyToolbox and uses a Google type interface developed to enhance the end-users visualization (Figure 5-2). From the map viewer the user can zoom, pan, measure and cus- Figure 5-1. Portal for Comprehensive Coastal Resource Management in Westmoreland County. Shoreline Management Plan 21


30 Figure 5-2. The Map Viewer displays the preferred Shoreline BMPs in the map window. The color-coded legend in the panel on the right identifies the treatment option recommended. tomize maps for printing. When Shoreline Management Model BMPs is selected from the list in the right hand panel and toggled on the delineation of shoreline BMPs is illustrated in the map viewing window. The clickable interface conveniently allows the user to click anywhere in the map window to receive specific information that pertains to conditions onsite and the recommended shoreline strategy. Figure 5-3 demonstrates a pop-up window displayed onscreen when a shoreline segment is clicked in the map window. Recommended Shoreline BMPs resulting from the SMM comply with the Commonwealth of Virginia s preferred approach for erosion control. Figure 5-3. The pop-up window contains information about the recommended Shoreline BMP at the site selected. Additional information about the condition of the shoreline is also given. 22 Westmoreland County

31 5.2 Shore Segments of Concern/Interest This section describes several areas of concern and/or interest in Westmoreland and demonstrates how the preferred alternative from the SMM could be adopted by the waterfront property owners. Areas of Concern occur where shore zones have existing, threatened upland infrastructure. Two examples used in this report are Stratford Harbour and Beach Road. Areas of Interest demonstrate how the previously discussed goals of Living Shoreline management could be applied to a particular shoreline. Selected examples of areas of interest include Betty s Neck, a future upland development shore and a spit at the mouth of Rosier Creek where a section of failing bulkhead and ongoing erosion are addressed with breakwaters and sills, respectively. The conceptual designs presented in this section utilize the typical cross-sections that are shown in Appendix 3. The guidance provided in Appendix 3 describes the environments where each type of structure may be necessary and provides an estimated cost per foot. The designs presented are conceptual only; structural site plans should be created in concert with a professional experienced in the design and construction of shore protection methods in Chesapeake Bay Stratford Harbour (Area of Concern) Stratford Harbour is a residential development that extends approximately 2 miles alongshore and is situated along Nomini Cliffs. Nomini Cliffs range from 100 to 150 feet high along the upriver section, taper to 40 feet high, and then to low banks just west of Haulover Inlet. The Stratford Harbour shore generally faces north with fetch exposures to the northwest, north, and northeast of eighteen, six, and seven miles, respectively. This is a high wave energy coast. The bluffs are vertically exposed and actively eroding similar to the Horsehead and Stratford Cliffs upriver. However, at Stratford Harbour, numerous houses are only a few yards from the top of the eroding bluff face, and therefore grading the bank to reduce the steepness is not an option (Figure 5-4). Figure 5-4. The proximity of the top of eroding bank to houses is shown at Stratford Harbour. The process of bluff erosion along Stratford Harbour first begins at the base or toe of the bank where persistent impinging wave action erodes the bluff foundation rendering it inherently unstable. Contributing factors include upland runoff, groundwater seeps and springs, and freeze/thaw weathering processes. However, without controlling the erosion at the base of the bank, no bluff stabilization method will succeed over the long term. Historic erosion occurs at about 0. 5 ft/yr only because the large volume of eroded material takes time to transport and for a time the slumps protect the base of the in situ bank until the process begins again. Attempts to stabilize the bluff face with wood bulkheads and rock have not been effective and eventually fail. Along the downriver section of Stratford Harbour, some base of bank protection occurred with the installation of SEABOX TM about 10 years ago (Figure 5-5). These patented concrete units were placed offshore as breakwaters 2,000 feet downriver of Stratford Harbour, and, with time, have accumulated Shoreline Management Plan 23

.")
32 enough sand from the eroding bluffs and littoral system to accrete a protective beach under limited storm wave attack. The bluff face, for the most part, continues to erode, but the adjacent houses are generally farther back than those upriver, and the bluff height is lower; about 40 feet. Bluff erosion is costly to address as a finished shore protection product. It might have to be phased with an initial base of bank stabilization with a high sill system similar to Westmoreland State Park (Figure 3-7). Shore erosion control from wave attack at the base of the banks can only partially slow the erosion but must be the first necessary step if structural options are to be employed. Bluff face stability is another issue where wholesale grading and stabilization is not feasible and very expensive. From a cost perspective, it might be less expensive to relocate the threatened housing. Site access also is an issue unless barges are used. Barges are feasible along the upriver section of the development but less so as the offshore water depths decrease downriver. To address bluff erosion a geotechnical analysis should be performed to understand the inherent stability or instability of the bank strata. One option for addressing the base of bluff erosion is to continue a breakwater system along the Stratford Harbour shoreline (Figure 5-6). The breakwaters function similarly to the SEABOX TM system, but since they are made of stone, they will have greater longterm integrity and allow the sediments from the eroding bluffs to fill behind them. A typical cross-section of the structures and possible embayment is shown in Appendix 3, Figure 3. A breakwater system should have a minimum crest length 150 feet with narrow gaps of no more than 100 feet. Calculating the beach indentation to gap ratio results in a line of structures about 130 feet offshore. However, nearshore water depths 150 feet offshore are about -3 feet MLW. One problem with building the system is Figure 5-5. Exposed, eroding bank just east of Nomini Cliffs. The Seaboxes have held the bank slump material and allowed it to become vegetated increasing the stability of the bank. Figure 5-6. Site-specific application of the Shoreline Management Model recommendation for Stratford Harbour. The breakwater system will stabilize the base of the bank, but the strategy does not address top of cliff erosion. 24 Westmoreland County


33 allowing a wide enough backshore in the embayment between structures to allow bluff slumping and eventual stability, which in this case needs to be about 50 feet above mean high water. It would also be prudent to address the areas where there are homes along the cliff so groups of breakwaters are proposed as shown in Figure 5-6. This is a conceptual plan provided in order to illustrate a possible option and broad range of costs. It is not for construction. Continued mid to upper bluff erosion will persist for years to come and some homes will have to be moved. Efforts to stabilize the bluff with geotechnical devices such as soil nail and gunnite ( may prove effective for some period of time Betty s Neck (Area of Interest) The distal end of Betty s Neck lies on Curriomon Bay (Figure 5-7) and can be used as an example of a proactive shoreline management plan for an as yet, undeveloped property. From aerial imagery, roads and cul-du-sacs can be seen along the upland that, prior to 2005, were once farmland but is now poised for development. This section will illustrate how a breakwater and sill system can be included in the pre-development plan to create a vegetated edge instead of a hardened shoreline. In addition to stabilizing the shoreline, this plan also may increase value by creating a beach access for landowners. The Curriomon Bay shoreline of Betty s Neck is about 6,000 feet long, excluding the spit, and extends from Curriomon Creek to Poor Jack Creek. The shoreline orientation is northeastfacing, turning slightly to north-northeast along its easternmost section. Betty s Neck shoreline has fetch exposures to the north-northwest, north, northeast, and east of 6.8, 1.0, 0.7, and 0.7 miles, respectively. The average fetch is about 2.3 miles which puts the site in the medium energy category, but the long fetch to the north-northwest likely dominates the littoral processes as evidenced by the spit feature heading downriver. The shoreline adjacent to Curriomon Creek occurs as fringing marsh that gives way to an actively eroding upland bank about 20 feet in height (Figure 5-8) for about 3,500 feet to the spit. End point Figure 5-7. Google Earth image showing the location of Bettys Neck. Figure 5-8. Eroding banks along the property ready for development along Bettys Neck. Shoreline Management Plan 25
 that decreases in height and becomes erosive beyond the protection of the spit. The last and downriver Figure 5-9.")

34 erosion rate from 1937 to 2011 is about 0.5 ft/yr (Milligan et al., 2012). A midreach spit grew from 1994 to 2009 but has gotten smaller since. In 2011, the spit was about 1,200 feet long. The shoreline in its lee is a partially stabilized upland bank (Figure 5-9) that decreases in height and becomes erosive beyond the protection of the spit. The last and downriver Figure 5-9. Photo of the spit and protected bank along Bettys Neck. most segment of the project shoreline is a low, heavily vegetated spit at the mouth of Poor Jack Creek. It also has a geomorphic history which indicates growth from eroded materials originating from the main eroding neck coast, which became sand starved as the mid-reach spit grew. Over time, this creek mouth spit has become thinner and has almost detached at the mainland/spit interface. Hollis Marsh protects Betty s Neck and adjacent shorelines in its lee from waves traveling across the Potomac River. Over time, the Hollis Marsh complex has been naturally reduced in size and thus its ability to protect mainland shorelines along Curriomon Bay has diminished. This reduction farther opened Haulover Inlet and allows greater fetch exposure from northerly wind waves and may be partly responsible for the creation of the mid-reach spit. The digitized shorelines indicate that only small amounts of change occurred along Betty s Neck between 1937 and However, by 1994 the shoreline was farther landward. The continued deterioration of Hollis Marsh is an important design consideration. As it provides less and less protection, erosion rates may increase along the shorelines in its lee. The upland banks at Betty s Neck consist of basal, silty sand overlain by a fine sandy substrate. The banks strata and upper sands are too fine for beach fill and will have to be reworked or removed in order to grade the bank. The nearshore region is relatively deep, about -3 feet mean low water (MLW) 150 feet offshore. This will impact cost for the desired breakwater system. The suggested shore protection is a breakwater system along the main upland coast that transitions both up and downriver toward the bounding creeks (Figure 5-10). The typical cross-section for the bay and tombolo from the previous design presented can be used as a starting point (Appendix 3, Figure 3) for the design process. The 25 year storm event is the minimum design parameter. A breakwater length of Figure Recommended configuration of structures at Bettys Neck. 26 Westmoreland County

35 150 feet and a gap of 150 feet is selected. From a beach fill elevation at the base of the bank of +5 feet, the bay beach will extend about 55 feet to MLW. The 150 ft gap moves the breakwaters an additional 90 feet offshore or about 145 feet from base of bank. Each end should transition to a spur then a sill. The main part of the spit should be left intact, but the sill will transition onto it for a short distance. Beyond the spit, a sill is recommended and should extend to the vegetated spit at Poor Jacks Creek. This conceptual design provides a basis for developing costs which include rock, sand, and plants installation. Adjustment to breakwater positions can be made to accommodate lot locations and bank morphology Beach Road (Area of Concern) Beach Road is located in the Town of Colonial Beach along its northern coast (Figure 5-11). The road lies between the shoreline and the adjacent residential properties and runs along the shoreline for about 0.5 miles. Currently, most of the road is protected by stone revetments alongshore. However, a section of shore, about 400 feet, is potentially threatened by active erosion. The road bed lies between 20 and 25 feet from the top of the bank scarp. The shoreline along Beach Road had been relatively stable over time, but it appears that Hurricane Isabel significantly impacted this coast One residential property occurs on the river side of Beach Road. Over time, the upland bank in front on this property and the shore banks to the south of it were hardened with stone revetments. Prior to Hurricane Isabel in 2003, the upland banks north of that property were not hardened but occurred as vertically exposed and erosive banks about 15 ft high. Presumably as a result of the Hurricane, many of those eroding banks were hardened with stone revetments, except for the aforementioned 400 feet. (Figure 5-11). The top of bank has eroded from 5 to 20 feet from 2002 to The revetment could be continued along this section; however, this site provides an excellent opportunity to install a Living Shoreline along the Potomac River. A high sill is recommended (Appendix 3, Figure 2) with the sand being placed up to the basal terrace with the bank graded above. The sill would have to extend beyond the adjacent revetments by 10 to 20 feet to insure sand fill integrity and bank protection. Figure Eroding Beach Road shoreline between two existing revetments. Shoreline Management Plan 27
 and is unprotected on the northern distal end and along the creek. However, a section of the structure has failed, and the upland bank behind has slumped down. (Figure 5-13).")

36 5.2.4 Mouth of Rosier Creek (Area of Interest) The narrow peninsula just inside the south side of the entrance to Rosier Creek is partially protected by a wood bulkhead along its river-facing coast (Figure 5-12) and is unprotected on the northern distal end and along the creek. However, a section of the structure has failed, and the upland bank behind has slumped down. (Figure 5-13). The failed section is an opportunity to create a Living Shoreline using the modelrecommended sill. In fact, since the remaining wood bulkhead appears to need some toe stone, the sill could extend in front of the bulkhead and across the unprotected shore around the point and into Rosier Creek. Figure Location of spit near the mouth of Rosier Creek and the existing bulkhead and 2009 shorelines from Milligan et al. (2012). This upland narrow peninsula is about 15 ft high and acts as a significant barrier to easterly winddriven waves entering the mouth of Rosier Creek. The peninsula s shoreline appears to have increased from 1937 to However, from 1994 to 2002, the shoreline has receded about feet on the Potomac River side and about 5 to 10 feet on the creek side. Between 2002 and 2006 another 360 feet of wood bulkhead was placed northward along the peninsula. The distal end and creek side continued to erode slightly up to Between 2009 and July 2012, an approximately 100 foot long section of bulkhead failed. In addition, toe rock can be seen in places. The preferred alternative to repair the failure is a high sill (Appendix 3, Figure 2) on the Potomac River side. To secure the remaining bulkhead s toe and address the erosion of the adjacent protected shore, a low sill (Appendix 3, Figure 1) should be considered with some bank grading which could be continued northward to the distal end of the spit and around into the creek. Figure Photo showing the bulkhead along the spit in Rosier Creek with a failed section and toe stone. 28 Westmoreland County
37 6 Summary and Links to Additional Resources The Shoreline Management Plan for Westmoreland County is presented as guidance to County planners, wetland board members, marine contractors, and private property owners. The plan has addressed all tidal shoreline in the locality and offered a strategy for management based on the output of a decision support tool known as the Shoreline Management Model. The plan also provides some site specific solutions to several areas of concern that were noted during the field review and data collection in the county. In all cases, the plan seeks to maximize the use of Living Shorelines as a method for shoreline stabilization where appropriate. This approach is intended to offer property owners with alternatives that can reduce erosion on site, minimize cost, in some cases ease the permitting process, and allow coastal systems to evolve naturally. Additional Resources VIMS: Westmoreland County Map Viewer VIMS: Living Shoreline Design Guidelines VIMS: Why a Living Shoreline? VIMS: Shoreline Evolution for Westmoreland County NOAA: Living Shoreline Implementation Techniques Chesapeake Bay Foundation: Living Shoreline for the Chesapeake Bay Watershed Shoreline Management Plan 29
38 7 References Angradi, T.R., Schweiger, E.W., Bolgrien, D.W., Ismert, P., and Selle, T Bank stabilization, riparian land use and the distribution of large woody debris in a regulated reach of the upper Missouri river, North Dakota, USA. River Res. Appl. 20(7): Basco, D.R. and C.S. Shin, Design Wave Information for Chesapeake Bay and Major Tributaries in Virginia. Coastal Engineering Program, Civil and Environmental Engineering Department, Old Dominion University, Norfolk, Virginia. Report No Berman, M.R., Berquist, H., Hershner, C.H., Killeen, S., Nunez, K., Rudnicky, T., Schatt, D.E., and D. Weiss, Westmoreland County Shoreline Situation Report, Special Report in Applied Marine Science and Ocean Engineering No. 395, Comprehensive Coastal Inventory Program, Center for Coastal Resources Management Virginia Institute of Marine Science, College of William and Mary, Gloucester Point, Virginia, Bischoff, A., and Humboldt-Universitaet zu Berlin Juvenile fish recruitment in the large lowland river oder: Assessing the role of physical factors and habitat availability. Shaker Verlag GmbH, Aachen. Boon, J.D., Evidence of Sea Level Acceleration at U.S. and Canadian Tide Stations, Atlantic Coast, North America. Journal of Coastal Research, 28: Burke, R., Lipcius, R., Luckenbach, M., Ross, P.G., Woodward, J., and Schulte, D Eastern oyster settlement and early survival on alternative substrates along intertidal marsh, rip rap, and manmade oyster reef. J. Shellfish Res. 25(2): 715. Carroll R (2003). Nekton utilization of intertidal fringing salt marsh and revetment hardened shorelines. Masters thesis, The College of William and Mary, Virginia Institute of Marine Science, Gloucester Point, VA. Center for Coastal Resource Management (CCRM), Comprehensive Coastal Resource Management Guidance. Planning Information and Guidance for the Living Shoreline Preference. Virginia Institute of Marine Science, College of William & Mary. Gloucester Point, Virginia. 27pp. Federal Emergency Management Agency, Flood Insurance Study: Westmoreland County, Virginia and Incorporated Areas. Flood Insurance Study Number 51193CV000A. Hardaway, C.S., Jr. and R.J. Byrne, Shoreline Management in Chesapeake Bay. Special Report in Applied Marine Science and Ocean Engineering No Virginia Institute of Marine Science, College of William & Mary, Gloucester Point, Virginia. Hardaway, C.S, Jr., D.A. Milligan, K.P. O Brien, C.A. Wilcox Shore Status, Evolution, and Storm Vulnerability Assessments. Technical Report. Virginia Institute of Marine Science, College of William & Mary, Gloucester Point, Virginia. Hardaway, C.S., Jr. and D.A. Milligan, Westmoreland State Park: Shoreline Erosion Plan. Report to Vanasse Hangen Brustlin, Inc. Shoreline Studies Program, Virginia Institute of Marine Science, College of William & Mary, Gloucester Point, Virginia. Hardaway, C.S., Jr., and J.R. Gunn, Design and performance of headland bays in Chesapeake Bay, USA. Coastal Engineering, 57: Westmoreland County
39 Hardaway, C.S., and J.R. Gunn, A brief history of headland breakwaters for shore protection in Chesapeake Bay, USA. Shore & Beach. Vol. 78, No. 4/Vol. 79, No. 1. Hardaway, C.S., Jr., D.A. Milligan, K. Duhring, 2010a. Living Shoreline Design Guidelines for Shore Protection in Virginia s Estuarine Environments. Version 1.2. Special Report in Applied Marine Science and Ocean Engineering No Virginia Institute of Marine Science, College of William & Mary, Gloucester Point, Virginia. Hardaway, C.S., Jr., D.A. Milligan, C.H. Hobbs, III, C.A. Wilcox, K.P. O Brien, L. Varnell, 2010b. Mathews County Shoreline Management Plan. Virginia Institute of Marine Science, College of William & Mary, Gloucester Point, Virginia. Miller, A.J., Shore Erosion Processes, Rates, and Sediment Contributions to the Potomac Tidal River and Estuary, The Johns Hopkins University. UMI Dissertation Information Service. 341 p. Milligan, D.A., C.S Hardaway, Jr., R.H. Brindley, G.R. Thomas, and L.M. Meneghini, Public Beach Assessment Report, Central Beach and Castlewood Park Beach, Colonial Beach, Virginia. Technical Report. Virginia Institute of Marine Science, College of William & Mary, Gloucester Point, Virginia. vims.edu/physical/research/shoreline/docs/public_beaches/final_report-central%20beach.pdf Milligan, D.A., C.A. Wilcox, C.S. Hardaway, Jr., M.C. Cox, Shoreline Evolution: Westmoreland County, Virginia Potomac River and Rappahannock River Shorelines. Data Summary Report. Virginia Institute of Marine Science, Gloucester Point, Virginia. Mixon, R. B., C. R. Berquist, Jr., W. L. Newell, G. H. Johnson, D. S. Powars, J. S. Schindler, E. K. Rader, Geological map and generalized cross sections of the coastal plain and adjacent parts of the Piedmont, Virginia. USGS IMAP: As modified in digital form by United States Geological Survey, National Research Council. Mitigating Shore Erosion along Sheltered Coasts. Washington, DC: The National Academies Press, Rice, C.A Effects of shoreline modification on a northern Puget sound beach: Microclimate and embryo mortality in surf smelt (hypomesus pretiosus). Estuaries Coasts. 29(1): Rice, C., Sobocinski, K., and Puget Sound Action Team, Olympia, WA (USA) Effects of shoreline modification on spawning habitat of surf smelt (hypomesus pretiosus) in Puget sound, Washington. Puget Sound Action Team, PO Box Olympia WA USA. Rohr, L.B., M.E. Lewis and L.W. Ward, Stratford Hall Plantation and Westmoreland State Park: Physical and Cultural Geography, Geology and Paleontology. Virginia Museum of Natural History Guidebook No. 3. Seitz, R.D., Lipcius, R.N., Olmstead, N.H., Seebo, M.S., and Lambert, D.M Influence of shallow-water habitats and shoreline development on abundance, biomass, and diversity of benthic prey and predators in Chesapeake Bay. Mar. Ecol. Prog. Ser. 326: Spalding, V.L. and N.L. Jackson Field investigation of the influence of bulkheads on meiofaunal abundance in the foreshore of an estuarine sand beach. Journal of Coastal Research 17: Stephenson, L.W. and F.S. MacNeil, Extension of Yorktown Formation (Miocene) of Virginia into Maryland. Geological Society of America Bulletin, 65: Westmoreland County, Westmoreland County s Comprehensive Plan: Vision Shoreline Management Plan 31


40 APPENDIX 1 Shoreline Management Model Graphic 32 Westmoreland County

41 Shoreline Management Plan 33
42 APPENDIX 2 Glossary of Shoreline Best Management Practices Preferred Shoreline Best Management Practices Areas of Special Concern (Marinas - Canals - Industrial or Commercial with bulkhead or wharf Other Unique Local Features, e.g. developed marsh & barrier islands) - The preferred shoreline best management practices within Areas of Special Concern will depend on the need for and limitations posed by navigation access or unique developed areas. Vegetation buffers should be included where possible. Revetments are preferred where erosion protection is necessary. Bulkheads should be limited to restricted navigation areas. Bulkhead replacement should be in same alignment or landward from original bulkhead. No Action Needed No specific actions are suitable for shoreline protection, e.g. boat ramps, undeveloped marsh & barrier islands. Upland & Bank Areas Land Use Management - Reduce risk by modifying upland uses, apply where bank and/or shoreline actions are extremely difficult or limited in effectiveness. May include relocating or elevating buildings, driveway relocation, utility relocation, hook up to public sewer/abandon or relocate sanitary drainfields. All new construction should be located 100 feet or more from the top of the bank. Re-direct stormwater runoff away from top of the bank, re-shape or grade along top of the bank only. May also include zoning variance requests for setbacks, relief from other land use restrictions that increase erosion risk. Forest Management - Enhance the existing forest condition and erosion stabilization services by selectively removing dead, dying and severely leaning trees, pruning branches with weight bearing load over the water, planting or allow for re-generation of mid-story and ground cover vegetation, control invasive upland species introduced by previous clearing. Enhance/Maintain Riparian Buffer Preserve existing vegetation located 100 ft or less from top of bank (minimum); selectively remove and prune dead, dying, and severely leaning trees; allow for natural re-generation of small native trees and shrubs. Enhance Riparian/Marsh Buffer Vegetation stabilization provided by a blended area of upland riparian and/or tidal marsh vegetation; target area extends from mid-tide to upland area where plants can occupy suitable elevations in dynamic fashion, e.g. seasonal fluctuations, gradual storm recovery; no action may be necessary in some situations; may include existing marsh management; may include planted marsh, sand fill, and/or fiber logs; restore riparian forest buffer where it does not exist; replace waterfront lawns with ornamental grasses, native shrubs and small trees; may include invasive species removal to promote native vegetation growth Grade Bank - Reduce the steepness of bank slope for wave run-up and to improve growing conditions for vegetation stabilization. Restore riparian-wetland buffer with deep-rooted grasses, perennials, shrubs and small trees, may also include planted tidal marsh. NOTE - The feasibility to grade bank may be limited by upland structures, existing defense structures, adjacent property conditions, and/or dense vegetation providing desirable ecosystem services. 34 Westmoreland County
43 Tidal Wetland Beach Shoreline Areas Enhance/Maintain Marsh Preserve existing tidal marsh for wave attenuation. Avoid using herbicides near marsh. Encourage both low and high marsh areas, do not mow within 100 ft from top of bank. Remove tidal debris at least annually. Repair storm damaged marsh areas with new planting. Widen Marsh Increase width of existing tidal marsh for additional wave attenuation; landward design preferred for sea level rise adjustments; channelward design usually requires sand fill to create suitable elevations. Widen Marsh/Enhance Buffer Blended riparian and/or tidal marsh vegetation that includes planted marsh to expand width of existing marsh or create new marsh; may include bank grading, sand fill, and/or fiber logs; replace waterfront lawns with ornamental grasses, native shrubs and small trees. Plant Marsh with Sill Existing or planted tidal marsh supported by a low revetment placed offshore from the marsh. The site-specific suitability for stone sill must be determined, including bottom hardness, navigation conflicts, construction access limitations, orientation and available sunlight for marsh plants. If existing marsh is greater than 15 ft wide, consider placing sill just offshore from marsh edge. If existing marsh is less than 15 ft wide or absent, consider bank grading and/or sand fill to increase marsh width and/or elevation. Enhance/Maintain Beach - Preserve existing wide sand beach if present, allow for dynamic sand movement for protection; tolerate wind-blown sand deposits and dune formation; encourage and plant dune vegetation. Beach Nourishment - Placement of good quality sand along a beach shoreline to increase the beach width and raise the elevation of the nearshore area; grain size of new sand should be similar to native beach sand Enhance Riparian/Marsh Buffer OR Beach Nourishment Increase vegetation stabilization with a blended area of upland riparian and/or tidal marsh vegetation; restore riparian forest buffer where it does not exist; replace waterfront lawns with ornamental grasses, native shrubs and small trees; may include planted marsh, sand fill, and/or fiber logs. Consider beach nourishment if existing riparian/marsh buffer does not need enhancement or cannot be improved and if additional sand placed on the beach will increase level of protection. Beach nourishment is the placement of good quality sand along a beach shoreline to increase the beach width and raise the elevation of the nearshore area; grain size of new sand should be similar to native beach sand. Maintain Beach OR Offshore Breakwaters with Beach Nourishment Preserve existing wide sand beach if present, allow for dynamic sand movement for protection; nourish the beach by placing good quality sand along the beach shoreline that is similar to the native sand. Use offshore breakwaters with beach nourishment only where additional protection is necessary. These are a series of large rock structures placed strategically offshore to maintain stable pocket beaches between the structures. The wide beaches provide most of the protection, so beach nourishment should be included; periodic beach re-nourishment may be needed. The site-specific suitability for offshore breakwaters with beach nourishment must be determined, seek expert advice. Groin Field with Beach Nourishment - A series of several groins built parallel to each other along a beach shoreline; established groin fields with wide beaches can be maintained with periodic beach nourishment; repair and replace individual groins as needed. Revetment - A sloped structure constructed with stone or other material (riprap) placed against the upland bank for erosion protection. The size of a revetment should be dictated by the wave height expected to strike the shoreline. The site-specific suitability for a revetment must be determined, including bank condition, tidal marsh presence, and construction access limitations. Shoreline Management Plan 35

44 APPENDIX 3 Guidance for Structural Design and Construction in Westmoreland County For Westmoreland County, three typical cross-sections for stone structures have been developed. The dimensions given for selected slope breaks have a range of values from medium to high energy exposures becoming greater with fetch and storm wave impact. Storm surge frequencies are shown for guidance. A range of the typical cost/foot also is provided (Table 1). These are strictly for comparison of the cross-sections and do not consider design work, bank grading, access, permits, and other costs. Additional information on structural design considerations are presented in section 3.4 of this report. Stone sills are effective management strategies in all fetch exposures where there is shoreline erosion; however, in low energy environments the non-structural shoreline best management practices described in Chapter 3 of this report may provide adequate protection, be less costly, and more ecological Table 1. Approximate typical structure cost per linear foot. beneficial to the environment. Stone revetments in low energy areas, such as creeks, are usually a single layer of armor. In medium to high wave energy shores, the structure should become a more engineered coastal structure. In the lower fetch areas of Westmoreland County, a low sill might be appropriate (Appendix 3, Figure 1). Along medium energy shores or where there is nearby upland infrastructure, a high sill would be better (Appendix 3, Figure 2). Using sills on the open river should be carefully considered due to severity of storm wave attack. Breakwater systems are applicable management strategies along much of the Westmoreland Potomac River coast and other areas with a medium to high energy shores. The actual planform design is dependent on numerous factors and should be developed by a professional. However, a typical breakwater tombolo and embayment cross-section is provided to help determine approximate system cost (Appendix 3, Figure 3). 36 Westmoreland County
 slope, and the bank can be graded to a (minimum) 2:1 slope, if appropriate. Figure 2.")
 slope, and the bank can be graded to a (minimum) 2:1 slope, if appropriate. Figure 3.")

45 Figure 1. Typical cross-section for a low sill that is appropriate for low to medium energy shorelines of Westmoreland County. The project utilizes clean sand on an 10:1 (H:V) slope, and the bank can be graded to a (minimum) 2:1 slope, if appropriate. Figure 2. Typical cross-section for a high sill that is appropriate for the medium to high energy shorelines of Westmoreland County. The project utilizes clean sand on an 10:1 (H:V) slope, and the bank can be graded to a (minimum) 2:1 slope, if appropriate. Figure 3. Typical cross-section for a breakwater system that is appropriate for the medium to high energy shorelines of Westmoreland County. Shown is the cross-section for the tombolo and rock structure. In addition, the typical crosssection for the bay beach between the structures is superimposed in a slightly different color. Note: the beach material is the same for the two cross-sections. Shoreline Management Plan 37

46 APPENDIX 4 Description of Geologic Units 38 Westmoreland County
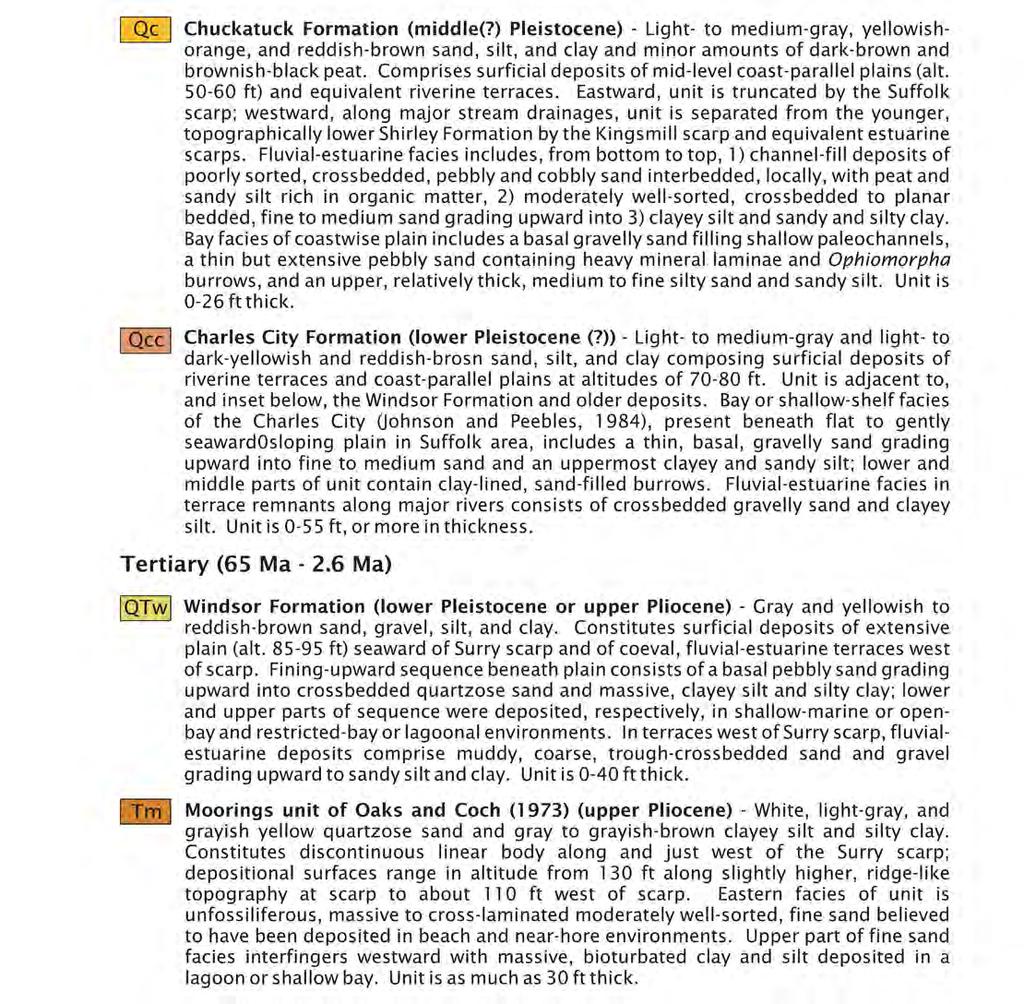
47 Shoreline Management Plan 39
48 40 Westmoreland County
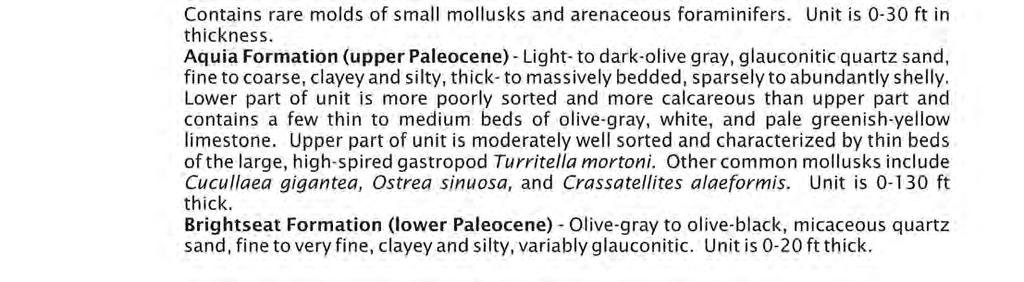
49 Shoreline Management Plan 41
City of Suffolk Shoreline Management Plan
 College of William and Mary W&M Publish Reports 4-2014 City of Suffolk Shoreline Management Plan C. Scott Hardaway Jr. Virginia Institute of Marine Science Donna A. Milligan Virginia Institute of Marine
Fairfax County Shoreline Management Plan
 Fairfax County Shoreline Management Plan Prepared for Fairfax County and Virginia Coastal Zone Management Program Virginia Institute of Marine Science College of William & Mary Gloucester Point, Virginia
York County Shoreline Management Plan
 York County Shoreline Management Plan Prepared for York County, Virginia and Virginia Coastal Zone Management Program Virginia Institute of Marine Science College of William & Mary Gloucester Point, Virginia
Prince George County Shoreline Management Plan
 Prince George County Shoreline Management Plan Virginia Institute of Marine Science College of William & Mary Gloucester Point, Virginia November 2016 Prince George County Shoreline Management Plan Prepared
VIMS CCRM Coastal Management Decision Tools. Decision Tree for Undefended Shorelines and Those with Failed Structures
 VIMS CCRM Coastal Management Decision Tools Decision Tree for Undefended Shorelines and Those with Failed Structures Center for Coastal Resources Management Virginia Institute of Marine Science Gloucester
Design and Construction of Living
 Design and Construction of Living Shorelines A course for living shorelines professionals September 29, 2010 This course made possible by a grant from the Virginia Coastal Zone Management Program NOAA
Dune Monitoring Data Update Summary: 2013
 Dune Monitoring Data Update Summary: 13 Shoreline Studies Program Virginia Institute of Marine Science College of William & Mary Gloucester Point, Virginia September 13 Dune Monitoring Data Update Summary:
ALTERNATIVES FOR COASTAL STORM DAMAGE MITIGATION
 ALTERNATIVES FOR COASTAL STORM DAMAGE MITIGATION Dave Basco Old Dominion University, Norfolk, Virginia, USA National Park Service Photo STRUCTURAL (changes to natural, physical system) hardening (seawalls,
GONE! Coastal Erosion Happens During Storms! Why Worry About Coastal Setbacks? Goals for Today
 RI Regulatory Setbacks & Buffers: Coastal Zone Management Issues New England Onsite Wastewater Training Program @ URI OWT 155 November 21, 2013 Goals for Today Understand the impacts of storms, coastal
RI Regulatory Setbacks & Buffers: Coastal Management Issues
 RI Regulatory Setbacks & Buffers: Coastal Management Issues New England Onsite Wastewater Training Program @ URI OWT 155 - November 29, 2012 James Boyd - Coastal Policy Analyst Photo: October 30, 2012
ALTERNATIVES FOR COASTAL STORM DAMAGE MITIGATION AND FUNCTIONAL DESIGN OF COASTAL STRUCTURES
 The University of the West Indies Organization of American States PROFESSIONAL DEVELOPMENT PROGRAMME: COASTAL INFRASTRUCTURE DESIGN, CONSTRUCTION AND MAINTENANCE A COURSE IN COASTAL DEFENSE SYSTEMS I CHAPTER
Estuarine Shoreline Stabilization
 Estuarine Shoreline Stabilization Property Owner s Guide to Determining the Most Appropriate Stabilization Method Estuarine shorelines are dynamic features that experience continued erosion. Land is lost
For more information or permission to reprint slides, please contact Donna Milligan at 1
 For more information or permission to reprint slides, please contact Donna Milligan at milligan@vims.edu 1 For more information or permission to reprint slides, please contact Donna Milligan at milligan@vims.edu
Shorelines Earth - Chapter 20 Stan Hatfield Southwestern Illinois College
 Shorelines Earth - Chapter 20 Stan Hatfield Southwestern Illinois College The Shoreline A Dynamic Interface The shoreline is a dynamic interface (common boundary) among air, land, and the ocean. The shoreline
Blakely Island, N Thatcher Bay. Restoration Recommendation: Rank Score (total score)
") Soft Shore Protection/Structure Removal Blueprint for San Juan County Forage Fish Beaches Appendix 2: Recommendations for sites scoring below the top ten, sorted by island (east to west) Blakely Island,
Soft Shore Protection/Structure Removal Blueprint for San Juan County Forage Fish Beaches Appendix 2: Recommendations for sites scoring below the top ten, sorted by island (east to west) Blakely Island,
Design Considerations for Living Shorelines in Connecticut. Jennifer E.D. O Donnell Department of Marine Sciences University of Connecticut
 Design Considerations for Living Shorelines in Connecticut Jennifer E.D. O Donnell Department of Marine Sciences University of Connecticut October 2015 1 Contents Contents... 2 1 Why Living Shorelines?...
Oceans and Coasts. Chapter 18
 Oceans and Coasts Chapter 18 Exploring the oceans The ocean floor Sediments thicken and the age of the seafloor increases from ridge to shore The continental shelf off the northeast United States Constituent
LAB: WHERE S THE BEACH
 Name: LAB: WHERE S THE BEACH Introduction When you build a sandcastle on the beach, you don't expect it to last forever. You spread out your towel to sunbathe, but you know you can't stay in the same spot
Australian Coastal Councils Conference
 Australian Coastal Councils Conference Kiama March 2019 Where Has My Beach Gone? (and what can I do about it?) Dr Andrew McCowan Water Technology Where Has My Beach Gone? Where Has My Beach Gone? Where
Chapter 10 Lecture Outline. The Restless Oceans
 Chapter 10 Lecture Outline The Restless Oceans Focus Question 10.1 How does the Coriolis effect influence ocean currents? The Ocean s Surface Circulation Ocean currents Masses of water that flow from one
NORTHERN CELL OPTIONS SHORTLIST RECOMMENDATIONS
 OPTIONS SHORTLIST RECOMMENDATIONS Coastal Unit C: Bayview Options recommended for MCDA scoring. Status quo. Planting 3. Renourishment (gravel) 6. Beach-scraping 7. Restore shingle crest. Inundation accommodation
Reading Material. Inshore oceanography, Anikouchine and Sternberg The World Ocean, Prentice-Hall
 Reading Material Inshore oceanography, Anikouchine and Sternberg The World Ocean, Prentice-Hall BEACH PROCESSES AND COASTAL ENVIRONMENTS COASTAL FEATURES Cross section Map view Terminology for Coastal
Living Shoreline Design Guidelines for Shore Protection in Virginia s Estuarine Environments
 Living Shoreline Design Guidelines for Shore Protection in Virginia s Estuarine Environments Virginia Institute of Marine Science College of William & Mary Gloucester Point, Virginia September 2010 Living
Salt Ponds Shore Zone Modeling for Breakwater Placement: Summary Report
 Salt Ponds Shore Zone Modeling for Breakwater Placement: Summary Report Virginia Institute of Marine Science May 2014 Salt Ponds Shore Zone Modeling for Breakwater Placement: Summary Report For Waterway
Shore Zone Management Planning for Middle Peninsula Chesapeake Bay Public Access Authority Properties
 College of William and Mary W&M ScholarWorks Reports 3-2017 Shore Zone Management Planning for Middle Peninsula Chesapeake Bay Public Access Authority Properties Donna Milligan Virginia Institute of Marine
Volume and Shoreline Changes along Pinellas County Beaches during Tropical Storm Debby
 Volume and Shoreline Changes along Pinellas County Beaches during Tropical Storm Debby Ping Wang and Tiffany M. Roberts Coastal Research Laboratory University of South Florida July 24, 2012 Introduction
Figure 1. Schematic illustration of the major environments on Mustang Island.
 STOP #1: PACKERY CHANNEL BEACH TO BAY We will start this field guide near the north jetty of Packery Channel and hike across the island to Corpus Christi Bay (fig. 1). The island emerges from the Gulf
Figure 4, Photo mosaic taken on February 14 about an hour before sunset near low tide.
 The Impact on Great South Bay of the Breach at Old Inlet Charles N. Flagg and Roger Flood School of Marine and Atmospheric Sciences, Stony Brook University Since the last report was issued on January 31
Beach profile surveys and morphological change, Otago Harbour entrance to Karitane May 2014 to June 2015
 Beach profile surveys and morphological change, Otago Harbour entrance to Karitane May 2014 to June 2015 Prepared for Port Otago Ltd Martin Single September 2015 Shore Processes and Management Ltd Contact
Q1. What are the primary causes/contributors to coastal erosion at Westshore and the concept of longshore / littoral drift.
 Q1. What are the primary causes/contributors to coastal erosion at Westshore and the concept of longshore / littoral drift. In order of (timing related) contribution to present problem 1. Beach is too
CHAPTER 4 - SHORELINE PROTECTION STUDY AND PLAN
 CHAPTER 4 Shoreline Protection Study and Plan 4-1 CHAPTER 4 - SHORELINE PROTECTION STUDY AND PLAN I. SHORELINE PROTECTION STUDY Lancaster County is a coastal community that has, as previously stated, approximately
Shoreline Studies Program, Department of Physical Sciences, VIMS
 Living Shoreline Training Class 2017 1 Demonstration sites discussed in this talk. 2 A shoreline management plan for the entire creek made conceptual shoreline management recommendations along every stretch
Combating Erosion at Mosquito Point
 2010 Combating Erosion at Mosquito Point A Report Generated by the Students of EVST 305: Environmental Problem Solving Randolph-Macon College 3/11/2010 TECHNICAL REPORT RMC-EVST 2009-2 Introduction to
New Jersey Coastal Zone Overview. The New Jersey Beach Profile Network (NJBPN) 3 Dimensional Assessments. Quantifying Shoreline Migration
 3 Dimensional Assessments. Quantifying Shoreline Migration") New Jersey Coastal Zone Overview The New Jersey Beach Profile Network (NJBPN) Objectives Profile Locations Data Collection Analyzing NJBPN Data Examples 3 Dimensional Assessments Methodology Examples Quantifying
New Jersey Coastal Zone Overview The New Jersey Beach Profile Network (NJBPN) Objectives Profile Locations Data Collection Analyzing NJBPN Data Examples 3 Dimensional Assessments Methodology Examples Quantifying
Living Shoreline Design Guidelines for Shore Protection in Virginia s Estuarine Environments
 College of William and Mary W&M ScholarWorks Reports 9-2017 Living Shoreline Design Guidelines for Shore Protection in Virginia s Estuarine Environments C. Scott Hardaway Jr Virginia Institute of Marine
Long Beach Island Holgate Spit Little Egg Inlet Historical Evolution Introduction Longshore Transport Map, Survey and Photo Historic Sequence
 Appendix B Long Beach Island Holgate Spit Little Egg Inlet Historical Evolution Introduction The undeveloped southern end of Long Beach Island (LBI) is referred to as the Holgate spit as it adjoins the
Shoreline Management In Chesapeake Bay
 Shoreline Management In Chesapeake Bay C. S. Hardaway, Jr. and R. J. Byrne Virginia Institute of Marine Science College of William and Mary 1 Cover Photo: Drummond Field, Installed 1985, James River, James
IMPACTS OF COASTAL PROTECTION STRATEGIES ON THE COASTS OF CRETE: NUMERICAL EXPERIMENTS
 IMPACTS OF COASTAL PROTECTION STRATEGIES ON THE COASTS OF CRETE: NUMERICAL EXPERIMENTS Tsanis, I.K., Saied, U.M., Valavanis V. Department of Environmental Engineering, Technical University of Crete, Chania,
Impacts of breakwaters and training walls
 Across the eastern seaboard of Australia, breakwaters and training walls have instigated fundamental perturbations to coastal and estuary processes. This has induced long-term changes to foreshore alignments,
Overview. Beach Features. Coastal Regions. Other Beach Profile Features. CHAPTER 10 The Coast: Beaches and Shoreline Processes.
 Overview CHAPTER 10 The Coast: Beaches and Shoreline Processes Coastal regions constantly change. The beach is a dominant coastal feature. Wave activity continually modifies the beach and coastal areas.
North Shore of Long Island, Feasibility Study
 North Shore of Long Island, Asharoken New York Asharoken, Feasibility Study Asharoken, NY Public Meeting June 30, 2015 US Army Corps of Engineers US Army Corps of Engineers New York BUILDING STRONG BUILDING
CHAPTER 8 ASSESSMENT OF COASTAL VULNERABILITY INDEX
 124 CHAPTER 8 ASSESSMENT OF COASTAL VULNERABILITY INDEX 8.1 INTRODUCTION In order to assess the vulnerability of the shoreline considered under this study against the changing environmental conditions,
The Value of Created Dunes to address Coastal Hazards in Chesapeake Bay: Hurricane Isabel Impacts
 The Value of Created Dunes to address Coastal Hazards in Chesapeake Bay: Hurricane Isabel Impacts November 2000 NL42, 14 Oct 2003 The Value of Created Dunes to address Coastal Hazards in Chesapeake Bay:
Lecture Outlines PowerPoint. Chapter 15 Earth Science, 12e Tarbuck/Lutgens
 Lecture Outlines PowerPoint Chapter 15 Earth Science, 12e Tarbuck/Lutgens 2009 Pearson Prentice Hall This work is protected by United States copyright laws and is provided solely for the use of instructors
HURRICANE SANDY LIMITED REEVALUATION REPORT UNION BEACH, NEW JERSEY DRAFT ENGINEERING APPENDIX SUB APPENDIX D SBEACH MODELING
 HURRICANE SANDY LIMITED REEVALUATION REPORT UNION BEACH, NEW JERSEY DRAFT ENGINEERING APPENDIX SUB APPENDIX D SBEACH MODELING Rev. 18 Feb 2015 1 SBEACH Modeling 1.0 Introduction Following the methodology
General Coastal Notes + Landforms! 1
 General Coastal Notes + Landforms! 1 Types of Coastlines: Type Description Primary Coast which is essentially in the same condition when sea level stabilized Coastline after the last ice age, younger.
UPPER BEACH REPLENISHMENT PROJECT RELATED
 ASSESSMENT OF SAND VOLUME LOSS at the TOWNSHIP of UPPER BEACH REPLENISHMENT PROJECT RELATED to the LANDFALL OF HURRICANE SANDY - PURSUANT TO NJ-DR 4086 This assessment is in response to Hurricane Sandy
Feasibility Study for Restoration of Titlow Lagoon Fish Passage. South Puget Sound Salmon Enhancement Group
 Feasibility Study for Restoration of Titlow Lagoon Fish Passage South Puget Sound Salmon Enhancement Group January 2010 Feasibility Study for Restoration of Titlow Lagoon Fish Passage Prepared for South
AN OVERVIEW OF RECENT PROJECTS RELATED TO SAND BUDGETS, SOUTHERN CALIFORNIA BEACHES
 AN OVERVIEW OF RECENT PROJECTS RELATED TO SAND BUDGETS, SAND SUPPLY, COASTAL ARMORING, MANAGEMENT, AND VALUING SOUTHERN CALIFORNIA BEACHES Dr. Kiki Patsch California State University Channel Islands Environmental
Nearshore Sediment Transport What influences the loss of sediment on Beaches? - Waves - Winds - Tidal Currents - River discharge - Runoff
 Tides & Beaches Nearshore Sediment Transport What influences the loss of sediment on Beaches? - Waves - Winds - Tidal Currents - River discharge - Runoff Oceans Ocean Topography Physical Structure of the
Encroachment of Sills onto State-Owned Bottom: Design Guidelines for Chesapeake Bay
 Encroachment of Sills onto State-Owned Bottom: Design Guidelines for Chesapeake Bay Virginia Institute of Marine Science College of William & Mary March 2009 Encroachment of Sills onto State-Owned Bottom:
Inlet Management Study for Pass-A-Grille and Bunces Pass, Pinellas County, Florida
 Inlet Management Study for Pass-A-Grille and Bunces Pass, Pinellas County, Florida Final Report Submitted By Ping Wang, Ph.D., Jun Cheng Ph.D., Zachary Westfall, and Mathieu Vallee Coastal Research Laboratory
Soft Designs for a Harsh Climate: Trends in Coastal Engineering
 Alaska Department of Transportation & Public Facilities Ruth Carter, PE, and Harvey Smith, PE Coastal Engineering Section 20 October 2014 Soft Designs for a Harsh Climate: Trends in Coastal Engineering
Beach Nourishment Impact on Beach Safety and Surfing in the North Reach of Brevard County, Florida
 Beach Nourishment Impact on Beach Safety and Surfing in the North Reach of Brevard County, Florida Prepared by John Hearin, Ph.D. Coastal Engineering Vice Chairman Cocoa Beach Chapter Port Canaveral Patrick
Delaware Chapter Surfrider Foundation - Indian River Inlet Monitoring
 Delaware Chapter Surfrider Foundation - Indian River Inlet Monitoring In 2012, the Delaware Surfrider Foundation Chapter formed the Surf Quality and Access Committee to focus on issues such as surf spot
Brief History of Headland Breakwaters Usage in Chesapeake Bay, USA. 25 Years of Rock, Sand and Plants for Shore Protection
 Brief History of Headland Breakwaters Usage in Chesapeake Bay, USA. 25 Years of Rock, Sand and Plants for Shore Protection Beach Tech 2011 C. Scott Hardaway, Jr., Geologist, Virginia Institute of Marine
Shoreline Development
 Shoreline Development Erosion Control The evolution of the Chesapeake Bay shoreline has been influenced by residential and commercial development along the tidal shoreline. Commercial shoreline development
STATUS REPORT FOR THE SUBMERGED REEF BALL TM ARTIFICIAL REEF SUBMERGED BREAKWATER BEACH STABILIZATION PROJECT FOR THE GRAND CAYMAN MARRIOTT HOTEL
 August 23 STATUS REPORT FOR THE SUBMERGED REEF BALL TM ARTIFICIAL REEF SUBMERGED BREAKWATER BEACH STABILIZATION PROJECT FOR THE GRAND CAYMAN MARRIOTT HOTEL performed by Lee E. Harris, Ph.D., P.E. Consulting
Yorktown Beach with Hurricane Isabel Impacts
 Yorktown Beach 3-5 with Hurricane Isabel Impacts VIMS Shoreline Studies Program January 5 Yorktown Beach 3-5 with Hurricane Isabel Impacts Donna A. Milligan C. Scott Hardaway, Jr. Linda M. Meneghini George
EVALUATION OF BEACH EROSION UP-DRIFT OF TIDAL INLETS IN SOUTHWEST AND CENTRAL FLORIDA, USA. Mohamed A. Dabees 1 and Brett D.
 EVALUATION OF BEACH EROSION UP-DRIFT OF TIDAL INLETS IN SOUTHWEST AND CENTRAL FLORIDA, USA Mohamed A. Dabees 1 and Brett D. Moore 1 The paper discusses the analysis of up-drift beach erosion near selected
Chapter 20 Lecture. Earth: An Introduction to Physical Geology. Eleventh Edition. Shorelines. Tarbuck and Lutgens Pearson Education, Inc.
 Chapter 20 Lecture Earth: An Introduction to Physical Geology Eleventh Edition Shorelines Tarbuck and Lutgens The Shoreline: A Dynamic Interface The Coastal Zone The shoreline is constantly modified by
DUNE STABILIZATION AND BEACH EROSION
 DUNE STABILIZATION AND BEACH EROSION CAPE HATTERAS NATIONAL SEASHORE NORTH CAROLINA ROBERT DOLAN PAUL GODFREY U. S. DEPARTMENT OF INTERIOR NATIONAL PARK SERVICE OFFICE OF NATURAL SCIENCE WASHINGTON, D.
Performance of Upham Beach T-Groin Project and Its Impact to the Downdrift Beach
 Performance of Upham Beach T-Groin Project and Its Impact to the Downdrift Beach Progress Report for the Period of October 2008 to April 2009 Submitted by Ping Wang, Ph.D., and Tiffany M. Roberts Department
COASTAL SYSTEMS WAVE ENERGY
 WAVE ENERGY The energy of a wave determines its ability to erode and transport material on the coast Wave energy depends on the fetch, the distance the wind has blown the wave Wind strength and wind duration
Leaning Into Adaptation
 www.marinslr.org Leaning Into Adaptation GFNMS Ocean Summit, May 17, 2016 Jack Liebster, Planning Manager, Marin County Marin County C-SMART Sea Level Rise Adaptation Process Evaluate Science Info. Implement
SACO RIVER AND CAMP ELLIS BEACH SACO, MAINE SECTION 111 SHORE DAMAGE MITIGATION PROJECT APPENDIX F ECONOMIC ASSESSMENT
 SACO RIVER AND CAMP ELLIS BEACH SACO, MAINE SECTION 111 SHORE DAMAGE MITIGATION PROJECT APPENDIX F ECONOMIC ASSESSMENT Department of the Army New England District, Corps of Engineers 696 Virginia Road
RE: Hurricane Matthew Beach Damage Assessment and Recommendations [CSE 2416]
![RE: Hurricane Matthew Beach Damage Assessment and Recommendations [CSE 2416]](/thumbs/83/87675702.jpg "RE: Hurricane Matthew Beach Damage Assessment and Recommendations [CSE 2416]") October 25, 2016 Iris Hill Town Administrator Town of Edisto Beach 2414 Murray St Edisto Beach SC 29438 RE: Hurricane Matthew Beach Damage Assessment and Recommendations [CSE 2416] Dear Iris, Hurricane
October 25, 2016 Iris Hill Town Administrator Town of Edisto Beach 2414 Murray St Edisto Beach SC 29438 RE: Hurricane Matthew Beach Damage Assessment and Recommendations [CSE 2416] Dear Iris, Hurricane
Building Coastal Resiliency at Plymouth Long Beach
 Building Coastal Resiliency at Plymouth Long Beach Department of Marine and Environmental Affairs March 30, 2017 Introducing Green Infrastructure for Coastal Resiliency Plymouth Long Beach & Warren s Cove
Figure 106. Locations of the 28 NJBPN profile stations in Ocean County, NJ.
 130 Figure 106. Locations of the 28 NJBPN profile stations in Ocean County, NJ. 131 2016-2017 Beach Fills in Ocean County: The federal/state/local storm damage reduction project (beachfill) between Manasquan
Essentials of Oceanography Eleventh Edition
 Chapter Chapter 1 10 Clickers Lecture Essentials of Oceanography Eleventh Edition The Coast: Beaches and Shoreline Processes Alan P. Trujillo Harold V. Thurman Chapter Overview Coastal regions have distinct
COASTAL ENVIRONMENTS. 454 lecture 12
 COASTAL ENVIRONMENTS Repeated movement of sediment & water constructs a beach profile reflecting the balance between average daily or seasonal wave forces and resistance of landmass to wave action Coasts
DUXBURY WAVE MODELING STUDY
 DUXBURY WAVE MODELING STUDY 2008 Status Report Duncan M. FitzGerald Peter S. Rosen Boston University Northeaster University Boston, MA 02215 Boston, MA 02115 Submitted to: DUXBURY BEACH RESERVATION November
Chesil Beach, Dorset UK High energy, shingle coastline. Brighton Beach, Sussex UK Pebble beach
 Beaches: Depositional landform Extends from the highest high tide to the lowest low tide. Very important temporary store in coastal system. Accretion: sediment returning to the visible portion of a beach
Julebæk Strand. Effect full beach nourishment
 Julebæk Strand Effect full beach nourishment Aim of Study This study is a part of the COADAPT funding and the aim of the study is to analyze the effect of beach nourishment. In order to investigate the
OECS Regional Engineering Workshop September 29 October 3, 2014
 B E A C H E S. M A R I N A S. D E S I G N. C O N S T R U C T I O N. OECS Regional Engineering Workshop September 29 October 3, 2014 Coastal Erosion and Sea Defense: Introduction to Coastal Dynamics David
OECS Regional Engineering Workshop September 29 October 3, 2014
 B E A C H E S. M A R I N A S. D E S I G N. C O N S T R U C T I O N. OECS Regional Engineering Workshop September 29 October 3, 2014 Coastal Erosion and Sea Defense: Introduction to Coastal/Marine Structures
Future Condi,ons coastal hazard modeling and mapping
 Future Condi,ons coastal hazard modeling and mapping Presented by Bob Ba:alio, PE Environmental Science Associates, Inc. (ESA) On behalf of the physical processes team (USGS, TerraCosta- Scripps, ESA)
JAP Additional Information Sheet
 JAP Additional Information Sheet Block 15: Purpose and Need The USACE purpose of the project is to provide a safe and reliable whitewater park for the recreational public in a city park, which will provide
Coastal management has lagged behind the growth in population leading to problems with pollution
 Fifty percent of the population of the industrialized world lives within 100 km of a coast. Coastal management has lagged behind the growth in population leading to problems with pollution and natural
Affects of Tides on Lateral Coastal Access at. Las Varas Ranch. Gaviota, California. Photos Courtesy of California Coastal Records Project
 Affects of Tides on Lateral Coastal Access at Las Varas Ranch Gaviota, California Photos Courtesy of California Coastal Records Project September 18, 2014 Santa Barbara County Trails Council 1 As part
Figure79. Location map for the 10 NJBPN profile sites in Atlantic County, NJ 155
 154 Figure79. Location map for the 10 NJBPN profile sites in Atlantic County, NJ 155 ATLANTIC COUNTY SPRING 2009 to FALL 2010 The Atlantic County coastline consists of three barrier islands. Between Little
Chiswell and Chesil Beach (to Wyke Narrows) 6a02 and 6a03 SUMMARY OF PREFERRED PLAN RECOMMENDATIONS AND JUSTIFICATION
 6a02 and 6a03 SUMMARY OF PREFERRED PLAN RECOMMENDATIONS AND JUSTIFICATION") Location reference: Policy Unit reference: Plan: Chiswell and Chesil Beach (to Wyke Narrows) 6a02 and 6a03 SUMMARY OF PREFERRED PLAN RECOMMENDATIONS AND JUSTIFICATION The long term aim for this section
Location reference: Policy Unit reference: Plan: Chiswell and Chesil Beach (to Wyke Narrows) 6a02 and 6a03 SUMMARY OF PREFERRED PLAN RECOMMENDATIONS AND JUSTIFICATION The long term aim for this section
The Case of the Disappearing Shoreline
 Name The Case of the Disappearing Shoreline Humans change the earth's climate in many ways. One change is the increase of carbon dioxide in the atmosphere. As we burn more fossil fuels, we release more
BEACH PROCESSES AND COASTAL ENVIRONMENTS
 BEACH PROCESSES AND COASTAL ENVIRONMENTS COASTAL FEATURES Cross section Map view TOPICS: Terminology Waves Beach Morphology Barriers Coastal Migration Tides Tidal Flats and Marshes Sediment Budgets Human
Cove Point Beach Restoration: Utilization of a Spawning Habitat by Horseshoe Crabs (Limulus polyphemus)
") Cove Point Beach Restoration: Utilization of a Spawning Habitat by Horseshoe Crabs (Limulus polyphemus) Paul Bushmann, Jessica Peterson, Bethany Enyeart and Deborah Smith Anne Arundel Community College
Cove Point Beach Restoration: Utilization of a Spawning Habitat by Horseshoe Crabs (Limulus polyphemus) Paul Bushmann, Jessica Peterson, Bethany Enyeart and Deborah Smith Anne Arundel Community College
The purpose and needs of the Figure Eight Island Inlet and Shoreline Management Project are as follows:
 Chapter 2 PURPOSE AND NEEDS 1. What are the purpose and needs of this project? The main concern of residents and owners at Figure Eight Island are economic losses resulting from damages to structures and
Bay County, MI Coastal Hazard Analysis Flood Risk Review Meeting. May 14, 2018
 Bay County, MI Coastal Hazard Analysis Flood Risk Review Meeting May 14, 2018 Agenda Introductions Coastal Flood Risk Study and Mapping Program Current Status Technical Overview of Study and Mapping Floodplain
Town of Duck, North Carolina
 Tracking No. 00.00.2010 Erosion Mitigation And Shoreline Management Feasibility Study Town of Duck, North Carolina Coastal Planning & Engineering of North Carolina August 15, 2012 Tom Jarrett Robert Neal
Coasts. 1. Coastal Processes. 1.1 Coastal erosion. 1.2 Sediment transport. Coastal Processes and Landforms. i. Hydraulic action
 Coasts Coastal Processes and Landforms 1. Coastal Processes 1.1 Coastal erosion i. Hydraulic action When waves strike against a rock surface, the waves trap air in the rock joints. This air is compressed
Geology of the Hawaiian Islands
 Geology of the Hawaiian Islands Class 24 8 April 2004 Any Questions? Rise and fall of sea level and its effect on Hawai`i Sea level Has fluctuated up and down many times in the geologic past Evidence?
APPENDIX C VEGETATED EMERGENCY SPILLWAY. VERSION 1.0 March 1, 2011
 APPENDIX C VEGETATED EMERGENCY SPILLWAY VERSION 1.0 March 1, 2011 [NOTE: Could use a better photo more clearly showing the emergency spillway in the context of the dam.] SECTION C-1: DESCRIPTION OF PRACTICE
County of Santa Barbara Permit Option Analysis Goleta Beach JULY 13, 2017
 County of Santa Barbara Permit Option Analysis Goleta Beach JULY 13, 2017 Introduction 2 Goleta Beach Park welcomes 1.5 million visitors annually Amenities include: Picnic Areas and Group Areas w/bbqs
ATLANTIC COUNTY 2006 to 2008
 ATLANTIC COUNTY 2006 to 2008 The Atlantic County oceanfront shoreline consists of three barrier islands where the northern one, Little Beach Island and a third of the second, Brigantine Island, are undeveloped
Living Shorelines Non-structural Erosion Control Practices Rhode Island Land & Water Summit, 2014
 Living Shorelines Non-structural Erosion Control Practices Rhode Island Land & Water Summit, 2014 D. Steven Brown (1) Kevin Ruddock (1) Rhonda Smith (2) The Nature Conservancy United States Fish and Wildlife
FINDING OF NO SIGNIFICANT IMPACT
 DEPARTMENT OF THE ARMY CHARLESTON DISTRICT, CORPS OF ENGINEERS 69A HAGOOD AVENUE CHARLESTON, SOUTH CAROLINA 29403-5107 FINDING OF NO SIGNIFICANT IMPACT EDISTO BEACH COASTAL STORM DAMAGE REDUCTION GENERAL
APPENDIX D-2. Sea Level Rise Technical Memo
 APPENDIX D-2 Sea Level Rise Technical Memo 2185 N. California Blvd., Suite 500 Walnut Creek, CA 94596 (925) 944-5411 Fax: (925) 944-4732 www.moffattnichol.com DRAFT MEMORANDUM To: From: Neil Nichols,
INTRODUCTION TO COASTAL ENGINEERING AND MANAGEMENT
 Advanced Series on Ocean Engineering Volume 16 INTRODUCTION TO COASTAL ENGINEERING AND MANAGEMENT J. William Kamphuis Queen's University, Canada World Scientific Singapore New Jersey London Hong Kong Contents
Chapter. The Dynamic Ocean
 Chapter The Dynamic Ocean An ocean current is the mass of ocean water that flows from one place to another. 16.1 The Composition of Seawater Surface Circulation Surface Currents Surface currents are movements
A REVIEW OF THE CONDITION OF THE MUNICIPAL BEACHES AS A RESULT OF HURRICANE SANDY IN THE BOROUGH OF STONE HARBOR, CAPE MAY COUNTY, NEW JERSEY
 A REVIEW OF THE CONDITION OF THE MUNICIPAL BEACHES AS A RESULT OF HURRICANE SANDY IN THE BOROUGH OF STONE HARBOR, CAPE MAY COUNTY, NEW JERSEY View along the dune scarp from 103 rd Street on October 31,
The Dynamic Coast. Right Place Resources. A presentation about the interaction between the dynamic coast and people
 The Dynamic Coast Houses threatened by coastal erosion in California Right Place Resources A presentation about the interaction between the dynamic coast and people For the rest of the presentations in