South Amelia Island Shore Stabilization Project- Beach Renourishment
|
|
|
- Lee McCoy
- 5 years ago
- Views:
Transcription
1 South Amelia Island Shore Stabilization Project- Beach Renourishment Evaluation of Beach Nourishment Impacts to Beach Indicator Species Spring 2013 Year 2 Post-Construction Final Report USACE Permit No. SAJ FDEP JCP Permit No JC Prepared for: Olsen Associates, Inc Herschel St. Jacksonville, FL Prepared By: Coastal Eco-Group Inc. 810 SE 8 th Ave. Suite C Deerfield Beach, FL February 2014
2 EXECUTIVE SUMMARY The 2011 renourishment of the South Amelia Island Shore Stabilization Project was constructed between May 11 and August 18, A softbottom macroinvertebrate monitoring program was implemented in consultation with the National Marine Fisheries Service to evaluate impacts to beach macrofauna and recovery time following beach fill placement. The beach monitoring program consisted of 15 onshore stations (7 control and 8 impact stations) to evaluate the effects of beach nourishment on three beach macroinvertebrate indicator species: ghost crabs, coquina clams, and mole crabs. The indicator approach allowed for two sampling events/year (late spring and late fall to capture peak recruitment periods) and a higher density of sampling locations along the shoreline (both impact and control) in comparison to the more time-intensive coring method. Surveys were conducted as follows: o Fall month pre-construction o Spring 2011 immediate pre-construction o Fall 2011 immediate (3-month) post-construction o Spring month post-construction o Fall month post-construction o Spring month post-construction Mole Crabs Impacts to mole crab populations were not detected during the 8-month immediate postconstruction survey in Spring Abundances were higher at both the impact and control stations during the Fall 2011 and Spring 2012 post-construction surveys in comparison to the Fall 2010 and Spring 2011 pre-construction surveys. Because impacts were not detected from the beach nourishment project, the authorized Biological Monitoring Plan did not require evaluation of beach grab samples for mole crab abundance during the Spring 2013 Year 2 postconstruction survey. Coquina Clams While very low abundance of coquina clams was found at all 15 stations during the Fall 2010 pre-construction survey, the Spring 2011 pre-construction survey captured a high recruitment year at the beach fill impact stations. Overall abundances remained very low at the individual control stations in Spring Populations did not recover during the 8-month postconstruction survey in Spring 2012 at four beach fill impact stations, R-60, R-63, R-64, and R- 72; these four stations had supported the highest densities immediately prior to project construction in Spring The sampling protocol was modified during the Spring 2013 survey to concentrate grab samples at these four impact stations and four northern control stations, R-40, R-48, R-53, and R-56. Mean densities in Spring 2013 were significantly higher than all pre-construction and post-construction surveys at R-60 and R-64 and higher than all ii
3 preceding post-construction surveys at R-63 and R-72. Significant increases in abundance were also recorded at the control stations from Fall 2012 to Spring 2013, indicating a high recruitment year throughout the Amelia Island study area. Based on the recovery of coquina clams in the beach nourishment project area at two years after project construction, no further sampling is required by U.S. Army Corps of Engineers Permit No. SAJ or the authorized Biological Monitoring Plan. Ghost Crabs Similar to the results of other softbottom monitoring programs for beach nourishment projects, the Fall 2011 immediate post-construction survey showed a nearly complete loss of the active ghost crab burrows within the project fill area; this decline in total abundance was not observed at the control stations. Eight months post-construction in Spring 2012, the northernmost station, R-60, was the only station in the project fill area where active burrows were recorded. Overall abundances in Fall 2012 remained much lower at the beach fill impact stations in comparison to the control stations; however, the number of active burrows at R-60 and R-64 was higher in Fall 2012 than Fall Although ghost grab populations remained depressed at three southern beach fill impact stations in Spring 2013 (R-70, R-72, and R-74), the control stations exhibited similar variability in overall abundances at the individual stations in comparison to the impact stations. The Fall 2012 and Spring 2013 surveys suggest that ghost crabs are re-populating the beach nourishment project area through a combination of migration of adults from adjacent beaches to the north as well as recruitment of new individuals. Given the repopulation of the northern half of the project area and recovery of the food base for ghost crabs in the overall beach nourishment area, continued migration of adults and new recruits are expected throughout the project area. Additionally, since the control stations to the south of 2011 beach renourishment project area were directly affected by a beach disposal project by the U.S. Army Corps of Engineers in the Fall of 2013, continued monitoring of the southernmost stations in the 2011 project fill area is not recommended. Additional sampling for ghost crab populations is not required by USACE Permit No. SAJ or the authorized Biological Monitoring Plan based on the evaluation of the Year 2 post-construction survey results. iii
4 TABLE OF CONTENTS EXECUTIVE SUMMARY...ii 1.0 INTRODUCTION METHODS Beach Fill Site Macrofauna Sampling Beach Fill Site Macrofauna Laboratory Analysis Beach Fill Site Sediment Sampling and Laboratory Analysis Beach Fill Site Statistical Analysis RESULTS Ghost Crabs- Fall 2012 and Spring 2013 Post-Construction Surveys Coquina Clams Fall 2012 and Spring 2013 Post-Construction Surveys Mole Crabs - Fall 2012 Post-Construction Survey Sediment Characteristics DISCUSSION CONCLUSIONS REFERENCES iv
5 LIST OF FIGURES Figure 1. Location map 2011 South Amelia Island Beach Nourishment Project Figure 2. Location map- Beach macroinvertebrate and ghost crab sampling locations... 5 Figure 3. Layout of the ghost crab transects across the beach and beach macroinvertebrate sampling locations in the swash zone.6 LIST OF TABLES Table 1. Beach sampling events: Pre-construction through Year 2 Spring 2013 Post- Construction Table 2. Total abundance of ghost crab burrows at each station during all surveys Table 3. Beach fill impact and control station comparisons of mean density of ghost crab (Ocypode quadrata) burrows, mean density of Donax spp., and mean density of mole crabs (Emerita talpoida) Table 4. Zone comparisons between beach fill impact and control stations: mean densities of ghost crab (O. quadrata) burrows, mean density of Donax spp., and mean densities of mole crabs (Emerita talpoida) Table 5. Total abundance of Donax spp. at the 2013 beach fill impact and control stations during each survey Table 6. Mean (±SE) densities (no individuals/m 2 )[± standard error (SE)] of Donax spp. in the upper and middle swash zones at each station during each survey Table 7. Beach fill impact and control station comparisons of mean shell length (Donax spp.) and mean carapace length (Emerita talpoida) Table 8. Total abundance of mole crabs (E. talpoida) at each station during all surveys Table 9. Mean densities (no individuals/m 2 )[± standard error (SE)] of E. talpoida in the upper and middle swash zone at each station during each survey...18 Table 10. Mean grain size (phi) [± standard error (SE)] at the control and impact sites during each survey. No significant differences were found among surveys Table 11. Mean grain size (phi) ±SE) at the three beach zones at the control and impact sites during each survey v
6 LIST OF ELECTRONIC APPENDICES Appendix I 2011 South Amelia Island Beach Renourishment Project- Pre-Construction vs. Immediate (8 months) Post-Construction Report (CEG, 2013). Appendix II Photo log of beach monitoring stations vi
7 1.0 INTRODUCTION The 2011 renourishment of the South Amelia Island Shore Stabilization Project was constructed between May 11 and August 18, The project is located along the Atlantic Ocean shoreline in the southern portion of Amelia Island within Amelia Island State Park (AISP) and the South Amelia Island Shoreline Stabilization Association (SAISSA) properties (Figure 1). The project was the second maintenance nourishment of the SAISSA Project (1994 & 2002), and the first maintenance nourishment following completion of the Phase II structural stabilization project in Approximately 2.1 million cubic yards of sand were placed along 3.2 miles (5.2 km) of shoreline from Florida Department of Environmental Protection (FDEP) reference monument R south to R-77. Sand was excavated from a borrow site located directly offshore of the southern limit of the beach fill along the margin of the Nassau Sound ebb shoal (Figure 1). A beach habitat indicator approach following Irlandi and Arnold (2008) was implemented at the beach nourishment site to provide more robust data for evaluation of potential impacts and recovery time. The indicator approach allows for two sampling events/year (late spring and late fall) to capture peak recruitment periods and a higher density of sampling locations along the shoreline (both impact and control) in comparison to the time-intensive core sampling method. Three key beach-habitat indicator species were used in the monitoring program. Mole crab (Emerita talpoida), ghost crab (Ocypode quadrata), and coquina clams (Donax spp.) are considered indicator species for beach habitat in Florida s Comprehensive Wildlife Conservation Strategy. Ghost crabs forage and burrow along the upper portion of the beach while the mole crab and coquina clams are suspension feeders that burrow within the swash zone of the beach. All three indicator species are preyed upon by shorebirds and fish and are fundamentally important to the functions of the beach biological community (Peterson et al., 2000). Impacts to Donax spp. populations were detected in the Spring 2012 post-construction monitoring data at select areas of the project fill beach. The protocol was modified during the Spring 2013 Year 2 monitoring to concentrate grab sampling in the high-density areas which did not recover to the Spring 2011 baseline condition. These sites included Beach Fill Compliance Sites R-60, R-63, R-64, and R-72, and four northern control sites (R-40, R-48, R-53, and R- 56). Monitoring for ghost crabs was performed for the entire study area during the Spring 2013 monitoring event based on the results of the Spring 2012 monitoring. Impacts to mole crab populations were not detected in the Spring month post-construction survey; therefore, evaluation of changes in mole crab abundance was not conducted during the Year 2 sampling. 1
8 R-30 A A1 sa u Na s 2 er Riv A A1 RT AI RP O H080 R081 R-80 R-80 H081 AISP AMELIA ISLAND er Location Map FT. CLINCH R-77 AMERICAN BEACH ATLANTIC OCEAN St. Mary's River ENTRANCE 2011 PROJECT BORROW SITE 2011 BEACH FILL LIMITS R-70 R-60 R-50 R-40 R-30 R-20 R-10 FLORIDA GEORGIA NASSAU SOUND R-01 FERNANDINA BEACH sr iver ry' CUMBERLAND ISLAND, GA iv lia R 2011 AMELIA ISLAND BEACH NOURISHMENT PROJECT A1A St. Ma S. Ame
9 A sediment sampling program was implemented in conjunction with the biological sampling program to evaluate sediment compatibility between the offshore borrow site and existing beach and predict recovery of infaunal populations at the offshore borrow site. Coastal Eco-Group scientists completed all field sampling events of the beach site, sorting and enumeration of beach macrofauna samples, and data analyses and report preparation. Sediment grain size analyses were conducted by Scientific Environmental Applications Inc. (SEA) of Melbourne, FL. Grain-size distribution data from the sediment sampling were provided by OAI (2013). 3
10 2.0 METHODS 2.1 Beach Fill Site Macrofauna Sampling Following a Before-After-Control-Impact study design (BACI), fifteen (15) locations were sampled along the project area shoreline and adjacent reference areas; station labels are referenced to the closest FDEP range monument (Figure 2). There are seven (7) control stations located outside of the project fill area. Five (5) control stations are sampled to the north of the beach renourishment project area: R-40, R-48, R-53, R-56 and R-58; and two control stations are located to the south of the beach fill area (southern control sites R-78 and R-79). Eight (8) impact stations are located within the beach nourishment project area (R-60, R-63, R-64, R-68, R-70, R-72, R-74 and AP-23. Detailed figures of the sampling locations were provided in the Immediate Post-Construction Report (CEG, 2013). A copy of this report is provided in Electronic Appendix I. The two southernmost control stations, R-78 and R-79, were originally anticipated in the approved monitoring plan as beach fill impact stations; however, sand was not placed south of R-77 during the 2011 project. Photographs of the beach fill impact and control sites are provided in Electronic Appendix II. The sampling dates for the pre-construction and post-construction monitoring events are provided in Table 1. Beach grab sampling was conducted within 1.5 hours of low tide; ghost crab transects were sampled within a 2-hr window around low tide. The protocol was modified during the Spring 2013 Year 2 monitoring to concentrate grab sampling at the four beach fill impact stations which had supported the highest densities of Donax spp. during the Spring 2011 baseline condition. These four stations, R-60, R-63, R-64, and R-72, had not recovered during the 8-month post-construction survey in Spring Four control stations were sampled for reference comparisons: R-40, R-48, R-53, and R-56. All fifteen stations were sampled for ghost crabs during the Spring 2013 monitoring. Table 1. Beach sampling events: Pre-Construction through Year 2 Spring 2013 Post-Construction. Beach Fill Impact Site and Control Site Sampling Schedule Pre-Construction Sampling Events November 26-28, 2010 May 4 & 6, 2011 Post-Construction Sampling Events November & 14, 2011 April 18-21, 2012 November 1, 2012 April 30 and May 1,

11 5 R-30 A1A River River AIRPORT A1A AMELIA ISLAND AISP H081 R081 H080 R-80 Nassau Amelia S. R-60 R-63 R-64 R-68 R-70 R-72 R-74 AP-23 SOUTH CONTROL SITES R-80 BEACH MACRO-INVERTEBRATE & GHOST CRAB SAMPLING LOCATIONS R-40 R-40 ATLANTIC OCEAN R-48 R-50 R-53 NORTH CONTROL SITES R-56 R-58 R-60 AMERICAN BEACH 2011 BEACH FILL LIMITS R-70 R-77 R-78 R-79 NASSAU SOUND
12 Transects At each beach sampling location, a 100-m survey tape was run along the dune line paralleling the water line. Along this 100-m station, five random locations were selected, from which five shore-perpendicular transects were laid out across the beach (Figure 3). The shoreperpendicular transects were 4-m wide, 2- m to either side of the survey tape and extended from the edge of dune vegetation across the beach to the upper intertidal zone. The number of active ghost crab burrows was counted within each 5-m (20 m 2 ) section. Locations of driving areas/tire tracks, wrack line deposits, and other anecdotal information (horse tracks, dog tracks) were noted within the 100-m stations. A 100-m survey tape was also run along the water s edge at each sampling location to facilitate macrofauna sampling in the swash zone. Grab samples were collected at the five random locations using a 1 mm mesh wire basket (ca. 23 cm x 13 cm x 20 cm) attached to a handle; this design allows for sampling a constant volume of sediment (Irlandi and Arnold, 2008). 100 meters Upper Beach Zone Middle Beach Zone 5 meter sections Upper Swash Zone Lower Swash Zone Figure 3. Layout of the ghost crab transects across the beach and beach macroinvertebrate sampling locations in the swash zone. Ghost crab transects are 4 m in width and spaced randomly along the 100-m shore parallel station. 6
13 Two samples were collected at each location, one each at the Upper and Lower swash zone, for a total of ten grabs per station (five upper replicate grabs and five lower replicate grabs), and an overall total of 150 samples for the entire study area (80 beach fill impact samples and 70 control site samples) during the Fall 2012 sampling and 40 samples in each treatment area during the Spring 2013 sampling. Samples were placed in fine mesh bags to facilitate draining of excess water or in labeled double-seal zippered plastic bags; samples were placed on ice in coolers and transported back to the laboratory. 2.2 Beach Fill Site Macrofauna Laboratory Analysis Sediment grab samples were retained on ice or stored in a refrigerator until sieving and preservation; all grab samples were sieved within one week following collection using a 1 mm mesh sieve. All material (sediment and organisms) retained on the 1 mm mesh sieve was placed in glass containers with 10% buffered formalin and Rose Bengal stain for a minimum of 48 hours. Following preservation, the remaining material was sorted, and all sorted organisms were stored in 70% alcohol for enumeration and measurements. Shell length and carapace length for Donax and Emerita were measured. Subsamples of 30 individuals were processed for size measurements when sample size exceeded Beach Fill Site Sediment Sampling and Laboratory Analysis Beach sediment cores were collected during the immediate pre-construction survey in April 2011 and post-construction surveys in November 2011, April 2012, November 2012, and April Sediment cores, 5 cm x 10 cm depth, were collected from the middle of the upper beach, mid lower beach and mid swash zone along one shore perpendicular transects. After visual inspection, sediment samples were placed in labeled double-seal zippered bags. Sediment samples were shipped to SEA, Inc., in Melbourne, FL, where they were analyzed for sediment grain size distribution, shell content (visual estimate), carbonate content, and percent silts/fines following standard ASTM procedures. 2.4 Beach Fill Site Statistical Analysis Beach fill impact and control stations were compared to identify any significant changes in abundance of O. quadrata burrows and abundance and size of Donax spp. and Emerita talpoida. Data were tested for normality and transformed as necessary to achieve normality assumptions. Densities of coquina clams (Donax spp.) and mole crabs (Emerita talpoida) were square root transformed to achieve normality; mean shell lengths of Donax spp. were log (x +1) transformed. Mean carapace lengths of E. talpoida were normally distributed and required no data transformation. Mean densities of O. quadrata burrows were not normally distributed and normality could not be achieved through transformation for all datasets. Therefore, nonparametric Kolmogorov-Smirnov two sample test or Kruskal-Wallis ANOVA was used to test for significant differences between the O. quadrata datasets. Beach fill impact and control stations were analyzed to detect the impact of beach fill placement on sediment characteristics and macrofauna indicator taxa using ANOVA and paired t-tests. 7
14 Sediment samples were first averaged across the upper, middle, and lower beach zones to test for significant differences between control and impact sites within each sampling event and then among the sampling events for control and impact stations individually. Mean silt content and mean grain size were all normally distributed across the datasets. Data were pooled across stations for both the impact and control sites to compare the upper, middle and lower beach zones. 8
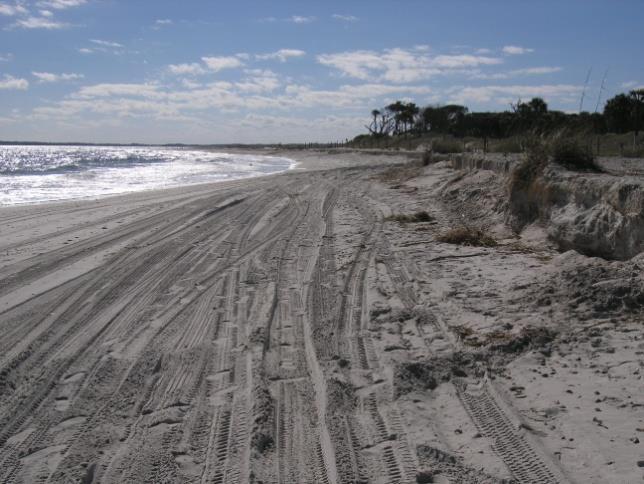
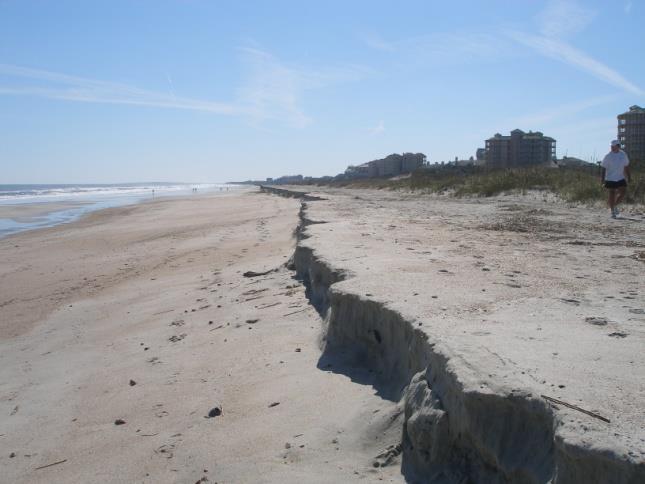
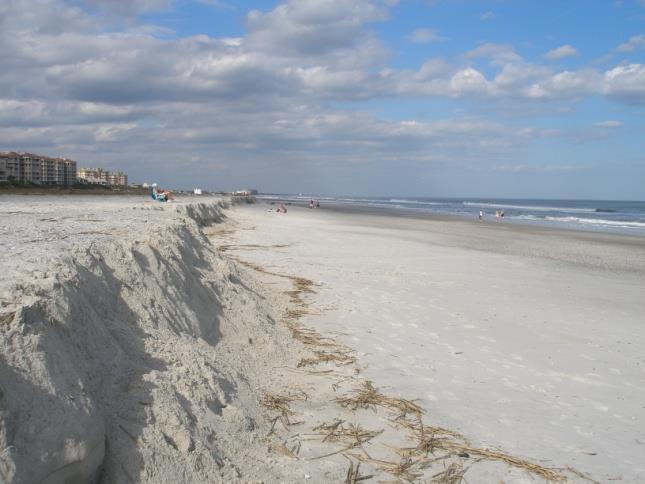
15 3.0 RESULTS 3.1 Ghost Crabs- Fall 2012 and Spring 2013 Post-Construction Surveys Total abundance of active ghost crab burrows at each station during all surveys is provided in Table 2. The immediate post-construction survey in Fall 2011 showed a nearly complete loss of ghost crab populations at the eight beach fill impact stations within the project area; only two active burrows were observed at R-60, the northernmost impact station, during the Fall 2011 Immediate post-construction survey. This decline in total abundance was not observed at the control stations. In Spring 2012, the number of active burrows increased to 9 at R-60; however, R-60 remained the only monitoring station at the project fill impact site area with active burrows. Recovery of ghost grab populations within the beach fill project area was documented during the Fall 2012 post-construction survey. Five of the eight monitoring sites were repopulated by ghost crabs, and abundances at R-60 and R-64 were higher than the Fall 2010 pre-construction survey. Although ghost grab populations remained depressed in Spring 2013 at the three beach fill impact stations which supported the highest abundances during the pre-construction surveys (R-70, R-72, and R-74), abundance at R-64 was higher than both pre-construction surveys, and abundance at R-68 was equal to the Spring 2011 pre-construction survey. Control stations exhibited a similar level of variability at the station level in comparison to the impact stations; variations in abundance and spring recruitment peaks are evident at Control Stations R-56, R-78 and R-79. Very low abundance or absence of ghost crab burrows was recorded at Beach Fill Impact Station AP-23, the southernmost station in the project fill area, throughout the monitoring program, including the pre-construction surveys. The dry beach width fronting the dune at AP-23 was very narrow during the pre-construction surveys due to shoreline erosion. Severe erosion following Hurricane Sandy was recorded in the vicinity of AP-23 during the Fall 2012 survey (Photo 1 and Electronic Appendix II- Photo Log). Station AP-23 is also located within a beach driving area at the base of the dunes, further limiting the amount of dry beach habitat at the edge of dune vegetation. Active burrows were confined to the dune line at the top of a major escarpment in this area during the Spring 2013 Year 2 post-construction survey. 9

.")
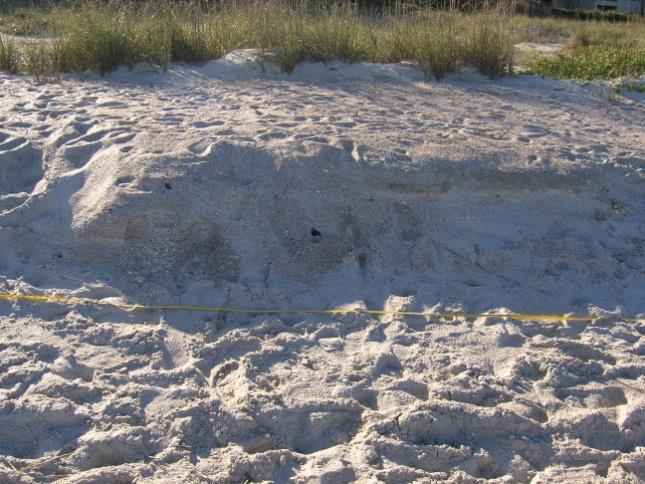
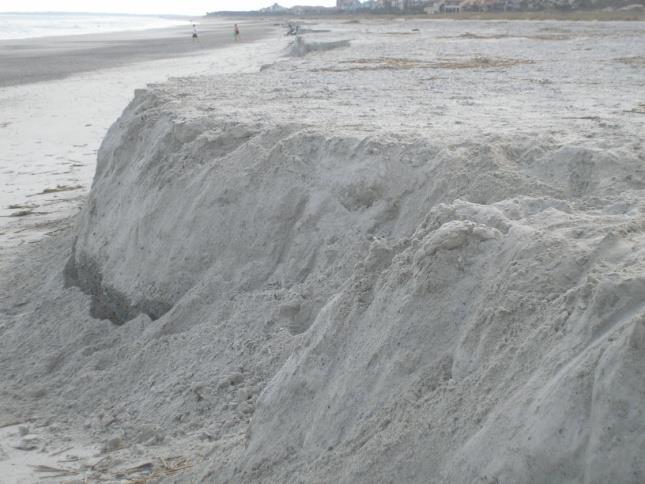
16 Photo 1. (L) Escarpment at edge of dune vegetation at Station AP-23, Fall (R) Driving area in Station AP-23 during the Spring 2011 pre-construction survey. The results of significance testing of active burrow abundance among all surveys, Fall 2010 preconstruction through Spring 2013 post-construction, are provided in Table 3. Overall mean density of active ghost crab burrows was higher at the control stations in comparison to the beach fill impact stations during the Fall 2012 and Spring 2013 post-construction surveys. This was consistent with the Immediate Post-Construction and 8-month Post-Construction surveys (Fall 2011 and Spring 2012). When comparing mean densities of active burrows among fall surveys at the beach fill impact stations, the Fall 2011 post-construction survey was significantly lower than the Fall 2010 preconstruction and Fall 2012 post-construction surveys, demonstrating the expected immediate burial effect of beach fill placement (Table 3). Mean density of active burrows was significantly higher in the upper beach zone during the Fall 2010 pre-construction survey in comparison to Fall 2011 and Fall 2012 post-construction surveys. The lower beach had a significantly higher overall mean density of active burrows in Fall 2012 compared to Fall 2011 (Table 4). No significant differences were found in overall mean density of active burrows at the control stations during the Fall 2010 pre-construction, Fall 2012 and Spring 2013 post-construction surveys (Table 3). When examining density at the two beach zones at the control stations, overall mean density was higher in the upper beach zone during fall surveys. There were no significant differences between beach zones during the spring surveys at the control stations (Table 4). Overall mean density of active ghost crab burrows was significantly lower at the control stations during the Spring 2012 post-construction survey than during the Spring 2013 Year 2 postconstruction survey (Table 3). 10
17 Table 2. Total abundance of ghost crab burrows at each station during all surveys. Impact Control Transect Fall Spring Fall Spring Fall Spring R R R R R R R AP R R R R R R R Table 3. Beach fill impact and control station comparisons of overall mean density of ghost crab (Ocypode quadrata) burrows, overall mean density of Donax spp., and overall mean density of mole crabs (Emerita talpoida). Red text indicates a significant difference (ANOVA p<0.05). CONTROL vs. IMPACT Fall 2010 Spring 2011 Fall 2011 Spring 2012 Fall 2012 Spring 2013 PRE vs. POST-CONSTRUCTION Ocypode quadrata Donax spp. Emerita talpoida p>0.05 p>0.05 p>0.05 p>0.05 p<0.05 p<0.05 p<0.05 p>0.05 p>0.05 p<0.05 p>0.05 p<0.05 p<0.05 p>0.05 p<0.05 p<0.05 p>0.05* NA Control Fall Event Comparisons p>0.05 p<0.05* p<0.05 Spring Event Comparisons p<0.05 p<0.05* p>0.05** Impact Fall Event Comparisons p<0.05 p<0.05* p<0.05 Spring Event Comparisons p<0.05 p<0.05* p>0.05** (*) indicates analysis on only the four selected beach fill impact and four control stations in (**) indicates analysis without Spring 2013 survey data. Note: Significant differences in E. talpoida are due to significantly higher densities during the post-construction surveys when compared to seasonally similar pre-construction surveys. 11
18 Table 4. Zone comparisons between beach fill impact and control stations: mean densities of ghost crab (O. quadrata) burrows, mean density of Donax spp., and mean densities of mole crabs (Emerita talpoida). Red text indicates a significant difference (ANOVA p<0.05). Control Impact Control UPPER vs. LOWER BEACH ZONE Ocypode quadrata UPPER vs. MIDDLE SWASH ZONE Donax spp. Emerita talpoida Fall 2010 p<0.05 Fall 2010 p>0.05 p>0.05 Spring 2011 p>0.05 Spring 2011 p>0.05 p>0.05 Fall 2011 p<0.05 Fall 2011 p>0.05 p>0.05 Spring 2012 p>0.05 Spring 2012 p>0.05 p>0.05 Fall 2012 p<0.05 Fall 2012 p>0.05 p>0.05 Spring 2013 p>0.05 Spring 2013 p<0.05* NA Fall 2010 p<0.05 Fall 2010 p>0.05 p>0.05 Spring 2011 p<0.05 Spring 2011 p>0.05 p<0.05 Fall 2011 p>0.05 Fall 2011 p>0.05 p>0.05 Spring 2012 p>0.05 Spring 2012 p>0.05 p>0.05 Fall 2012 p>0.05 Fall 2012 p>0.05 p>0.05 Spring 2013 p>0.05 Spring 2013 p>0.05* NA PRE vs. POST-CONSTRUCTION PRE vs. POST-CONSTRUCTION Fall Upper Beach Zone p>0.05 Fall Upper Swash Zone p<0.05* p<0.05** Fall Lower Beach Zone p>0.05 Fall Middle Swash Zone p<0.05* p<0.05** Spring Upper Beach Zone p>0.05 Spring Upper Swash Zone p<0.05* p>0.05 Spring Lower Beach Zone p>0.05 Spring Middle Swash Zone p<0.05* p>0.05 Fall Upper Beach Zone p<0.05 Fall Upper Swash Zone p<0.05* p<0.05** Impact Fall Lower Beach Zone p<0.05 Fall Middle Swash Zone p<0.05* p<0.05** Spring Upper Beach Zone p<0.05 Spring Upper Swash Zone p<0.05* p>0.05 Spring Lower Beach Zone p>0.05 Spring Middle Swash Zone p<0.05* p>0.05 (*) indicates analysis on only the four selected beach fill impact and four control stations in (**) indicates analysis without Spring 2013 survey data. Significant differences in mean densities of active ghost crab burrows were found at four of the eight beach fill impact stations and one control station over the course of the monitoring program; higher mean densities were found during the pre-construction surveys at Beach Fill Impact Stations R-68, R-72, and R-74. R-68 had significantly higher mean densities of active burrows during the Fall 2010 pre-construction survey than the Fall 2011 and Spring 2012 postconstruction surveys. R-72 had significantly higher mean densities of burrows during the Fall 2010 pre-construction survey in comparison to all post-construction surveys, and R-74 had significantly higher mean densities during the Fall 2010 and Spring 2011 pre-construction surveys in comparison to all post-construction surveys. In contrast to these findings, Beach Fill Impact Station R-63 had significantly higher mean densities of active burrows during the Fall 2012 post-construction than the Spring 2011 pre-construction, Fall 2011 post-construction, and Spring 2012 post-construction surveys. R-79 was the only control station where a significant difference was found among surveys: the Spring 2011 pre-construction and Fall 2011 post- 12
19 construction surveys had significantly lower mean densities of ghost crab burrows in comparison to all other surveys. 3.2 Coquina Clams Fall 2012 and Spring 2013 Post-Construction Surveys Significant differences in Donax spp. abundance were not found between the beach fill impact stations and control stations during both the Fall 2012 and Spring 2013 post-construction surveys (Table 3). When comparing all fall surveys, significantly higher mean densities of Donax spp. were found during the Fall 2012 post-construction survey at the beach fill impact and control sites. At the beach fill impact stations, overall mean densities of Donax spp. were significantly lower during the Spring 2012 survey. At the control stations, mean densities of Donax spp. were significantly different among all spring surveys; and the highest overall mean density was Spring Overall abundances of Donax spp. at the eight stations sampled in Spring 2013 are provided in Table 5. When evaluating populations at the four beach fill impact stations which had supported the highest density of Donax spp. during the Spring 2011 pre-construction survey, the Spring 2011 pre-construction and Spring 2013 post-construction surveys had the highest mean densities at all four stations. During the Spring 2013 post-construction survey, mean densities of Donax spp. were significantly higher than all other surveys at Stations R-60 and R-63. At the four control stations, overall mean densities of Donax spp. were significantly higher during the Spring 2012, Fall 2012, and Spring 2013 post-construction surveys than the three preceding surveys (Fall 2010 pre-construction, Spring 2011 pre-construction, and Fall 2011 post-construction). Total abundance of Donax spp. was significantly higher at each of the four control stations in Spring 2013 than all other surveys. Comparisons of mean densities (no. of individuals/m 2 ) of Donax spp. between the upper and middle sections of the swash zone showed no significant difference during the Fall 2012 postconstruction survey across the beach fill impact and control stations. This was consistent with all other previous pre-construction and post-construction surveys (Table 6). A significant difference between the upper and middle swash zone was not found at the beach fill impact stations in Spring At the control stations, overall mean density of Donax spp. was higher in the middle swash zone. Mean densities were significantly higher in the upper swash zone during the Fall 2012 postconstruction survey than the Fall 2010 pre-construction and Fall 2011 post-construction surveys. These significant differences were also found in the middle swash zone at the beach fill impact and control stations. When comparing mean densities of Donax spp. at the beach fill impact sites across the spring surveys, both the upper and middle swash zones had significantly greater mean densities during the Spring 2013 post-construction survey. At the Control stations, mean density of Donax spp. was significantly higher during both the Spring 2012 and Spring 2013 post-construction surveys in comparison to Spring
20 During both the Fall 2012 and Spring 2013 post-construction surveys, overall mean shell lengths were not significantly different between the Beach Fill Impact site and Control site (Table 7). This was consistent with all previous survey comparisons (CEG, 2013). No significant differences were found in mean shell length when comparing all fall surveys, pre-construction through 15-month post-construction in Fall Comparing spring surveys at the beach fill impact stations, overall mean shell length was significantly smaller during the Spring 2012 postconstruction survey compared to Spring 2011 pre-construction and Spring 2013 postconstruction. Table 5. Total abundance of Donax spp. at the 2013 beach fill impact and control stations during each survey. Fall 2010 Spring 2011 Fall 2011 Spring 2012 Fall 2012 Spring 2013 Impact Stations R R R R Control Stations R R R R
21 Table 6. Mean densities (no. individuals/m 2 )[± standard error (SE)] of Donax spp. in the upper and middle swash zones at each station during each survey. Impact Control Station R-60 R-63 R-64 R-68 R-70 R-72 R-74 AP-23 R-40 R-48 R-53 R-56 R-58 R-78 R-79 Swash Zone Fall 2010 Spring 2011 Fall 2011 Spring 2012 Fall 2012 Spring 2013 Upper 1,137 ± ,204 ± 15,866 1,037 ± 917 4,348 ± 1,445 11,070 ± 3,962 88,261 ± 18,741 Middle 0 ± 0 13,913 ± 5,258 1,271 ± 618 4,348 ± 632 7,291 ± 1,262 57,492 ± 8,933 Upper 0 ± 0 83,211 ± 9, ± 215 2,809 ± ,174 ± 1,672 29,766 ± 4,234 Middle 0 ± 0 68,829 ± 10, ± 123 4,849 ± 1,605 15,619 ± 2,017 50,635 ± 14,223 Upper 67 ± 67 5,719 ± 4, ± 33 1,472 ± 622 4,816 ± ,923 ± 3,215 Middle 67 ± 41 19,398 ± 6, ± 98 12,676 ± 4,097 3,645 ± ,488 ± 3,568 Upper 0 ± 0 1,104 ± ± ± ± 316 Not Sampled Middle 33 ± ± ± 0 3,645 ± 1, ± 202 Not Sampled Upper 0 ± 0 3,144 ± 1,212 0 ± ± ± 134 Not Sampled Middle 33 ± 33 4,214 ± 1, ± 33 1,739 ± ± 175 Not Sampled Upper 67 ± 67 7,860 ± 2, ± ± ± 33 2,040 ± 597 Middle 33 ± 33 2,2642 ± 5,587 0 ± 0 2,943 ± ± 33 14,114 ± 1,778 Upper 67 ± ± 98 0 ± ± ± 67 Not Sampled Middle 67 ± 41 1,639 ± ± 33 2,040 ± ± 195 Not Sampled Upper 0 ± 0 1,137 ± ± ± 251 1,472 ± 179 Not Sampled Middle 33 ± 33 2,007 ± ± ± ± 41 Not Sampled Upper 368 ± ± ± 85 2,425 ± 646 3,411 ± ,957 ± 8,522 Middle 468 ± ± ± 208 4,794 ± 887 2,542 ± 1,152 51,873 ± 8,908 Upper 134 ± ± ± 202 7,023 ± 2,233 8,963 ± 2,602 9,766 ± 3,242 Middle 268 ± ± ± 98 11,070 ± 1,960 7,726 ± 1,758 30,669 ± 3,078 Upper 736 ± ± ± 75 2,475 ± 613 7,492 ± 2,099 20,870 ± 7,040 Middle 234 ± ± ± 33 6,120 ± 1,445 13,679 ± 3,560 36,488 ± 9,299 Upper 0 ± ± ± 0 12,742 ± 4,142 11,271 ± 4,914 28,629 ± 4,162 Middle 33 ± ± 98 0 ± 0 13,211 ± 2,723 13,679 ± 3,538 68,328 ± 16,633 Upper 0 ± ± 41 0 ± 0 5,217 ± 1,529 18,595 ± 6,416 Not Sampled Middle 0 ± 0 33 ± 33 0 ± 0 7,458 ± 2,385 9,298 ± 3,561 Not Sampled Upper 33 ± 33 0 ± 0 28 ± ± ± 33 Not Sampled Middle 0 ± 0 67 ± 41 0 ± ± ± 98 Not Sampled Upper 33 ± 33 0 ± 0 0 ± 0 1,505 ± ± 113 Not Sampled Middle 33 ± ± 33 0 ± 0 1,940 ± ± 41 Not Sampled 15
22 Table 7. Beach fill impact station and control station comparisons of mean shell length (Donax spp.) and mean carapace length (Emerita talpoida). Red text indicates a significant difference (ANOVA p<0.05). CONTROL vs. IMPACT Fall 2010 Spring 2011 Fall 2011 Spring 2012 Fall 2012 Spring 2013 PRE vs. POST-CONSTRUCTION Mean Shell Length Donax spp. p>0.05 p>0.05 p>0.05 p>0.05 p>0.05 p>0.05* Mean Carapace Length Emerita talpoida p>0.05 p>0.05 p>0.05 p>0.05 p>0.05 NA Control Fall Event Comparisons p>0.05* p>0.05 Spring Event Comparisons p>0.05* p>0.05** Impact Fall Event Comparisons p>0.05* p<0.05 Spring Event Comparisons p<0.05* p>0.05** (*) indicates analysis performed only for 8 stations sampled in 2013 (**) no Spring 2013 data. 3.3 Mole Crabs - Fall 2012 Post-Construction Survey Impacts to mole crab (E. talpoida) abundance were not detected in the pre-construction to 8- month immediate post-construction evaluation (CEG, 2013). Overall abundance was higher at both the impact and control sites during the Fall 2011 and Spring 2012 post-construction surveys in comparison to the Fall 2010 and Spring 2011 pre-construction surveys. Overall abundance of mole crabs was highest during the Spring 2012 post-construction survey at both the control and impact stations. The Fall 2012 mole crab data are presented below to demonstrate variability in these populations during the fall months (Table 8). Overall abundance of mole crabs was higher at both the beach fill impact and control sites in Fall 2012 in comparison to Fall 2010 and Fall When comparing all fall surveys, the Fall 2011 and Fall 2012 post-construction surveys had significantly higher mean densities in comparison to the Fall 2010 pre-construction survey at the beach fill impact stations (Table 3). At the control stations, overall mean density was significantly higher during the Fall 2012 post-construction survey in comparison to the preconstruction and immediate post-construction fall surveys. 16
23 Table 8. Total abundance of mole crabs (E. talpoida) at each station during all surveys. Impact Control Station Fall Spring Fall Spring Fall R R R R R R R AP R R R R R R R Comparisons between the upper and middle sections of the swash zone during the Fall 2012 post-construction survey at the beach fill impact stations and control stations showed no significant differences in overall mean density between the areas (Table 4). This is consistent with both the Fall 2011 and Spring 2012 post-construction surveys (CEG, 2013). The Fall 2012 survey showed significantly higher mean densities in both beach zones at the control stations. At the beach fill impact stations, the upper swash zone had significantly higher mean densities during the Fall 2012 post-construction survey, and the Middle swash zone had significantly higher mean densities during both fall post-construction surveys. Mean densities of E. talpoida at each station/zone during all surveys are presented in Table 9. Significant differences at the individual control stations level showed seasonal differences with higher mean densities more frequently observed during spring surveys during peak recruitment periods for E. talpoida. Only two of the beach fill impact stations, R-68 and AP-23, showed significant differences among surveys. Station R-68 had a significant increase in overall mean density of E. talpoida when comparing Fall 2010 pre-construction to Fall 2012 post-construction. Mean density was significantly highest at Station AP-23 in Spring
24 Table 9. Mean densities (no. individuals/m 2 ) [± standard error (SE)] of E. talpoida in the upper and middle swash zone at each station during each survey. Station Beach Zone Fall 2010 Spring 2011 Fall 2011 Spring 2012 Fall 2012 R-60 R-63 R-64 R-68 R-70 R-72 R-74 AP-23 R-40 R-48 R-53 R-56 R-58 R-78 R-79 Upper Upper Upper Upper Upper Upper Upper Upper Upper Upper Upper Upper Upper Upper Upper 67 ± ± ± ± ± ± 41 0 ± ± ± ± 33 0 ± ± ± ± 0 67 ± ± ± ± ± ± 33 0 ± ± ± 100 4,314 ± ,706 ± 511 1,438 ± ± 33 1,271 ± ± ± ± ± ± ± ± ± ± ± 33 0 ± ± 75 0 ± 0 67 ± ± ± ± 134 2,074 ± ± ± ± ± ± ± 100 1,806 ± 597 2,285 ± 637 1,505 ± 818 1,940 ± ,070 ± 240 2,776 ± 891 1,605 ± ± ± ± ± ± ± ± ± ± ± ± 228 1,238 ± ± ± ± ± 155 Middle Middle Middle Middle Middle Middle Middle Middle Middle Middle Middle Middle Middle Middle Middle 0 ± ± ± 67 0 ± ± ± ± 41 0 ± ± ± ± ± 125 1,104 ± ± ± 33 1,137 ± ± ± ± ± ± ± ± 41 3,947 ± ± 356 1,137 ± ± 0 1,472 ± ± ± ± ± ± ± ± ± ± ± ± ± ± ± ± ± 56 0 ± 0 1,104 ± ± ± ± ± ± ± 98 2,107 ± 546 1,338 ± 430 1,003 ± 426 1,371 ± 530 1,773 ± 209 2,743 ± ,207 ± ± ± ± ± ± ± ± ± ± ± ± ± ± ± ± ± 134 Impact Control 18
25 No significant difference in mean carapace lengths of E. talpoida was found between the beach fill impact and control stations during the Fall 2012 survey. These results were consistent with all other pre- and post-construction surveys. When comparing mean carapace lengths at the beach fill impact stations across the surveys grouped by season, the only significant difference was among the fall surveys (Table 7). The beach fill impact stations showed significantly smaller carapace lengths during the Fall 2011 post-construction survey than the Fall 2010 preconstruction and Fall 2012 post-construction surveys. No significant difference was found between spring surveys at the impact stations, and no significant differences were found at the control stations when comparing mean carapace lengths across all fall and spring surveys. 3.4 Sediment Characteristics As previously reported (CEG, 2013), there were no significant differences detected in mean percent silt/clay content, mean grain size or mean carbonate content when comparing the beach fill impact and control sites during the Spring 2011 pre-construction, Fall 2011 immediate postconstruction and Spring 2012 post-construction surveys. Surface sediment samples from the 15 beach stations during the Spring 2013 Year 2 survey were analyzed for percent silt/fine content and mean grain size. The only significant differences detected among all survey comparisons were significantly lower mean silt/fine content in Spring 2013 at both the control and impact sites. Silt/clay content at the individual stations did not exceed 1.0% in Spring 2013; the highest silt/clay content at the control sites was 0.58%, and the highest measurement at the beach fill impact sites was 0.92%. Overall mean grain size did not show any significant differences between the control and impact sites (Table 10). Comparisons between surveys within each beach zone showed a significantly smaller mean grain size at the lower beach zone at both the impact and control sites during the Spring 2011 pre-construction survey in comparison to the Fall 2011 and Spring 2013 postconstruction surveys (Table 11). 19
26 Table 10. Mean grain size (phi) [± standard error (SE)] at the control and impact sites during each survey. No significant differences were found among surveys. Control Impact Survey Mean Grain Size (phi) ± SE Spring ± 0.2 Fall ± 0.1 Spring ± 0.1 Spring ± 0.1 Spring ± 0.1 Fall ± 0.1 Spring ± 0.1 Spring ± 0.1 Table 11. Mean grain size (phi) ±SE) at the three beach zones at the control and impact sites during each survey. Beach Zone Upper Middle Lower Treatment Control Impact Control Impact Control Impact Survey Mean Grain Size (phi) ± SE Spring ± 0.3 Fall ± 0.1 Spring ± 0.2 Spring ± 0.2 Spring ± 0.1 Fall ± 0.2 Spring ± 0.2 Spring ± 0.2 Spring ± 0.3 Fall ± 0.2 Spring ± 0.2 Spring ± 0.2 Spring ± 0.2 Fall ± 0.2 Spring ± 0.2 Spring ± 0.1 Spring ± 0.2 Fall ± 0.1 Spring ± 0.2 Spring ± 0.3 Spring ± 0.1 Fall ± 0.2 Spring ± 0.2 Spring ±
27 4.0 DISCUSSION There was a clear signal from the 2011 Amelia Island Beach Nourishment Project in the ghost crab population data following project construction. The Fall 2011 immediate post-construction survey showed a nearly complete loss of the ghost crab burrows at the eight beach fill impact stations within the project fill area; only two active burrows were observed at R-60, the northernmost beach fill impact station. This decline in total abundance was not observed at the control stations. Eight months post-construction in Spring 2012, Station R-60 was also the only station in the project fill area where active burrows were recorded. Repopulation of the beach fill area by ghost crabs was documented during the Fall 2012 survey. The number of active burrows increased at five beach fill impact stations; however, these increases were not significant, and three of the five stations had less than 10 active burrows. Although overall abundances remained much lower at the beach fill impact stations in comparison to the control stations, the number of active burrows at Beach Fill Impact Stations R- 60 and R-64 was higher in Fall 2012 (Year 1 post-construction) than Fall 2010 (pre-construction baseline). The lower beach zone had a significantly higher overall mean density of active burrows in Fall 2012 compared to Fall 2011, suggesting that ghost crab recruits were colonizing the lower portion of the beach following nourishment. Younger individuals tend to be distributed in the lower beach near the intertidal zone while adults dig their burrows higher up on the beach near the dune line. Although burrow diameter was not measured during this study, there was a clear distinction in burrow size between beach zones during the surveys; larger adult burrows were found in the upper beach zone while recruits/juveniles were more common near the high tide line. Ghost grab populations at the three southern impact stations which had supported the highest abundances during the pre-construction surveys, R-70, R-72, and R-74, remained depressed during the Spring 2013 Year 2 post-construction survey. The control and beach fill impact sites exhibited similar levels of variability at the station level; variations in abundance and spring recruitment peaks are evident at the control stations during the three survey years. Ghost crab habitat at the north control transects is influenced by beach driving activity and dog predation of ghost crabs while the southern control transects are located within an area heavily traversed by horseback riders. There were no active burrows observed at Control Station R-58 in Spring The southernmost control station, R-79, had significantly lower abundance in Spring 2011 and Fall 2011 in comparison to all other surveys; and abundance in Spring 2013 was less than 50% of the Fall 2010 pre-construction abundance, demonstrating a high level of variability at the control sites adjacent to the project area. The Fall 2010 pre-construction survey detected very low abundances of Donax spp. within the study area while the Spring 2011 immediate pre-construction survey captured a high recruitment year at the beach fill impact sites. Immediately prior to the beach nourishment project in Spring 2011, mean densities were significantly higher along portions of the beach fill impact area (R-63 21
28 through R-68 and at R-74). As expected, substantial declines in abundance were recorded at the beach fill impact stations during the Fall 2011 immediate post-construction survey. Populations remained low at 8 months following construction; however, a few stations exhibited recovery to Spring 2011 levels. Impacts to Donax spp. populations were detected at four stations in the project fill area during the Spring 2012 post-construction survey (CEG, 2013). The protocol was modified during the Year 2 Spring 2013 survey to concentrate sampling at these four stations which supported the highest abundances of Donax spp. during the Spring 2011 pre-construction survey. These stations included Beach Fill Compliance Sites R-60, R-63, R-64, and R-72, and four northern control sites (R-40, R-48, R-53, and R-56). The Spring 2013 survey shows repopulation of Donax spp. at these four stations; the increases in abundances were significant when pooled by season as well as at the station level. Mean densities of Donax spp. in Spring 2013 were significantly higher than all pre-construction and post-construction surveys at Beach Fill Impact Stations R-60 and R-64 and higher than all preceding post-construction surveys at Beach Fill Impact Stations R-63 and R-72. Significant increases in Donax abundance were recorded at the control stations from Fall 2012 to Spring 2013, indicating a high recruitment year throughout the study area. No significant differences in mean shell length were found between the impact and control sites during any of the surveys. When comparing surveys by season, the only significant difference at the beach fill impact stations was among the spring surveys. Mean shell lengths of Donax spp. during the Spring 2012 post-construction survey were significantly smaller than Spring 2011 preconstruction and Spring 2013 post-construction, suggesting recruitment of new individuals. There were no significant differences detected in overall mean percent silt/clay content, mean grain size or mean carbonate content when comparing the beach fill impact and control sites during the Spring 2011 pre-construction, Fall 2011 immediate post-construction, and Spring 2012 post-construction surveys, indicating that nourishment did not change the general sediment characteristics of the beach. The only significant differences detected when comparing all surveys and treatments was significantly lower mean percent silt/fines content at both the control and impact sites during the Spring 2013 survey in comparison to all other surveys, and significantly larger mean grain size at the impact and control sites during the Fall 2011 and Spring 2013 post-construction surveys in comparison to the Spring 2011 pre-construction survey. 22
29 5.0 CONCLUSIONS A softbottom macroinvertebrate monitoring program was implemented for the 2011 South Amelia Island Beach Nourishment project in consultation with the NMFS. The beach monitoring program consisted of fifteen onshore stations (seven control and eight impact stations) to evaluate the effects of beach fill placement on three beach macroinvertebrate indicator species: ghost crabs, coquina clams, and mole crabs. The indicator approach allowed for two sampling events/year (late spring and late fall to capture peak recruitment periods) and a higher density of sampling locations along the shoreline (both impact and control) in comparison to the more time-intensive coring method. Surveys were conducted as follows: o Fall month pre-construction o Spring 2011 immediate pre-construction o Fall 2011 immediate (3-month) post-construction o Spring month post-construction o Fall month post-construction o Spring month post-construction The monitoring protocol at the beach nourishment site required post-construction sampling through Fall 2012 [Year 1 (15 months) post-construction]. If the Year 1 post-construction results indicated recovery of the three indicator species, all or portions of the monitoring protocol could be discontinued in consultation with NMFS. If recovery of only one or two species was documented during the Year 1 (15 month) post-construction survey, a Year 2 sampling program was required based upon the species which did not recover in Year 1. Mole Crabs Impacts to mole crab abundance were not detected in the pre-construction to 8- month immediate post-construction evaluation (CEG, 2013). Overall abundance was higher at both the impact and control sites during the Fall 2011 and Spring 2012 post-construction surveys in comparison to the Fall 2010 and Spring 2011 pre-construction surveys. Because impacts to mole crab populations were not detected during the Spring month post-construction survey, grab samples were not evaluated for mole crab abundance in Spring 2013 pursuant to the requirements of the authorized Biological Monitoring Plan. Coquina Clams The sampling protocol was modified during the Year 2 Spring 2013 post-construction survey to concentrate samples at the four impact stations in the beach fill area which did not recover to the Spring 2011 baseline condition during the Year 1 Spring 2012 survey. These sites included Beach Fill Compliance Sites R-60, R-63, R-64, and R-72, and four northern control sites (R-40, R-48, R-53, and R-56). The Spring 2013 survey shows recovery of Donax populations at these 23
30 four stations in the beach project area; the increases were significant when pooled by season as well as at the station level. Based on recovery of Donax spp. populations in the beach nourishment project area at two years after project construction, no further sampling is required by U.S. Army Corps of Engineers Permit No. SAJ or the authorized Biological Monitoring Plan. Ghost Crabs All fifteen stations were surveyed for active ghost crab burrows in Spring Although ghost grab populations remained depressed at three southernmost stations which had supported the highest densities of ghost crabs during the pre-construction surveys, the control stations exhibited a similar level of variability in abundance at the individual station level in comparison to the impact stations. The Fall 2012 and Spring 2013 survey data suggest that ghost crabs are re-populating the beach nourishment project area through a combination of migration of adults from adjacent beaches to the north as well as recruitment of new individuals. Ghost crabs are scavengers and predators, feeding upon coquina clams and mole crabs on oceanfront beaches. Given the recovery of the food base for ghost crabs in the beach nourishment area and repopulation of the northern half of the project area, continued migration of adults and new recruits are expected within the southern half of the project area. Very low abundance of active burrows was recorded at the southernmost beach fill impact station near AP-23 during the monitoring period due to severe shoreline erosion. The lack of dry beach habitat during most of the monitoring period likely served as an impediment to immigration of adult crabs into the project area from the southern control beaches. Following the Spring 2013 sampling for the current study, the stretch of beach between AP-23 southward along AISP to approximately R-77 was nourished by the U.S Army Corps of Engineers (USACE). The project entailed maintenance dredging of the Atlantic Intracoastal Waterway (west of the Nassau Sound Bridge) and placement of approximately 580,000 cy of fine sand along 1,500 to 2,000 ft. of shoreline between July and November Since the control stations to the south of the 2011 beach nourishment project area have been directly affected by this project, continued monitoring of the three southernmost monitoring stations in the 2011 project fill area is not recommended. Based on the Spring 2013 ghost crab monitoring data and recovery of the food base for ghost crabs in the project area, additional sampling for ghost crab populations in Year 3 is not required by USACE Permit No. SAJ or the authorized Biological Monitoring Plan. 24
31 6.0 REFERENCES Coastal Eco Group, Inc. (CEG) South Amelia Island Beach Renourishment Project Pre-Construction vs. Immediate (8 months) Post-Construction Report. Prepared for Olsen Associates, Inc. Jacksonville, FL. Deerfield Beach, FL. Irlandi, E., and W. Arnold Assessment of impacts to beach habitat indicator species. Final Report for Florida Fish and Wildlife Commission, Grant Agreement No Peterson, C.H., D.H.M. Hickerson and G.G. Johnson Short-term consequences of nourishment and bulldozing on the dominant large invertebrates of a sandy beach. Journal of Coastal Research, 16:
32 ELECTRONIC APPENDIX II PHOTOGRAPHIC LOG - BEACH MONITORING STATIONS


33 Images from the beach fill impact stations during the Fall pre-construction sampling event (November 2010). AP-23 IMPACT AP-23 IMPACT AP-23 IMPACT R-60 IMPACT R-63 IMPACT R-63 IMPACT 1


.")

34 Images from the beach fill impact stations and Control Station R-48 during the Fall preconstruction sampling event (November 2010). R-64 IMPACT R-68 IMPACT R-70 IMPACT R-72 IMPACT R-74 IMPACT R-48 CONTROL 2


.")

35 Images from the beach fill control stations during the Fall pre-construction sampling event (November 2010). R-48 CONTROL R-53 CONTROL R-56 CONTROL R-58 CONTROL R-78 CONTROL R-78 CONTROL 3


36 Images from the beach fill control stations during the Fall pre-construction sampling event (November 2010). R-78 CONTROL R-79 CONTROL R-79 CONTROL R-79 CONTROL 4


37 Images from the beach fill impact stations during the Spring pre-construction sampling event (April 2011). AP-23 IMPACT AP-23 IMPACT AP-23 IMPACT R-63 IMPACT R-63 IMPACT R-72 IMPACT 5


.")

38 Images from the Beach fill Impact Station R-72 and control stations during the Spring preconstruction sampling event (April 2011). R-72 IMPACT R-40 CONTROL R-40 CONTROL R-48 CONTROL R-56 CONTROL 6


39 Images of the beach fill impact stations during the Fall post-construction sampling event (November 2011). AP-23 IMPACT AP-23 IMPACT R-60 IMPACT R-60 IMPACT R-63 IMPACT R-63 IMPACT 7


40 Images of the beach fill impact stations during the Fall post-construction sampling event (November 2011). R-64 IMPACT R-64 IMPACT R-70 IMPACT R-70 IMPACT R-72 IMPACT R-72 IMPACT. 8


41 Images of Beach Fill Impact Station R-74 and control stations during the Fall post-construction sampling event (November 2011). R-74 IMPACT R-74 IMPACT R-48 CONTROL R-53 CONTROL R-56 CONTROL R-58 CONTROL 9


.")
42 Images of the Beach Fill Control Station R-78 during the Fall post-construction sampling event (November 2011). R-78 CONTROL R-78 CONTROL R-78 CONTROL 10


43 Images of the beach fill impact stations during the Spring post-construction sampling event (April 2012). AP-23 IMPACT AP-23 IMPACT R-60 IMPACT R-63 IMPACT R-63 IMPACT R-64 IMPACT 11


44 Images of the beach fill impact stations during the Spring post-construction sampling event (April 2012). R-68 IMPACT R-68 IMPACT R-72 IMPACT R-72 IMPACT R-72 IMPACT R-74 IMPACT 12


.")


45 Images of the Beach Fill Impact Station R-74 and control stations during the spring postconstruction sampling event (April 2012). R-74 IMPACT R-40 CONTROL R-53 CONTROL R-58 CONTROL R-79 CONTROL R-79 CONTROL 13


46 Images from the beach fill impact stations during the Fall post-construction sampling event (November 2012). AP - 23 IMPACT AP -23 IMPACT AP - 23 IMPACT R- 60 IMPACT R- 64 IMPACT R- 64 IMPACT 14


47 Images from the beach fill impact stations during the Fall post-construction sampling event (November 2012). R - 68 IMPACT R -68 IMPACT R - 70 IMPACT R -70 IMPACT R - 72 IMPACT R -72 IMPACT 15


.")


48 Images from the Beach Fill Impact Station R-74 and control stations during the Fall postconstruction sampling event (November 2012). R- 74 IMPACT R- 74 IMPACT R- 40 CONTROL R- 40 CONTROL R- 48 CONTROL R- 48 CONTROL 16


49 Images from the beach fill control stations during the Fall post-construction sampling event (November 2012). R- 53 CONTROL R- 53 CONTROL R- 56 CONTROL R- 56 CONTROL R- 58 CONTROL R- 58 CONTROL 17


.")

50 Images from the beach fill control stations and south of Beach Fill Impact Station AP-23 during the Fall post-construction sampling event (November 2012). R- 78 CONTROL R- 78 CONTROL R- 78 CONTROL AP- 23 SOUTH AP - 23 SOUTH AP- 23 SOUTH 18


.")

51 Images from the beach fill impact stations during the Spring post-construction sampling event (May 2013). AP - 23 IMPACT AP -23 IMPACT AP - 23 IMPACT R- 60 IMPACT R- 63 IMPACT R- 63 IMPACT 19


.")

52 Images from the beach fill impact stations during the Spring post-construction sampling event (May 2013). R- 64 IMPACT R- 64 IMPACT R- 68 IMPACT R- 68 IMPACT R- 70 IMPACT R- 70 IMPACT 20


53 Images from the beach fill impact station and Control Station R-58 during the Spring postconstruction sampling event (May 2013). R -72 IMPACT R - 72 IMPACT R -74 IMPACT R - 74 IMPACT R -58 CONTROL R-58 CONTROL 21
KEYNOTE PRESENTATION FSBPA olsen
 AMELIA ISAND, FLORIDA BEACH MANAGEMENT PARTNERING AND PERSERVERENCE Erik Olsen, PE associates, inc. KEYNOTE PRESENTATION FSBPA 2009 IN ORDER TO ADDRESS SHORE PROTECTION TODAY LOCAL INTERESTS PARTNER WITH:
Protecting our Beaches
 Protecting our Beaches South Amelia Island Shore Stabilization Project Nassau County, FL Mr. Drew Wallace President South Amelia Island Shore Stabilization Association (SAISSA) Mr. Bill Moore, AICP Project
Volume and Shoreline Changes along Pinellas County Beaches during Tropical Storm Debby
 Volume and Shoreline Changes along Pinellas County Beaches during Tropical Storm Debby Ping Wang and Tiffany M. Roberts Coastal Research Laboratory University of South Florida July 24, 2012 Introduction
FINAL ENVIRONMENTAL IMPACT STATEMENT ON BROWARD COUNTY SHORE PROTECTION PROJECT SEGMENTS II AND III BROWARD COUNTY, FLORIDA
 FINAL ENVIRONMENTAL IMPACT STATEMENT ON BROWARD COUNTY SHORE PROTECTION PROJECT SEGMENTS II AND III BROWARD COUNTY, FLORIDA 1. PROJECT PURPOSE AND NEED 1.1. PROJECT AUTHORITY. 1.1.1. INITIAL AUTHORIZATION.
Long Term Success and Future Approach of the Captiva and Sanibel Islands Beach Renourishment Program
 2017 National Conference on Beach Preservation Technology February 8-10, 2017; Stuart, Florida Long Term Success and Future Approach of the Captiva and Sanibel Islands Beach Renourishment Program Thomas
Inlet Management Study for Pass-A-Grille and Bunces Pass, Pinellas County, Florida
 Inlet Management Study for Pass-A-Grille and Bunces Pass, Pinellas County, Florida Final Report Submitted By Ping Wang, Ph.D., Jun Cheng Ph.D., Zachary Westfall, and Mathieu Vallee Coastal Research Laboratory
Beach Nourishment Impact on Beach Safety and Surfing in the North Reach of Brevard County, Florida
 Beach Nourishment Impact on Beach Safety and Surfing in the North Reach of Brevard County, Florida Prepared by John Hearin, Ph.D. Coastal Engineering Vice Chairman Cocoa Beach Chapter Port Canaveral Patrick
Beach Renourishment in Jacksonville
 Beach Renourishment in Jacksonville Kevin Bodge, PhD, P.E. - Olsen Associates, Inc. 1978 Oct 2004 2000 2016 2011 Oct 2016 Coastal Duval County, FL Nassau Sound Blount Island Ft. George Inlet St. Johns
Regular Workshop October 20, 2014 Agenda Item: Dr. Albert E. Browder, PE; Olsen Associates, Inc.
 Regular Workshop October 20, 2014 Agenda Item 8 Agenda Item: Presenter: Summary: Beach Update Town Manager; Dr. Albert E. Browder, PE; Olsen Associates, Inc. At the January 21, 2014 Regular Workshop Meeting,
Performance of Upham Beach T-Groin Project and Its Impact to the Downdrift Beach
 Performance of Upham Beach T-Groin Project and Its Impact to the Downdrift Beach Progress Report for the Period of October 2008 to April 2009 Submitted by Ping Wang, Ph.D., and Tiffany M. Roberts Department
Table 4. Volumetric Change Rates Pre-Project and Post-Project for the Town of Duck
 V. VOLUMETRIC CHANGES General Volumetric changes measured over the entire monitoring area for various time periods are provided in Table 4. The volume changes are given in terms of cubic yards/foot of
Results of a Suspended Solids Survey at the Whites Point Quarry, Little River, Digby County, Nova Scotia
 Results of a Suspended Solids Survey at the Whites Point Quarry, Little River, Digby County, Nova Scotia Prepared for Global Quarry Products P.O. Box 2113 Digby, Nova Scotia B0V 1A0 By Michael Brylinsky
Project Limulus on Napatree Point: Horseshoe Crab Surveys in 2017
 Project Limulus on Napatree Point: Horseshoe Crab Surveys in 2017 Laura Craver-Rogers & Kevin Rogers Napatree Point Conservation Area, Watch Hill Conservancy & Watch Hill Fire District Napatree Naturalist
Cove Point Beach Restoration: Utilization of a Spawning Habitat by Horseshoe Crabs (Limulus polyphemus)
") Cove Point Beach Restoration: Utilization of a Spawning Habitat by Horseshoe Crabs (Limulus polyphemus) Paul Bushmann, Jessica Peterson, Bethany Enyeart and Deborah Smith Anne Arundel Community College
Cove Point Beach Restoration: Utilization of a Spawning Habitat by Horseshoe Crabs (Limulus polyphemus) Paul Bushmann, Jessica Peterson, Bethany Enyeart and Deborah Smith Anne Arundel Community College
CROSS-SHORE SEDIMENT PROCESSES
 The University of the West Indies Organization of American States PROFESSIONAL DEVELOPMENT PROGRAMME: COASTAL INFRASTRUCTURE DESIGN, CONSTRUCTION AND MAINTENANCE A COURSE IN COASTAL DEFENSE SYSTEMS I CHAPTER
RE: Hurricane Matthew Beach Damage Assessment and Recommendations [CSE 2416]
![RE: Hurricane Matthew Beach Damage Assessment and Recommendations [CSE 2416]](/thumbs/83/87675702.jpg "RE: Hurricane Matthew Beach Damage Assessment and Recommendations [CSE 2416]") October 25, 2016 Iris Hill Town Administrator Town of Edisto Beach 2414 Murray St Edisto Beach SC 29438 RE: Hurricane Matthew Beach Damage Assessment and Recommendations [CSE 2416] Dear Iris, Hurricane
October 25, 2016 Iris Hill Town Administrator Town of Edisto Beach 2414 Murray St Edisto Beach SC 29438 RE: Hurricane Matthew Beach Damage Assessment and Recommendations [CSE 2416] Dear Iris, Hurricane
Delaware Chapter Surfrider Foundation - Indian River Inlet Monitoring
 Delaware Chapter Surfrider Foundation - Indian River Inlet Monitoring In 2012, the Delaware Surfrider Foundation Chapter formed the Surf Quality and Access Committee to focus on issues such as surf spot
US Beach Nourishment Experience:
 Beach Nourishment: Introduction of new sand to the beach by truck or dredge Large beach >1 million cubic yards (100,000 dump truck loads) Funding is a combination of federal, state, local & private Also
PLASTIC BEACH PROTOCOLS
 PLASTIC BEACH PROTOCOLS Plastic Beach aims to collect microplastic pollution data on sandy beaches around the world. The program empowers volunteers to collect important data that will be used to monitor
Dauphin Island East End Beach and Barrier Island Restoration Project. Beau Buhring South Coast Engineers
 Dauphin Island East End Beach and Barrier Island Restoration Project Beau Buhring South Coast Engineers Funding Funded with qualified outer continental shelf oil and gas revenues by the Coastal Impact
Co-Principal Investigators Stephen C. Jewett, Ph.D. Paul C. Rusanowski, Ph.D.
 PROGRESS REPORT FACTORS AFFECTING NEARSHORE SURVIVAL AND PRODUCTION OF JUVENILE SOCKEYE SALMON FROM KVICHAK BAY Phase I: Important habitat, migration routes and food resources CoPrincipal Investigators
EVALUATION OF BEACH EROSION UP-DRIFT OF TIDAL INLETS IN SOUTHWEST AND CENTRAL FLORIDA, USA. Mohamed A. Dabees 1 and Brett D.
 EVALUATION OF BEACH EROSION UP-DRIFT OF TIDAL INLETS IN SOUTHWEST AND CENTRAL FLORIDA, USA Mohamed A. Dabees 1 and Brett D. Moore 1 The paper discusses the analysis of up-drift beach erosion near selected
CLAM PASS RESTORATION AND MANAGEMENT PLAN BATHYMETRIC MONITORING REPORT NO. 7 Including Interior Bay Dredge Cuts and Tidal Data
 CLAM PASS RESTORATION AND MANAGEMENT PLAN BATHYMETRIC MONITORING REPORT NO. 7 Including Interior Bay Dredge Cuts and Tidal Data Submitted to: Florida Department of Environmental Protection DEP File No.
Assateague Island National Seashore North End Restoration Project Timeline
 Assateague Island National Seashore North End Restoration Project Timeline Date Event Some information provided in the Project Introduction document. Detailed events are available in a timeline compiled
23- Year Sand Volume Changes at Site 132, 15th Street, Brigantine
 149 Figure75. Location map for the 9 NJBPN profile sites in Atlantic County, NJ ATLANTIC COUNTY SPRING 2008 to FALL 2009 150 The Atlantic County oceanfront shoreline consists of three barrier islands.
CLAM PASS ANNUAL RESTORATION & MANAGEMENT PLAN TIDAL ANALYSIS ELEMENT REPORT NO. 13
 CLAM PASS ANNUAL RESTORATION & MANAGEMENT PLAN TIDAL ANALYSIS ELEMENT REPORT NO. 13 Submitted to: Pelican Bay Services Division Prepared by: Humiston & Moore Engineers H&M File No. 13-078 November 2012
Figure79. Location map for the 10 NJBPN profile sites in Atlantic County, NJ 155
 154 Figure79. Location map for the 10 NJBPN profile sites in Atlantic County, NJ 155 ATLANTIC COUNTY SPRING 2009 to FALL 2010 The Atlantic County coastline consists of three barrier islands. Between Little
Recycling of Surplus Sand to Extend the Time Between Beach Fill Episodes
 Recycling of Surplus Sand to Extend the Time Between Beach Fill Episodes Cape May County, New Jersey Dr. Stewart Farrell Coastal Research Center 1795 Franklin Map Shows Inlets Inlet Morphology has Remained
LiMPETS Sandy Beach Monitoring Classroom Presentation - SCRIPT
 LiMPETS Sandy Beach Monitoring Classroom Presentation - SCRIPT I m really excited to talk to you about the LiMPETS program for which you guys will participate as marine scientists. LiMPETS stands for Long-Term
Quantitative Freshwater Mussel Survey Date Prepared: 11/20/2017
 PARTNERSHIP FOR THE DELAWARE ESTUARY Science Group Quantitative Freshwater Mussel Survey Date Prepared: 11/20/2017 Prepared By: Kurt Cheng Suggested Citation: Cheng, K. 2017. Quantitative Freshwater Mussel
How beach nourishment has impacted the surf breaks of Cape Canaveral and Cocoa Beach, Florida
 How beach nourishment has impacted the surf breaks of Cape Canaveral and Cocoa Beach, Florida A white paper prepared by John M. Hearin Ph.D., P.E. Ocean Engineer with assistance from Cocoa Beach Chapter
STUDY PERFORMANCE REPORT
 STUDY PERFORMANCE REPORT State: Michigan Project No.: F-53-R-14 Study No.: 486 Title: Assessment of lake trout populations in Michigan s waters of Lake Michigan. Period Covered: April 1, 1997 to March
Feasibility Report and Environmental Impact Statement. Coastal Storm Damage Reduction SURF CITY AND NORTH TOPSAIL BEACH, NORTH CAROLINA.
 Feasibility Report and Environmental Impact Statement on Coastal Storm Damage Reduction SURF CITY AND NORTH TOPSAIL BEACH, NORTH CAROLINA Appendix H Correspondence Appendix H Correspondence This appendix
MOREHEAD CITY HARBOR, NC. Dredged Material Management Plan (DMMP)
") MOREHEAD CITY HARBOR, NC Dredged Material Management Plan (DMMP) Public Meeting/Info Session 15 January 2014 US Army Corps of Engineers Morehead City Harbor DMMP Presentation Topics Morehead City Harbor
MOREHEAD CITY HARBOR, NC Dredged Material Management Plan (DMMP) Public Meeting/Info Session 15 January 2014 US Army Corps of Engineers Morehead City Harbor DMMP Presentation Topics Morehead City Harbor
UPPER BEACH REPLENISHMENT PROJECT RELATED
 ASSESSMENT OF SAND VOLUME LOSS at the TOWNSHIP of UPPER BEACH REPLENISHMENT PROJECT RELATED to the LANDFALL OF HURRICANE SANDY - PURSUANT TO NJ-DR 4086 This assessment is in response to Hurricane Sandy
New Jersey Coastal Zone Overview. The New Jersey Beach Profile Network (NJBPN) 3 Dimensional Assessments. Quantifying Shoreline Migration
 3 Dimensional Assessments. Quantifying Shoreline Migration") New Jersey Coastal Zone Overview The New Jersey Beach Profile Network (NJBPN) Objectives Profile Locations Data Collection Analyzing NJBPN Data Examples 3 Dimensional Assessments Methodology Examples Quantifying
New Jersey Coastal Zone Overview The New Jersey Beach Profile Network (NJBPN) Objectives Profile Locations Data Collection Analyzing NJBPN Data Examples 3 Dimensional Assessments Methodology Examples Quantifying
ST. LUCIE COUNTY, FLORIDA
 ST. LUCIE COUNTY, FLORIDA COASTAL STORM RISK MANAGEMENT STUDY Draft Feasibility Study & Integrated Environmental Assessment Public Meeting Presented by U.S. Army Corps of Engineers Jacksonville District
CHAPTER 281 INFLUENCE OF NEARSHORE HARDBOTTOM ON REGIONAL SEDIMENT TRANSPORT
 CHAPTER 281 INFLUENCE OF NEARSHORE HARDBOTTOM ON REGIONAL SEDIMENT TRANSPORT Paul C.-P. Lin, Ph.D., P.E. 1 and R. Harvey Sasso, P.E. 2 ABSTRACT The influence of nearshore hardbottom on longshore and cross-shore
Climate Change Impacts to KSC Launch Complex
 Climate Change Impacts to KSC Launch Complex Presented to: 2010 International Workshop on Environment and Energy By: John Shaffer NASA Environmental Management Branch Kennedy Space Center Hurricane Season
1-32 NOME HARBOR, ALASKA (CWIS NOS , 87755, 12270, & 10422) Condition of Improvement 30 September 2012
 Condition of Improvement 30 September 2012") NOME HARBOR 1-32 NOME HARBOR, ALASKA (CWIS NOS. 72742, 87755, 12270, & 10422) Condition of Improvement 30 September 2012 AUTHORIZATION: (1) Rivers and Harbors Act, 8 August 1917 (House Doc. 1932, 64th
NOME HARBOR 1-32 NOME HARBOR, ALASKA (CWIS NOS. 72742, 87755, 12270, & 10422) Condition of Improvement 30 September 2012 AUTHORIZATION: (1) Rivers and Harbors Act, 8 August 1917 (House Doc. 1932, 64th
Atlantic Coast of Long Island, Jones Inlet to East Rockaway Inlet, Long Beach Island, NY Construction Update
 Atlantic Coast of Long Island, Jones Inlet to East Rockaway Inlet, Long Beach Island, NY Construction Update June 2016 US Army Corps of Engineers Project Purpose Three specific damage mechanisms of coastal
HURRICANE SANDY LIMITED REEVALUATION REPORT UNION BEACH, NEW JERSEY DRAFT ENGINEERING APPENDIX SUB APPENDIX D SBEACH MODELING
 HURRICANE SANDY LIMITED REEVALUATION REPORT UNION BEACH, NEW JERSEY DRAFT ENGINEERING APPENDIX SUB APPENDIX D SBEACH MODELING Rev. 18 Feb 2015 1 SBEACH Modeling 1.0 Introduction Following the methodology
Ninilchik Harbor Page 2 of 11
 Ninilchik Harbor Ninilchik Harbor Page 2 of 11 Condition of Improvements 31 December 2017 Ninilchik Harbor, Alaska (CWIS No. 012640, 087345) Authorization Rivers and Harbors Act, 3 July 1958 (P.L. 85-500
ATLANTIC STATES MARINE FISHERIES COMMISSION. Winter Flounder Abundance and Biomass Indices from State Fishery-Independent Surveys
 ATLANTIC STATES MARINE FISHERIES COMMISSION Winter Flounder Abundance and Biomass Indices from State Fishery-Independent Surveys Technical Committee Report to the Winter Flounder Management Board February
Impact of Hurricane Matthew on the Atlantic Coast of Florida
 Impact of Hurricane Matthew on the Atlantic Coast of Florida A coastal engineer was driving across country and his jeep broke down in front of a monastery. It was late in the day and the monks invited
Appendix E Cat Island Borrow Area Analysis
 Appendix E Cat Island Borrow Area Analysis ERDC/CHL Letter Report 1 Cat Island Borrow Area Analysis Multiple borrow area configurations were considered for Cat Island restoration. Borrow area CI1 is located
Nome Harbor Page 2 of 12
 Nome Harbor Nome Harbor Page 2 of 12 Condition of Improvements 30 December 2015 Nome Harbor, Alaska (CWIS No. 010422, 012270, 072742, 087755) Authorization (1) Rivers and Harbors Act, 8 August 1917 (House
Changes in Beach Profile and Grain Size after Beach Renourishment
 Kevin Bodge, PE PhD Krista Egan, EI olsen associates, inc. and Mike McGarry Brevard County Natural Resources Mgt. Dept. Changes in Beach Profile and Grain Size after Beach Renourishment February 2018 Beach
Town of Duck, North Carolina
 Tracking No. 00.00.2010 Erosion Mitigation And Shoreline Management Feasibility Study Town of Duck, North Carolina Coastal Planning & Engineering of North Carolina August 15, 2012 Tom Jarrett Robert Neal
TESLIN LAKE 1997, 2003, 2009
 LAKE TROUT POPULATION ASSESSMENT TESLIN LAKE 1997, 2003, 2009 Prepared by: Lars Jessup October 2011 LAKE TROUT POPULATION ASSESSMENT TESLIN LAKE 1997, 2003, 2009 Fish and Wildlife Branch TR-11-04 Acknowledgements
STATUS REPORT FOR THE SUBMERGED REEF BALL TM ARTIFICIAL REEF SUBMERGED BREAKWATER BEACH STABILIZATION PROJECT FOR THE GRAND CAYMAN MARRIOTT HOTEL
 August 23 STATUS REPORT FOR THE SUBMERGED REEF BALL TM ARTIFICIAL REEF SUBMERGED BREAKWATER BEACH STABILIZATION PROJECT FOR THE GRAND CAYMAN MARRIOTT HOTEL performed by Lee E. Harris, Ph.D., P.E. Consulting
CHAPTER 179. Performance of a Submerged Breakwater for Shore Protection
 CHAPTER 179 Abstract Performance of a Submerged Breakwater for Shore Protection Albert E. Browder',A. Member, ASCE; Robert G. Dean 2, Member, ASCE; and Renjie Chen 3 A summary is presented of the results
Passage Key Inlet, Florida; CMS Modeling and Borrow Site Impact Analysis
 Passage Key Inlet, Florida; CMS Modeling and Borrow Site Impact Analysis by Kelly R. Legault and Sirisha Rayaprolu PURPOSE: This Coastal and Hydraulics Engineering Technical Note (CHETN) describes the
2014 Threatened and Endangered Fish Survey of. East Loon Lake and West Loon Lake. Lake County, Illinois
 2014 Threatened and Endangered Fish Survey of East Loon Lake and West Loon Lake Lake County, Illinois Prepared by Integrated Lakes Management 120 LeBaron St. Waukegan, IL 60085. Chris Ryan Chris Rysso
Habitat Fact Sheets. Rocky habitats are dominated by seaweeds and often mussels, which rely on the rocks for attachment.
 Habitat Fact Sheets Habitats in the Gulf of Maine serve many important roles for the environment and for humans as well. These include: cycling nutrients, filtering pollution, trapping sediments, storing
SEA GRANT PROGRESS REPORT
 SEA GRANT PROGRESS REPORT Project Title: The relationship between seasonal migrations of berried female lobster Homarus americanus, egg development and larval survival. Principal Investigator: Winsor H.
Marine Ecosystems. Aquatic Ecosystems Section 2
 Marine Ecosystems Marine ecosystems are located mainly in coastal areas and in the open ocean. Organisms that live in coastal areas adapt to changes in water level and salinity. Organisms that live in
Natural Bridges Field Trip Activity
 Natural Bridges Field Trip Activity This is due in class on MONDAY- March 1 - not in sections! Name TA: NOTE ON THE GRADING OF THIS ASSIGNMENT: Many of the questions below (especially in the tidepool part)
Beach profile surveys and morphological change, Otago Harbour entrance to Karitane May 2014 to June 2015
 Beach profile surveys and morphological change, Otago Harbour entrance to Karitane May 2014 to June 2015 Prepared for Port Otago Ltd Martin Single September 2015 Shore Processes and Management Ltd Contact
Condition of Improvements 30 December 2014 Wrangell Harbors, Alaska (CWIS No , )
") Wrangell Harbors Condition of Improvements 30 December 2014 Wrangell Harbors, Alaska (CWIS No. 010435, 021500) Authorization (1) Rivers and Harbors Act, 22 September 1922 (House Doc. 161, 67th Congress,
Wrangell Harbors Condition of Improvements 30 December 2014 Wrangell Harbors, Alaska (CWIS No. 010435, 021500) Authorization (1) Rivers and Harbors Act, 22 September 1922 (House Doc. 161, 67th Congress,
Description of Underwater Noise Attenuation System Design Unit 2. New NY Bridge Project
 New NY Bridge Project Description of Underwater Noise Attenuation System (NAS) Design Unit 2 Description of Underwater Noise Attenuation System Design Unit 2 for the New NY Bridge Project Revision 1 May
Tanya M. Beck. Kelly Legault. Research Physical Scientist Coastal & Hydraulics Lab, ERDC Vicksburg, MS
 Inlet And Adjacent Shoreline Processes at Cascading Time Scales Using the Coastal Modeling System and GenCade Tanya M. Beck Research Physical Scientist Coastal & Hydraulics Lab, ERDC Vicksburg, MS Kelly
Hydroacoustic surveys of Otsego Lake s pelagic fish community,
 Hydroacoustic surveys of Otsego Lake s pelagic fish community, 2010 1 Holly A. Waterfield 2 and Mark Cornwell 3 INTRODUCTION Hydroacoustic surveys were conducted in May and November 2010 to estimate pelagic
Beach Restoration in Okaloosa and Walton Counties. FSBPA Technology Conference Clearwater, FL
 Beach Restoration in Okaloosa and Walton Counties FSBPA Technology Conference Clearwater, FL Presented by: Duncan Greer, E.I. February 5, 2015 PRESENTATION OUTLINE 1. Overview of Project Locations 2. Eglin
Species Conclusions Table
 Conclusions Table Project Name: Chesapeake Landing HOA- Breakwaters (NAO-14-0283) Date: February 25, 2014 /Resource Name Loggerhead sea turtle (Caretta caretta) Conclusion ESA Section 7 / Eagle Act Determination
Chapter 4 EM THE COASTAL ENGINEERING MANUAL (Part I) 1 August 2008 (Change 2) Table of Contents. Page. I-4-1. Background...
 1 August 2008 (Change 2) Table of Contents. Page. I-4-1. Background...") Chapter 4 EM 1110-2-1100 THE COASTAL ENGINEERING MANUAL (Part I) 1 August 2008 (Change 2) Table of Contents I-4-1. Background... Page I-4-1 a. Shore Protection Planning and Design, TR 4... I-4-1 b. Shore
Chapter 4 EM 1110-2-1100 THE COASTAL ENGINEERING MANUAL (Part I) 1 August 2008 (Change 2) Table of Contents I-4-1. Background... Page I-4-1 a. Shore Protection Planning and Design, TR 4... I-4-1 b. Shore
EXECUTIVE SUMMARY BIOLOGICAL MONITORING PLAN
 BIOLOGICAL MONITORING PLAN EXECUTIVE SUMMARY During planning of the Asbury Park to Manasquan Inlet Beach Erosion Control Project, an extensive monitoring program was developed to assess potential impacts
West Coast Rock Lobster. Description of sector. History of the fishery: Catch history
 West Coast Rock Lobster Description of sector History of the fishery: The commercial harvesting of West Coast rock lobster commenced in the late 1800s, and peaked in the early 1950s, yielding an annual
Behavior and survival of hatchery reared advanced fingerling largemouth bass using radio telemetry. Brandon Thompson
 Behavior and survival of hatchery reared advanced fingerling largemouth bass using radio telemetry Brandon Thompson Florida largemouth bass Micropterus salmoides floridanus Premier freshwater sportfish
A PHYSICAL AND BIOLOGICAL SURVEY OF THE MID-REACH MITIGATION REEF SET NUMBER 1
 A PHYSICAL AND BIOLOGICAL SURVEY OF THE MID-REACH MITIGATION REEF SET NUMBER 1 John M. Hearin, Ph.D., P.E. 1 ; Geoff Swain, Ph.D. 2 ; Robert Weaver, Ph.D., P.E. 2 ; Kelli Z. Hunsucker, Ph.D. 2 ; Caglar
Map Showing NAFO Management Units
 Map Showing NAFO Management Units Biology Are 6 species of seals in Atlantic Canadian waters, all of which occur in Newfoundland Two Arctic Species (Ringed, Bearded) Two temperate (Grey, Harbour) Two migratory
Cordova Harbor Page 2 of 9
 Cordova Harbor Cordova Harbor Page 2 of 9 Condition of Improvements 30 December 2017 Cordova Harbor, Alaska (CWIS No. 087136, 087186, 087711) Authorization Rivers and Harbors Act, 30 August 1935 (R & H
Comparative growth of pinfish in field mesocosms across marsh, oyster, and soft-bottom habitat types in a Mississippi estuary
 Comparative growth of pinfish in field mesocosms across marsh, oyster, and soft-bottom habitat types in a Mississippi estuary Virginia Shervette and Fran Gelwick Department of Wildlife and Fisheries Sciences
Southern California Beach Processes Study
 Southern California Beach Processes Study Torrey Pines Field Site 5th Quarterly Report 31 May 22 to California Resources Agency and California Department of Boating and Waterways R.T. Guza 1, W.C. O Reilly
IMPACTS OF COASTAL PROTECTION STRATEGIES ON THE COASTS OF CRETE: NUMERICAL EXPERIMENTS
 IMPACTS OF COASTAL PROTECTION STRATEGIES ON THE COASTS OF CRETE: NUMERICAL EXPERIMENTS Tsanis, I.K., Saied, U.M., Valavanis V. Department of Environmental Engineering, Technical University of Crete, Chania,
Jason Blackburn, Paul Hvenegaard, Dave Jackson, Tyler Johns, Chad Judd, Scott Seward and Juanna Thompson
 Alberta Conservation Association (ACA) Date: 2014-2015 Project Name: Owl River Walleye and Aquatic Habitat Assessment Fisheries Program Manager: Peter Aku Project Leader: Tyler Johns Primary ACA staff
The Case of the Disappearing Shoreline
 Name The Case of the Disappearing Shoreline Humans change the earth's climate in many ways. One change is the increase of carbon dioxide in the atmosphere. As we burn more fossil fuels, we release more
Environmental. Effects of Dredging
 Envi~onmental Effects of Dredging Technical Notes THE VALUE OF GRAVEL DISPOSAL MOUNDS IN RIVER SIDE CHANNELS FOR FRESHWATER MUSSELS PURPOSE: This note provides information on the value of gravel disposal
New Jersey Beach Profile Network Atlantic County Profile Site Locations
 215 RICHARD STOCKTON COLLEGE OF NEW JERSEY New Jersey Beach Profile Network Atlantic County Profile Site Locations COASTAL RESEARCH CENTER Figure 128 There are nine NJBPN survey sites on the Atlantic County
Protect Our Reefs Grant Interim Report (October 1, 2008 March 31, 2009) Principal investigators: Donald C. Behringer and Mark J.
 Principal investigators: Donald C. Behringer and Mark J.") Investigating the role of the spotted spiny lobster (Panulirus guttatus) in the recovery of the long spined sea urchin (Diadema antillarum) on the coral reefs of the Florida Keys Protect Our Reefs Grant
Investigating the role of the spotted spiny lobster (Panulirus guttatus) in the recovery of the long spined sea urchin (Diadema antillarum) on the coral reefs of the Florida Keys Protect Our Reefs Grant
Chapter 11. Beach Fill and Soft Engineering Structures
 Chapter 11 Beach Fill and Soft Engineering Structures Solutions to Coastal Erosion Soft Structures Hard Structures Retreat No such thing as low cost coastal protection Beach Nourishment Beach Filling Beach
Town of Duck, North Carolina
 Tracking No. 00.00.2010 Erosion Mitigation And Shoreline Management Feasibility Study Town of Duck, North Carolina Coastal Planning & Engineering of North Carolina February 28, 2013 Ken Willson 1 Tracking
30 DAY PUBLIC NOTICE MAINTENANCE DREDGING OF THE 8-FOOT CHANNEL OF THE FEDERAL NAVIGATION PROJECT IN KENNEBUNK RIVER KENNEBUNK & KENNEBUNKPORT, ME
 fr.iiif.i ~ US Anny Corps of Engineers New England District 696 Virginia Road Concord, MA 01742-2751 Public Notice In Reply Refer to: Mr. Jack Karalius nae-pn-nav@usace.army.mil Programs/Project Management
Proposed Terrestrial Critical Habitat for the Northwest Atlantic Loggerhead Sea Turtle Population. U.S. Fish and Wildlife Service
 Proposed Terrestrial Critical Habitat for the Northwest Atlantic Loggerhead Sea Turtle Population U.S. Fish and Wildlife Service History of Loggerhead Listing (joint responsibility USFWS and NOAA Fisheries)
SPECIAL SPRING 2018 STORM REPORT ON THE CONDITION OF THE MUNICIPAL BEACHES FOR THE BOROUGH OF STONE HARBOR, CAPE MAY COUNTY, NEW JERSEY
 SPECIAL SPRING 2018 STORM REPORT ON THE CONDITION OF THE MUNICIPAL BEACHES FOR THE BOROUGH OF STONE HARBOR, CAPE MAY COUNTY, NEW JERSEY Aerial photograph taken April 21, 2018 showing the view up the beach
Youngs Creek Hydroelectric Project
 Youngs Creek Hydroelectric Project (FERC No. 10359) Resident Trout Monitoring Plan Annual Report 2014 Survey Prepared by: Everett, WA November 2014 Final This document has been prepared for the District.
ST. JOSEPH PENINSULA, GULF COUNTY, FLORIDA Beach Re-Nourishment and Environmental Enhancement Project RECOMMENDATIONS
 ST. JOSEPH PENINSULA, GULF COUNTY, FLORIDA Beach Re-Nourishment and Environmental Enhancement Project RECOMMENDATIONS January 23, 2018 543 Harbor Boulevard, Suite 204 Destin, Florida 32541 850.654.1555
2.6 Dry Bulk, Break-Bulk, and Yachts and Vehicles Cargo Market Assessment
 2.6 Dry, Break-, and Yachts and Vehicles Cargo Market Assessment 2.6.1 Forecast Summary Annual cargo demand for dry bulk, break-bulk, yachts and vehicles was forecast under three scenarios (see Figure
Absecon Island Shore Protection The planning behind the project
 Absecon Island Shore Protection The planning behind the project Most residents of Atlantic City, Ventnor, Margate and Longport are now aware of upcoming plans to protect their common coastline with a beachfill
Delineation of the Asian Clam (Corbicula fluminea) Population at Sand Harbor State Park, Nevada
 Population at Sand Harbor State Park, Nevada") Delineation of the Asian Clam (Corbicula fluminea) Population at Sand Harbor State Park, Nevada Report to the Nevada Division of State Lands and the Tahoe Regional Planning Agency Final Draft Brant Allen,
Delineation of the Asian Clam (Corbicula fluminea) Population at Sand Harbor State Park, Nevada Report to the Nevada Division of State Lands and the Tahoe Regional Planning Agency Final Draft Brant Allen,
Eastern and South Shore Nova Scotia Lobster LFAs The Fishery. DFO Atlantic Fisheries Stock Status Report 96/117E.
 Maritimes Region DFO Atlantic Fisheries Stock Status Report 96/117E Eastern and South Shore Nova Scotia Lobster LFAs 31-33 Background Lobsters first entering the fishery in LFAs 31, 32, and 33 are probably
Trusted Partners Delivering Value, Today and Tomorrow BUILDING STRONG
 Miami-Dade County Renourishment Project U.S. Army Corps of Engineers Jacksonville District January 5, 2017 US Army Corps of Engineers Project Purpose coastal storm risk management beach erosion control
The 2017 Panama City Beaches Beach Interim Renourishment Project. Answers to Common Questions
 The 2017 Panama City Beaches Beach Interim Renourishment Project The fourth renourishment of the Panama City Beaches will be under construction during March and April 2017, with a planned completion by
Estuarine Shoreline Stabilization
 Estuarine Shoreline Stabilization Property Owner s Guide to Determining the Most Appropriate Stabilization Method Estuarine shorelines are dynamic features that experience continued erosion. Land is lost
Figure 4, Photo mosaic taken on February 14 about an hour before sunset near low tide.
 The Impact on Great South Bay of the Breach at Old Inlet Charles N. Flagg and Roger Flood School of Marine and Atmospheric Sciences, Stony Brook University Since the last report was issued on January 31
Nearshore Placed Mound Physical Model Experiment
 Nearshore Placed Mound Physical Model Experiment PURPOSE: This technical note describes the migration and dispersion of a nearshore mound subjected to waves in a physical model. The summary includes recommendations
Florida Seagrass Integrated Mapping and Monitoring Program
 Florida Seagrass Integrated Mapping and Monitoring Program - 2004 The following document is composed of excerpts taken from the 2011 publication, Seagrass Integrated Mapping and Monitoring for the State
Winter Drawdown Issues of Concern
 Winter Drawdown Issues of Concern Wetland Connectivity Amphibians Fisheries Winter Drawdown Wetland Connectivity Wetland complex near Osprey Creek is not responsive to lake level Wetland at upper end of
Findings of the Alaska Board of Game BOG
 Findings of the Alaska Board of Game 2004-148-BOG Authorizing Predator Control in the Western Cook Inlet Area in Unit 16B with Airborne or Same Day Airborne Shooting March 10, 2004 Purpose This action
Gulf of Maine Research Institute Responsibly Harvested Seafood from the Gulf of Maine Region Report on Atlantic Sea Scallops (Inshore Canada)
") Gulf of Maine Research Institute Responsibly Harvested Seafood from the Gulf of Maine Region Report on Atlantic Sea Scallops (Inshore Canada) The fishery is managed by a competent authority and has a management
Gulf of Maine Research Institute Responsibly Harvested Seafood from the Gulf of Maine Region Report on Atlantic Sea Scallops (Inshore Canada) The fishery is managed by a competent authority and has a management