PHYSICAL MONITORING WILMINGTON HARBOR NAVIGATION PROJECT REPORT 1: August 2000 June 2003
|
|
|
- Debra Stafford
- 5 years ago
- Views:
Transcription
1 PHYSICAL MONITORING WILMINGTON HARBOR NAVIGATION PROJECT REPORT 1: August 2000 June 2003 AUGUST 2004 For questions or comment, contact Project Manager, Ms. Sharon Haggett,
2 EXECUTIVE SUMMARY The mouth of the Cape Fear River and Wilmington Harbor entrance channel are located in eastern Brunswick County, near Cape Fear, about 25 miles south of Wilmington. Cape Fear is the southernmost of three large capes that predominate the North Carolina coastal plan-form. The river mouth, which is approximately one mile in width, is bordered on the east by Bald Head Island and to the west by Oak Island/Caswell Beach (see Figure 1.1 in report text). Bald Head Island is a barrier beach stretching from the river entrance to Cape Fear. The south-facing beach covers about three miles and is commonly referred to as South Beach. Likewise, the approximately 1.5-mile portion of the island that borders along the river is called West Beach and the reach extending northward from the point at Cape Fear, facing east toward the Atlantic Ocean, is termed East Beach. Oak Island/Caswell Beach is part of a barrier island that covers about 13 miles extending from Lockwoods Folly Inlet on the western end to the Cape Fear River on the east. The eastern half of this island, which consists of a portion of Oak Island, Caswell Beach and Fort Caswell, falls within the project monitoring area. This comprehensive project, with a total estimated cost of $440 million, consists of channel improvements extending from the ocean entrance upstream to just above the Northeast Cape Fear River railroad bridge in Wilmington, some 37 miles. The improvements consist of deepening the ocean bar channel and entrance channel from the authorized depth of 40 feet to 44 feet, beginning at a point approximately 6.7 miles offshore through the Battery Island Channel located 2.9 miles upstream. Continuing from Battery Island Channel to the Cape Fear Memorial Bridge, 24.3 miles, the authorized channel is deepened from 38 feet to 42 feet. This physical monitoring program for the Wilmington Harbor navigation channeldeepening project is examining the response of adjacent beaches, entrance channel shoaling patterns, and the ebb tide delta to the channel deepening and realignment for which construction began in December The present monitoring program involves five elements: beach profile surveys, channel and ebb tide delta surveys, wave and current measurements, aerial photography; and data analysis/reporting. This report is the first in a series and covers the period of August 2000 (preconstruction survey) through June This spans the initial construction period of 35 months. The remaining reports will be issued on an annual basis in the month of December. Beach profile surveys are the primary data source and are collected along both Bald Head Island and Oak Island/Caswell Beach. The beach surveys consist of specified transects, or profiles, taken generally perpendicular to the trend of the shoreline as indicted in Figures 1.3 and 1.4 in the report text. Bald Head Island profiles include 58 stations along about 22,000 feet. Oak Island/Caswell Beach profiles include 62 stations along about 31,000 feet. Beach profile surveys are taken semi-annually and are scheduled to coincide with the spring (April-May) and fall (October-November) seasons. Bathymetric surveys of these profiles from offshore through the surf zone and over the shoal areas that border each side of
3 the Cape Fear entrance channel, and those near Frying Pan Shoals are collected annually with the Engineering Research and Development Center s LARC (Lighter Amphibious Re-supply Cargo) survey system. The LARC vehicle transits through the water, across shoals, through the surf zone up to the base of the beach dunes. Channel and ebb tide delta surveys are collected using a Submetrix Interferometric (SI) System. This system collects swath bathymetry and side scan sonar from a hullmounted transducer. This system performs particularly well in shallow waters. Since the beginning of the monitoring program three surveys have been collected: August-September 2000, December 2001-January 2002 and January Wave data are collected by three bottom-mounted wave gauges consisting of an Acoustic Doppler Current Profiler (ADCP) meter and a pressure gauge. These instruments were initially deployed in September Currents are also measured along specified transects across the mouth of the Cape Fear River and near the new channel realignment using a downward-looking, shipboard-mounted current profiler. Current measurements have occurred three times during this initial monitoring phase: October 2000, April 2002 and March Vertical color aerial photographs are taken yearly generally near the time of the spring profile survey. The over-flight for this monitoring effort is included as part of a separate and larger aerial photography for shoreline monitoring project that provides aerial coverage from the North Carolina-South Carolina state line northward to Cape Lookout. The nominal scale of the photography is 1 inch equals 1000 feet over the entire project area and 1 inch equals 500 feet for the Wilmington Harbor monitoring area. The larger scale print coverage extends from the westward beach disposal limit on Oak Island to the eastern end of South Beach on Bald Head Island. Shoreline monitoring used the beach profiles described above to track changes of the mean high water line (+2.71 ft NGVD). At Oak Island/Caswell Beach, shoreline monitoring indicates that the shoreline for most of the monitoring area was seaward (except for the eastern 1 mile reach closest to the river) of its August 2000 (pre-construction) position by the end of the period. When averaged along the entire 6-mile reach, the present shoreline is about 100 feet more seaward than it was in August The net volume change observed across the whole profile along Oak Island/Caswell Beach has been an increase of 783,000 CY between October 2001 and December Through the June 2003 onshore survey, the Oak Island/Caswell Beach area continued to show a net gain averaged over the entire reach of about +24 cy/ft. Shoreline monitoring at Bald Head Island has shown areas of both significant erosion and accretion. Between September 2000 and June 2003 the shoreline advanced along both West Beach and the eastern two-thirds of South Beach. However, the shoreline receded along the western third of South Beach and along the southwest corner (spit area) of the island. For South Beach, the area of accretion extended along the easternmost 12,000 feet (between Profile 102 to Profile 222) and was an average of 82 feet seaward than in September At the western end of South Beach, the June 2003 shoreline was landward
4 of the September 2000 location. Within the spit area, all profiles are erosional, except for Profile 40. When averaged in an alongshore sense, the June 2003 shoreline at the spit was 57 feet landward of the June 2000 position. For the adjacent erosion zone along South Beach, the shoreline recession tapers from a peak near the spit of 134 feet to zero over the 4500 ft reach. On the average, the shoreline was approximately 55 feet more landward in June 2003 than it was in September Volumetrically along the western portion of South Beach, a net loss of 265,000 CY was observed between October 2001 and December The eastern portion of South Beach accreted about 584,000 CY between October 2001 and December At Bald Head spit, navigation channel surveys show the spit has enlarged volumetrically. Channel surveys show a westward shift of the river thalweg, which coincides with the spit growth, and increase in the supply of littoral sediment from the western end of South Beach. In addition, the offshore profile at the western end of South Beach appears to show the presence of a deeper and better-defined marginal flood channel. Bathymetric surveys of the ebb and nearshore shoals in the vicinity of the entrance channel show that the overall morphology of the ebb and nearshore shoals has been largely static over this initial monitoring period. However, one observed change was deepening of the flood margin channel along the tip of Oak Island. A companion flood margin channel, of comparable magnitude, is not present through Bald Head Shoal on the opposite side of the entrance channel. In addition, there has been no change in the area of the shoal between the old and new channels just seaward of their intersection. Current measurements taken over a tidal cycle along transects across the mouth of the entrance channel and along the seaward portion of the ebb tide delta show very similar flow regimes. These are consistent with the minimal change seen in the overall bathymetry of the ebb tide delta. One finding of particular interest is that the data shows that there does not appear to be a substantial decrease in the current magnitude through the old channel since the opening of the new channel. In summary, the significant observations from this initial monitoring period include: a. Growth of Bald Head spit b. Channel thalweg movement away from Bald Head Island c. Potential development of marginal flood shoal offshore of South Beach Bald Head Island d. Erosion of western portion of South Beach, Bald Head Island e. Lack of noticeable change to the nearshore bathymetry f. Ebb tide current preference to the old channel alignment g. Stability of Oak Island/Caswell Beaches shoreline The initial efforts of the monitoring program have enhanced the development of a fundamental understanding of the existing coastal processes and short-term bathymetry and shoreline variability. The extensive data collection program has provided the data needed to develop calibrated wave transformation and hydrodynamic models. Current plans include a gradual shift over the six-year operational plan from field data collection efforts toward the
5 use of these modeling tools. The tools will be used to help quantify magnitudes and patterns of sediment transport and develop a detailed sediment budget for the area. This working suite of coastal engineering tools will provide assessment of future beach and inlet management actions and provide input to the sand management plan.
6 PHYSICAL MONITORING WILMINGTON HARBOR NAVIGATION PROJECT REPORT 1 Part 1INTRODUCTION 1 Purpose 1 Project Description 1 Location 1 Federal Channel Realignment and Deepening 1 Construction Activity 3 Sand Management Plan 5 Monitoring Program 6 Scope 6 Program Elements 6 Beach Profile Surveys 7 Channel and Ebb Tide Delta Surveys 10 Wave and Current Measurements 11 Aerial Photography 11 Data Analysis/Reporting 15 Bald Head Island Monitoring Survey Program 15 Activities to Date 16 Part 2 HISTORIC INLET AND SHORELINE CHANGES 18 Cape Fear River Entrance Channel and Shoals 18 Entrance Channel Deepening History 18 Channel Alignment Changes 18 Offshore Shoal Response 18 Shoreline Change Mapping 19 General 19 Bald Head Island 19 Oak Island/Caswell Beach 20 Shoreline Change Rates 26 State Erosion Rates 26 Oak Island/Caswell Beach Shoreline Change Rates 26 Bald Head Island Shoreline Change Rates 26 Erosion Control Activities at Bald Head Island 30 i
7 Part 3 DATA ANALYSIS AND RESULTS FROM FIRST MONITORING CYCLE 31 General 31 Beach Profile Analysis-Shoreline and Profile Change 32 Bald Head Island 32 Oak Island 37 Beach Profile Analysis-Volumetric Changes 40 General 40 Bald Head Island 44 Onshore Surveys Compared to After Dredge Surveys 44 Post-Construction Surveys Compared to Pre-Construction Surveys 44 Oak Island 48 Onshore Surveys Compared to After Dredge Surveys 48 Post-Construction Surveys Compared to Pre-Construction Surveys 48 Ebb and Nearshore Shoal Analysis 51 Bathymetric Data Collection 51 Results 51 Wave Data Analysis 62 General Wave Climate 62 WIS Hindcast Analysis 63 Wave Gage Analysis 67 Wave Climate 69 Wave Time Series 73 Significant Events 74 Wave Transformation Modeling 84 Model Calibration 85 Current Measurements 87 Methodology 87 Results 90 Part 4 PROJECT EFFECTS/PERFORMANCE TO DATE 100 Beach Response-Shoreline Change Rates 100 General Shoreline Change Information 100 Oak Island 100 Bald Head Island 106 Comparison of Prior and Current Beach Fill Response 107 Bald Head Island 107 Ebb & Nearshore Shoal Response 116 General 116 ii
8 Results-Ebb Tidal Delta Inlet (inner) Region 116 Results-Ebb Tidal Delta Inlet (outer) Channel Region 116 Changes in Currents and Tidal Prism 119 Current Velocities (Direction and Magnitude) 119 Part 5 SUMMARY 135 Results to Date 135 Sand Management Considerations 137 Future Monitoring Efforts 138 REFERENCES 139 LIST OF FIGURES Figure 1.1 Project Location Map 2 Figure 1.2 Realignment of the Federal Navigation Channel at the Cape Fear River Entrance 4 Figure 1.3 Bald Head Island Beach Profile Locations 8 Figure 1.4 Oak Island/Caswell Beach Profile Locations 9 Figure 1.5 FRF Hydro-LARC Survey System 10 Figure 1.6 Entrance Channel and Ebb Tide Delta Survey Coverage 12 Figure 1.7 Wave and Current Gauge Locations 13 Figure 1.8 Shipboard Current Profile Locations 14 Figure 1.9 Wilmington Harbor Monitoring Program Activity Chart 17 Figure 2.1 Bald Head Island Shorelines ( ) 21 Figure 2.2 Bald Head Island Shorelines ( ) 22 Figure 2.3 Bald Head Island Shorelines ( ) 23 Figure 2.4 Oak Island Shorelines ( ) 24 Figure 2.5 Oak Island Shorelines ( ) 25 Figure 2.6 Long-Term Average Annual Shoreline Change Rates ( ) Oak Island/Caswell Beach 28 Figure 2.7 Long-Term Average Annual Shoreline Change Rates ( ) Bald Head Island 29 Figure 2.8 Sand Bag Revetment along South Bald Head Wynd, April Figure 3.1 Bald Head Island Profile Figure 3.2 Wilmington Harbor Monitoring Shoreline Positions Bald Head Island Profile Figure 3.3 Wilmington Harbor Monitoring Shoreline Change from Pre-Construction Survey (September 2000) Bald Head Island 34 iii
9 Figure 3.4 Bald Head Island Profile Figure 3.5 Bald Head Island Profile Figure 3.6 Wilmington Harbor Monitoring Shoreline Change from Pre-Construction Survey (August 2000) Oak Island 36 Figure 3.7 Oak Island Profile Figure 3.8 Oak Island Profile Figure 3.9 Wilmington Harbor Monitoring - Oak Island Beach Profile Volume Change since "After-Dredge" Surveys (July - October 2001) Onshore - Offshore Profiles down to -18 NGVD 39 Figure 3.10 Wilmington Harbor Monitoring - Oak Island Beach Profile Volume Change since "After-Dredge" Surveys (July - October 2001) Onshore Only Profiles down to -2 NGVD 39 Figure 3.11 Wilmington Harbor Monitoring Oak Island Beach Profile Volume Change since August Figure 3.12 Wilmington Harbor Monitoring - Bald Head Island Beach Profile Volume Change since "After-Dredge" Survey (March - July 2001) Onshore - Offshore Profiles down to -18 NGVD 46 Figure 3.13 Wilmington Harbor Monitoring - Bald Head Island Beach Profile Volume Change since "After-Dredge" Survey (March - July 2001) Onshore Only Profiles down to -2 NGVD 47 Figure 3.14 Wilmington Harbor Monitoring Bald Head Island Beach Profile Volume Change since August/September Figure 3.15 Survey Track Lines Collected by the LARC5 and the Interferometric System during the 2003 Survey 49 Figure 3.16 Bathymetry of the Cape Fear River Ebb Tidal Delta, Figure 3.17 Inset of bathymetry near the Cape Fear River Tidal Inlet Figure 3.18 Comparison of bathymetry near the Cape Fear River Tidal Inlet Showing Bathymetry from the 2000, 2002, and 2003 surveys 54 Figure 3.19 Inset of Bathymetry Near the New Channel along the Distal End of the Ebb Tidal Delta Figure 3.20 Inset of Bathymetry Near the New Channel from each of the Three Surveys- 2000, 2002, and Figure 3.21 Inset of Bathymetric Change along the Western Portion of Bald Head Island, Figure 3.22 Comparison of Bathymetry along the Western Portion of Bald Head Island from the 2000, 2002, and 2003 Surveys 58 Figure 3.23 Comparison of Bathymetry along the Eastern Portion of Oak Island from the 2000, 2002, and 2003 Surveys 59 Figure 3.24 Wave Gauge and Hindcast Station Locations 60 Figure 3.25 Wave Height Rose for WIS Level 3 Station Figure 3.26 Wave Histogram for WIS Level 3 Station Figure 3.27 Wave Height Block Diagram for WIS Level 3 Station Figure 3.28 Wave Period Rose for WIS Level 3 Station Figure 3.29 Wave Period Block Diagram for WIS Level Station Figure 3.30 FRF Wave and Current Gauges 66 Figure 3.31 Wave Histograms for FRF Gauges throughout deployment 66 iv
10 Figure 3.32 Wave Height Roses for FRF Gauges throughout deployment 68 Figure 3.33 Wave Height Roses for FRF Gauges (2000) 75 Figure 3.34 Wave Height Roses for FRF Gauges (2001) 76 Figure 3.35 Wave Height Roses for FRF Gauges (2002) 77 Figure 3.36 Wave Height Roses for FRF Gauges (2003) 78 Figure 3.37 Monthly Time Series for 11-Mile Gauge (Dec 2002) 79 Figure 3.38 FRF Wave Gauge Time Series (Dec 2002) 80 Figure 3.39 Cape Fear Bathymetry with Entrance Channel Plan 81 Figure 3.40 STWAVE Example Transformation Output 82 Figure 3.41 STWAVE Model Results Compared to Observed Gauge Data (Nov 2000 Storm) 84 Figure 3.42 Ship-Board Current Profile Track Lines 85 Figure 3.43 Location of inlet ADCP transect 86 Figure 3.44 Location of offshore ADCP transect 88 Figure 3.45 Peak ebb current velocities at inlet transect for October 2000 ADCP survey 89 Figure 3.46 Peak flood current velocities at inlet transect for October 2000 ADCP survey 90 Figure 3.47 Peak ebb current velocities at offshore transect for October 2000 ADCP survey 91 Figure 3.48 Peak ebb current velocities at offshore transect for October 2000 ADCP survey 91 Figure 3.49 Peak ebb current velocities at inlet transect for April 2002 ADCP survey 92 Figure 3.50 Peak flood current velocities at inlet transect for April 2002 ADCP survey 92 Figure 3.51 Peak ebb current velocities at offshore transect for April 2002 ADCP survey 93 Figure 3.52 Peak flood current velocities at offshore transect for April 2002 ADCP survey 94 Figure 3.53 Peak ebb current velocities at inlet transect for March 2003 ADCP survey 95 Figure 3.54 Peak flood current velocities at inlet transect for March 2003 ADCP survey 95 Figure 3.55 Peak ebb current velocities at offshore transect for March 2003 ADCP survey 97 Figure 3.56 Peak flood current velocities at offshore transect for March 2003 ADCP survey 98 Figure 3.57 Peak ebb current velocities at offshore transect for March 2003 ADCP survey 99 Figure 3.58 Peak flood control velocities at offshore transect for March 2003 ADCP survey 99 Figure 4.1 Wilmington Harbor Monitoring - Oak Island Comparison of Pre and Post Construction Shoreline Change Rates 104 Figure 4.2 Wilmington Harbor Monitoring - Bald Head Island Comparison of Pre and Post Construction Shoreline Change Rates 105 Figure Beach Fill along Bald Head Island 107 Figure 4.4 Bald Head Island Erosion Rates. August 01 to June Figure 4.5 Bald Head Island Annual Erosion Rates 109 Figure 4.6 Bald Head Island Shoreline Azimuths 110 Figure 4.7 Bald Head Island 1855 & 2003 Shorelines 111 Figure Beach Fill with Geotextile Groins 112 Figure 4.9 Shoreline Locations and Erosion Rates for Station Figure 4.10 The Remains of a Geotextile Groin near the West End of the Groin Field on 31 December Figure 4.11 Annual Erosion Rate 1997 and 2001 Beach Fills 114 Figure 4.12 Not Used Figure 4.13 Not Used Figure 4.14 Not Used v
11 Figure 4.15 Change Map Showing a Deepening from 2000 to 2003 as Negative and more Shallow as Positive in the Tidal Inlet Region 117 Figure 4.16 Change Map Showing a Deepening from 2000 to 2003 as Negative and more Shallow as Positive in the New Channel Region 118 Figure 4.17 Predicted and Observed Water Levels During the October 2000 ADCP Survey 121 Figure 4.18 Predicted and Observed Water Levels During the April 2002 ADCP Survey 121 Figure 4.19 Predicted and Observed Water Levels During the March 2003 ADCP Survey (Inlet Transect) 122 Figure 4.20 Predicted and Observed Water Levels During the March 2003 ADCP Survey (Offshore Transect) 122 Figure 4.21 October 2000 ADCP survey at inlet transect during peak flood flow 124 (Note that survey transect does not cover same area as the April 2002 survey) Figure 4.22 April 2002 ADCP survey at inlet transect during peak flood flow (Note that survey transect does not cover same area as the October 2000 survey) 124 Figure 4.23 October 2000 ADCP survey at inlet transect during peak ebb flow (Note that survey transect does not cover same area as the April 2002 survey) 125 Figure 4.24 April 2002 ADCP survey at inlet transect during peak ebb flow (Note that survey transect does not cover same area as the October 2000 survey) 125 Figure 4.25 October 2000 ADCP survey at offshore transect during peak flood flow 126 Figure 4.26 April 2002 ADCP survey at offshore transect during peak flood flow 126 Figure 4.27 October 2000 ADCP survey at offshore transect during peak ebb flow 127 Figure 4.28 April 2002 ADCP survey at offshore transect during peak ebb flow 127 Figure 4.29 Near-bottom flow field reversal on flood tide from April 2002 survey 128 Figure 4.30 April 2002 ADCP survey at inlet transect during ebb flow 129 Figure 4.31 March 2003 ADCP survey at inlet transect during ebb flow 129 Figure 4.32 April 2002 ADCP survey at inlet transect during flood flow 130 Figure 4.33 March 2003 ADCP survey at inlet transect during flood flow 130 Figure 4.34 April 2002 ADCP survey at offshore transect during ebb flow 131 Figure 4.35 March 2003 ADCP survey at offshore transect during ebb flow 131 Figure 4.36 April 2002 ADCP survey at offshore transect during flood flow 132 Figure 4.37 March 2003 ADCP survey at offshore transect during flood flow 132 Figure 4.38 Normalized tidal prism for three surveys October 2000 (1), April 2002 (2) and March 2003 (3). Blue flood, Green ebb, Red total 133 Figure 4.39 April 2002 and March 2003 tidal prism comparisons with other inlets 134 vi
12 LIST OF TABLES Table 1.1 Wilmington Harbor Beach Disposal Operations 5 Table 1.2 Village of Bald Head Island Beach Profile Surveys 15 Table 2.1 Cape Fear River Entrance Channel Improvements 18 Table 3.1 Beach Surveys Used for Volume Change Observations 40 Table 3.2 Lower Elevation Limit for Onshore/Offshore Table 3.3 Volumetric Comparison Oak Island 42 Lower Elevation Limit for Onshore/Offshore Volumetric Comparison Bald Head Island 43 Table 3.4 Mean Yearly and Monthly Wave Heights (ft) for WIS Level 3 Station Table 3.5 Eleven Mile Gauge Monthly Summaries 70 Table 3.6 Bald Head Gauge Monthly Summaries 71 Table 3.7 Oak Island Gauge Monthly Summaries 72 Table 3.8 Significant Events at 11-Mile Gauge Exceeding Significant Wave Height of 6-ft 83 Table 4.1 Oak Island Shoreline Change Rates 102 Table 4.2 Bald Head Island Shoreline Change Rates 103 Table 4.3 Maximum Magnitude of Mean Flows at Inlet Transect 119 Table 4.4 Maximum Magnitude of Mean Flows at Offshore Transect 120 Table 4.5 Predicted and Observed Tide Ranges during ADCP Survey 120 Appendix A Wave Gauge Data Appendix B Shoreline Change Rates LIST OF APPENDICES vii
13 PHYSICAL MONITORING WILMINGTON HARBOR NAVIGATION PROJECT REPORT 1 Part 1 INTRODUCTION Purpose Wilmington Harbor navigation project covers over 37 miles of channel improvements extending from the mouth of the Cape Fear River to Wilmington, N.C. and the Northeast Cape Fear River. Improvements consist of a general deepening of the river by 4-ft from the mouth to the North Carolina State Port facilities, numerous improvements to turns and bends in the channel, a passing lane and implementation of environmental mitigation features. This document is the first in a series of monitoring reports that focuses on the navigation improvements in the immediate vicinity of the Cape Fear ocean entrance channel. The monitoring program is designed to meet two main objectives: (1) to document the response of the adjacent beaches to the deepening and alignment changes of the entrance channel and (2) to use the results of the program to effectively implement the project s sand management plan. Project Description Location. The mouth of the Cape Fear River and Wilmington Harbor entrance channel are located in eastern Brunswick County, near Cape Fear, about 25 miles south of Wilmington. Cape Fear is the southernmost of three large capes that predominate the North Carolina coastal plan-form. Frying Pan Shoals extend southeastward from the cape some 20 miles into the Atlantic Ocean. The river mouth, which is approximately one mile in width, is bordered on the east by Bald Head Island and to the west by Oak Island/Caswell Beach as shown in Figure 1.1. Bald Head Island is a barrier beach stretching from the river entrance to Cape Fear. The south-facing beach covers about three miles and is commonly referred to as South Beach. Likewise, the approximately 1.5-mile portion of the island that borders along the river is called West Beach and the reach extending northward from the point at Cape Fear, facing east toward the Atlantic Ocean, is termed East Beach. Oak Island/Caswell Beach is part of a barrier island that covers about 13 miles extending from Lockwoods Folly Inlet on the western end to the Cape Fear River on the east. The eastern half of this island which consists of a portion of Oak Island, Caswell Beach and Fort Caswell, falls within the project monitoring area. Federal Channel Realignment and Deepening. With the signing of the Energy and Water Appropriations Bill on October 13, 1998 three separate projects (Wilmington Harbor Northeast Cape Fear River project, Wilmington Harbor channel Widening Project, and Cape Fear Northeast Cape Fear rivers project) were combined into one known as the 1
14 Figure 1.1 Project Location Map 2
15 Wilmington Harbor, NC 96 Act project. This comprehensive project, with a total estimated cost of $440 million, consists of channel improvements extending from the ocean entrance upstream to just above the Northeast Cape Fear River railroad bridge in Wilmington, some 37 miles. The improvements consist of deepening the ocean bar channel and entrance channel from the authorized depth of 40 feet to 44 feet, beginning at a point approximately 6.7 miles offshore through the Battery Island Channel located 2.9 miles upstream. Continuing from Battery Island Channel to the Cape Fear Memorial Bridge, 24.3 miles, the authorized channel is deepened from 38 feet to 42 feet. This stretch includes a new passing lane and numerous turn and bend improvements, plus channel widening and enlargement of the anchorage basin at the state port facility. The final 2.2 mile stretch of the river spanning along the Wilmington waterfront and beyond, includes deepening the channel from 32 feet to 38 feet to just above the Hilton Railroad bridge and from 25 feet to 34 feet to the upstream limits of the project. The entrance channel improvements, which are most relevant to the monitoring effort, are shown on Figure 1.2. In addition to the 4-foot deepening, the channel was realigned from a southwesterly orientation to a more south-southwest orientation. This 30- degree southern shift in alignment of the Baldhead Shoal Channel was recommended based on achieving significant cost savings (approximately $39 million) by avoiding the removal of rock that existed along the former alignment. The new channel also was widened from 500- feet to as much as 900-ft to accommodate safe ship navigation in the vicinity of the intersection of the old and new alignments. Construction Activity. The realignment and deepening of the entrance channels were accomplished under two dredging contracts. One contract involved dredging of the seawardmost portion of the Baldhead Shoal channel covering the outer 4.5 miles of the new alignment (station seaward). Material dredged from this portion of the new channel consisted of fine silts and sands that were deemed unsuitable for beach disposal. This material was placed in the designated offshore disposal site. Work began in December 2000 and was completed in April 2001 by Great Lakes Dredge and Dock at a cost of $13.6 million. The second contract covered the remaining portions of the entrance channels beginning at the inner section of the Baldhead Shoal Channel through the Snows Marsh reach, a distance of about 9.5 miles. Most of the material dredged from this portion of the river was suitable for beach disposal and was placed on the Brunswick County Beaches. This contract was undertaken by Bean-Stuyvesant for a cost of $64.7 million. Beach disposal began in February 2001 and was completed in April 2002, with the dredging of portions of the channel containing non-compatible material continuing until December Beaches receiving the compatible sand included Bald Head Island, Caswell Beach/eastern Oak Island, western Oak Island and Holden Beach. The Baldhead Island and Caswell Beach/East Oak Island portions were determined to be least costly beach disposal alternatives and material was placed at 100% Federal expense. The other beach placement activities where accomplished under Section 933 authority of the Water Resources Development Act of 1986 where the local government covered the added cost of pumping material to their respective beaches. 3

16 Figure 1.2 Realignment of the Federal Navigation Channel at the Cape Fear River Entrance 4
17 Overall, on the order of 5 million cubic yards of sediment (in-place beach volume measurement) were placed on the Brunswick County beaches under this contract. Table 1.1 summarizes the distribution of volume of material between the beach communities along with placement dates and various other pertinent factors. TABLE 1.1 WILMINGTON HARBOR BEACH DISPOSAL OPERATIONS LOCATION PLACEMENT LIMITS PLACEMENT DATES BEACH VOLUME DREDGE APPROX NORTHING EASTING START STOP (INPLACE) BL STA (ft, NAD83) (ft, NAD83) mm/dd/yyyy mm/dd/yyyy (cy) BALD HEAD ISLAND , ,300, /23/2001 1,849,000 Stuyvesant & Merridian , ,314, /4/2001 OAK ISLAND EAST (CASWELL) , ,295, /5/ ,200 Merridian , ,292, OAK ISLAND EAST , ,289, ,048,600 Merridian , ,272, /12/2001 OAK ISLAND WEST , ,260, /13/2001 1,269,800 Merridian , ,235, /25/2002 Eagle HOLDEN BEACH , ,222, /9/ ,400 Eagle , ,211, /20/2002 Subsequent to the initial construction, plans were made to implement two dredging operations to remove localized high-spots remaining within the authorized channel limits. These two dredging contracts involved removal of unsuitable beach material along the outer channel termed Clean Sweep I and the removal of beach compatible material along the inner channel reaches termed Clean Sweep II. Clean Sweep I contract was awarded in September 2003 and was completed in January The beach disposal operation of Clean Sweep II is scheduled for fiscal year With the timing of Clean Sweep II coming approximately two years after completion of the initial construction, this will be considered the first maintenance dredging of the new channel. In accordance with the sand management plan described below, the beach compatible material dredged during the first cycle is designated for disposal along Bald Head Island. Sand Management Plan. A sand management plan developed for the Wilmington Harbor 96 Act project (USACE 2000) addressed the disposal of beach quality sand during both the construction and maintenance phases of the project. The future maintenance includes the periodic disposal of littoral material removed from the ocean entrance channel on the beaches adjacent to the Cape Fear River Entrance. The goal of the sand management plan is to make the best use of littoral sediments during maintenance of the project and return beach compatible material back to the adjacent beaches. This is in keeping with the state of North Carolina policy to insure that beach quality sand is not removed from the active beach system. The results of wave transformation/sediment transport analysis conducted by the U.S. Army Corps of Engineers Coastal and Hydraulics Lab (Thompson, Lin, & Jones 1999) for the Wilmington District found that the distribution of sediment transport at the Cape Fear entrance was such that two-thirds of the material comes from Bald Head Island and one-third 5
18 is derived from Oak Island/Caswell Beach. In order to maintain the sediment balance on both islands, littoral material removed from the entrance channel will be placed back on the beach from whence it came in the same distribution. Accordingly, two out of every three cubic yards of littoral shoal material removed from the entrance channel will be placed back on Bald Head Island and the remaining cubic yard placed on east Oak Island/ Caswell Beach. Maintenance of the channel is planned to take place biennially. In order to accomplish this two-to-one distribution, the littoral shoal material removed from the entrance channel for maintenance would be placed on Bald Head Island in years 2 and 4 following the construction of the new ocean entrance channel and on Caswell Beach-Oak Island during year 6. Accordingly, one full maintenance cycle would take 6 years to complete. Each maintenance operation is expected to involve the removal and disposal of approximately 1,000,000 cubic yards of beach material. The disposal locations on each island are to be based on the measured beach response during the operation of the project as determined by the monitoring program. The overall disposal lengths include 16,000 feet on Bald Head Island and 25,000 feet along Oak Island/Caswell Beach. The 16,000-foot reach on Bald Head Island includes approximately 14,000 feet of South Beach and 2,000 feet of West Beach. The disposal boundary on Oak Island/Caswell Beach, nearest to the Cape Fear River entrance, falls along the eastern town limits of Caswell Beach (located approximately 2,500 feet west of the river entrance) and extends westward along Oak Island. Actual disposal locations are planned to fall within the above limits, but may not cover the entire area on any given operation. Monitoring Program Scope. The monitoring program is designed to measure the response of the adjacent beaches, shoaling patterns in the entrance channel, and changes in the ebb tide delta of the entrance channel beginning immediately before initial construction and continuing throughout the operation and maintenance of the project. The results of this monitoring program will be used to make necessary adjustments in the beach disposal location for the littoral material removed from the entrance channel and to document the response of the adjacent beaches to the deepening and alignment changes of the entrance channel. Program Elements. The present monitoring program consists of five basic elements namely; beach profile surveys, channel and ebb tide delta surveys, wave and current measurements, aerial photography, and data analysis/reporting. The data collection effort is a large undertaking and involves numerous entities including the Corps of Engineers, private contractors, and academia. The Wilmington District manages the program and is responsible for project coordination, funding, data analysis and report preparation. The majority of the data collection is accomplished by the U.S. Army Engineer Research and Development Center, Coastal and Hydraulics Laboratory, Field Research Facility (FRF) located in Duck, North Carolina. The FRF is responsible for obtaining the offshore beach profile surveys, ebb shoal surveys, wave and current measurements, and associated data reduction, quality control, and analysis. The wave/current gauges are operated by Evans Hamilton, Inc (EHI) 6
19 through the FRF and the detailed ebb tide delta and shipboard current surveys are performed by the Virginia Institute of Marine Science, through EHI. The remaining monitoring tasks, specifically the onshore beach surveys and aerial photography, are obtained by the Wilmington District through the use of private companies. The onshore beach profiles have been surveyed by McKim & Creed Engineering; whereas, the aerial photos have been provided under contract with Barton Aerial Technologies, Inc. and Nova Digital Systems, Inc. The basic program elements are described in the following paragraphs. Beach Profile Surveys. The beach profile surveys serve as the backbone of the monitoring program and are taken along both Bald Head Island and Oak Island/ Caswell Beach. The beach surveys consist of specified transects, or profiles, taken generally perpendicular to the trend of the shoreline. For Bald Head Island, the beach profiles begin at the entrance to the Bald Head Island marina on West Beach, and extend all the way to Cape Point, located at the eastern end of South Beach as shown in Figure 1.3. The location of these profile stations were selected to coincide with existing beach profile stations currently being monitored by the Village of Bald Head Island, which are spaced at an interval of approximately 400 feet. The total shoreline distance covered along Bald Head Island is about 22,000 feet and includes a total of 58 beach profile stations. For the Oak Island/Caswell Beach portion, beach profile stations were established at approximately 500- foot intervals, beginning near the Cape Fear River Entrance and extending west along Caswell Beach/Oak Island, as shown in Figure 1.4. This coverage includes approximately 5,000 feet of shoreline fronting the North Carolina Baptist Assembly grounds at Fort Caswell (2,500 ft along the inlet shoulder and 2,500 ft along the ocean-front) plus 26,000 ft along Oak Island extending west of the Baptist Assembly property. The beach profile stations extend 1000 feet westward of the designated disposal limit on Oak Island and encompass a total shoreline length of 31,000 feet. A total of 62 profile lines comprise this shoreline reach. The profile locations follow along an existing baseline established by the Corps of Engineers that had designated profile stations at 1,000 foot intervals. The monitoring plan added intermediate lines at 500-feet and utilized the pre-existing 1,000 foot stations so that prior surveys could be incorporated into the program as necessary. The designated assigned profile numbers as shown on the figures are correlated to their respective location along the established baseline for each transect location. For example, Profile 310 on Oak Island (the last line) corresponds with baseline Station , and is approximately 31,000 from the inlet entrance. The beach profile surveys are taken semi-annually and are scheduled to coincide with the spring (April-May) and fall (October-November) seasons. During the spring survey all profiles are surveyed with coverage over the onshore portion of the beach. The onshore survey coverage extends from the landward limit of the profile line (a stable point beyond the back toe of the dune) seaward to wading depth. During the fall the onshore coverage is repeated; however, the coverage of every other line is extended offshore to a seaward distance of 15,000 feet or to a depth of 25 feet. The survey data are reported with respect to the National Geodetic Vertical Datum (NGVD) 1929 and North American Datum (NAD) 1983 horizontal datum. 7

20 Figure 1.3 Bald Head Island Beach Profile Locations 8

21 Figure 1.4 Oak Island/Caswell Beach Profile Locations 9

 vehicle, shown in Figure 1.5, is uniquely designed to transit through the water, across shoals, through the surf zone up to the base of the beach dunes.")
22 The most difficult areas to obtain accurate bathymetric surveys are through the surfzone and over the shoal areas that border each side of the Cape Fear entrance channel, and those near Frying Pan Shoals. Access to these locations is very difficult for conventional watercraft due to breaking waves and shallow depths. Under the present monitoring effort these access problems are largely eliminated through the use of the FRF s LARC survey system. The LARC (Lighter Amphibious Re-supply Cargo) vehicle, shown in Figure 1.5, is uniquely designed to transit through the water, across shoals, through the surf zone up to the base of the beach dunes. The LARC is equipped with a Trimble Real-Time Kinematic Global Positioning Satellite (RTK-GPS) survey system for accurate horizontal and vertical positioning of the vehicle and a Knudsen Echosounder to measure depth while traversing the profile lines. Figure 1.5 FRF Hydro-LARC Survey System Channel and Ebb Tide Delta Surveys. The Corps of Engineers routinely surveys the condition of the ocean entrance channel from the Smith Island Range seaward to the Bald Head Shoal Range about once every three months. The area covered by these surveys includes the entire width of the authorized channel and some limited areas adjacent to the channel but outside the channel prism lines. Additional surveys are obtained associated with numerous dredging contracts that will continue during the future maintenance of the channel. The realignment of the seaward portion of the Bald Head Shoal Range is expected to be accompanied by a reconfiguration in the shape of the ebb tide delta. The major change expected is the reorientation of the western portion of the ebb tide delta with the reoriented delta essentially paralleling the alignment of the new channel. To monitor these changes, 10
23 detailed surveys of the offshore area encompassing the entire ebb tide delta are accomplished on an annual basis. The surveys are scheduled to coincide with the offshore beach profile surveys so that the coverage can be combined where applicable. The general extent of the ebb delta surveys is indicated on Figure 1.6. The bathymetric data over the ebb shoal area are collected using a very detailed and accurate Submetrix Interferometric (SI) System. This system collects swath bathymetry and sidescan sonar from a hull-mounted transducer. Horizontal and vertical accuracy, when coupled with RTK-GPS and a motion sensor is cm (6-8 inches). Unlike traditional multi-beam systems, the SI maintains a swath width of 8-10 times the water depth and simultaneously collects both depth and seabed reflection properties. This system performs particularly well in shallow waters, ranging from 2-20 meters (6 to 66 feet) and produces swath soundings at 2 meter (6 foot) grid spacing. Wave and Current Measurements. Wave and current measurements are also included as an integral part of the monitoring program. Three bottom-mounted gauges have been positioned in the project area in the ocean as shown in Figure 1.7. One gauge is located immediately offshore of Bald Head Island in 19 feet of water, the second is located just offshore of Oak Island (23 feet water depth), with the third positioned in 42 feet of water 11 miles offshore. The outer gauge was positioned to measure wave and water level data seaward of the navigation channel and ebb shoal influence. The nearshore gauges provide data in the vicinity of the navigation channel, nearshore shoals and adjacent beaches. A fourth gage was temporarily deployed just inside the entrance channel of the river where it was periodically moved to three locations. This gauge is not presently being utilized. All gauges consist of a combination of an Acoustic Doppler Current Profiler (ADCP) meter and a pressure gauge. This combination is capable of producing measurements of wave height, period and direction, water level (tide and surges) as well as currents over the water column. Water temperature near the bottom is also recorded. The sensors are mounted in a steel framed pod for protection from trawlers and are self-recording. Both the Bald Head and Oak Island gauges have been hard-wired to shore and as such produce near real time data acquisition which may be accessed via the Internet. Data are reported at 1-hour intervals; however, the shore connection on the Bald Head gauge is inoperable at this time. The 11- mile gauge records data every 3 hours. In addition to fixed bottom mounted gauges described above, currents are also measured along specified transects across the mouth of the Cape Fear River and near the new channel realignment. These measurements are recorded using a downward-looking, shipboard-mounted current profiler, which operates along the two closed loops as shown in Figure 1.8. The vessel navigates along the tracks over a complete tidal cycle to capture both ebb and flood flows as well as the entire tidal prism. Current surveys are accomplished annually corresponding with the ebb tide delta survey. Aerial Photography. Vertical color aerial photographs are taken yearly generally near the time of the spring profile survey. The over-flight for this monitoring effort is part of a larger project that provides aerial coverage from the North Carolina-South 11
24 Figure 1.6 Entrance Channel and Ebb Tide Delta Survey Coverage 12
25 Figure 1.7 Wave and Current Gauge Locations 13

26 Figure 1.8 Shipboard Current Profile Locations 14
27 Carolina state line northward to Cape Lookout. The nominal scale of the photography is 1 inch equals 1000 feet over the entire project area and 1 inch equals 500 feet for the Wilmington Harbor monitoring area. The larger scale print coverage extends from the westward beach disposal limit on Oak Island to the eastern end of South Beach on Bald Head Island. Data Analysis and Reporting. With the completion of this initial report, subsequent reports summarizing the monitoring activity will be prepared on an annual basis. Each report will include an analysis of the observed changes and trends along the adjacent beaches and a comparison to expected or historical trends. The report will also include an assessment of the shoaling patterns in the ocean entrance channel, temporal changes in the ebb tide delta and an analysis of the wave and current measurements. This report will also be provided to the Village of Bald Head Island, the Town of Caswell Beach, the Town of Oak Island, and interested parties for their review and comment. Bald Head Island Monitoring Survey Program. Surveys from September 1996 to December 2002 were taken as part of a monitoring program implemented by the Village of Bald Head Island and were provided to the District by Olsen Associates, Inc. Table 1.2 is a listing of the dates and coverage for the Village of Bald Head Island monitoring surveys. Table 1.2 Village of Bald Head Island Beach Profile Surveys Date of Survey Range of Stations On Shore Off Shore September 20 to 166 X March 20 to 166 X June 20 to 162 X September 24 to 162 X March 20 to 162 X June 20 to 162 X September 20 to 158 X December 24 to 166 X March 24 to 166 X November 0 to 218 X X November 0 to 214 X X August 8 to 210 X X July 8 to 210 X X December 0 to 222 X X 15
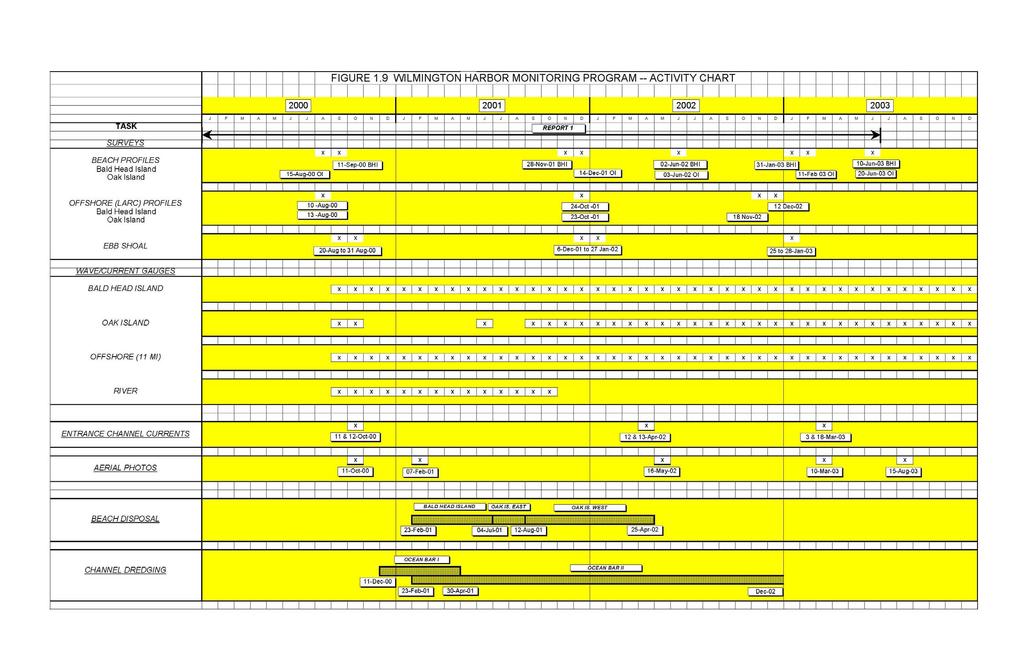
28 Activities to Date. Data collection for the Wilmington Harbor monitoring program began in August 2000 prior to the dredging of the entrance channel. This report covers the monitoring activity through the June 2003 beach survey and therefore spans an initial period of nearly three years. To date there have been five onshore beach profile surveys (Aug-Sep 2000, Nov-Dec2001, June 2002, Feb 2003 and June 2003), three offshore beach profile surveys (Aug 2000, Oct-Nov-2001, and Nov-Dec 2002) and three surveys of the ebb tide delta (Aug-Sep 2000, Dec-Jan 2002 and Jan 2003). Additional surveys of portions of the beach were also conducted before, during and after placement of the various beach disposals associated with the dredging contract. With respect to the wave/current meters, all four instruments were initially deployed in September The Bald Head gauge and the offshore 11-mile gauge have generally been in continuous operation throughout the initial monitoring period except for servicing and occasional data outage. The Oak Island gauge was damaged in October 2000 by a trawler about one month after deployment. The gauge remained inoperative until September 2001, except for a brief period in June 2001, and has been collecting data since. The river gauge was in operation from September 2000 through September 2001 as it was cycled between three sites near the river entrance. The shipboard current measurements were taken on three occasions. These data were collected in October 2000 with the initial data collection effort and in the spring of 2002& 2003 (April 2002 & March 2003). Additionally, aerial photographs were taken on the following dates: October 11, 2000, February 7, 2001, May 16, 2002, and March 10, Figure 1.9 gives a time line activity chart that summarizes all tasks undertaken to date. Also included on the activity chart are the dredging periods for the entrance channel and associated beach disposal time frames. As discussed earlier in this report, this work was accomplished under two contracts. One contract, commonly known as Ocean Bar I, covered the outer bar channel, (Bald Head Shoal-Outer Reach). The second, Ocean Bar II, covered Bald Head Shoal-Inner channel plus the lower river channel ranges of Smith Island, Bald Head-Caswell, Southport, Battery Island, Lower Swash, and Snows Marsh. Dredging on Ocean Bar I began in December 2000 and was completed April 2001, with all the material being removed and deposited in the designated ocean disposal site. Ocean Bar II work involved removal of beach compatible sediments as well as fine silts and clays designated for offshore disposal. Dredging of Ocean Bar II commenced February 2001 with disposal on Bald Head Island. The Bald Head placement was completed in early July 2001 and the disposal was then initiated on Eastern Oak Island/Caswell Beach. This segment was finished in August 2001 followed by completion of the Oak Island West beach disposal in April The overall Ocean Bar II contract, including the dredging of non-suitable beach material was completed in December
29 17
30 Part 2 HISTORIC INLET AND SHORELINE CHANGES Cape Fear River Entrance Channel and Shoals Entrance Channel Deepening History. Significant navigation improvements of the Cape Fear River entrance began in 1871 with the construction of a 12-foot deep and 100-foot wide channel along the general alignment of the Bald Head Shoal Channel. Prior to the dredging of this bar channel, the Cape Fear entrance was characterized by two equally sized channels, the Western Bar Channel and Bald Head Shoal Channel. Subsequent improvements in the ocean bar channel are summarized below in Table 2.1. Table 2.1 Cape Fear River Entrance Channel Improvements Year Constructed Depth (ft, MLW) Width (ft) Channel Alignment Changes. Prior to the initiation of bar channel dredging, the Bald Head Shoal Channel meandered from a south-southeasterly direction, or almost parallel to the south beach on Bald Head Island, to a southwesterly alignment. As bar channel dredging intensified, beginning with the 20-foot by 270-foot channel in 1892, the orientation and location of the Bald Head Shoal Channel became fixed at a southwesterly alignment. This general alignment was been maintained until 2001, until the channel was deepened and realigned along the present more southerly approach. Offshore Shoal Response. Detailed analysis of the offshore shoal response is contained in the 1989 reconnaissance report by the Wilmington District (USACE 1989) and is summarized in this section. Transect data from surveys done in 1851, 1872, and 1974 were used to determine changes in the offshore shoals. Between the years 1851 and 1872 there was a significant build-up of material off the west end of Bald Head Island and immediately seaward of the river entrance. Also, the nearshore zone just west of Cape Fear experienced significant accretion. The nearshore accretion of the west end of Bald Head Island was the result of the onshore movement of the shoals that bordered on the 1851 channel. With the movement of the Bald Head Shoal Channel back to the west, the remnant shoals were being driven onshore by wave action and would eventually weld onto the beach. The accumulation of sediment seaward of the Cape Fear River entrance was accompanied by an area of significant scour just inshore. These entrance changes were probably due in part 18
31 to the shifting of the Bald Head Shoal Channel but may also have been caused by some rather severe hurricanes between 1851 and From 1872 to 1923, the Bald Head Shoal Channel was maintained in a relatively stable position by dredging. This allowed the remnant shoal of the 1851 channel to completely weld to the west end of Bald Head Island. During these years the ebb tide delta was reshaping as a large accumulation of material was detected west of the entrance channel. Also, a large deposit formed offshore of the east end of Bald Head Island while the area offshore of the western half of the island deepened. For the period from 1872 to 1974, there was a large build-up of material west of the entrance channel and a smaller yet significant accumulation immediately to the east of the channel. Also, a large deposit formed offshore of the east end of Bald Head Island while the offshore area at the west end deepened. Jay Bird Shoal has accumulated material at an increasing rate since dredging of the Bald Head Shoal Channel began in the late 1800 s. Some of this accumulation may have been the result of earlier dredge material disposal practices when material was deposited west of the bar channel. However, the major part of this accumulation was apparently due to the reconfiguration of the river s ocean shoal from its previous bulbous shape to its present deltalike plan-form. Shoreline Change Mapping. General. A history of shoreline changes for the study area was developed by comparing shoreline positions shown on historic maps and interpreted from aerial photos for both Bald Head Island and Oak Island/Caswell Beach. Dates were selected to capture time spans that demonstrated overall trends in shoreline behavior and to illustrate the degree of variability of recorded shoreline positions. Dates for Bald Head Island cover from 1855 to 1996 while Oak Island/Caswell Beach side spans from 1933 to All shorelines are shown superimposed over a base map consisting of 2002 aerial photography. Bald Head Island. Figure 2.1 of Bald Head Island depicts a shoreline advance of the west end of south beach of approximately 2,300 ft over the 71 year period from 1851 to During this same time the east end of South Beach experienced approximately 700 ft of shoreline recession. Navigation improvements to the Cape Fear River entrance channel throughout this time included deepening from 16 to 30 ft (see prior Table 2.1). Figure 2.2 shows a 63-year period ( ) where Bald Head Island shorelines were relatively more stable when compared to the prior period. On the west end of South Beach, shoreline advance occurred between 1926 and 1962, then recession from 1962 to 1974, stability until 1985 followed by rapid recession to For the data that exists on the 19
32 east end of south beach, similar shoreline change is observed with advance 1926 to 1974 followed by recession to During the most recent period of 1989 to 1996, the shorelines along the western approximate third of South Beach continued to erode with the remaining portions of South Beach having a stable tendency (Figure 2.3). This general shoreline response has continued until present being influenced somewhat by the 2001 beach disposal along Bald Head Island. Detailed measurements and discussion of the most recent shoreline movements (since 2000) are given later in Parts 3 and 4 of this report. Oak Island/Caswell Beach. Figure 2.4 shows Oak Island with shorelines from 1933 to During this 50-year period of time the eastern tip of the island, which runs parallel with the entrance channel, experienced significant shoreline advance of up to 600 ft. Over this same time, the south-facing portion of the east end of the island experienced shoreline advance of 80 to 200 ft. From 1983 to 1996, Figure 2.5, shows the portion of the east end of the island which runs parallel with the entrance channel continued to advance while the south facing portion of the island experienced shoreline recession of up to 100 ft in some locations. Recent shoreline movements along Oak Island/ Caswell Beach since 2000 are discussed in more detail in Parts 3 and 4. 20

33 Figure 2.1 Bald Head Island Shorelines ( ) 21
34 Figure 2.2 Bald Head Island Shorelines ( ) 22
35 Figure 2.3 Bald Head Island Shorelines ( ) 23

36 Figure 2.4 Oak Island Shorelines ( ) 24

37 Figure 2.5 Oak Island Shorelines ( ) 25
38 Shoreline Change Rates State Erosion Rates. Rates of shoreline change have been calculated for the entire coastline of North Carolina by the NC Division of Coastal Management (NCDCM). These data are used for planning and regulatory purposes in establishing construction setback distances along the ocean front shoreline. The shoreline changes are representative of longterm average annual rates based on the comparison of shoreline locations interpreted from historic aerial photos. The shoreline position is recorded from a common shore parallel baseline along fixed transects that run at right angles to the base line. Transects are spaced every 50-meters (164 feet) along the coastline and are grouped in individual base maps consisting of 72 transects each. Each base map covers about 3.6 km (2.2 miles) of coastline. In reporting the shoreline change data, the NCDCM uses the end point method that compares the earliest shoreline position with most recent position and divides the shoreline change by the time interval between the two dates. An alongshore average is then used to smooth out smaller perturbations along the coast. This running average uses 17 adjacent transects consisting of eight transects on either side of the transect of interest. For this study NCDCM shoreline position data were combined with the initial monitoring survey of Aug/Sep 2000, taken immediately prior to the channel deepening and realignment. The NCDCM data included shoreline positions taken from aerial photos dated 1-Apr 38, 16-Aug 59, 8-Dec 80, 25-Aug 86 and 1-Sep 92. Average annual shoreline change rates were computed by taking a least-squares fit of all the shoreline positions spanning the dates 1938 through A running alongshore average, as noted above, was then computed from the least squares fit data. The final computations represent long-term shoreline change rates for the monitoring area spanning more than 62 years before the new channel work was initiated. These long-term pre-construction rates are given in Figure 2.6 for Oak Island/Caswell Beach and in Figure 2.7 for Bald Head Island. Later in Part 3 of this report, these computed rates are compared to the rates calculated over the initial monitoring period (i.e. the initial post-construction period). Oak Island/Caswell Beach Shoreline Change Rates. Figure 2.6 covers about 6 miles of coastline along Oak Island/Caswell Beach just west of the Cape Fear entrance. The trend in long-term shoreline change rates show a general erosion pattern along the western twothirds of the area and accretion along the remaining third nearest the river entrance. The erosion rates range from 2 feet per year at the western end of the study area, to a maximum erosion of nearly -6 feet per year, which occurs near the boundary line between Oak Island and Caswell Beach. The erosion then diminishes moving eastward from the peak eventually turning accretionary at a point about 2000 feet to the east of the CP&L canal area. From this point eastward the beach has historically been stable showing rates of accretion ranging from 1 to 2 feet per year to a maximum of more than 30 feet per year along the tip of Fort Caswell. Bald Head Island Shoreline Change Rates. As shown on Figure 2.7, the long-term trend in shoreline change for Bald Head Island is one of erosion. The erosional pattern along 26
39 the 3-mile extent of South Beach shows relatively higher erosion both at the western and eastern ends with more stability along the central reach. The pattern holds true except for a few transects nearest the river entrance that are found to be accretionary at the southwestern tip of Bald Head. Proceeding eastward from this stable area is an erosion zone covering about one mile where the rates range from 2 feet per year to a maximum of 6.6 feet per year. The rates then range from 2 to 3 feet per year average along the central portions of South Beach. Eastward beyond this relatively more stable reach the rates gradually increase towards Cape Fear reaching a maximum erosion rate of about 20, feet per year. 27

40 28 Figure 2.6 Long-Term Average Annual Shoreline Change Rates ( ) Oak Island/Caswell Beach
")
41 Accretion (ft/yr) Erosion (ft/yr) Figure 2.7 Long-Term Average Annual Shoreline Change Rates ( ) Bald Head Island 29

42 Erosion Control Activities at Bald Head Island To combat the erosion that Bald Head Island has been experiencing since the early 1970's, there have been four beach disposal projects and a groin field constructed on the island. These operations have concentrated on the south-western portion of Bald Head Island where erosion problems have been most acute. Three beach disposals of approximately 360,000 cubic yards in 1991, 650,000 cubic yards in 1996, and 450,000 cubic yards in 1997 were placed with slight variations of the start and stop locations between stations and In 2001, 1,849,000 cubic yards were placed between stations and in conjunction with the entrance channel realignment and deepening. In 1996, sixteen geo-textile groins were constructed from station to Station The groins were 9 feet in diameter and 325 feet long. The spacing between the groins was 400 feet. The groin field slowed the erosion for several years before they ceased to function in A permit to repair a 641-foot-long existing sand bag revetment was applied for in January The sand bag revetment, shown in Figure 2.8, is located along South Bald Head Wynd between stations and The existing structure was authorized under permits issued in 1994 and Figure 2.8 Sand Bag Revetment along South Bald Head Wynd, April
43 Part 3 DATA ANALYSIS AND RESULTS FROM FIRST MONITORING CYCLE General. Data collection for the monitoring program was initiated in August 2000 just prior to construction of the entrance channel improvements. This part of the report describes the data collected to date and results through June The following discussion covers the four main data collection efforts, namely: Shoreline and Volumetric changes from the Beach Profile surveys, Ebb and Nearshore Shoal response, Wave Data, and Current measurements in the entrance channel. Figure 3.1 shows a typical profile plot of the survey data used in the Shoreline Change and Volumetric Change analysis. Figure 3.2 shows shoreline positions derived from the profile data. The shoreline was determined by the mean high water line. The mean high water line is 2.71 feet above the National Geodetic Vertical datum (NGVD29) for the monitoring area. Figure 3.1 Bald Head Island Profile
44 Shoreline Position (Feet) March-00 October-00 April-01 November-01 May-02 December-02 June-03 January-04 Date Profile 61 Figure 3.2 Wilmington Harbor Monitoring Shoreline Positions - Bald Head Island Profile 61 Beach Profile Analysis-Shoreline and Profile Change Bald Head Island. Beach fill placement was performed from approximate stations through during the February July 2001 time frame. Shoreline changes during the initial monitoring cycle for Bald Head Island are shown in Figure 3.3. This figure shows the changes in the shoreline through the June 2003 survey relative to the September 2000 shoreline positions. The beach profile locations were given previously in Figure 1.3. It should be noted that the beach profile names are reflective of their location on the baseline. For example, the origin of beach profile 43 is located near station on the Bald Head Island baseline. Monitoring profiles 0 through 24 along west beach show relatively stable shoreline positions over the monitoring period. Net changes through June 2003 ranged from 11 feet (erosion) and +37 feet (accretion). Profiles 28 through 53 (approximately 2500 ft along the beach) are generally in the area of the Bald Head spit adjacent to the Wilmington Harbor navigation channel. Most of this area shows a highly variable shoreline. For example, in Figure 3.3 profile 40 accreted 138 feet between November 2001 (post construction) and June 2002, then eroded 174 feet by June 2003, resulting in a net accretion of 122 feet over the monitoring period (i.e., since September 2000). Other than this profile and profile 36, all profiles in this area show erosion, ranging from 29 to 128 feet, from June 2002 to the June 2003 survey at the end of the monitoring period. An example of profile data in this area is shown in Figure
45 Profiles 57 through 218 are located along Bald Head Island s south beach. Figure 3.3 shows the fill placed in the majority of this area reflected by the positive shoreline change shown in October and November As can be seen, the fill area has been subjected to erosion since November The highest net erosion through June 2003 since November 2001 occurred at profile 61 with a value of 134 feet. The magnitude of erosion somewhat uniformly decreases to the eastern limit of the beach fill placement (station ). Areas east of and including profile 198 all show a net accretion since November 2001, with values up to 42 feet. Overall, for the fill area along South Beach east of Profile 57, the first 4500 feet (Profile 57 thru Profile 102) have negative shoreline changes and the remaining 10,350 feet have positive shoreline changes as of June An example of profile data in this area is shown in Figure 3.5. Offshore profile change on Bald Head Island near Bald Head spit (STA and 53+00, see Fig 1.3 for STA locations) between 2000 and 2004 is depicted in Figures 3.6 and 3.7. Of note is the apparent development of a possible marginal flood channel near 10 ft NGVD. 33
46 Shoreline Change (feet) FILL AREA through Beach Profile Location 2001 Oct 2001 Nov 2002 Jun 2002 Dec 2003 Feb 2003 Jun Figure 3.3 Wilmington Harbor Monitoring Shoreline Change from Pre-Construction Survey (September 2000) - Bald Head Island 34
47 Figure 3.4 Bald Head Island Profile 047 Figure 3.5 Bald Head Island


48 Figure 3.6 On/Offshore Profile Bald Head Island STA Figure 3.7 On/Offshore Profile Bald Head Island STA
49 Oak Island. Shoreline changes during the initial monitoring cycle for Oak Island are shown in Figure 3.8. This figure shows the changes in the mean high water line (termed shoreline hereafter) position relative to the August 2000 shoreline positions (Refer back to Figure 1.4 for the beach profile locations). As with Bald Head Island, the profile names are reflective of their location on the baseline. The beach fill for this area of Oak Island, as indicated on the figure, was placed approximately from stations to (plus 1000 foot transitions at both ends) and from station to , during the July August 2001 time frame. A 1000-foot transition was also constructed from station to Figure 3.8 clearly shows the positive shoreline change due to the sand placement. Overall, the shoreline along the Oak Island monitoring area has been stable or slightly eroding since the first post construction survey, December The significant accretion west of station was due to sand placement from another project, The Sea Turtle Habitat, which was constructed between August 2000 and December Note, the Sea Turtle Habitat material and the subject Wilmington Harbor disposal material for Oak Island were placed with no gap between them. The shoreline from profile 5 through 60 along the eastern tip of Oak Island has been variable over the monitoring period. The shoreline from profile 5 through 20 has been mostly stable. According to the June 2003 survey, localized accretion of 84 feet has occurred at station 30. Net erosion values up to 96 feet were recorded in the June 2003 survey for profiles 35 through 45. Profiles 50 through 60 show a stable or accreting shoreline. Profiles 65 through 85 (approximate area of easternmost fill) have shown net erosion up to 48 feet between December 2001 and June 2003 survey. However, it should be noted that there is still a net positive shoreline change, ranging from 56 to 93 feet for these profiles, relative to the August 2000 (pre construction) survey. An example of profile data in this area is shown in Figure 3.9 for Profile 80. The area with no fill placed from approximately station to has shown a net positive shoreline change since construction. This is most likely due to sand migrating alongshore from the fills placed on either side. Profiles 125 through 305 show moderate erosion between the December 2001 and June 2003 surveys with some profiles showing slight accretion. The highest erosion value in this area was 59 feet at profile 125. The highest accretion value in this area was 21 feet at profile 280. By June 2003 the shoreline along this entire fill reach is between 100 and 175- feet seaward of the August 2000 location. An example of profile data in this area is shown in Figure 3.10 for Profile 220. Profile 310 shows an erosion value of 82 feet. This profile location is within the boundary of the neighboring project, The Sea Turtle Habitat. The Sea Turtle Habitat was constructed with a shoreline protruding farther seaward than the shoreline constructed for the Wilmington Harbor disposal. With profile 310 being at the eastern limit of the Sea Turtle Habitat project, the erosion shown by this profile is possibly due to end losses from the Sea Turtle Habitat fill 37
50 FILL AREA FILL AREA Shoreline Change (feet) Beach Profile ID 2001 Dec 2002 Jan 2002 Jun 2002 Dec 2003 Feb 2003 Jun Figure 3.8 Wilmington Harbor Monitoring Shoreline Change from Pre-Construction Survey (August 2000) - Oak Island 38
51 Figure 3.9 Oak Island Profile 80 Figure 3.10 Oak Island Profile
52 Beach Profile Analysis-Volumetric Change General. Investigations of volume changes between surveys along the same profiles were made to get an indication of volume loss or gain for the disposal materials placed on the beach. Table 3.1 shows the data sets available, by which volume change observations were made. Table 3.1 Beach Surveys Used for Volume Change Observations Survey Beach Long shore Cross-shore Coverage Date Island Survey Type Coverage 2000 Aug Oak Onshore/Offshore Monitoring Beach Berm out approx 16,000 feet 2000 Aug Oak Onshore Monitoring Landward of Dune out to Wading Depth 2001 Jul - Oct Oak Onshore/Offshore After Dredge Seaward Toe of Dune out 2200 ft 2001 Dec Oak Onshore Monitoring Landward of Dune out to Wading Depth 2002 Jan Oak Onshore/Offshore Monitoring Beach Berm out approx 16,000 feet 2002 Jun Oak Onshore Monitoring Landward of Dune out to Wading Depth 2002 Dec Oak Onshore/Offshore Monitoring Beach Berm out approx 16,000 feet 2003 Feb Oak Onshore Monitoring Landward of Dune out to Wading Depth 2003 Jun Oak Onshore Monitoring Landward of Dune out to Wading Depth 2000 Aug Bald Head Onshore/Offshore Monitoring Beach Berm out approx 16,000 feet 2000 Sep Bald Head Onshore Monitoring Landward of Dune out to Wading Depth 2001 Mar - Jul Bald Head Onshore/Offshore After Dredge Seaward Toe of Dune out 2200 ft 2001 Oct Bald Head Onshore/Offshore Monitoring Beach Berm out approx 16,000 feet 2001 Nov Bald Head Onshore Monitoring Landward of Dune out to Wading Depth 2002 Jun Bald Head Onshore Monitoring Landward of Dune out to Wading Depth 2002 Dec Bald Head Onshore/Offshore Monitoring Beach Berm out approx 16,000 feet 2003 Jun Bald Head Onshore Monitoring Landward of Dune out to Wading Depth 40
53 The After Dredge surveys were performed at successive sections of the disposal area as the disposal activity progressed down the beach. The purpose of the After Dredge surveys was to document the quantity of material placed. However, this information can also be combined with the surveys within the monitoring area. Volumetric changes during the initial monitoring cycle are shown in Figures 3.11 through 3.14 for Bald Head Island and 3.15 through 3.16 for Oak Island. Comparisons between the onshore/offshore surveys were made to varying elevations (Tables 3.2 and 3.3), based on observed depths of closure between the monitoring surveys. Comparisons between the onshore surveys were made to the elevation 2 feet NGVD. Volume magnitudes shown in the figures and stated in the following sections are derived using average end area method. That is, the volume difference is calculated at each profile as a cubic yard per foot of beach (cy/ft). Then, the cy/ft values for two profiles were averaged, and the average applied over the distance between the two profiles, for a resultant volume in cubic yards (cy). So, based on this, it should be noted that the volume shown at each profile location actually represents the volume between that station and next higher station value. 41
54 Table 3.2 Lower Elevation Limit for Onshore/Offshore Volumetric Comparison Oak Island Beach Observed Depth of Calculated Island Profile ID Closure (FT NGVD 29) from trend line Oak Island 5-50 Oak Island Oak Island Oak Island Oak Island Oak Island Oak Island Oak Island Oak Island Oak Island Oak Island Oak Island Oak Island Oak Island Oak Island Oak Island Oak Island Oak Island Oak Island Oak Island Oak Island Oak Island Oak Island Oak Island Oak Island Oak Island Oak Island Oak Island Oak Island Oak Island Oak Island Oak Island Oak Island Oak Island
55 Table 3.3 Lower Elevation Limit for Onshore/Offshore Volumetric Comparison Bald Head Island Observed Depth of Calculated Beach Island Profile ID Closure (Ft NGVD 29) from trend line Bald Head 0-22 Bald Head 8-25 Bald Head Bald Head 24-6 Bald Head Bald Head Bald Head Bald Head Bald Head Bald Head Bald Head Bald Head Bald Head Bald Head Bald Head Bald Head Bald Head Bald Head Bald Head Bald Head Bald Head Bald Head Bald Head Bald Head Bald Head Bald Head Bald Head Bald Head
56 Bald Head Island: Onshore Surveys Compared to After Dredge Surveys: When comparing the volume changes for the onshore surveys, loss is the prevailing trend for most of the survey dates and for most of the locations on Bald Head Island (see Figure 3.11). The largest losses are around the spit and the portion of South Beach closest to the inlet. Through June 2003, 331,000 CY of material was lost above 2 NGVD for profiles The remaining portions of the beach lost 177,000 CY, for a cumulative loss of 508,000 CY Post-construction Surveys compared to Pre-construction Survey: The onshore/offshore post-construction monitoring surveys (October 2001 and December 2002) were both compared to the pre-construction (August 2000) survey (see Figure 3.12). This was done to compare the health of the beach to the before construction condition. As indicated previously, this comparison includes profiles around West Beach. Most of West Beach (profiles 0 through 32) shows stability with gains of 82,000 CY through October 2001 and 73,000 CY through December Although the western portion of South Beach (profiles 40 through 88) showed a gain of 24,000 CY in October 2001, a net loss of 265,000 CY occurred by December The remainder of the monitoring area (profiles 97 through 210) showed gains of 1,211,000 CY by October 2001 and 584,000 CY by December This area includes profiles 202 and 210, which show relatively large losses, compared to the remainder of the monitoring area. These profiles are closest to Cape Fear, and the volume change there is likely affected by the unstable environment at that location. Based on this comparison, it can be concluded that West Beach and the eastern portion of South Beach are volumetrically healthier than before initiation of construction. However, the western portion of South Beach is not as healthy as before initiation of construction. An analysis of Bald Head spit volume growth was conducted by examining 45 navigation channel surveys between January 1994 and May Figure 3.13 shows the area used in calculating spit volume, and Figure 3.14 shows the volume of sand contained in the spit with respect to time above 46 ft MLLW. Between 1993 and early 2003, the spit volume varied between 50,000 and 100,000 cubic yards. In the past year, the spit volume has approached 200,000 cubic yards. In addition, during this time, the thalweg (deep water) of the river in the vicinity of the spit has naturally shifted northeastward outside of the channel prism (see Figure 3.15 between channel STA and 25+00). 44
57 Cubic Yards Beach Profile ID November-01 June-02 February-03 June-03 Figure 3.11 Wilmington Harbor Monitoring Bald Head Island Beach Profile Volume Change since After-Dredge Survey (march July 2001) Onshore Only Profiles down to 2 ft NGVD 45
58 y Cubic Yards Beach Profile ID December Onshore/Offshore December Onshore/Offshore Figure 3.12 Wilmington Harbor Monitoring Bald Head Island Beach Profile Volume Change since August/September 2000 Onshore/Offshore Surveys 46

59 Figure 3.13 Location of Bald Head spit volume calculations Figure 3.14 Bald Head Spit Volume above -46 ft MLLW 47
60 Oak Island: Onshore Surveys Compared to After Dredge Surveys: When comparing the volume changes for the onshore surveys, loss is the prevailing trend for most of the survey dates and for most of the locations on Oak Island (see Figure 3.15). However, the magnitudes are much less than those of the onshore/offshore comparison above. Of the four surveys investigated, the greatest loss and gain were -21,000 CY and 12,000 CY, respectively. A net loss through June 2003 occurred at the easternmost disposal area along Caswell Beach (60+00 to 80+00) while gains are seen between the two disposal areas (80+00 to ). The remaining area ( to ) showed predominantly net losses for elevations above 2 feet NGVD, when compared to the After Dredge surveys. Post-Construction Surveys compared to Pre-construction Survey: The onshore/offshore construction monitoring surveys (January 2002 and December 2002) were both compared to the pre-construction (August 2000) survey (see Figure 3.16). This was done to compare the health of the beach to the before construction condition. As indicated previously, this comparison includes profiles around the eastern tip of Oak Island. The eastern end and tip of Oak Island (profiles 5 through 110) show predominant losses, a total of 198,000 CY through January 2002 and 228,000 CY through December The remainder of Oak Island (profiles 120 through 310) shows predominant gains, a total of 1,096,000 CY through January 2002 and 1,011,000 CY through December Based on the above comparison, it can be concluded that by the end of the monitoring period, Oak Island is volumetrically much healthier than before initiation of construction. 48
61 15,000 10,000 5,000 Cubic Yards 0-5,000-10,000-15,000-20,000-25, Beach Profile ID December-01 June-02 February-03 June-03 Figure 3.15 Wilmington Harbor Monitoring Oak Island Beach Profile Volume Change since After-Dredge Surveys (July October 2001) Onshore Only Profiles down to 2 ft NGVD 49
62 140, , ,000 80,000 60,000 40,000 20,000 Cubic Yards 0-20,000-40,000-60, Beach Profile ID December Onshore/ Offshore December Onshore/Offshore Figure 3.16 Wilmington Harbor Monitoring Oak Island Beach Profile Volume Change since August 2000 Onshore/Offshore Surveys 50
63 Ebb and Nearshore Shoal Analysis Bathymetric Data Collection. Detailed bathymetry of the Cape Fear River ebb tidal delta and channels were collected on three occasions specifically; August-September 2000, December 2001-January 2002 and January These data are collected using an interferometric swath sonar system integrated with a motion sensor that removes vessel motion in real-time. Dual-channel RTK GPS provides horizontal and vertical control to correct for water level fluctuations forced by astronomical tides and wind-driven tides using the vertical RTK-GPS measurements. For details of this system and methodology on data collection and reduction refer to the following referenced letter reports, McNinch 2002 and McNinch Bathymetric data from the USACE LARC cross-shore surveys along the offshore profile lines were combined with those of the interferometic system to produce a comprehensive survey of the monitoring area. A sample of the combined coverage of the most recent survey is shown in Figure 3.17 showing the LARC and interferometric system track lines. The results of the surveys are discussed below which are summarized from the previously referenced letter reports. Results. The ebb tidal delta surrounding the mouth of the Cape Fear River is shown in Figure 3.18 from the most recent survey of Although these sounding were collected over a time span of several months and should not be used as an instantaneous measure of bathymetry, gross patterns of seafloor morphology can be seen in the figure. This survey clearly shows the newly realigned channel as well as the existing channel. Also apparent are three linear shoals that compose much of the ebb tidal delta. Two shoals are present on the west side of the shipping channel (Jay Bird Shoals). The third or Bald Head Shoal protrudes off the southwestern corner of Bald Head Island east of the main channel. Figure 3.19 shows a detail of the three shoals and nearshore bathymetry. This figure reveals the three-shoal system with the main channel hugging very near Bald Head Island as it exits into the ocean. A well-developed flood margin channel can also be seen flanking Oak Island. However, a similar companion flood channel is not apparent through Bald Head Shoal on the opposite side of the entrance channel. A side-by-side comparison of this area is shown in Figure 3.20 for the 2000, 2002 and 2003 surveys. These comparisons show a deepening of the flood margin channel on the Oak Island side and along the main shipping channel, the latter deepening being attributed to the dredging of the new channel. Overall however the morphology of the ebb tidal delta appears to be largely static which suggests there have not been substantial changes in sediment transport pathways around the ebb tidal delta since the initial pre-construction 2000 survey. An inset of the bathymetry surrounding the new channel at the distal end of the ebb tidal delta is shown in Figure A side-by-side comparison of this region for each of the surveys is provided in Figure Construction of the new channel is readily apparent from the bathymetric charts with the 2000 survey reflecting the pre-dredge condition while the 2002 survey captures the time between the completion of the outer bar dredging contract 51
64 (Ocean Bar I) and the start of the Bald Head Shoal contract (Ocean Bar II). This chart clearly shows the remaining section of the channel to be dredged connecting the existing and new channel alignments. The bathymetry seen in the 2003 survey shows the morphology of this region after roughly 10 months of the new channel being opened. Aside from the dredged change in bathymetry, the overall morphology of the outer region appears to be about the same over the three-year period covered by the surveys. This fact suggests that little change in sediment transport pathways along the offshore end of the ebb tidal delta over this initial monitoring period. The bathymetry near the western portion of Baldhead Island is shown on Figures 3.23 and Although annual surveys show only endpoint differences or similarities and do not reflect the more temporally dynamic changes that may occur between surveys, these charts indicate minimal evolution of the shoals flanking the inlet in the Baldhead Island region. A similar inset showing the nearshore shoals along Oak Island over the past three survey years is given in Figure Like the Baldhead Island side, there has been minimal change in the nearshore bathymetry and attached shoals adjacent to Oak Island. Comparisons between surveys of the ebb tide delta region are discussed further in Part 4. in the section Ebb and Nearshore Shoal Response. 52

65 Figure 3.17 Survey Track Lines Collected by the LARC5 and the Interferometric System during the 2003 Survey 53

66 Figure 3.18 Bathymetry of the Cape Fear River Ebb Tidal Delta,

67 Figure 3.19 Inset of bathymetry near the Cape Fear River tidal inlet

68 2003 Survey 2000 Survey 2002 Survey Figure 3.20 Comparison of bathymetry near the Cape Fear River tidal inlet showing bathymetry from the 2000, 2002, and 2003 surveys. 56

69 Ebb Tidal Shoal 2003 Survey Figure 3.21 Inset of bathymetry near the new channel along the distal end of the ebb tidal delta

70 Ebb Tidal Delta 2003 Survey Ebb Tidal Delta 2000 Survey Ebb Tidal Delta 2002 Survey Figure 3.22 Inset of bathymetry near the new channel from each of the three surveys- 2000, 2002, and

71 Bald Head Island 2003 Survey Figure 3.23 Inset of bathymetry along the western portion of Baldhead Island,

72 Bald Head Island 2003 Survey Bald Head Island 2000 Survey Bald Head Island 2002 Survey Figure 3.24 Comparison of bathymetry along the western portion of Bald Head Island from the 2000, 2002, and 2003 surveys. 60

73 Oak Island 2003 Survey Oak Island 2002 Survey Oak Island 2000 Survey Figure 3.25 Comparison of bathymetry along the eastern portion of Oak Island from the 2000, 2002, and 2003 surveys. 61

74 Wave Data Analysis Detailed investigations of wave conditions associated with Wilmington Harbor monitoring are being conducted through the use of field data collection using three wave gauges. One gauge is located offshore and the other two are located nearshore so that the local wave climate can be assessed with respect to offshore conditions. In this section the wave data collected to date are presented through relative comparisons of each other and compared to longer-term hindcast data available at the site. Significant wave events are also identified for the initial 3-year monitoring period. Prior numerical simulations of wave transformations are discussed as well as the use of the field data to calibrate/verify the use of the STWAVE model for the study area. General Wave Climate. Determination of the incident wave climate is a critical first step in nearshore wave transformation and littoral transport studies. Ideally, a long-term, high-quality hindcast is available with at least a few years of concurrent directional wave measurements in the same area to validate the hindcast. This study used both long-term wave hindcast data and short-term field data measurements, as discussed in the following paragraphs. Figure 3.26 displays the locations of available wave information for use in characterizing the local wave climate. Figure Wave Gauge and Hindcast Station Locations. 62
75 WIS Hindcasts. The Wave Information Studies (WIS) has developed wave information along U.S. coasts by computer simulation of past wind and wave conditions. This type of simulation is termed hindcasting. The hindcast data provide a valuable source of decades-long wave data needed in coastal engineering design, at dense spatial resolution and at a level of temporal continuity not available from field measurements. The most recent hindcast information consists of a 10-yr continuous time series from The latest hindcast data are expected to dramatically improve confidence in littoral transport analyses compared to previous hindcast efforts. The improved quality of the recent hindcast conditions were produced using an advanced version of the wave hindcast model WISWAVE, with more accurate and more highly resolved input winds, and better representation of shallow water topographic effects and sheltering by land forms through use of more highly resolved model domains. Advancements in weather modeling, increased availability of measured wind data (from buoys and satellites), and improved methods for integrating measured data with model-generated wind fields have all contributed to significant improvements in the quality of wind input that is available for use in hindcasting. Time series of bulk wave parameters, significant wave height, period, direction, as well as wind speed and direction, are available at 1-hour intervals for a densely-spaced series of nearshore points along the U.S. coastline (in water depths of ft) and a less-dense series of points in deep water (water depths of 300 ft or more). Previous studies (Thompson, Lin and Jones, 1999) utilized WIS Level 2 Hindcast Station 2041, located just landward of the Eleven Mile Gauge. The earlier hindcast, covering time periods from 1976 to 1995, does not account for the sheltering effect of Bald Head Island since the hindcast was conducted on a rather coarse grid (1/4 degree resolution) covering the continental shelf along the eastern U.S. coast. Also, wave refraction around Frying Pan Shoals, which extends over 20 miles from Cape Fear, is not represented in the earlier hindcast. Since sheltering of Bald Head Island and refraction due to Frying Pan Shoals are critical to waves, they need to be included in the wave climate analysis. Therefore, the recent WIS Level 3 hindcast data provide an improved representation of the offshore wave climate for the Study area. The WIS Level 3 output station used for this study was Station 317, as shown in Figure 3.26, located in 50 ft of water approximately 10 miles south of the Eleven Mile Gauge and west of the outer limits of Frying Pan Shoals. The location of Station 317 provides a good representation of offshore wave conditions, with minimal influence of sheltering by Bald Head Island or refraction around Frying Pan Shoals. Such conditions are very suitable for input to the wave transformation model to account for the influences of Frying Pan Shoals on nearshore wave climate and resulting longshore transport patterns. To construct the wave climate, percent occurrence tables (broken down by height, period, and direction) were calculated for the entire hindcast using the Coastal Engineering Design and Analysis System (CEDAS), Nearshore Evolution Modeling System (NEMOS) software (NEMOS 2000). The Cape Fear wave climate is illustrated in Figure 3.27 as a wave rose with directional resolution of 22.5 deg. Figures 3.28 and 3.29 also show overall distributions by height, period, and direction in a histogram and block format, respectively. 63
76 Percent occurrence tables are commonly utilized to assist in computation of littoral transport rates as discussed later. The average annual wave height is approximately 3.6 ft as shown in Table 3.4 with the larger wave heights occurring in the months of January through March. Wave typically approach the study area from the east and southeast (between 90.0 and deg azimuth). Wave heights exceeding 6 ft only exist 11 percent of the time, with those waves being predominantly from the south and southeast directions. A wave period rose and block diagram are shown in Figures 3.30 and 3.31, respectively for Station 317. A tendency for long periods is most evident in waves from around 90 deg, a direction exposed to the open North Atlantic Ocean. Waves from the southeast, an important segment of the wave climate affecting the Cape Fear River entrance, also exhibit fairly long periods. Waves from the south and southwest tend to have relatively short periods. Figure Wave Height Rose for WIS Level 3 Station

77 Figure Wave Histogram for WIS Level 3 Station 317. Figure Wave Height Block Diagram for WIS Level 3 Station

78 Figure 3.30 Wave Period Rose for WIS Level 3 Station 317. Figure 3.31 Wave Period Block Diagram for WIS Level 3 Station
79 YEAR JAN FEB MAR APR MAY JUN JUL AUG SEP OCT NOV DEC MEAN Month Table 3. 4 Mean Yearly and Monthly Wave Heights (ft) for WIS Level 3 Station 317. Wave Gauge Analysis. The field measurement program was initiated to monitor processes in the area immediately before construction of a new deep-draft entrance channel and for an extended time period after construction. The data also provide critical in situ documentation of offshore and nearshore processes that has been heretofore unavailable at this site. Directional wave, water level, and current data were collected at one offshore location (referred to as the 11-Mile gauge) and two nearshore locations (Oak Island and Bald Head Island), as shown in Figure Water depths are about 42 ft at 11-Mile, 23 ft at Oak Island, and 19 ft at Bald Head Island gauges. The 11-Mile gauge was placed just south of a proposed dredged material disposal area, seaward of the navigation channel and ebb shoal influence. The nearshore gauges provide data in the vicinity of the navigation channel, nearshore shoals and adjacent beaches. All three gauges are Acoustic Doppler Current Profiler (ADCP) instruments accompanied by a pressure transducer. Directional wave spectra are calculated from time series of velocity at various depths obtained by the ADCP. Spectral bin widths are Hz in frequency and 4 deg in direction. Corresponding significant wave height Hm0, peak period Tp, and peak direction Dp parameters are determined from the directional spectrum. Peak frequency represents the highest energy density in the frequency spectrum integrated over all directions. Peak direction is determined as the vector mean at the peak frequency. Water level is determined from the pressure transducer record. Time series of current velocity at the surface, mid-depth, and bottom are also provided from the ADCP gauges. The 11-Mile and Oak Island gauges collect 20-min time series at 3-hr intervals. The Bald Head Island gauge collects 20-min time series at 1-hr intervals. 67
80 Figure 3.32 FRF Wave and Current Gauges. 68
81 The 11-Mile gauge operated consistently from initial deployment on 22 Sep The Bald Head Island gauge was operational during the same time period, but experienced occasional data losses for periods of up to several days. The Oak Island gauge was damaged by a trawler on 23 Oct 2000 and not successfully reactivated until June 2001 with additional periods of bad intermittently through June Wave Climate. Table 3.5 through 3.7 summarizes mean monthly conditions for all gauges through June As noted for the WIS hindcast data, the most energetic months are December through March for all gauges. The average annual wave height (Hsmean) observed for the 11-mile gauge is 3.1 ft. Average annual wave heights for the Bald Head and Oak Island gauges are 1.9 and 1.7 ft, respectively indicating significant wave transformation over the shoals. In addition to determining average wave conditions, the monthly time series for all gauges were analyzed to determine the maximum wave height (Hsmax) with a minimum duration of 12-hours. The associated peak period (Tpmax) and wave direction (Dpmax) with each event were also computed. The 11-Mile gauge had monthly maximum wave heights of on the order of 7.8 ft, with waves typically arriving from the southeast to southwest directions. Bald Head and Oak Island had monthly maximum wave heights of 5.8 and 4.8 ft, respectively. Both nearshore gauges display the filtering effect of the nearshore shoals, with the predominant number of events having wave directions confined to the southsouthwest directions 69
82 GAGE STAT YEAR Jan Feb Mar Apr May Jun Jul Aug Sep Oct Nov Dec AVERAGE Bald Eleven Head Mile Gage HsMax Eleven Bald Head Mile Gage HsMax Eleven Bald Head Mile Gage HsMax Eleven Bald Head Mile Gage HsMax AVERAGE GAGE STAT YEAR Jan Feb Mar Apr May Jun Jul Aug Sep Oct Nov Dec AVERAGE Bald Eleven Head Mile Gage DpMax Eleven Bald Head Mile Gage DpMax Eleven Bald Head Mile Gage DpMax Eleven Bald Head Mile Gage DpMax AVERAGE GAGE STAT YEAR Jan Feb Mar Apr May Jun Jul Aug Sep Oct Nov Dec AVERAGE Bald Eleven Head Mile Gage HsMean Eleven Bald Head Mile Gage HsMean Eleven Bald Head Mile Gage HsMean Eleven Bald Head Mile Gage HsMean AVERAGE GAGE STAT YEAR Jan Feb Mar Apr May Jun Jul Aug Sep Oct Nov Dec AVERAGE Bald Eleven Head Mile Gage TpMax ** 14.2 ** 14.2 ** Eleven Bald Head Mile Gage TpMax 2001 ** ** 10.6 ** ** 18.2 ** 14.2 ** 32.0 ** Eleven Bald Head Mile Gage TpMax ** 16.0 ** 25.6 ** 10.6 ** ** 11.6 ** 9.8 ** Eleven Bald Head Mile Gage TpMax AVERAGE ** GAGE STAT YEAR Jan Feb Mar Apr May Jun Jul Aug Sep Oct Nov Dec AVERAGE Bald Eleven Head Mile Gage TpMean Eleven Bald Head Mile Gage TpMean Eleven Bald Head Mile Gage TpMean Eleven Bald Head Mile Gage TpMean AVERAGE NOTE: Wave Height (HsMax, HsMean) Units are feet, Wave Period (TpMax, TpMean) Units are seconds, Wave Direction (DpMax) are meteorological (deg North, from). -- denotes no data or missing data. ** denotes suspect wave period measurements. Table 3. 6 Bald Head Gauge Monthly Summaries. Table 3. 5 Eleven Mile Gauge Monthly Summaries. 70
83 GAGE STAT YEAR Jan Feb Mar Apr May Jun Jul Aug Sep Oct Nov Dec AVERAGE Oak Island Gage HsMax Oak Island Gage HsMax Oak Island Gage HsMax Oak Island Gage HsMax AVERAGE GAGE STAT YEAR Jan Feb Mar Apr May Jun Jul Aug Sep Oct Nov Dec AVERAGE Oak Island Gage DpMax Oak Island Gage DpMax Oak Island Gage DpMax Oak Island Gage DpMax AVERAGE GAGE STAT YEAR Jan Feb Mar Apr May Jun Jul Aug Sep Oct Nov Dec AVERAGE Oak Island Gage HsMean Oak Island Gage HsMean Oak Island Gage HsMean Oak Island Gage HsMean AVERAGE GAGE STAT YEAR Jan Feb Mar Apr May Jun Jul Aug Sep Oct Nov Dec AVERAGE Oak Island Gage TpMax ** Oak Island Gage TpMax ** ** ** ** ** 5.1 Oak Island Gage TpMax 2002 ** ** ** ** ** ** Oak Island Gage TpMax AVERAGE ** GAGE STAT YEAR Jan Feb Mar Apr May Jun Jul Aug Sep Oct Nov Dec AVERAGE Oak Island Gage TpMean Oak Island Gage TpMean Oak Island Gage TpMean Oak Island Gage TpMean AVERAGE NOTE: Wave Height (HsMax, HsMean) Units are feet, Wave Period (TpMax, TpMean) Units are seconds, Wave Direction (DpMax) are meteorological (deg North, from). -- denotes no data or missing data. ** denotes suspect wave period measurements. Table 3. 7 Oak Island Gauge Monthly Summaries. 71
84 Although the duration of wave gauge operation is limited to date, sufficient data have been collected from the 11-Mile and nearshore gauges to provide insights on wave climate variability and the impact of Frying Pan Shoals. Wave Histograms were created using all available data from each gauge for the September 2000 to June 2003 time period as shown in Figure Wave roses for available data also show characteristic differences in wave climate for the three locations (Figure 3.34). Dominant wave directions at 11-Mile Gauge are from southeast and south southeast. At Bald Head Island gauge, dominant directions are shifted to south-southeast and south-southwest. Oak Island directions are further confined to primarily south and south-southwest. These direction shifts between offshore and nearshore locations are consistent with expected effects of wave refraction. The 11-Mile Gauge wave rose shows a small, but significant component of the wave climate coming from easterly directions. These waves have passed across Frying Pan Shoals to reach the gauge. By comparison, the multi-year hindcast wave climate for this area (WIS Level 3 Station 317), but seaward of any coastal bathymetry, shows strong wave dominance from east to southeast directions as discussed earlier. Frying Pan Shoals filters, but does not eliminate, wave energy reaching the 11-Mile Gauge site from these directions. Waves from easterly directions are virtually absent at the Bald Head Island and Oak Island gauges. This site is sheltered to the east by the Bald Head Island land mass and to the east-southeast by an extremely shallow part of Frying Pan Shoals extending from Cape Fear. Time series for each gauge were separated into yearly components and analyzed to assess the statistical variation in wave climate. Figures 3.35 to 3.38 show annual wave height roses for all three gauges for 2000, 2001, 2002, and One interesting observation is that years that appear to have the offshore gauge dominated by the southeast waves have a nearshore wave distribution with waves dominated from the southwest. There do not appear to be any significant changes in wave distribution from pre- to post-dredging time periods. Wave Time Series. Wave information obtained every 3 hours (hourly at Bald Head and Oak Island sites), and currents obtained every hour were assembled and presented in summary plots and ASCII data files. Wave parameters consisting of significant wave height (Hs), peak period (Tp), and peak direction (Dp) are presented in the plots. The water level (WL) was originally reported as the water level above the meter. Water level displayed in the plots has the mean water level of each deployment removed, resulting in approximately the water elevation with respect to mean sea level. Summary current information for two bins (near bottom (Sb) and near surface (Ss)) and a depth-average (Savg) value is presented in the plots. The ASCII data files developed contain current speed and directions for the full profile resolution (all bins) starting with bin 1 closest to the instrument (near bottom) and going up to near the surface. Figure 3.39 displays a sample of the monthly plots for the 11- Mile gauge during December 2002 Time series plots of the three wave gauges together help provide a better understanding of the relative magnitude of conditions throughout the study area for a given time period. Data from all gauges were correlated to common time steps and plotted as monthly time series including significant wave height, peak period, peak direction, and water level. Figure 3.40 displays the December 2002 time series of all gauges. Several events 72
85 occurred during this very energetic month. In addition to the relative magnitudes of offshore to nearshore wave heights, Figure 3.38 displays the filtering of waves from the east. Such plots are very valuable for calibration and verification of wave transformation models. Appendix A contains comparative plots for all months in the deployment history through June Significant Events. Several large storm events occurred during the monitoring period that may have significantly altered adjacent beach shorelines and beach profiles. An analysis was conducted to identify storm event parameters that exceeded a 6-ft significant wave height threshold with a minimum duration of 12-hrs. Events were selected through screening of the 11-Mile Gauge time series. Associated peak parameters for the Bald Head and Oak Island gauges were reported. Table 3.8 summarizes the 20 events that exceeded the set criteria over the monitoring period. The majority of the events occurred in the winter (Dec through March). Waves typically originated from the south-southwest, with offshore wave heights of 8 to 11-ft and wave periods of 10 to 11 seconds. Corresponding conditions at the nearshore gauges indicate significant reduction in wave height, with Bald Head and Oak Island being reduced by 22 and 33 percent, respectively. Wave refraction effects are visible in the shifts of event peak wave direction, although more in-depth analysis of the actual wave spectra are needed to reveal the change in the primary incident direction during nearshore transformation. 73
86 Eleven-Mile Gauge (Sep 2000 Jun 2003) Bald Head Gauge (Sep 2000 Jun 2003) Oak Island Gauge (Sep 2000 Jun 2003) Figure 3.33 Wave Histograms for FRF Gauges throughout deployment. 74
87 Eleven-Mile Gauge (Sep 2000 Jun 2003) Bald Head Gauge (Sep 2000 Jun 2003) Oak Island Gauge (Sep 2000 Jun 2003) Figure 3.34 Wave Height Roses for FRF Gauges throughout deployment. 75
88 Eleven-Mile Gauge (Sep-Dec 2000) Bald Head Gauge (Sep-Dec 2000) Oak Island Gauge (Sep-Oct 2000) Figure 3.35 Wave Height Roses for FRF Gauges (2000). 76
89 Eleven-Mile Gauge (2001) Bald Head Gauge (2001) Oak Island Gauge (2001) Figure 3.36 Wave Height Roses for FRF Gauges (2001). 77
90 Eleven-Mile Gauge (2002) Bald Head Gauge (2002) Oak Island Gauge (2002) Figure 3.37 Wave Height Roses for FRF Gauges (2002). 78
91 Eleven-Mile Gauge (Jan-Jun 2003) Bald Head Gauge (Jan-Jun 2003) Oak Island Gauge (Jan-May 2003) Figure 3.38 Wave Height Roses for FRF Gauges (2003). 79

92 Figure 3.39 Monthly Time Series for 11-Mile Gauge (Dec 2002). 80

93 Figure FRF Wave Gauge Time Series (Dec 2002). 81
94 ELEVEN MILE GAGE BALD HEAD GAGE OAK ISLAND GAGE EVENT START DATE TIME STOP DATE TIME Dur(hrs) Hs(ft) Tp(sec) Dp(deg) DATE PEAK TIME Hs(ft) Tp(sec) Dp(deg) Hs(ft) Tp(sec) Dp(deg) 1 16-Dec-00 3:00:00 16-Dec-00 18:00: Dec-00 15:00: Jan-01 6:00:00 21-Jan-01 0:00: Jan-01 0:00: Mar-01 12:00:00 22-Mar-01 0:00: Mar-01 18:00: Mar-01 9:00:00 30-Mar-01 3:00: Mar-01 12:00: Jul-01 21:00:00 24-Jul-01 12:00: Jul-01 6:00: Sep-01 3:00:00 16-Sep-01 6:00: Sep-01 18:00: Dec-01 23:30:00 29-Dec-01 2:45: Dec-01 14:45: Jan-02 11:30:00 7-Jan-02 8:45: Jan-02 14:45: Feb-02 4:00:00 7-Feb-02 22:00: Feb-02 7:00: Mar-02 13:00:00 3-Mar-02 22:00: Mar-02 19:00: Nov-02 4:00:00 6-Nov-02 19:00: Nov-02 10:00: Nov-02 22:00:00 30-Nov-02 22:00: Nov-02 4:00: Dec-02 13:00:00 14-Dec-02 16:00: Dec-02 4:00: Dec-02 1:00:00 21-Dec-02 1:00: Dec-02 7:00: Dec-02 10:00:00 26-Dec-02 1:00: Dec-02 13:00: Jan-03 1:00:00 1-Jan-03 16:00: Jan-03 4:00: Jan-03 4:00:00 10-Jan-03 4:00: Jan-03 7:00: Jan-03 7:00:00 20-Jan-03 19:00: Jan-03 10:00: Feb-03 19:00:00 23-Feb-03 16:00: Feb-03 7:00: Mar-03 7:00:00 21-Mar-03 7:00: Mar-03 16:00: Table 3. 8 Significant Events at 11-Mile Gauge Exceeding Significant Wave Height of 6-ft. 82

.")
95 Wave Transformation Modeling. Three previous studies involved wave transformation modeling in the vicinity of Wilmington Harbor. The initial study involved the assessment of the wave climate and littoral transport potential in the vicinity of the Cape Fear Entrance for pre-project conditions and a range of channel alternatives (Thompson, Lin, and Jones, 1999). The second study involved assessing the use of Jay Bird Shoals as a sand source and the impact on littoral transport patterns landward of the shoals and along nearby beaches (Thompson, Gravens, 2000). The most recent study assessed the sensitivity of STWAVE model errors based on various model input parameters (wind, tide, bathymetry, and spectral shape) (Thompson, Smith, 2002). Details of each study can be found in the full reference. The numerical model STWAVE (Smith, Resio, and Zundel 1999), a steady state directional spectral wave model, was used to transform waves across Frying Pan and Cape Fear ebb shoal and into the navigation channel and adjacent beaches. The wave model STWAVE has been widely used within the U.S. Army Corps of Engineers and elsewhere for engineering project studies. STWAVE is an efficient steady-state, finite-difference model designed to simulate the nearshore transformation of a directional spectrum of wave energy. A typical application is to take known offshore wave conditions, in water depth on the order of 60 ft or greater, and transform those incident wave conditions over complex nearshore bathymetry (Figure 3.41), often to the point of nearshore breaking. Figure Cape Fear Bathymetry with Entrance Channel Plan. 83
96 Output from STWAVE includes wave parameters Hm0, Tp, and Dp over the entire model domain and directional spectra from selected points. Peak wave period, Tp, is the reciprocal of peak frequency, fp, which is the frequency at which the highest energy density occurs in the frequency spectrum integrated over all directions. The wave direction, Dp, as defined in STWAVE, is the vector mean from the integrated spectrum. Figure 3.42 displays a typical output generated to visualize the wave transformation from a single wave event. ape Fear River Entrance, NC - Existing Bathymetry with Plan Channel Significant Wave Height (m) Event 5: Height = 1.0 m; Period = 9.9 sec; Direction = 152 deg az X Y Figure 3.42 STWAVE Example Transformation Output. Model Calibration. Use of the high quality field data collected (bathymetry, waves, and currents) allowed an extensive STWAVE model calibration/verification effort to be performed for the study area. STWAVE model results from grid points at the 11-Mile and Bald Head Island gauge locations during the November 2000 storm are shown along with gauge parameters in Figure The sensitivity analysis of input parameters concluded that accurate bathymetry had the most significant impact in reducing potential model error. Fortunately, several high-resolution bathymetric data sets exist over the same time period as the collected wave data, allowing a fully calibrated/verified wave transformation model to be developed for future analyses. The data collection and numerical modeling efforts have provided a much greater understanding of the hydrodynamic processes in the study area and an increased confidence in computed wave conditions in the nearshore. The greater accuracy in nearshore wave conditions result in improved littoral transport patterns and increased confidence in assessing impacts of future actions on adjacent shoreline response. 84

97 Figure 3.43 STWAVE Model Results Compared to Observed Gauge Data (Nov 2000 Storm). 85
98 Current Measurements Methodology. Mean currents were measured across the mouth of the Cape Fear River tidal inlet and the seaward portion of the ebb tidal delta around the new and original shipping channel using a ship-mounted Acoustic Doppler Current Profiler (ADCP). The location of the inlet and offshore transects are shown in Figure The instrument used for these surveys was a 600 khz Workhorse Rio Grande manufactured by RD Instruments. Two +13-hour transects were performed during each survey episode (October 11 and 12, 2000, April 12 and 13, 2002 and March 4 and 18, 2003) during spring tidal conditions. The October 2000 transects were taken prior to the new entrance channel deepening and realignment. The specific location of the two survey transects are shown on Figures 3.45 and The vessel steamed continuously around each transect for over 13 hours, making a complete loop every hour or less. This technique provided a measure of current magnitude and direction at every location along the transect every hour and spanned the periods of the primary tidal constituents (M2, S2). Other variables that typically force currents in tidal inlets, such as wind-driven flows and river discharge, were also incorporated within the 13- hour snapshot of currents. Each transect was run within several days of the predicted spring high tide. Wind conditions prior to each of the surveys were relatively light and did not likely play a significant role in the measured flows. Although only a long-term time series of currents and water level around the inlet could precisely determine the relative percentage of influence the various tidal constituents and meteorological forces (wind, discharge) may play, the transect measurements are believed to reflect near maximum magnitudes for astronomical flows, and the spatial patterns seen across the transects fairly characterize recurring flow directions under similar conditions. The goals motivating the design of the transect locations and the ADCP measurements are to 1) measure ebb/flood exchange and calculate a tidal prism, 2) qualitatively assess changes or similarities in flow patterns around the ebb tidal delta through time, and 3) provide critical verification and calibration for future numerical simulations of mean currents as needed. 86

99 Figure 3.44 Ship-Board current profile track lines 87
100 Oak Island C D Northing (state plane, m) cross-section for normalized tidal prism calculations F E ADCP transect course location B Baldhead Island contours in m, NGVD A Easting (state plane, m) Ebb Tidal Inlet Jan bathymetry Figure 3.45 Location of inlet ADCP transect 88
101 12500 C ADCP transect Northing (state plane, m) D B 9500 E A Jan bathymetry contours in m, NGVD Easting (state plane, m) Figure 3.46 Location of offshore ADCP transect Results. The October 2000 survey showed an ebb dominant flow with maximum near-surface ebb and flood velocities of 4.43 ft/s (1.35 m/s) and 3.61 ft/s (1.10 m/s), respectively as measured along the inlet transect (B-C, see Figure 3.43). Using these ADCP data and bathymetric surveys collected in August 2000, ebb and flood tidal prisms were calculated as approximately 6.7x10 9 ft 3 (1.9x10 8 m 3 ) and 4.7x10 9 ft 3 (1.3x10 8 m 3 ), respectively. Total tidal volume over the cycle was approximately 1.1x10 10 ft 3 (3.2x10 8 m 3 ). Figures 3.47 and 3.48 show peak ebb and flood current velocities respectively for the inlet transect, and Figures 3.49 and 3.50 show peak ebb and flood current velocities respectively for the offshore transect. The April 2002 survey also showed ebb dominated flow with maximum near-surface ebb and flood velocities of 6.46 ft/s (1.97 m/s) and 4.10 ft/s (1.25 m/s), respectively as measured along the inlet transect (B-C, see Figure 3.43). Figures 3.51 and 3.52 show peak ebb and flood current velocities respectively for the inlet transect. Figures 3.53 and 3.54 show the peak ebb and flood current velocities respectively for the offshore transect. Current speed and direction appear to be influenced by shoals on the western flank of the ebb delta particularly during flooding periods. Water appears to be funneled through the flood margin channel flanking Oak Island and around the two linear shoals before joining the main channel. The large shoal that extends from Bald Head Island suggests that a significant flood margin channel does not occur on the east side of the inlet. On the ebb tide flow, currents appear to be concentrated in the main ebb channel, which is a consistent observation for tidal inlets such as this at the Cape Fear River entrance. 89
102 1 m/s Figure 3.47 Peak ebb current velocities at inlet transect for October 2000 ADCP survey 1 m/s Figure 3.48 Peak flood current velocities at inlet transect for October 2000 ADCP 90
103 Bald Head Island Figure 3.49 Peak ebb current velocities at offshore transect for October 2000 ADCP survey Bald Head Island Figure 3.50 Peak flood current velocities at offshore transect for October 2000 ADCP 91
104 Figure 3.51 Peak ebb current velocities at inlet transect for April 2002 ADCP survey 92
105 Figure 3.52 Peak flood current velocities at inlet transect for April 2002 ADCP survey 93
106 Figure 3.53 Peak ebb current velocities at offshore transect for April 2002 ADCP survey Figure 3.54 Peak flood current velocities at offshore transect for April 2002 ADCP survey 94
107 The measured tidal prism for the April 2002 survey continues to be ebb dominated with approximately 5.3x10 9 ft 3 (1.5x10 8 m 3 ) on the ebb flow and 3.9x10 9 ft 3 (1.1x10 8 m 3 ) on the flood flow and a total flow volume of 9.2x10 9 ft 3 (2.6x10 8 m 3 ). In March 2003, ADCP surveys again showed mean currents that were strongly influenced by local bathymetry. Highest flood flows were recorded funneling primarily through the flood margin channel adjacent to Oak Island, while the highest ebb flows were concentrated in the central ebb channel as shown in Figures 3.55 and Maximum nearsurface ebb and flood velocities at the inlet transect (B-C) were 5.41 ft/s (1.65 m/s) and 4.17 ft/s (1.27 m/s), respectively. An interesting observation noted during the inlet transect survey was that a sustained ebb flow was measured on both the west and east side of the inlet during flood flows and was likely a result of fluvial discharges from the Cape Fear River. To further support this assertion, it was noted that B. Everette Jordan Lake (on the Haw River upstream of the Cape Fear River) experienced an increase in lake elevation approximately 7 to 10 days prior to this survey suggesting that the Deep and Haw Rivers (which combine to form the Cape Fear River) experienced increased discharge from rainfall runoff that could have influenced these measurements. Tidal prism calculations for the March 2003 survey show an ebb volume of approximately 6x10 9 ft 3 (1.7x10 8 m 3 ), flood volume of approximately 4x10 9 ft 3 (1.2x10 8 m 3 ), and total volume of approximately 1x10 10 ft 3 (2.8x10 8 m 3 ). Figure 3.57 and 3.58 show peak ebb and flood current velocities for the offshore transect. These figures indicate that peak ebb flows on the order of 3.3 feet per second (1 m/s) are found concentrated in the vicinity of the existing channel. Further, peak ebb velocities along the new channel remain relatively small. With respect to peak flood currents, the measurements indicate that the magnitudes and directions are fairly uniform over the offshore transect. Relative changes between ADCP measurements from the October 2000 transects and the most recent measurements are discussed in Part 4 of the report. 95
 15000 14500 1 m/s")
 Ebb Tidal")

108 16500 near-surface velocity near-bottom velocity Oak Island Northing (state plane, m) m/s vector scale Baldhead Island Easting (state plane, m) Ebb Tidal Inlet Jan bathymetry contours in m, NGVD Figure 3.55 Peak ebb current velocities at inlet transect for March 2003 ADCP survey 96
 15000 14500 1 m/s")
 Ebb Tidal")

109 16500 near-surface velocity near-bottom velocity Oak Island Northing (state plane, m) m/s vector scale Baldhead Island Easting (state plane, m) Ebb Tidal Inlet Jan bathymetry contours in m, NGVD Figure 3.56 Peak flood current velocities at inlet transect for March 2003 ADCP survey 97
110 near-surface velocity near-bottom velocity vector scale m/s Ebb Tidal Inlet Jan bathymetry contours in m, NGVD Figure 3.57 Peak ebb current velocities at offshore transect for March 2003 ADCP survey near-surface velocity near-bottom velocity Current Measurements vector scale m/s Ebb Tidal Inlet Jan bathymetry contours in m, NGVD Figure 3.58 Peak flood current velocities at offshore transect for March 2003 ADCP survey 98
111 Part 4 PROJECT EFFECTS/PERFORMANCE TO DATE Beach Response Shoreline Change Rates General Shoreline Change Information. One measure of the potential project impact is to compare the rate of shoreline change that existed before the channel improvements were initiated with those that have been measured after. For this study the shoreline change rates selected for the pre-construction period where those of the updated NCDCM rates presented earlier in Part 2 of this report (See Figure 2.6 for Oak Island and Figure 2.7 for Bald Head Island). These change rates are based on shoreline data spanning a 62-year period from 1938 to 2000 (the survey just prior to dredging of the new channel), and therefore represent longterm trends in shoreline change. The post-construction period was reckoned from the August/September 2000 survey continuing through the most recent monitoring survey of June The post construction rates were developed in the same manner as the pre-construction rates and represent a least squares trend of the data. See Appendix B for shoreline change graphs for each monitoring profile for a graphical representation of these calculations. As shown in the appendix, the slope of the trend line for each profile indicates the computed shoreline change rate. A longshore average was then calculated by computing a running average, to be consistent with the NCDCM methodology. Specifically, 5 profiles (2 either side) for Oak Island and 7 profiles (3 either side) for Bald Head Island were averaged together resulting in the longshore average shoreline change rate for that profile of interest. These rates are summarized in Table 4.1 for Oak Island and Table 4.2 for Bald Head Island. These rates are plotted in Figure 4.1 and Figure 4.2 for Oak Island/Caswell Beach and Bald Head Island, respectively. These post-construction rates were generated to establish a trend of shoreline characteristics of the beach including and encompassing the fill activities. In general, it is apparent that the post-construction shoreline change rates are more variable (longshore and magnitude), when compared to the pre-construction rates. This is due in part to the relatively short time frame of the post rate data (2000 through 2003), when compared to the pre rate data (1938 through 2000), and is also a result of shoreline equilibration that is expected with the beach disposal project. Oak Island. As indicated on Table 4.1 and Figure 4.1, the pre-construction data for Oak Island covers from profile 35 through 310. The area east of profile 35 near Fort Caswell and the Cape Fear River was not included in the NCDCM data base so direct comparisons between pre and post-construction shoreline change rates cannot be made in that area. For the entire Oak Island monitoring area, the pre-construction shoreline change rates along the beach vary from positive (accretion) of more than 30 feet per year to negative (erosion) of 5.8 feet per year. The overall trend shows accretionary shoreline change rates within the eastern one-third of the study area with the remaining two-thirds showing a 99
112 general pattern of long-term erosion. The longshore average, trend for the post construction shoreline change rates varies from +115 to 10 feet per year with most of the area showing a large positive shoreline change except for the eastern end that has a pocket of erosion. When compared to pre-construction shoreline change rates, the post construction rates on Oak Island seem to be partially dictated by the location of disposal material rather than following the pre-construction rate trends. Specifically, the fill was placed west of profile 60 to profile 294, except for a gap between profile 80 through profile 121. Further, material associated with the Sea Turtle Habitat Project was placed at the fall west end of the monitoring area, specifically profiles 300 through 310. Positive shoreline change rates were recorded over this entire fill area with a localized minimum occurring near the middle of the non-fill area. With this measured response, all profiles (except for three nearest to the river entrance) have significantly more positive post-construction shoreline change when compared to the computed pre-construction rates. It is expected that with time, these positive rates will decrease as the fill area erodes, with the shoreline response trending more toward the long-term pattern. In most cases within the fill area the positive changes in the shoreline rate are an order of magnitude greater than the pre-construction change rates. For example within the easternmost disposal area between profiles 60 and 80, the post-construction change rates vary from +32 to +36 feet per year. This compares to zero to +1.6 feet per year for the preconstruction period. Within the remaining disposal area from station through the end to station , the rates generally range from about +40 to +80 feet per year, while the pre-construction shoreline change rates for this area range from are erosional ranging from 0.3 to 5.8 feet per year. In the area of profiles 5 through 45, encompassing the eastern tip of Oak Island, the measured post-construction rates indicate an area of erosion except for the last three profiles along the inlet shoulder, which were stable. Historically, this area, which is in the vicinity of Ft. Caswell, has been accretionary; but has also experienced a rather high degree of shoreline variability being located immediately adjacent to the entrance channel. The negative shoreline change rate response observed over the initial post-construction period may be such a short-term fluctuation. Additional monitoring will help confirm if this is a new trend in shoreline behavior or just a temporary fluctuation. Overall, the shoreline change rate averaged over the entire 5.2 mile section of Oak Island/Caswell Beach (from profile ) is 50 feet per year for the approximate 3-year post-construction period. By comparison the pre-construction rate over the entire reach was 1.1 feet per year. 100
113 Table 4.1 Oak Island Shoreline Change Rates Profile ID Longshore Average Pre-Construction Rate ( ) Post- Construction Rate ( ) Longshore Average Post-Construction Rate # (ft/yr) (ft/yr) (ft/yr)
114 Table 4.2 Bald Head Island Shoreline Change Rates Longshore Average Pre- Construction Rate Post-Construction Longshore Average Post- Profile ID ( ) Rate ( ) Construction Rate # (ft/yr) (ft/yr) (ft/yr)
115 Shoreline Change Rate (ft/yr ) Beach Profile ID Longshore Avg. Pre-construction Rates Updated Through August 2000 Longshore Avg. Post-construction Rate Since August 2000 Figure 4.1 Wilmington Harbor Monitoring - Oak Island Comparison of Pre- and Post-Construction Shoreline Change Rates 103
116 Beach Profile ID Longshore Avg. Pre-construction Rate Updated Through September 2000 Longshore Avg. Post-construction Rate Since September 2000 Figure 4.2 Wilmington Harbor Monitoring - Bald Head Island Comparison of Pre- and Post-Construction Shoreline Change Rates 104 Shoreline Change Rate (ft/yr )
117 Bald Head Island: Table 4.2 and Figure 4.2 give the comparison of pre- and postconstruction shoreline change rates along Bald Head Island. The updated NCDCM preconstruction data are available for profiles 53 through 218, generally encompassing shoreline along South Beach. Pre-construction shoreline change rates along the beach are all negative and indicate a pattern of higher erosion towards each end of the island with lower erosion rates near the middle. This pattern holds true except for a few transects nearest the river entrance that are found to be accretionary at the southwestern tip of Bald Head. Proceeding eastward from this stable area is an erosion zone covering about one mile where the rates range from 2 feet per year to a maximum of 6.6 feet per year. The rates then range from 2 to 3 feet per year average along the central portions of South Beach. Eastward beyond this relatively more stable reach the rates gradually increase towards Cape Fear reaching a maximum erosion rate of about 20 feet per year. For the initial 3-year period, the post-construction shoreline change rates are found to be generally positive over the monitoring area. This in part reflects the influence of the beach fill placed throughout this area. In spite of the positive affects of the fill, the western end of South Beach, between profiles 47 through 78, has had relatively high rates of erosion. Specifically, this area has average post-construction erosion rate of 18 feet per year with a peak erosion rate of 25 feet per year at profile 61. This compares to an average preconstruction rate of 5 feet per year over this reach. Westward of this area the postconstruction rates turn positive reaching a peak accretion of 68 feet per year at profile 166. The average rate for this zone of accretion is a positive 42 feet per year and is in contrast to erosion indicated along this entire area by the pre-construction rates. In summary, the comparison of the pre- and post-construction shows that most of Bald Head Island is eroding less over the initial 3-year monitoring period. However, for this monitoring period, the post-construction erosion rates are considerably greater along the western corner of South Beach. This high erosion has prompted the Village of Bald Head to install sand bags to protect the beachfront road throughout this reach. This installation is a rehabilitation of an earlier sand bag structure placed in the mid-1990 s in response to erosion problems that have been prevalent over the last several decades in this area. As discussed in the following section, the relatively high erosion rates measured in this area associated with the loss of beachfill are not that unusual and have been observed with prior fills placed in this area. Further, a geotextile groin field that was placed in conjunction with the 1996 beach fill in an attempt to more effectively retain the fill throughout this problem area has now deteriorated. This deterioration has progressed to a point where the groins are no longer functioning. Some of the increased erosion is likely related the present ineffectiveness of the groins. In this regard the Village of Bald Head is planning a future rehabilitation of the groins in conjunction with the next beach disposal operation. 105
 was examined and compared to past shoreline information to determine if the present beach fill performance was vastly")
118 Comparison of Prior and Current Beach Fill Response Bald Head Island. The response of the beach fill (placed February 23, 2001 to July 7, 2001) was examined and compared to past shoreline information to determine if the present beach fill performance was vastly different than what was experienced in the past. Surveys used in this section from September 1996 to December 2001 were taken as part of a monitoring program implemented by the Village of Bald Head Island and were provided to the District by Olsen Associates, Inc. During the 2001 beach fill 1,849,00 cubic yards were placed from station to Figure 4.3 shows the shifting of the shoreline (MHW) due to the beach fill. The surveys used to create Figure 4.3 did not cover stations less than At station the shoreline was shifted 170 feet seaward and 13,000 cubic yards were placed from station to Figure Beach Fill along Bald Head Island. Erosion rates from August 2001(surveyed just after the completion of the fill) to June 2003 are shown in Figures 4.4 and 4.5. The erosion rates in Figure 4.5 can be divided into 3 106
, (Cleary, Hosier, and")
119 zones. Zone 1, stations to 56+57, is strongly influenced by the inlet. Zone 2, stations to 92+15, is an area that had been accreting or stable while the eastern ebb shoal was collapsing and sand was being transferred on shore (1872 to 1974), (Cleary, Hosier, and Gammill 1989). Without the sand supplied from the collapsing ebb shoal, zone 2 has reversed its state of accretion and since 1974 is in a state of erosion. Zone 3, to , is an area that had eroded during the period 1872 to This erosion was associated with a build up of sediment offshore and a general realignment or rotation of the Baldhead Island shoreline (USACE 1989). Wilmington District's report "Wilmington Harbor-Bald Head Island Reconnaissance Report, Section 111, PL , January 1989". Since 1974, zone 3 has continued to erode with a slower rate that zone 2. Figure 4.4 Bald Head Island Erosion Rates. August 01 to June
120 Annual Erosion Rates 08/01 to 06/ Zone Zone 1 Zone Station Figure 4.5 Bald Head Island Annual Erosion Rates. It can be seen in Figure 4.6 that the 3 zones have different shoreline orientations as a result of the different processes shaping them. Zone 1 is influenced by the inlet currents while zone 2 appears to be reverting to the alignment it had before the ebb tide shoal collapsed. Figure 4.7 shows the both the 1855 shoreline and the 2003 shoreline. It can be seen the zone 2, stations to 92+15, is receding along an alignment parallel to the 1855 shoreline alignment. Zone 3 is an area that is eroding slower than zones 1 or 2 and the shoreline is still seaward of the pre-2001 fill shoreline. The high erosion near the inlet, the erosion of the west end of the south beach and the accretion of the east end of south beach are similar to the responses documented in the Wilmington District's Section 111 report (USACE 1989), which was 12 years before the present dredging operation. 108

121 Figure 4.6 Bald Head Island Shoreline Azimuths. 109

122 Figure 4.7 Bald Head Island 1855 & 2003 Shorelines. In 1997, a smaller beach fill of 450,000 cubic yards was placed as shown in Figure 4.8. The shoreline positions from September 1996 to June 2003 at station are shown in Figure 4.9. After the 1997 fill, the shoreline at station eroded at a rate of 85 feet/year from June 1997 to June In September 1998, the erosion rate decreased to 5 feet/year and remained relatively constant through November The initially high erosion rate followed by a period of much lower erosion is attributed to the fill rapidly adjusting to a more stable shoreline orientation until the groin field, which was constructed in 1996, stabilizes the shoreline. The location of a groin field consisting of 16 geo-textile fabric tubes is shown in Figure 4.8. The groins were 300 feet long and 9 feet in diameter with spacing between the groins of 450 feet. After the 2001 fill, the erosion accelerated to 122 feet/year in a similar manner to the period following the 1997 fill. However, unlike the period following the 1997 fill, the rapid erosion rate did not abate after one year. The failure of the shoreline to stabilize after the 2001 fill is likely due to the absence of a functioning groin field. During a site visit in December 2003, no functioning groins were found. A picture of the remains of one of the geo-textile groin is shown in Figure

123 Figure Beach Fill with Geotextile Groins. 111

124 Shoreline Location Station Erosion Rate 6/97 to 6/98-85 Ft/Yr Erosion Rate 9/98 to 11/00-5 Ft/Yr Erosion Rate 8/01 to 6/ Ft/Yr FILL 2001 FILL /28/1995 3/11/1997 7/24/ /6/1999 4/19/2001 9/1/2002 1/14/2004 Date Figure 4.9 Shoreline Locations and Erosion Rates for Station Figure 4.10 The Remains of a Geotextile Groin near the West End of the Groin Field on 31 December
125 The annual erosion rates for both 1997 and 2001 fills are plotted in Figure The shape of the erosion curve is similar for both fills except for zone 1. The erosion for the 2001 fill at station versus the accretion at this station for the 1997 fill is due to the shoreline in the 2001 fill being pushed 200 feet further seaward than the 1997 fill. Placing a large amount of fill in an inlet-controlled area was unsustainable Annual Erosion Rates Zone Zone 2 Zone 3 6/97 to 6/98 8/01 to 6/ FILL GROIN FIELD Station Figure 4.11 Annual Erosion Rate 1997 and 2001 Beach Fills. The lower erosion rate after the 1997 fill in zone 2 is attributed to the groin field being in place and functioning. The higher erosion rate at station 118 after the 1997 fill is due to transition losses at the end of the fill. Quantitative comparisons of the shoreline response before and after the dredging are biased by the large fill in 2001 and by the failure of the 16 groins located on the west end of the island. Qualitatively, the present shoreline appears to be responding similar to the prior beach fill occurring before the dredging operation. This coupled with no major changes to the offshore bathymetry and currents indicates that at this time there have been no identifiable changes to the Bald Head Island due to the new project. As in the past several decades, erosion experienced along the southwest corner of Bald Head Island reflects the difficulty of maintaining a stable shoreline in the immediate vicinity of the river entrance. The large fill losses within this area coupled with rapid growth of a sand spit impinging on the channel demonstrate the need for the groin field to retain sediment placed in this area. Recognizing the need to nourish this erosive problem area due to the threatened loss of the road and other structures, the Corps of Engineers and the Village 113
126 of Bald Head have worked jointly to develop a plan for the next disposal operation. In this regard, Clean Sweep II is scheduled for fiscal year With the timing of Clean Sweep II coming approximately two years after completion of the initial construction, this operation is considered the first maintenance after dredging of the new channel. In accordance with the sand management plan, dredging during the first cycle is designated for disposal along Bald Head Island. With the commitment from Bald Head Island to undertake the rehabilitation of geotextile groin system, the Corps of Engineers has agreed to extend the disposal limits to cover the problem area. Details of the plan are being worked out at this time. This area will continue to be monitored to assess the effectiveness of the groin system in retaining the beach fill in this area. 114
127 Ebb and Nearshore Shoal Response General. As discussed in Part 3, detailed bathymetry of the Cape Fear River ebb tidal delta and channels were collected on three occasions specifically; August-September 2000, December 2001-January 2002 and January These surveys were combined with bathymetric data from the LARC offshore profile lines to produce comprehensive surveys of the monitoring area. The results of the surveys are discussed below which are summarized from the previously referenced letter reports (McNinch 2002 and McNinch 2003). The results focus on two survey regions that exhibited change in bathymetry between the 2000 and 2003 surveys. These regions covered the area surrounding the mouth of the Cape Fear River (inner region) and the area at the junction of the old and new channel alignments (outer region). Results-Ebb Tidal Delta Inlet (inner) Region. The ebb tidal delta surrounding the mouth of the Cape Fear River consists of three linear shoals. Two shoals are present on the west side of the shipping channel (Jay Bird Shoals) and the third or Bald Head Shoal protrudes off the southwestern corner of Bald Head Island east of the main channel. The main channel exits into the ocean immediately adjacent to Bald Head Island along West Beach. A companion flood margin channel, typical of most tidal inlets, is not present through Bald Head Shoal; however, a well-developed flood channel exists along the tip of Oak Island on the opposite side of the entrance channel. A comparison of this inner region showing a change between the 2000 and 2003 surveys is given in Figure This contour change map shows deepened scour areas as negative values in shades of red and shoaled areas as positive yellow tones. The comparison shows a deepening of the flood margin channel on the Oak Island side and along the main shipping channel; the latter deepening being attributed to the dredging of the new channel. Also, the immediate nearshore along Bald Head Island adjacent to the inlet and Bald Head Shoal appears to have been quite dynamic during this period displaying accretion in some areas and erosion in others. This pattern reflects the loss of beach fill placed during construction along south beach and the attendant growth of the sand spit from the southwest corner of the island. Finally the overall morphology of the ebb tidal delta appears to be largely static which suggests there have not been substantial changes in sediment transport pathways around the ebb tidal delta since the initial pre-construction 2000 survey. Results-Ebb Tidal Delta Inlet (outer) Channel Region. A similar bathymetric change map showing changes in contours between 2000 and 2003 for the distal end of the ebb tidal delta is presented in Figure The most dominant feature shown in the figure is the newly dredged channel alignment. Very little change is shown elsewhere in the outer region. Of particular interest is the lack of change in the area of the shoal between the two channels. This portion of the shoal is expected to be the most sensitive to changes because of its location between the channels where the magnitude of mean currents around the distal end of the ebb tidal delta are the highest. In a similar manner, the larger shoals surrounding the new channel show minimal change over the three survey years and, like the minimal change near the inlet, suggest little change in sediment transport pathways along the offshore end of the ebb tidal delta. 115

128 Figure 4.15 Change Map Showing a Deepening from 2000 to 2003 as negative and more shallow as positive in the tidal inlet region 116
129 Figure 4.16 Change Map Showing a Deepening from 2000 to 2003 as negative and more Shallow as positive in the new channel region. 117
130 Changes in Currents and Tidal Prism Currents were measured in the Cape Fear River entrance near Bald Head Island and Caswell Beach before dredging of the new alignment (October 11 and 12, 2000) and after dredging was completed (April 12 and 13, 2002 and March 4 and 18, 2003). A vessel mounted Acoustic Doppler Current Profiler (ADCP) was used to measure currents along a transect throughout a tidal cycle. See Part 3 for discussion of the measurement techniques and results for each of the three measurement episodes. Current Velocities (Direction and Magnitude). Maximum current magnitudes are compared for both near-surface and near-bottom currents during ebb and flood flows in Table 4.3 for the inlet transect. Interestingly, the near-bottom ebb current magnitudes differ by less than 11 percent for all three surveys while the near-surface ebb currents are greater for the April 2002 and March 2003 surveys by between 46 and 22 percent. These increases for the later surveys may be related to increased discharges down the Cape Fear River during this time (see Current Measurement discussion in Part 3). These current magnitudes provide only a snapshot at the time of the survey and vary temporally and spatially especially considering other forcing functions (winds, discharges, lunar cycle, etc.). Table 4.3 Maximum Magnitude of Mean Flows at Inlet Transect October 2000 April 2002 March 2003 Near-bottom* ebb 3.48 ft/s 3.83 ft/s 3.87 ft/s (1.06 m/s) (1.67 m/s) (1.80 m/s) flood 3.28 ft/s 3.67 ft/s 4.82 ft/s (1.00 m/s) (1.12 m/s) (1.47 m/s) Near-surface* ebb 4.43 ft/s 6.46 ft/s 5.41 ft/s (1.35 m/s) (1.97 m/s) (1.65 m/s) flood 3.61 ft/s 4.10 ft/s 4.17 ft/s (1.10 m/s) (1.25 m/s) (1.27 m/s) *Near-bottom defined by lower half of water column; near-surface defined by upper half of water column Similar comparisons for the offshore transect are shown in Table 4.4. In contrast to the inlet transect, the near-bottom ebb flow showed about a 50 percent greater magnitude for the April 2002 and March 2003 surveys over the October 2000 survey. Similar differences were also observed for the near-bottom flood flows. For the near-surface flows, the differences were not as great except for the April 2002 near-surface flood. As stated previously, these magnitudes provide only a snapshot at the time of the survey and vary temporally and spatially especially considering other forcing functions (winds, discharges, lunar cycle, etc.). 118
131 Table 4.4 Maximum Magnitude of Mean Flows at Offshore Transect October 2000 April 2002 March 2003 Near-bottom* ebb 2.03 ft/s 3.08 ft/s 3.15 ft/s (0.62 m/s) (0.94 m/s) (0.96 m/s) flood 1.31 ft/s 1.93 ft/s 2.69 ft/s (0.40 m/s) (0.59 m/s) (0.82 m/s) Near-surface* ebb 3.08 ft/s 3.38 ft/s 3.87 ft/s (0.94 m/s) (1.03 m/s) (1.18 m/s) flood 1.41 ft/s 2.49 ft/s 1.87 ft/s (0.43 m/s) (0.76 m/s) (0.57 m/s) *Near-bottom defined by lower half of water column; near-surface defined by upper half of water column Tide elevations at the Bald Head wave gauge were examined for the period during the ADCP surveys to compare tide ranges during the surveys with predicted tide ranges (Table 4.5). This comparison was made to identify any temporal wind or wave influenced differences that might help to explain current magnitude differences observed in Tables 4.3 and 4.4 and tidal prism differences observed in Figure Table 4.5 Predicted and Observed Tide Ranges during ADCP Survey Predicted Tide Observed Tide Date Times (Local) Range Range Flood Ebb Flood Ebb (ft) (ft) (ft) (ft) Inlet Transect 11 Oct Apr Mar * * Offshore Transect 12 Oct (13 Oct 2000) Apr Mar *Gauge not operational Plots of predicted and observed water levels recorded at the Bald Head wave gauge during ADCP surveys are shown in Figures 4.17 through In all cases (except Figure 4.19 where the gauge was not operational), the observed water level elevations exceeded the predicted water levels. 119
132 Start Inlet Transect Stop Offshore Transect Start Stop Figure 4.17 Predicted and observed water levels during the October 2000 ADCP survey Inlet Transect Offshore Transect Start Stop Start Stop Figure 4.18 Predicted and observed water levels during the April 2002 ADCP survey 120
133 Start Inlet Transect Stop Figure 4.19 Predicted and observed water levels during the March 2003 ADCP survey (Inlet Transect) Offshore Transect Start Stop Figure 4.20 Predicted and observed water levels during the March 2003 ADCP survey (Offshore Transect) 121
134 Flow patterns from October 2000 appear similar to those measured in April 2002 for the inlet transect (Figures 4.21 and 4.22 for flood flow and Figures 4.23 and 4.24 for ebb flow), except for the shoals adjacent to Oak Island. This area was inadvertently not included in the October 2000 survey. For the offshore transect (Figures 4.25 and 4.26 for flood flow and Figures 4.27 and 4.28 for ebb flow), flow patterns appear similar except for small areas directly over the new channel alignment during ebb. Interestingly, the highest flow magnitudes appear to remain in the old shipping channel, and only during part of the tide cycle is there any evidence that the flow field is influenced by the new channel where nearbottom flow appears to lead in the flooding direction (Figure 4.29). 122
135 Figure 4.21 October 2000 ADCP survey at inlet transect during peak flood flow. Note that survey transect does not cover same area as the April 2002 survey. Figure 4.22 April 2002 ADCP survey at inlet transect during peak flood flow. Note that survey transect does not cover same area as the October 2000 survey. 123
136 Figure 4.23 October 2000 ADCP survey at inlet transect during peak ebb flow. Note that survey transect does not cover same area as the April 2002 survey. Figure 4.24 April 2002 ADCP survey at inlet transect during peak ebb flow. Note that survey transect does not cover same area as the October 2000 survey. 124

137 Figure 4.25 October 2000 ADCP survey at offshore transect during peak flood flow. Figure 4.26 April 2002 ADCP survey at offshore transect during peak flood flow. 125

138 Figure 4.27 October 2000 ADCP survey at offshore transect during peak ebb flow. Figure 4.28 April 2002 ADCP survey at offshore transect during peak ebb flow. 126
139 Figure 4.29 Near-bottom flow field reversal on flood tide from April 2002 survey Comparing the April 2002 surveys with the March 2003 surveys showed similar flow patterns for the inlet transect. Figures 4.30 and 4.31 show the inlet transect surveys during ebb flow, and Figures 4.32 and 4.33 show the inlet transect during flood flow. At the offshore transect, flow patterns in April 2002 are similar to those measured in March 2003 (Figures 4.34 and 4.35 during ebb and Figures 4.36 and 4.37 during flood), except for the region directly over the new channel. No apparent changes are noted for the ebb flow except for the preference of the flow in the old navigation channel. During the flood flow, no effect of the old or new channel alignment is observed. The similarities of the flow regime between pre- and post-dredging do not indicate substantial changes have occurred and are consistent with the minimal change seen in the bathymetry of the ebb tidal delta. There also does not appear to be a substantial decrease in current magnitude through the old shipping channel since the opening of the new channel. 127
140 Figure 4.30 April 2002 ADCP survey at inlet transect during ebb flow. Figure 4.31 March 2003 ADCP survey at inlet transect during ebb flow. 128

141 Figure 4.32 April 2002 ADCP survey at inlet transect during flood flow. Figure 4.33 March 2003 ADCP survey at inlet transect during flood flow. 129
142 near-surface velocity near-bottom velocity vector scale m/s Ebb Tidal Inlet Jan bathymetry contours in m, NGVD Figure 4.34 April 2002 ADCP survey at offshore transect during ebb flow. Figure 4.35 March 2003 ADCP survey at offshore transect during ebb flow. 130
143 near-surface velocity near-bottom velocity vector scale m/s Ebb Tidal Inlet Jan bathymetry contours in m, NGVD Figure 4.36 April 2002 ADCP survey at offshore transect during flood flow. Figure 4.37 March 2003 ADCP survey at offshore transect during flood flow. 131
144 Tidal Prism. Tidal prisms were computed utilizing the inlet throat transect for each of the three current measurements, namely the pre-dredging (October 2000) and post-dredging (April 2002 and March 2003) ADCP surveys. These computations represent snapshots of the tidal period for each respective date and include the results of other non-tidal forcing agents as well as natural variations in tide conditions. Other forces which influence flow are windforcing, river discharge as well as differences in astronomical tides at different times of the year and across a tidal epoch (i.e. spring tides are not necessarily equal through time). To make more meaningful comparisons of the three surveys, the tidal prism computations were normalized across the inlet cross-section area as defined by the January 2003 bathymetry and transect shown in Figure Figure 4.38 shows the results of this normalized comparison. Figure 4.38 Normalized tidal prism for three surveys October 2000 (1), April 2002 (2) and March 2003 (3). Blue flood, Green ebb, Red total The normalizing process applies the average velocity from the ADCP survey across the inlet cross-section area multiplied by the tidal period. The October 2000 inlet transect survey only covered the inlet throat because at that time it was believed that insignificant flow existed over the shoals adjacent to Oak Island. Subsequent hydrographic surveys and current measurements indicated otherwise, so the April 2002 and March 2003 inlet transects were enlarged. Thus the average velocity for the October 2000 survey, since it only incorporated a portion of the inlet cross-section, possibly differed from what would have been measured if the whole cross-section had been surveyed. In addition, differences from 132

145 winds, river discharge, and astronomical period should be considered when explaining the differences observed in Figure Figure 4.39 shows the tidal prisms measured along the north leg of the transect for the April 2002 and March 2003 surveys compared with other tidal prisms from around the U.S. The tidal prism in both years fall within the 95 percent confidence interval of the regression line determined from other inlets. One of the strengths of ADCP surveys is to provide calibration and verification data for use in applying numerical simulation models of tidal currents and circulation. With a calibrated and verified hydrodynamic model, multiple scenarios of different bathymetric conditions and channel alignments can be examined to explore relative differences in tidal currents and prism. For example, an acceptable hydrodynamic model like ADCIRC could be run with waves, bathymetry and channel configurations at the time of each ADCP survey and thus calibrated so that different bathymetric and channel configurations (e.g., old channel alignment) with the same wave conditions could be examined for comparison of tide ranges and tidal prisms. This type of modeling is planned for future monitoring reports if funding is available. Cape Fear River: tidal prism April 02 Cape Fear River: tidal prism March 03 Figure 4.39 April 2002 and March 2003 tidal prism comparisons with other inlets 133
Inlet Management Study for Pass-A-Grille and Bunces Pass, Pinellas County, Florida
 Inlet Management Study for Pass-A-Grille and Bunces Pass, Pinellas County, Florida Final Report Submitted By Ping Wang, Ph.D., Jun Cheng Ph.D., Zachary Westfall, and Mathieu Vallee Coastal Research Laboratory
UPPER BEACH REPLENISHMENT PROJECT RELATED
 ASSESSMENT OF SAND VOLUME LOSS at the TOWNSHIP of UPPER BEACH REPLENISHMENT PROJECT RELATED to the LANDFALL OF HURRICANE SANDY - PURSUANT TO NJ-DR 4086 This assessment is in response to Hurricane Sandy
Figure 4, Photo mosaic taken on February 14 about an hour before sunset near low tide.
 The Impact on Great South Bay of the Breach at Old Inlet Charles N. Flagg and Roger Flood School of Marine and Atmospheric Sciences, Stony Brook University Since the last report was issued on January 31
Table 4. Volumetric Change Rates Pre-Project and Post-Project for the Town of Duck
 V. VOLUMETRIC CHANGES General Volumetric changes measured over the entire monitoring area for various time periods are provided in Table 4. The volume changes are given in terms of cubic yards/foot of
Volume and Shoreline Changes along Pinellas County Beaches during Tropical Storm Debby
 Volume and Shoreline Changes along Pinellas County Beaches during Tropical Storm Debby Ping Wang and Tiffany M. Roberts Coastal Research Laboratory University of South Florida July 24, 2012 Introduction
Long Beach Island Holgate Spit Little Egg Inlet Historical Evolution Introduction Longshore Transport Map, Survey and Photo Historic Sequence
 Appendix B Long Beach Island Holgate Spit Little Egg Inlet Historical Evolution Introduction The undeveloped southern end of Long Beach Island (LBI) is referred to as the Holgate spit as it adjoins the
MOREHEAD CITY HARBOR, NC. Dredged Material Management Plan (DMMP)
") MOREHEAD CITY HARBOR, NC Dredged Material Management Plan (DMMP) Public Meeting/Info Session 15 January 2014 US Army Corps of Engineers Morehead City Harbor DMMP Presentation Topics Morehead City Harbor
MOREHEAD CITY HARBOR, NC Dredged Material Management Plan (DMMP) Public Meeting/Info Session 15 January 2014 US Army Corps of Engineers Morehead City Harbor DMMP Presentation Topics Morehead City Harbor
CROSS-SHORE SEDIMENT PROCESSES
 The University of the West Indies Organization of American States PROFESSIONAL DEVELOPMENT PROGRAMME: COASTAL INFRASTRUCTURE DESIGN, CONSTRUCTION AND MAINTENANCE A COURSE IN COASTAL DEFENSE SYSTEMS I CHAPTER
Appendix E Cat Island Borrow Area Analysis
 Appendix E Cat Island Borrow Area Analysis ERDC/CHL Letter Report 1 Cat Island Borrow Area Analysis Multiple borrow area configurations were considered for Cat Island restoration. Borrow area CI1 is located
Sediment Transport Analysis Village of Asharoken, New York
 Sediment Transport Analysis Village of Asharoken, New York NORTH SHORE OF LONG ISLAND, NEW YORK COMBINED EROSION CONTROL AND STORM DAMAGE PROTECTION FEASIBILITY STUDY FINAL REPORT August 2004 Cell 0 Asharoken
EVALUATION OF BEACH EROSION UP-DRIFT OF TIDAL INLETS IN SOUTHWEST AND CENTRAL FLORIDA, USA. Mohamed A. Dabees 1 and Brett D.
 EVALUATION OF BEACH EROSION UP-DRIFT OF TIDAL INLETS IN SOUTHWEST AND CENTRAL FLORIDA, USA Mohamed A. Dabees 1 and Brett D. Moore 1 The paper discusses the analysis of up-drift beach erosion near selected
Town of Duck, North Carolina
 Tracking No. 00.00.2010 Erosion Mitigation And Shoreline Management Feasibility Study Town of Duck, North Carolina Coastal Planning & Engineering of North Carolina August 15, 2012 Tom Jarrett Robert Neal
CLAM PASS RESTORATION AND MANAGEMENT PLAN BATHYMETRIC MONITORING REPORT NO. 7 Including Interior Bay Dredge Cuts and Tidal Data
 CLAM PASS RESTORATION AND MANAGEMENT PLAN BATHYMETRIC MONITORING REPORT NO. 7 Including Interior Bay Dredge Cuts and Tidal Data Submitted to: Florida Department of Environmental Protection DEP File No.
New Jersey Coastal Zone Overview. The New Jersey Beach Profile Network (NJBPN) 3 Dimensional Assessments. Quantifying Shoreline Migration
 3 Dimensional Assessments. Quantifying Shoreline Migration") New Jersey Coastal Zone Overview The New Jersey Beach Profile Network (NJBPN) Objectives Profile Locations Data Collection Analyzing NJBPN Data Examples 3 Dimensional Assessments Methodology Examples Quantifying
New Jersey Coastal Zone Overview The New Jersey Beach Profile Network (NJBPN) Objectives Profile Locations Data Collection Analyzing NJBPN Data Examples 3 Dimensional Assessments Methodology Examples Quantifying
RE: Hurricane Matthew Beach Damage Assessment and Recommendations [CSE 2416]
![RE: Hurricane Matthew Beach Damage Assessment and Recommendations [CSE 2416]](/thumbs/83/87675702.jpg "RE: Hurricane Matthew Beach Damage Assessment and Recommendations [CSE 2416]") October 25, 2016 Iris Hill Town Administrator Town of Edisto Beach 2414 Murray St Edisto Beach SC 29438 RE: Hurricane Matthew Beach Damage Assessment and Recommendations [CSE 2416] Dear Iris, Hurricane
October 25, 2016 Iris Hill Town Administrator Town of Edisto Beach 2414 Murray St Edisto Beach SC 29438 RE: Hurricane Matthew Beach Damage Assessment and Recommendations [CSE 2416] Dear Iris, Hurricane
Figure 1 Example feature overview.
 1. Introduction This case focuses on the northeastern region of Onslow Bay, NC, and includes an initial shoreline, regional contour, wave gauges, inlets, dredging, and beach fills. Most of the features
STORM RESPONSE SIMULATION
 APPENDIX V STORM RESPONSE SIMULATION Final Environmental Impact Statement Village of Bald Head Island Shoreline Protection Project Brunswick County, North Carolina Delft3D Storm Response Simulations With
Assateague Island National Seashore North End Restoration Project Timeline
 Assateague Island National Seashore North End Restoration Project Timeline Date Event Some information provided in the Project Introduction document. Detailed events are available in a timeline compiled
CHAPTER 281 INFLUENCE OF NEARSHORE HARDBOTTOM ON REGIONAL SEDIMENT TRANSPORT
 CHAPTER 281 INFLUENCE OF NEARSHORE HARDBOTTOM ON REGIONAL SEDIMENT TRANSPORT Paul C.-P. Lin, Ph.D., P.E. 1 and R. Harvey Sasso, P.E. 2 ABSTRACT The influence of nearshore hardbottom on longshore and cross-shore
Beach Nourishment Impact on Beach Safety and Surfing in the North Reach of Brevard County, Florida
 Beach Nourishment Impact on Beach Safety and Surfing in the North Reach of Brevard County, Florida Prepared by John Hearin, Ph.D. Coastal Engineering Vice Chairman Cocoa Beach Chapter Port Canaveral Patrick
Performance of Upham Beach T-Groin Project and Its Impact to the Downdrift Beach
 Performance of Upham Beach T-Groin Project and Its Impact to the Downdrift Beach Progress Report for the Period of October 2008 to April 2009 Submitted by Ping Wang, Ph.D., and Tiffany M. Roberts Department
New Jersey Beach Profile Network Atlantic County Profile Site Locations
 215 RICHARD STOCKTON COLLEGE OF NEW JERSEY New Jersey Beach Profile Network Atlantic County Profile Site Locations COASTAL RESEARCH CENTER Figure 128 There are nine NJBPN survey sites on the Atlantic County
23- Year Sand Volume Changes at Site 132, 15th Street, Brigantine
 149 Figure75. Location map for the 9 NJBPN profile sites in Atlantic County, NJ ATLANTIC COUNTY SPRING 2008 to FALL 2009 150 The Atlantic County oceanfront shoreline consists of three barrier islands.
HURRICANE SANDY LIMITED REEVALUATION REPORT UNION BEACH, NEW JERSEY DRAFT ENGINEERING APPENDIX SUB APPENDIX D SBEACH MODELING
 HURRICANE SANDY LIMITED REEVALUATION REPORT UNION BEACH, NEW JERSEY DRAFT ENGINEERING APPENDIX SUB APPENDIX D SBEACH MODELING Rev. 18 Feb 2015 1 SBEACH Modeling 1.0 Introduction Following the methodology
CORPS ON THE COAST. North Carolina Coastal Conference Coastal Infrastructure Raleigh, NC April 14, Jim Medlock Chief, Programs Management Branch
 CORPS ON THE COAST North Carolina Coastal Conference Coastal Infrastructure Raleigh, NC April 14, 2015 Jim Medlock Chief, Programs Management Branch US Army Corps of Engineers OVERVIEW What Are The Corps
CRC Inlet Management Study. Matt Slagel Shoreline Management Specialist
 CRC Inlet Management Study Matt Slagel Shoreline Management Specialist Study Origin CRC shall study feasibility of creating new AEC for lands adjacent to mouth of Cape Fear River (HB 819) Collaborate with
Nearshore Placed Mound Physical Model Experiment
 Nearshore Placed Mound Physical Model Experiment PURPOSE: This technical note describes the migration and dispersion of a nearshore mound subjected to waves in a physical model. The summary includes recommendations
Figure79. Location map for the 10 NJBPN profile sites in Atlantic County, NJ 155
 154 Figure79. Location map for the 10 NJBPN profile sites in Atlantic County, NJ 155 ATLANTIC COUNTY SPRING 2009 to FALL 2010 The Atlantic County coastline consists of three barrier islands. Between Little
CLAM PASS ANNUAL RESTORATION & MANAGEMENT PLAN TIDAL ANALYSIS ELEMENT REPORT NO. 13
 CLAM PASS ANNUAL RESTORATION & MANAGEMENT PLAN TIDAL ANALYSIS ELEMENT REPORT NO. 13 Submitted to: Pelican Bay Services Division Prepared by: Humiston & Moore Engineers H&M File No. 13-078 November 2012
Coastal Sediment Transport Modeling Ocean Beach & San Francisco Bight, CA
 1 Coastal Sediment Transport Modeling Ocean Beach & San Francisco Bight, CA Honghai Li and Lihwa Lin Engineering Research and Development Center U.S. Army Corps of Engineers Frank Wu, Lisa Andes, and James
The Continuing Evolution of the New Inlet
 The Continuing Evolution of the New Inlet Charles N. Flagg, Roger Flood and Robert Wilson School of Marine and Atmospheric Sciences, Stony Brook University It is now a year plus since super storm Sandy
Figure 262. Location map for the 10 NJBPN profile sites in Atlantic County, NJ 279
 278 Figure 262. Location map for the 10 NJBPN profile sites in Atlantic County, NJ 279 ATLANTIC COUNTY SUMMARY The Atlantic County coastline consists of three barrier islands. The island of Little Beach
CORPS FACTS. Harbor Dredging U.S. ARMY CORPS OF ENGINEERS BUILDING STRONG
 CORPS FACTS Harbor Dredging U.S. ARMY CORPS OF ENGINEERS BUILDING STRONG Disaster Response Sedimentation in the channel is caused by the normal cycle of silt movement, erosion from high water or heavy
The Impact on Great South Bay of the Breach at Old Inlet Charles N. Flagg School of Marine and Atmospheric Sciences, Stony Brook University
 The Impact on Great South Bay of the Breach at Old Inlet Charles N. Flagg School of Marine and Atmospheric Sciences, Stony Brook University The previous report provided a detailed look at the conditions
Southwest Washington Littoral Drift Restoration Project: Design, Construction, and Monitoring
 Southwest Washington Littoral Drift Restoration Project: Design, Construction, and Monitoring J Jessica i St Stokke kk USACE Portland District October 28, 2010 WEDA Pacific Meeting Monterey, CA US Army
CHAPTER 134 INTRODUCTION
 CHAPTER 134 NEW JETTIES FOR TUNG-KANG FISHING HARBOR, TAIWAN Chi-Fu Su Manager Engineering Department Taiwan Fisheries Consultants, Inc. Taipei, Taiwan INTRODUCTION Tung-Kang Fishing Harbor, which is about
Tanya M. Beck. Kelly Legault. Research Physical Scientist Coastal & Hydraulics Lab, ERDC Vicksburg, MS
 Inlet And Adjacent Shoreline Processes at Cascading Time Scales Using the Coastal Modeling System and GenCade Tanya M. Beck Research Physical Scientist Coastal & Hydraulics Lab, ERDC Vicksburg, MS Kelly
page - Laboratory Exercise #5 Shoreline Processes
 page - Laboratory Exercise #5 Shoreline Processes Section A Shoreline Processes: Overview of Waves The ocean s surface is influenced by three types of motion (waves, tides and surface currents). Shorelines
2018 Annual Beach Monitoring Report
 May 1, 218 Town of Hilton Head Island, SC 218 Annual Beach Monitoring Report Submitted to: Town of Hilton Head Island, SC November 15, 217 Prepared by: Olsen Associates, Inc. 2618 Herschel Street Jacksonville,
Nome Harbor Page 2 of 12
 Nome Harbor Nome Harbor Page 2 of 12 Condition of Improvements 30 December 2015 Nome Harbor, Alaska (CWIS No. 010422, 012270, 072742, 087755) Authorization (1) Rivers and Harbors Act, 8 August 1917 (House
Compiled by Uwe Dornbusch. Edited by Cherith Moses
 REPORT ON WAVE AND TIDE MEASUREMENTS Compiled by Uwe Dornbusch. Edited by Cherith Moses 1 Aims...1 2 Summary...1 3 Introduction...1 4 Site selection...1 5 Wave recorder settings...2 6 Results...2 6.1 Water
DRAFT. October 17, 2014 File No Mr. Brendhan Zubricki Town Administrator Essex Town Hall 30 Martin Street Essex, MA.
 GZA GeoEnvironmental, Inc. Engineers and Scientists October 17, 2014 File No. 18.0171857.00 Mr. Brendhan Zubricki Town Administrator Essex Town Hall 30 Martin Street Essex, MA. 01929 DRAFT Re: Essex River
Dune Monitoring Data Update Summary: 2013
 Dune Monitoring Data Update Summary: 13 Shoreline Studies Program Virginia Institute of Marine Science College of William & Mary Gloucester Point, Virginia September 13 Dune Monitoring Data Update Summary:
Impact of Dredging the Lower Narrow River on Circulation and Flushing
 Impact of Dredging the Lower Narrow River on Circulation and Flushing Craig Swanson Ph.D. Swanson Environmental Alex Shaw Ocean Engineering, URI Prof. Malcolm L. Spaulding Ocean Engineering, URI 29 January
Monitoring Morphology and Currents at the Hatteras Breach
 Monitoring Morphology and Currents at the Hatteras Breach By Ty V. Wamsley U.S. Army Engineering Research and Development Center Coastal and Hydraulics Laboratory 3909 Halls Ferry Road, Vicksburg, MS 39180
SPECIAL SPRING 2018 STORM REPORT ON THE CONDITION OF THE MUNICIPAL BEACHES FOR THE BOROUGH OF STONE HARBOR, CAPE MAY COUNTY, NEW JERSEY
 SPECIAL SPRING 2018 STORM REPORT ON THE CONDITION OF THE MUNICIPAL BEACHES FOR THE BOROUGH OF STONE HARBOR, CAPE MAY COUNTY, NEW JERSEY Aerial photograph taken April 21, 2018 showing the view up the beach
Building Beaches with Navigation Sand, Just Don t Forget the Dunes!!
 Building Beaches with Navigation Sand, Just Don t Forget the Dunes!! Ken Willson Kenneth.Willson@CBI.com Introduction Decrease in Federal Funding (Shallow Draft Navigation Maintenance and Shore Protection)
Comparison of Predicted and Measured Shoaling at Morro Bay Harbor Entrance, California
 Comparison of Predicted and Measured Shoaling at Morro Bay Harbor Entrance, California by Edward F. Thompson, Inocencio P. DiRamos, and Robert R. Bottin, Jr. PURPOSE: This Coastal and Hydraulics Engineering
The purpose and needs of the Figure Eight Island Inlet and Shoreline Management Project are as follows:
 Chapter 2 PURPOSE AND NEEDS 1. What are the purpose and needs of this project? The main concern of residents and owners at Figure Eight Island are economic losses resulting from damages to structures and
APPENDIX C. Fluvial and Tidal Hydraulics Report
 APPENDIX C Fluvial and Tidal Hydraulics Report BUENA VISTA LAGOON ENHANCEMENT PROJECT FLUVIAL AND TIDAL HYDRAULICS ANALYSES Prepared for: SANDAG 401 B Street, Suite 800 San Diego, California 92101 Contact:
100-YEARS OF SHOAL EVOLUTION AT THE MOUTH OF THE COLUMBIA RIVER: IMPACTS ON CHANNEL, STRUCTURES, AND SHORELINES
 100-YEARS OF SHOAL EVOLUTION AT THE MOUTH OF THE COLUMBIA RIVER: IMPACTS ON CHANNEL, STRUCTURES, AND SHORELINES Hans R. Moritz, 1 Heidi P. Moritz, 2 Jessica R. Hays, 3 and Heather R. Sumerell 4 Abstract:
North Carolina s Terminal Groins at Oregon Inlet and Fort Macon Descriptions and Discussions
 Attachment 2 North Carolina s Terminal Groins at Oregon Inlet and Fort Macon Descriptions and Discussions Oregon Inlet Terminal Groin Introduction/Background Oregon Inlet was created by a hurricane on
BALD HEAD ISLAND, NC SAND SHARING SYSTEM OVERVIEW AND ASSESSMENT. Erik J. Olsen, P.E. olsen associates, inc.
 BALD HEAD ISLAND, NC SAND SHARING SYSTEM OVERVIEW AND ASSESSMENT Erik J. Olsen, P.E. Olsen Associates, Inc. BACKGROUND Both the Village of Bald Head Island (VBHI) and the Bald Head Island Limited, LLC.
DUNE STABILIZATION AND BEACH EROSION
 DUNE STABILIZATION AND BEACH EROSION CAPE HATTERAS NATIONAL SEASHORE NORTH CAROLINA ROBERT DOLAN PAUL GODFREY U. S. DEPARTMENT OF INTERIOR NATIONAL PARK SERVICE OFFICE OF NATURAL SCIENCE WASHINGTON, D.
Reading Material. Inshore oceanography, Anikouchine and Sternberg The World Ocean, Prentice-Hall
 Reading Material Inshore oceanography, Anikouchine and Sternberg The World Ocean, Prentice-Hall BEACH PROCESSES AND COASTAL ENVIRONMENTS COASTAL FEATURES Cross section Map view Terminology for Coastal
CHAPTER 179. Performance of a Submerged Breakwater for Shore Protection
 CHAPTER 179 Abstract Performance of a Submerged Breakwater for Shore Protection Albert E. Browder',A. Member, ASCE; Robert G. Dean 2, Member, ASCE; and Renjie Chen 3 A summary is presented of the results
Nearshore Dredged Material Placement Pilot Study at Noyo Harbor, CA
 1 Nearshore Dredged Material Placement Pilot Study at Noyo Harbor, CA Noyo Cove N 2011 National Conference on Beach Preservation Technology 9-11, February 2011 Lihwa Lin, Honghai Li, Mitchell Brown US
Impacts of breakwaters and training walls
 Across the eastern seaboard of Australia, breakwaters and training walls have instigated fundamental perturbations to coastal and estuary processes. This has induced long-term changes to foreshore alignments,
USE OF SEGMENTED OFFSHORE BREAKWATERS FOR BEACH EROSION CONTROL
 .. CETN-III-22 4/84 PURPOSE: USE OF SEGMENTED OFFSHORE BREAKWATERS FOR BEACH EROSION CONTROL To provide information on the functional application of and general design considerations for using offshore
NEED FOR SUPPLEMENTAL BATHYMETRIC SURVEY DATA COLLECTION
 305 West Grand Avenue, Suite 300 Montvale, New Jersey 07645 Phone 201.930.9890 Fax 201.930.9805 www.anchorqea.com M EMORANDUM To: Caroline Kwan and Nica Klaber U.S. Environmental Protection Agency Region
2014 ANNUAL REPORT - TO THE CITY OF NORTH WILDWOOD ON THE CONDITION OF THE CITY BEACHES
 2014 ANNUAL REPORT - TO THE CITY OF NORTH WILDWOOD ON THE CONDITION OF THE CITY BEACHES View on September 25, 2014 looking northwest into Hereford Inlet. Considerable southerly expansion of the tip of
Modeling Sediment Transport Along the Upper Texas Coast
 Modeling Sediment Transport Along the Upper Texas Coast David B. King Jr. Jeffery P. Waters William R. Curtis Highway 87 roadbed, Jefferson County Galveston District Corps Sabine Pass to San Luis Pass
3.3 OCEANOGRAPHY/COASTAL PROCESSES
 3.3 OCEANOGRAPHY/COASTAL PROCESSES Beaches are dynamic and conditions vary based on the onshore/offshore movement of sand both seasonally and annually. Sand also moves alongshore within a generally defined
Barrier Progradation Related to Inlet Spacing and Migration Patterns L.E. Budde and W.J. Cleary
 Journal of Coastal Research SI 39 117-121 ICS 2004 (Proceedings) Brazil ISSN 0749-0208 Barrier Progradation Related to Inlet Spacing and Migration Patterns L.E. Budde and W.J. Cleary MS Candidate, Center
Coastal and Hydraulics Laboratory
 ERDC/CHL TR-17-13 Regional Sediment Management (RSM) Program Sediment Budget Analysis; Masonboro Inlet, North Carolina Kevin B. Conner and Linda S. Lillycrop August 2017 Coastal and Hydraulics Laboratory
Ninilchik Harbor Page 2 of 11
 Ninilchik Harbor Ninilchik Harbor Page 2 of 11 Condition of Improvements 31 December 2017 Ninilchik Harbor, Alaska (CWIS No. 012640, 087345) Authorization Rivers and Harbors Act, 3 July 1958 (P.L. 85-500
Real Time Surveying GPS and HYDRO Software for Tide and Swell Compensation
 Real Time Surveying GPS and HYDRO Software for Tide and Swell Compensation by Mr Michael Walker, B.Surv. (Otago) HYDRO Division Trimble Navigation New Zealand Ltd. Abstract This paper focuses on the use
A REVIEW OF THE CONDITION OF THE MUNICIPAL BEACHES AS A RESULT OF HURRICANE SANDY IN THE BOROUGH OF STONE HARBOR, CAPE MAY COUNTY, NEW JERSEY
 A REVIEW OF THE CONDITION OF THE MUNICIPAL BEACHES AS A RESULT OF HURRICANE SANDY IN THE BOROUGH OF STONE HARBOR, CAPE MAY COUNTY, NEW JERSEY View along the dune scarp from 103 rd Street on October 31,
Mouth of the Columbia River Jetties Three-Phase Construction Plan
 Mouth of the Columbia River Jetties Three-Phase Construction Plan Project Overview October 9, 2012 US Army Corps of Engineers MCR Jetties Major Rehabilitation Sand Island pile dikes 1930-1935 Columbia
Pathways Interns: Annika O Dea, Ian Conery, Andrea Albright
 1 REMOTE SENSING OF COASTAL MORPHODYNAMICS 237 237 237 217 217 217 2 2 2 8 119 27 252 174.59 255 255 255 163 163 163 131 132 122 239 65 53 11 135 12 112 92 56 62 12 13 12 56 48 13 12 111 Kate Brodie Brittany
INTRODUCTION TO COASTAL ENGINEERING
 The University of the West Indies Organization of American States PROFESSIONAL DEVELOPMENT PROGRAMME: COASTAL INFRASTRUCTURE DESIGN, CONSTRUCTION AND MAINTENANCE A COURSE IN COASTAL DEFENSE SYSTEMS I CHAPTER
SACO RIVER AND CAMP ELLIS BEACH SACO, MAINE SECTION 111 SHORE DAMAGE MITIGATION PROJECT APPENDIX F ECONOMIC ASSESSMENT
 SACO RIVER AND CAMP ELLIS BEACH SACO, MAINE SECTION 111 SHORE DAMAGE MITIGATION PROJECT APPENDIX F ECONOMIC ASSESSMENT Department of the Army New England District, Corps of Engineers 696 Virginia Road
ATLANTIC COAST OF LONG ISLAND, JONES INLET TO EAST ROCKAWAY INLET, LONG BEACH ISLAND, NY. Contract #2 Construction Scope. April 18th-19th 2018
 ATLANTIC COAST OF LONG ISLAND, JONES INLET TO EAST ROCKAWAY INLET, LONG BEACH ISLAND, NY Contract #2 Construction Scope April 18th-19th 2018 New York District PLAN COMPONENTS Length of Beachfill 35,000
1-32 NOME HARBOR, ALASKA (CWIS NOS , 87755, 12270, & 10422) Condition of Improvement 30 September 2012
 Condition of Improvement 30 September 2012") NOME HARBOR 1-32 NOME HARBOR, ALASKA (CWIS NOS. 72742, 87755, 12270, & 10422) Condition of Improvement 30 September 2012 AUTHORIZATION: (1) Rivers and Harbors Act, 8 August 1917 (House Doc. 1932, 64th
NOME HARBOR 1-32 NOME HARBOR, ALASKA (CWIS NOS. 72742, 87755, 12270, & 10422) Condition of Improvement 30 September 2012 AUTHORIZATION: (1) Rivers and Harbors Act, 8 August 1917 (House Doc. 1932, 64th
Severe Beach Erosion Caused by Permanent Beach Sand Loss Through Rollover Fish Pass Bolivar Peninsula, Texas
 DRAFT DRAFT DRAFT DRAFT DRAFT DRAFT DRAFT DRAFT Severe Beach Erosion Caused by Permanent Beach Sand Loss Through Rollover Fish Pass Bolivar Peninsula, Texas September, 1999 For J. Martin Green and Alan
STATUS REPORT FOR THE SUBMERGED REEF BALL TM ARTIFICIAL REEF SUBMERGED BREAKWATER BEACH STABILIZATION PROJECT FOR THE GRAND CAYMAN MARRIOTT HOTEL
 August 23 STATUS REPORT FOR THE SUBMERGED REEF BALL TM ARTIFICIAL REEF SUBMERGED BREAKWATER BEACH STABILIZATION PROJECT FOR THE GRAND CAYMAN MARRIOTT HOTEL performed by Lee E. Harris, Ph.D., P.E. Consulting
HARBOUR SEDIMENTATION - COMPARISON WITH MODEL
 HARBOUR SEDIMENTATION - COMPARISON WITH MODEL ABSTRACT A mobile-bed model study of Pointe Sapin Harbour, in the Gulf of St. Lawrence, resulted in construction of a detached breakwater and sand trap to
FINAL REPORT FOR 2013 ON THE CONDITION OF THE MUNICIPAL BEACHES IN THE TOWNSHIP OF UPPER, CAPE MAY COUNTY, NEW JERSEY
 FINAL REPORT FOR 2013 ON THE CONDITION OF THE MUNICIPAL BEACHES IN THE TOWNSHIP OF UPPER, CAPE MAY COUNTY, NEW JERSEY Aerial photograph at Corson s Inlet showing conditions on December 1, 2013 of the north
Southern California Beach Processes Study
 Southern California Beach Processes Study Torrey Pines Field Site 5th Quarterly Report 31 May 22 to California Resources Agency and California Department of Boating and Waterways R.T. Guza 1, W.C. O Reilly
APPENDIX A APPENDIX B APPENDIX C APPENDIX D APPENDIX E APPENDIX F APPENDIX G SEDIMENT ANALYSIS APPENDIX A WAVE & SEDIMENT MODELS CRYSTAL BALL ANALYSIS
 APPENDIX A WAVE & SEDIMENT MODELS APPENDIX B SEDIMENT ANALYSIS APPENDIX A WAVE & SEDIMENT MODELS APPENDIX C CRYSTAL BALL ANALYSIS APPENDIX D SBEACH ANALYSIS APPENDIX E GENESIS ANALYSIS APPENDIX F PREFERRED
IMPACTS OF COASTAL PROTECTION STRATEGIES ON THE COASTS OF CRETE: NUMERICAL EXPERIMENTS
 IMPACTS OF COASTAL PROTECTION STRATEGIES ON THE COASTS OF CRETE: NUMERICAL EXPERIMENTS Tsanis, I.K., Saied, U.M., Valavanis V. Department of Environmental Engineering, Technical University of Crete, Chania,
Geospatial Positioning Accuracy Standards Part 5: Standards for Nautical Charting Hydrographic Surveys - Public Review Draft
 Appendix B FGDC Hydrographic Accuracy Standard Geospatial Positioning Accuracy Standards Part 5: Standards for Nautical Charting Hydrographic Surveys - Public Review Draft Subcommittee on Marine and Coastal
ENVIRONMENT AGENCY GREAT OUSE AND 100 FT DRAIN QUARTERLY BATHYMETRIC SURVEY DECEMBER 2013 SITE SURVEY REPORT NO. H6787
 ENVIRONMENT AGENCY GREAT OUSE AND 100FT DRAIN QUARTERLY BATHYMETRIC SURVEY DECEMBER 2013 NO. H6787 LONGDIN & BROWNING (SURVEYS) LIMITED CHERRY TREE HOUSE CARMARTHEN ROAD SWANSEA SA1 1HE H6787 1 Measured
ST. JOSEPH PENINSULA, GULF COUNTY, FLORIDA Beach Re-Nourishment and Environmental Enhancement Project RECOMMENDATIONS
 ST. JOSEPH PENINSULA, GULF COUNTY, FLORIDA Beach Re-Nourishment and Environmental Enhancement Project RECOMMENDATIONS January 23, 2018 543 Harbor Boulevard, Suite 204 Destin, Florida 32541 850.654.1555
FINAL ENVIRONMENTAL IMPACT STATEMENT ON BROWARD COUNTY SHORE PROTECTION PROJECT SEGMENTS II AND III BROWARD COUNTY, FLORIDA
 FINAL ENVIRONMENTAL IMPACT STATEMENT ON BROWARD COUNTY SHORE PROTECTION PROJECT SEGMENTS II AND III BROWARD COUNTY, FLORIDA 1. PROJECT PURPOSE AND NEED 1.1. PROJECT AUTHORITY. 1.1.1. INITIAL AUTHORIZATION.
NC TERMINAL GROIN STUDY FINAL REPORT
 II. Physical Assessment This section addresses the geological framework, physical processes, and human-induced changes that influence erosional-depositional sedimentation patterns at tidal inlets and along
Atlantic Coast of Long Island, Jones Inlet to East Rockaway Inlet, Long Beach Island, NY Construction Update
 Atlantic Coast of Long Island, Jones Inlet to East Rockaway Inlet, Long Beach Island, NY Construction Update June 2016 US Army Corps of Engineers Project Purpose Three specific damage mechanisms of coastal
APPENDIX M DREDGED MATERIAL MANAGEMENT PLAN (DMMP) FINAL INTEGRATED FEASIBILITY REPORT AND ENVIRONMENTAL ASSESSMENT
 FINAL INTEGRATED FEASIBILITY REPORT AND ENVIRONMENTAL ASSESSMENT") APPENDIX M DREDGED MATERIAL MANAGEMENT PLAN (DMMP) Brazos Island Harbor, Texas Channel Improvement Study FINAL INTEGRATED FEASIBILITY REPORT AND ENVIRONMENTAL ASSESSMENT This page is intentionally left
APPENDIX M DREDGED MATERIAL MANAGEMENT PLAN (DMMP) Brazos Island Harbor, Texas Channel Improvement Study FINAL INTEGRATED FEASIBILITY REPORT AND ENVIRONMENTAL ASSESSMENT This page is intentionally left
: Hydrodynamic input for 2D Vessel Simulations (HY- 0027)
") Technical Note To : Christian Taylor (PoHDA) From : Rohan Hudson Cc : Ben Gray Date : 1/04/2015 (Final Draft) Subject : Hydrodynamic input for 2D Vessel Simulations (HY- 0027) Introduction This Technical
Technical Note To : Christian Taylor (PoHDA) From : Rohan Hudson Cc : Ben Gray Date : 1/04/2015 (Final Draft) Subject : Hydrodynamic input for 2D Vessel Simulations (HY- 0027) Introduction This Technical
Beach profile surveys and morphological change, Otago Harbour entrance to Karitane May 2014 to June 2015
 Beach profile surveys and morphological change, Otago Harbour entrance to Karitane May 2014 to June 2015 Prepared for Port Otago Ltd Martin Single September 2015 Shore Processes and Management Ltd Contact
DUXBURY WAVE MODELING STUDY
 DUXBURY WAVE MODELING STUDY 2008 Status Report Duncan M. FitzGerald Peter S. Rosen Boston University Northeaster University Boston, MA 02215 Boston, MA 02115 Submitted to: DUXBURY BEACH RESERVATION November
Grays Harbor O&M and Deepening Dredging
 Grays Harbor O&M and Deepening Dredging Elizabeth Chien Project Manager Seattle District 28 January 2016 US Army Corps of Engineers Grays Harbor Navigation Channel Inner Harbor O&M Dredging Summer 2015:
Lecture Outlines PowerPoint. Chapter 15 Earth Science, 12e Tarbuck/Lutgens
 Lecture Outlines PowerPoint Chapter 15 Earth Science, 12e Tarbuck/Lutgens 2009 Pearson Prentice Hall This work is protected by United States copyright laws and is provided solely for the use of instructors
SELECTION OF THE PREFERRED MANAGEMENT OPTION FOR STOCKTON BEACH APPLICATION OF 2D COASTAL PROCESSES MODELLING
 SELECTION OF THE PREFERRED MANAGEMENT OPTION FOR STOCKTON BEACH APPLICATION OF 2D COASTAL PROCESSES MODELLING C Allery 1 1 DHI Water and Environment, Sydney, NSW Abstract This paper presents an approach
Figure Eight Island Shoreline Management Project EIS. Chapter 3 PROJECT ALTERNATIVES. 1. What alternatives are evaluated in this EIS?
 Chapter 3 PROJECT ALTERNATIVES 1. What alternatives are evaluated in this EIS? This section describes in detail the various alternatives evaluated for responding to the erosion threat along the northern
Overview. Beach Features. Coastal Regions. Other Beach Profile Features. CHAPTER 10 The Coast: Beaches and Shoreline Processes.
 Overview CHAPTER 10 The Coast: Beaches and Shoreline Processes Coastal regions constantly change. The beach is a dominant coastal feature. Wave activity continually modifies the beach and coastal areas.
SHORE PROTECTION AND HABITAT CREATION AT SHAMROCK ISLAND, TEXAS ABSTRACT
 SHORE PROTECTION AND HABITAT CREATION AT SHAMROCK ISLAND, TEXAS M. Cameron Perry, P.E., and Daniel J. Heilman, P.E. Coastal Engineer Shiner Moseley & Associates., Inc. 555 N. Carancahua Corpus Christi,
Jimmy s beach preliminary results
 Jimmy s beach preliminary results LP 668979 Jimmy s Beach Restoration Society 1 Outline 1. Long term: GIS analyses. Aerial photos, charts Shoreline analyses Storm data from MHL/DECC 2. Medium term: morphologic
Figure 106. Locations of the 28 NJBPN profile stations in Ocean County, NJ.
 130 Figure 106. Locations of the 28 NJBPN profile stations in Ocean County, NJ. 131 2016-2017 Beach Fills in Ocean County: The federal/state/local storm damage reduction project (beachfill) between Manasquan
Sediment Management Plan Rehoboth Bay
 Sediment Management Plan Rehoboth Bay STAC Meeting November 16, 2007 Goals of the Study Improve planning for future dredging needs Reduce the dependency on dredging Study Tasks Environmental data Historical