REPORT. Skardon River Bauxite Project - Additional Coastal Assessment. Ports and Coastal Environmental Pty Ltd
|
|
|
- Rose Hensley
- 5 years ago
- Views:
Transcription

1
2


3 REPORT Skardon River Bauxite Project - Additional Coastal Assessment Client: Ports and Coastal Environmental Pty Ltd Reference: M&APA1066R001F01 Revision: 01/Final Date: 14 March 2016

4 HASKONING AUSTRALIA PTY LTD Unit Township Drive QLD 4220 Burleigh Heads Australia Maritime & Aviation Trade register number: Infosydney.mandw@rhdhv.com royalhaskoningdhv.com E W Document title: Skardon River Bauxite Project - Additional Coastal Assessment Document short title: Skardon River Bauxite Project Reference: M&APA1066R001F01 Revision: 01/Final Date: 14 March 2016 Project name: PA1066 Project number: PA1066 Author(s): Andy Symonds, Andrew Patterson, Ben Morgan, James Lewis Drafted by: Scot Cranfield Checked by: Dan Messiter Date / initials: 14/03/2016 DM Approved by: Dan Messiter Date / initials: 14/03/2016 DM Classification Open Disclaimer No part of these specifications/printed matter may be reproduced and/or published by print, photocopy, microfilm or by any other means, without the prior written permission of Haskoning Australia PTY Ltd.; nor may they be used, without such permission, for any purposes other than that for which they were produced. Haskoning Australia PTY Ltd. accepts no responsibility or liability for these specifications/printed matter to any party other than the persons by whom it was commissioned and as concluded under that Appointment. The quality management system of Haskoning Australia PTY Ltd. has been certified in accordance with ISO 9001, ISO and OHSAS March 2016 SKARDON RIVER BAUXITE PROJECT M&APA1066R001F01 i
5 Table of Contents 1 Introduction Background Scope Proposed Development Report Structure 3 2 Bed Levelling Assessment Introduction Navigation Channel Requirements Bed Levelling Equipment Environmental Impacts Recommendations 8 3 Numerical Modelling Introduction Description of Models Model Setup Bathymetry Hydrodynamic Model Wave Model Sediment Transport Model Scheme Representation Bathymetry Bed Levelling Rates Model Calibration Water Levels Tidal Currents Results Hydrodynamic Modelling Wave Modelling Sediment Transport Modelling Conceptual Model Longshore Transport Impacts Summary 46 4 Propeller Wash Introduction Natural Conditions March 2016 SKARDON RIVER BAUXITE PROJECT M&APA1066R001F01 ii
6 4.3 Approach Barge Vessel Cargo Vessel Results Barge Vessel Cargo Vessel 62 5 Vessel Wake Waves Background Primary Waves Secondary Waves Approach Results 67 6 Cyclone Mooring Concept Design Introduction Concept Design 70 7 Summary 73 8 References 75 Table of Tables Table 1 Model grid configuration Table 2 Water level calibration period statistics, May Table 3 Current speed and direction calibration period statistics, May Table 4 Existing conditions at the five propeller wash calculation sites Table 5 Assumed vessel specification for the proposed barges Table 6 Assumed vessel specification for the proposed cargo vessels Table 6 Predicted maximum bed current speed resulting from the propeller wash Table 7 Predicted erosion extent and rates resulting from the barge propeller wash Table 8 Predicted mass of sediment eroded and resultant SSC from the propeller jet Table of Figures Figure 1 Overview of the marine components of the Project Figure 2 Upstream Facilities relevant to this assessment Figure 3 Proposed footprint and quantities of material to be removed March 2016 SKARDON RIVER BAUXITE PROJECT M&APA1066R001F01 iii
7 Figure 4 Depth of bed above the -2.2m LAT proposed navigation depth Figure 5 Typical bed leveller assembly... 6 Figure 6 Depth available below the -2.2m LAT proposed navigation depth... 6 Figure 7 Conceptual volumetric assessment of bed levelling... 7 Figure 8 Model mesh and interpolated bathymetry Figure 9 Model mesh and bathymetry at the ebb bar Figure 10 Model mesh and extent of bathymetric data and offshore C-Map data Figure 11 MIKE21 SW boundary conditions for Tropical Cyclone Oswald (2013) Figure 12 (top) Baseline channel bathymetry (middle) levelled scheme bathymetry (bottom) Difference map of base-levelled bathymetry Figure 13 Model calibration sites Figure 14 Measured and modelled water levels at the mouth site Figure 15 Measured and modelled water levels at the upstream site Figure 16 Measured and modelled tidal current speed and direction at the Mouth site Figure 17 Measured and modelled tidal current speed and direction at the Mouth site Figure 18 Measured and modelled tidal current speed and direction at the Upstream site Figure 19 Measured and modelled tidal current speed and direction at the Upstream site Figure 20 2D plot of maximum ebb tidal currents within the entrance channel (top) as well as tidal phase and difference in current speeds between base and scheme bathymetric conditions at a point within the entrance channel (bottom) Figure 21 2D plot of the maximum difference in ebb tidal currents within the Skardon River entrance between base and scheme bathymetric conditions Figure 22 (top) 2D plot of maximum flood tidal currents within the Skardon River entrance channel. (bottom) tidal phase and difference in current speeds between base and scheme bathymetric conditions at a point within the entrance channel Figure 23 2D plot of the maximum difference in flood tidal currents within the Skardon River entrance between base and scheme bathymetric conditions Figure 24 Peak significant wave height condition during Topical Cyclone Oswald (2013) Figure 25 Change in peak significant wave height during Tropical Cyclone Oswald (2013) between the bed levelled scheme and base case Figure 26 Sediment source locations adopted to represent bed levelling Figure 27 Time series of modelled (top)sediment concentrations at Zone A for both sediment fractions; Sand and Silt (bottom) corresponding discharge and concentration of each fraction at Source location A Figure 28 Time series of modelled (top) sediment concentrations at Zone B1 for both sediment fractions; Sand and Silt (bottom) corresponding discharge and concentration of each fraction at Source location B Figure 29 Time series of modelled (top)sediment concentrations at Zone B2 for both sediment fractions; Sand and Silt (bottom) corresponding discharge and concentration of each fraction at Source location B March 2016 SKARDON RIVER BAUXITE PROJECT M&APA1066R001F01 iv
8 Figure 30 Time series of modelled (top)sediment concentrations at Zone C for both sediment fractions; Sand and Silt (bottom) corresponding discharge and concentration of each fraction at Source location C Figure th percentile plot of SSC during Period A Figure th percentile plot of SSC during Period A Figure th percentile plot of SSC during Periods B1 and B Figure th percentile plot of SSC during Periods B1 and B Figure th percentile plot of SSC during Periods C Figure th percentile plot of SSC during Periods C Figure 37 Time series of total SSC at Points 1 to Figure 38 Time series of total SSC at Points 5 to Figure 39 Map plot of the instantaneous SSC plume resulting from the bed levelling activity over a daily cycle in Zone A Figure 40 Map plot of the instantaneous SSC plume resulting from the bed levelling activity over a daily cycle in Zone B Figure 41 Map plot of the instantaneous SSC plume resulting from the bed levelling activity over a daily cycle in Zone B Figure 42 Map plot of the instantaneous SSC plume resulting from the bed levelling activity over a daily cycle in Zone C Figure 43 Conceptual Model of sediment transport at the ebb bar of the Skardon River Figure 44 Water depth and propeller wash calculation locations Figure 45 Peak flood tidal currents in Skardon River Figure 46 Peak flood tidal currents at the ebb bar offshore of Skardon River Figure 47 Peak ebb tidal currents in Skardon River Figure 48 Peak ebb tidal currents at the ebb bar offshore of Skardon River Figure 49 Calculated near bed current speeds, bed shear stresses and erosion rates from propeller wash at the Barge location Figure 50 Calculated near bed current speeds, bed shear stresses and erosion rates from propeller wash at the Mid river location Figure 51 Calculated near bed current speeds, bed shear stresses and erosion rates from propeller wash at the Mouth location Figure 52 Calculated near bed current speed, bed shear stress and erosion rate from propeller wash at the Ebb Bar location Figure 53 Predicted spatial pattern of near bed current speeds resulting from the proposed barges at the barge site Figure 54 Predicted area of bed erosion resulting from propeller wash at the wharf Figure 55 Calculated near bed current speed, bed shear stress and erosion rate from propeller wash at the Transhipment location for a laden and unladen Panamax class cargo vessel Figure 56 Primary wave components of ship induced water motions March 2016 SKARDON RIVER BAUXITE PROJECT M&APA1066R001F01 v
9 Figure 57 Secondary wave pattern Figure 58 Secondary wave heights with horizontal distance from the vessel Figure 59 Skardon River Cyclone Moorings Concept Design Figure 60 Possible locations for cyclone moorings March 2016 SKARDON RIVER BAUXITE PROJECT M&APA1066R001F01 vi
10 Executive Summary Ports And Coastal Environment (PACENV) commissioned Haskoning Australia Pty Ltd, a company of Royal HaskoningDHV (RHDHV), to undertake an additional coastal assessment for the Skardon River Bauxite Project (herein called the Project). This assessment is in addition to a previous Coastal Processes Assessment undertaken as part of the Environmental Impact Statement (EIS) detailed in RHDHV (2015). As such, this report does not replicate all of the information in the previous report, rather it provides detail of the additional studies undertaken. The scope of work undertaken as part of this additional assessment is as follows: assess the option of bed levelling, including updating volumes based on the 2015 survey data; hydrodynamic, wave and sediment plume modelling to assess the impact of bed levelling on hydrodynamics, water quality and coastal processes; determine the potential impacts of propeller wash and vessel wake; and develop concept design information for a cyclone mooring in the Skardon River. A summary of the main findings of this assessment are as follows: bed levelling was found to be a feasible option for achieving the required design depths, for a predicted duration of 120 days. Based on a high level assessment bed levelling is expected to result in similar, or lesser, environmental impacts than dredging. Accordingly, the potential impacts of bed levelling have been further assessed as part of this investigation; the change in bathymetry of the ebb bar is predicted to result in relatively small and localised changes to tidal currents and waves. The changes are restricted to the ebb bar and do not influence the Skardon River; the bed levelling activity is predicted to result in a relatively small, localised plume with peak SSCs of up to 40mg/l during the majority of the bed levelling activity (14 weeks); increased plume extents and SSCs are predicted during bed levelling of the area adjacent to the offshore edge of the ebb bar (furthest west) due to the increased amount of fine grained material (silt and clay) in the sediment in this area (6% compared to 1% at the other areas). Bed levelling of this area is expected to continue for approximately three weeks; the plume extent during bed levelling is limited to the area directly offshore of the ebb bar. The plume does not extend within the Skardon River or along the shoreline to the north or south of the ebb bar; peak SSC at the location of the bed levelling activity can reach up to 300mg/l, although the median SSC offshore of the ebb bar is less than 25mg/l over the duration of the bed levelling; the bed levelling activity is not expected to result in any impacts to the longshore sediment transport at the shoreline to the south or around the ebb bar adjacent to the Skardon River; based on the proposed maximum vessel speed within the Skardon River of 6 knots the wake waves predicted to be generated by vessels are small when they reach the shoreline. These waves are therefore predicted not to impact the banks of the Skardon River; propeller wash from the barges has been shown to have the potential to result in erosion of the bed in the proposed navigation channel in the mid, upstream and ebb bar areas of the Skardon River. The highest potential for erosion occurs over the ebb bar as this area is the shallowest and 14 March 2016 SKARDON RIVER BAUXITE PROJECT M&APA1066R001F01 vii
11 therefore experiences the highest bed velocities due to the propeller wash. The erosion is expected to be limited by the sediment properties; 2009 and 2015 bathymetric surveys indicate that the channel in the ebb bar has remained relatively stable with limited accretion occurring. Based on this and the predicted propeller wash resulting from the barges over the ebb bar, ongoing maintenance of the -2.2m LAT design depth over the ebb bar is expected to be low. When the barges are operating it is expected that no maintenance will be required. However, accretion could occur during the summer months when no operations are planned. Seasonal hydrographic survey will be required to inform the requirements for maintaining navigability of the bar; following the initial bed levelling campaign (assessed in this report) any subsequent bed levelling maintenance activity would be expected to have similar or lesser impacts to those reported herein. However, there is a risk that a large cyclonic event could result in changes to the ebb bar configuration which could require dredging to reopen the channel; and a concept design configuration for cyclone moorings has been developed to limit movement of the vessels and heavy ground chains. It is designed to minimise damage to the seabed and any benthic flora and fauna such that potential environmental impacts are not significant. Based on the findings of this assessment the following recommendations have been made: as proposed, the maximum vessel speed is limited to 6 knots within the Skardon River to ensure that vessel wake waves do not impact the shoreline; vessels should navigate along the centreline of the proposed navigation channel wherever possible to restrict any erosion of the bed due to propeller wash to this area; hydrographic surveys should be undertaken of the ebb bar channel after each summer to monitor the bed elevations in the channel and inform if additional maintenance bed levelling is required for navigational purposes; and additional site specific benthic and hydrographic surveys are required to optimise the location and design of the cyclone moorings. 14 March 2016 SKARDON RIVER BAUXITE PROJECT M&APA1066R001F01 viii
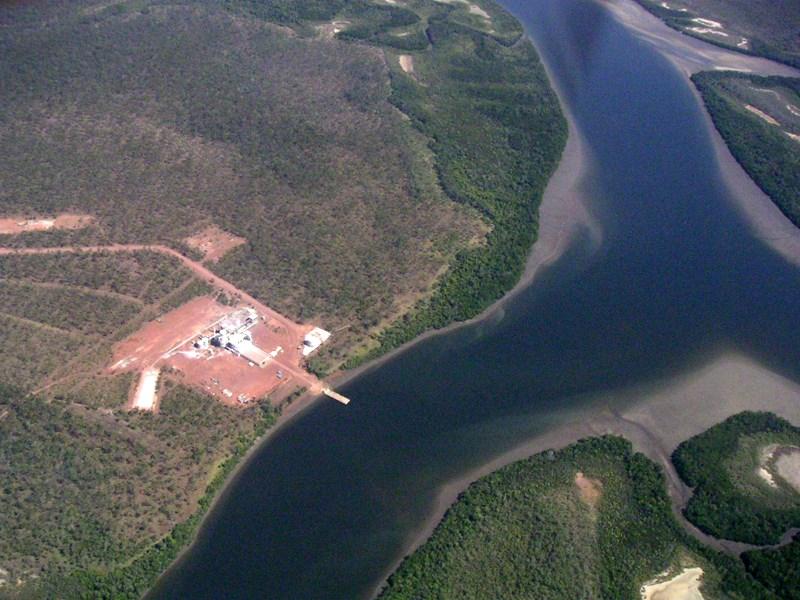
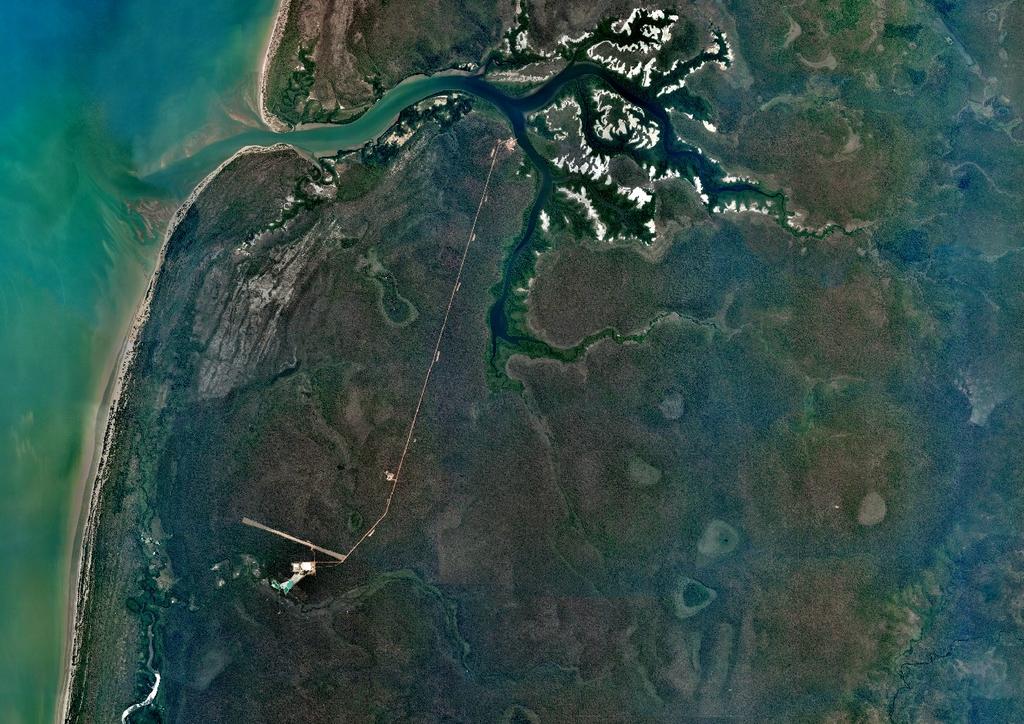
12 1 Introduction 1.1 Background Ports And Coastal Environment (PACENV) commissioned Haskoning Australia Pty Ltd, a company of Royal HaskoningDHV (RHDHV), to undertake an additional coastal assessment for the Skardon River Bauxite Project (herein called the Project). This assessment was requested following feedback from the Department of Environment and Heritage Protection (DEHP) on the initial Environmental Impact Statement (EIS). This work is in addition to the previous Coastal Processes Assessment undertaken to support the initial EIS, detailed in RHDHV (2015). As such, this report does not replicate all of the information in the previous report, rather it just provides detail of the additional studies undertaken. For further information on the existing metocean conditions at Skardon River please refer to RHDHV (2015). 1.2 Scope The scope of work for this additional assessment is as follows: undertake a bed levelling assessment, including defining updated volumes based on the 2015 survey data; undertake hydrodynamic, wave and sediment plume modelling to assess the impact of bed levelling on hydrodynamics, waves, coastal processes and water quality; assess the potential impacts of propeller wash and vessel wake through the proposed navigation channel; and develop concept design information for a cyclone mooring for the Skardon River. 1.3 Proposed Development The Project is anticipated to initially produce 3 million tons per annum (Mtpa) of bauxite suitable as direct shipping ore, which could rise to 5 Mtpa subject to market conditions. The total Project life is expected to be 10 years. The marine based components of the Project are shown in Figure 1 and incorporate the following: upstream facilities (see Figure 2): o new barge loading facility, in the same location as the existing dry plant for the previous kaolin facility, within the Project s existing mining leases and the Port of Skardon River; o new wharf on piles with mooring dolphins; o upgrade of the existing boat ramp at the Port to improve access for delivery of fuel, food, other materials and site equipment; bed-levelling at the mouth of the Skardon River down a depth of -2.2m LAT (see Figure 1); and barging of bauxite to the offshore transhipment location (see Figure 1) in deep water approximately 15 km offshore of the Skardon River mouth, and transfer from barges to bulk carriers. The proposed upstream facilities are to be located on relatively high elevation land (at least 4m AHD) which extends to the river channel at the Port of Skardon River. 14 March 2016 SKARDON RIVER BAUXITE PROJECT M&APA1066R001F01 1


13 Figure 1 Overview of the marine components of the Project. Figure 2 Upstream Facilities relevant to this assessment. 14 March 2016 SKARDON RIVER BAUXITE PROJECT M&APA1066R001F01 2
14 1.4 Report Structure The report herein is set out as follows: Section 2, the bed levelling assessment is provided; Section 3, the numerical modelling work is detailed; Section 4, the propeller wash calculations are presented; Section 5, the vessel wake impacts are detailed; Section 6, the cyclone mooring concept designs are provided; and Section 7, a summary of this additional assessment is provided along with details of recommendations based on the study findings. 14 March 2016 SKARDON RIVER BAUXITE PROJECT M&APA1066R001F01 3
15 2 Bed Levelling Assessment 2.1 Introduction The existing bed elevations at the ebb bar, offshore of the mouth of Skardon River, do not provide sufficient navigation depth for the barge movements proposed by Gulf Alumina. To allow sufficient navigation across this area, Gulf Alumina has proposed to lower the bed elevations to -2.2m LAT. Assuming a 70m wide navigation channel and the route provided by Gulf Alumina, the areas and associated volumes for bed levelling have been calculated, these are shown in Figure 3. The areas and volumes were calculated using the bathymetric data collected during the April 2015 survey. Zone C 8,400m 3 Zone B 32,300m 3 Zone A 5,750m 3 Figure 3 Proposed footprint and quantities of material to be removed (shown in red), over the 2015 bathymetry. Figure 4 shows the depth of material above the -2.2m LAT elevation. 14 March 2016 SKARDON RIVER BAUXITE PROJECT M&APA1066R001F01 4
16 Figure 4 Depth of bed above the -2.2m LAT proposed navigation depth. Note: the green/red lines mark channel alignment, and the black line is centre line of channel. 2.2 Navigation Channel Requirements The navigation depth required for the proposed transhipment barging operation is 2.2m below LAT. The shallowest bed level along the proposed navigation channel is 1.0 below LAT (maximum depth of material to be moved/dredged is therefore 1.2m). With respect to the April 2015 survey, and based on a 70m wide channel (excluding batter slopes or over-dredging), 46,450 m 3 of material is required to be removed to achieve the design depth. Analysis of the preceding survey from September 2009 shows a similar volume of material, indicating that limited sediment accretion has occurred in the channel over this period. The main change in the seabed between the surveys was an offshore migration of the existing bedforms. 2.3 Bed Levelling Equipment Bed levelling (see Figure 5) as described in the BS Maritime Structures- Part 5: Code of practice for dredging and land reclamation is a means of moving material over the sea bed, or causing it to rise into suspension to be transported away by natural water flow. The function of the bed-leveller can be best compared with that of the bulldozer or grader on land. In order for bed levelling of the Skardon River ebb bar to be feasible there must be sufficient capacity below -2.2m LAT in the area for the required volume of moved sediment to be transported into. The bed features in this area have historically been moving in an offshore direction and so it would be preferred to move material in this direction to prevent movement of the same material in subsequent bed levelling campaigns. Figure 6 shows the depths and volumes of the areas below -2.2m LAT adjacent to the bed levelling zones. The total volume of the two areas adjacent to the bed levelling zones available for material to be moved into is 28,400m 3. This leaves just over 18,000m 3 of material which will have to be moved west to the edge of the ebb bar, as shown in Figure March 2016 SKARDON RIVER BAUXITE PROJECT M&APA1066R001F01 5
 direction and so it would not be beneficial to push sediment to the east.")
17 Figure 5 Typical bed leveller assembly Located to east so will just be transported west again 8,500m 3 19,900m 3 Figure 6 Depth available below the -2.2m LAT proposed navigation depth (i.e. holes for bed levelling). Note: the bed features in this area are moving in an offshore (westerly) direction and so it would not be beneficial to push sediment to the east. 14 March 2016 SKARDON RIVER BAUXITE PROJECT M&APA1066R001F01 6

18 Figure 7 Conceptual volumetric assessment of bed levelling. As such, bed levelling of the Skardon River ebb bar would be feasible if: sufficient water depth is available for long enough periods to operate; material can be moved to areas that limit risk of refilling the channel; and suitable production rates can be achieved. Based on the typical drafts of bed levelling vessels (2-2.5m) they are expected to be able to operate throughout the tide except for at low water during spring tides. Based on the measured water level data at the river mouth the duration when no bed levelling could occur is likely to be between three and four hours per day during spring tides. This would equate to approximately 140 hours over the120 day duration of the works based on the vessel working for 12 hours per day. Typical bed levelling rates can range between 2,000 and 5,000m 3 /week depending on the site conditions and the vessel. An average rate of 2,750m 3 has been estimated based on information provided by a bed levelling contractor. This rate assumes the vessel would be working for 12 hours per day, 7 days a week and would mean that the total activity would take approximately 120 days to complete. Based on this assessment bed levelling is thought to be a feasible approach to achieve the required design depths on the ebb bar of the Skardon River. However, it is important to note that as no previous bed levelling activities have been undertaken at Skardon River it is not possible to verify the estimated production rates could be achieved. 14 March 2016 SKARDON RIVER BAUXITE PROJECT M&APA1066R001F01 7
19 2.4 Environmental Impacts The relative potential environmental impacts of bed levelling and dredging are considered below: potential impacts of the change in bathymetry will be similar regardless of whether bed levelling or dredging has been adopted. This is quantified through numerical modelling in Sections and 3.6.2; some variability between the bed levelling and dredging in terms of potential impacts to water quality. Dredging will have a higher production rate, higher suspended sediment concentrations (SSC) and larger plume extents during operation than bed levelling. However, the bed levelling will take longer to complete the work causing an impact of longer duration to water quality; despite the longer duration bed levelling will likely result in less impact to any marine flora or fauna as the resultant plume would be; of lower concentration, and less likely to extend within the Skardon River or to sensitive receptors; and neither bed levelling or dredging are expected to significantly impact the longshore drift due to the relocation of sediment from the ebb bar. The bed levelling could replicate the natural process whereby sediment is moved to the offshore edge of the ebb bar by tidal currents (further details provided in Section 3.8), while dredgers could relocate material to the south, thereby replicating the natural longshore drift. Bed levelling or dredging are expected to not have significant impact on the environment. Of the two options, bed levelling potentially has the lesser impact due to lower SSC and smaller plume extent during the activity. 2.5 Recommendations Based on the results of analysis presented in Section 2, bed levelling of the Skardon River ebb bar is thought to be a feasible approach to achieve the required design depths, with a predicted work activity duration of 120 days. This approach is expected to result in similar or lesser environmental impacts than dredging and as such has considered as the preferred approach in further assessments. Accordingly, the following numerical modelling investigation in Section 3 considers the potential impacts of the bed levelling activity on coastal processes and water quality. 14 March 2016 SKARDON RIVER BAUXITE PROJECT M&APA1066R001F01 8
20 3 Numerical Modelling 3.1 Introduction This investigation is focused on representing: potential impacts of bed levelling on hydrodynamics and waves; and dispersion of sediment plumes resulting from the bed levelling activities. A range of numerical modelling tasks have been undertaken. Details of these along with the methodology applied to determine the source rates for the bed levelling activity are provided in this Section. 3.2 Description of Models The numerical modelling undertaken has utilised a professional engineering software package MIKE21 released by the Danish Hydraulic Institute (2016 release). The software is designed to simulate flows, waves, sediments and ecology in rivers, lakes, estuaries, bays, coastal areas and seas. The modelling system is designed in an integrated modular framework with a variety of add-on modules, which allows the user to customise the software package to suit project requirements. The Hydrodynamic (HD) and Spectral Wave (SW) modules within the MIKE21 system provide the hydrodynamic and wave basis for other modules such as Sand and Mud Transport. The HD module simulates the water level variations and flows in response to a variety of forcing functions on flood plains, in lakes, estuaries and coastal environments. The SW module simulates the growth, decay and transformation of wind-generated waves and swell in offshore and coastal areas. 3.3 Model Setup The extent of the model grid along with the interpolated model bathymetry developed for this assessment is shown in Figure 8 and Figure 9. Details of the variable model resolution throughout the domain are provided in Table 1. The numerical modelling domain consists of over 8600 mesh nodes. This model domain has been used as the basis for all of the numerical modelling components of the study. Table 1 Model grid configuration. Description Cell arc length range (m) Offshore 600 Ebb Bar 150 Bed Levelling Areas 60 x 20 Skardon River March 2016 SKARDON RIVER BAUXITE PROJECT M&APA1066R001F01 9

21 Figure 8 Model mesh and interpolated bathymetry. Figure 9 Model mesh and bathymetry at the ebb bar. Note: red polygons show proposed bed levelling zones. 14 March 2016 SKARDON RIVER BAUXITE PROJECT M&APA1066R001F01 10

 and was the primary dataset when interpolating onto the numerical model grid (i.e. the lower resolution bathymetric data was only used where there was no higher resolution data available).")
22 3.3.1 Bathymetry High resolution hydrographic survey data from April 2015 and September 2009 has been provided by Gulf Alumina, these surveys have been combined (with priority given to the 2015 data) to maximise coverage of the areas of the main channel of the Skardon River and ebb bar. Lower resolution bathymetric data of the remaining offshore area was obtained from digitised navigation charts provided through MIKE C-MAP. The hydrographic survey data covered the main areas of interest (Figure 10) and was the primary dataset when interpolating onto the numerical model grid (i.e. the lower resolution bathymetric data was only used where there was no higher resolution data available). Figure 10 Model mesh and extent of bathymetric data (2015 and 2009 hydrographic survey) and offshore C-Map data. The bathymetry in the areas of the Skardon River where no bathymetric data was available was inferred based on any adjacent known bathymetry, aerial photography and LiDAR data. Areas of mangroves were assessed based on aerial photography and LiDAR data and included in the model domain with inferred bathymetry. The different bathymetric data utilised were corrected to Australian Height Datum (AHD), assuming the correction of -2.52m relative to LAT at the Skardon River Barge Ramp, and then interpolated onto the model grid. The final model bathymetry is shown in Figure 8 on the previous page Hydrodynamic Model The model boundaries were setup using predicted water levels derived for the Skardon River mouth based on measured data. The boundaries were driven by water levels along the west, north and south boundaries. A spatially uniform bed roughness with a Manning s M roughness coefficient of 35 was applied. This value represents a medium bed roughness and was found to result in the best model calibration (see Section 3.5). 14 March 2016 SKARDON RIVER BAUXITE PROJECT M&APA1066R001F01 11
23 As the Skardon River and ebb bar are tidally dominant environments the model was run with just hydrodynamics for the baseline and scheme scenarios. The hydrodynamic model was calibrated using water level and tidal current data collected at two locations within the Skardon River, at the mouth and upstream of the proposed wharf facility. The calibration process demonstrated that the hydrodynamic model provides a good representation (within the bounds of the desired accuracy) of the tidal currents in the Skardon River. Further details of the calibration are provided in Section Wave Model A two-dimensional MIKE21 Spectral Wave (SW) model was utilised to assess the impacts of the proposed bed levelling works on the nearshore wave heights within and adjacent to the Skardon River entrance channel as well as the neighbouring shoreline. The MIKE21 SW model was used to transform waves from an offshore boundary (located at approximately -20m AHD contour) to the shoreline using the base case (existing) and the bed levelled (scheme) bathymetries (further detailed in Section 3.4.1). The wave model was run using the same mesh as the hydrodynamic model. The model was setup to run a large swell wave event to determine the potential impacts of the proposed changes to the bathymetry during a large wave event. The offshore wave boundary conditions were output from the global wave model WaveWatch III. The wave conditions over the last 15 years were analysed and the largest wave event over this period was due to TC Oswald in January Wave heights, periods and directions were specified at the offshore boundary to represent the Cyclone Oswald event of 2013 which passed in close proximity to the study site. The simulated waves may be considered as an extreme event for this location and this event has been used to assess a worst-case scenario. The Significant Wave Height, H s (m), Peak Wave Period, T p (sec) and Mean Wave Direction, MWD (degn) applied to the offshore boundary of the SW model to represent Tropical Cyclone Oswald are shown in Figure 11. There was no measured wave data available to validate the nearshore wave conditions, but the WaveWatch III model has been validated using global merged altimetry data and is accepted as providing a good representation of offshore wave conditions globally. 14 March 2016 SKARDON RIVER BAUXITE PROJECT M&APA1066R001F01 12
24 . Figure 11 MIKE21 SW boundary conditions for Tropical Cyclone Oswald (2013) Sediment Transport Model Due to the lack of previous bed levelling or dredging at Skardon River it has not been possible to calibrate or validate the sediment transport model. A number of assumptions were made to ensure representative values (with conservative assumptions also adopted to ensure impacts are not underestimated) were applied in the sediment transport model. The following values were adopted for the bed levelling modelling: based on the PSD data collected in the area two sediment fractions were included in the model, fine sand and medium silt; settling velocities for each sediment fraction were calculated based on Stokes Law. The model was setup to allow flocculation of silts to occur; a critical shear stress for erosion of 0.1N/m 2 was applied for the resuspension of sediment suspended by the bed levelling activity; and a critical shear stress for deposition of 0.07N/m 2 was applied. No natural background suspended sediment was included in the model, with all the sediment included being released as part of the bed levelling activity. This is a standard approach for modelling dredging and bed levelling impacts as it ensures that all of the impacts on water quality can be identified and then considered relative to natural background total suspended sediment (TSS) concentrations (inferred based on measured data). 14 March 2016 SKARDON RIVER BAUXITE PROJECT M&APA1066R001F01 13
25 3.4 Scheme Representation Details of how the change in bathymetry resulting from the proposed bed levelling activity and the sediment suspended by this activity have been represented in the numerical modelling are provided in the following sections Bathymetry The model mesh was designed with rectilinear elements to follow the navigation channel in the areas where bed levelling has been proposed (Figure 9). This mesh design allows the bathymetry in this area to be changed to provide an accurate representation of the proposed bed levelling, ensuring the bathymetry can be lowered in just the designated channel. To represent the scheme the bathymetry in the proposed bed levelling areas was lowered to -2.2m LAT, the baseline and scheme bathymetries are shown in Figure Bed Levelling Rates For the numerical modelling it has been assumed that a specialist bed levelling vessel (as discussed in Section 2.3) will undertake the bed levelling. Based on this, the following assumptions have been made: a bed levelling rate of 2,750 m 3 /week has been assumed. This rate assumes that the activity will be undertaken for 7 days a week and 12 hours a day; the bed levelling will take 118 days of continuous bed levelling to complete; that all of the fine grained sediment (D 50 < 63µm) in the material being moved by the bed levelling is resuspended during the activity. This results in a rate of 0.3 kg/s at bed levelling Zones A and B to the east (with an average composition of 1% silt) and 1.6 kg/s at Zone C (with an average composition of 6% silt) (see Figure 3, page 4 for the zone locations); and that 20% of the sand sized sediment in the material being moved by the bed levelling is resuspended during the activity. This results in a rate of 4.2kg/s at all the sites (with an average composition of 80% sand). The model has been run to represent the bed levelling activity for a one week period at each of the three bed levelling areas. A single source point for the sediment discharge has been included for each area. This is considered to represent a worst case scenario (highest possible SSC). The results from the discrete week long simulations have been used to produce a representation of how the plume will behave throughout the entire bed levelling activity. 14 March 2016 SKARDON RIVER BAUXITE PROJECT M&APA1066R001F01 14
 levelled")


26 Figure 12 (top) Baseline channel bathymetry (middle) levelled scheme bathymetry (bottom) Difference map of base-levelled bathymetry. 14 March 2016 SKARDON RIVER BAUXITE PROJECT M&APA1066R001F01 15

27 3.5 Model Calibration Model calibration is the process of setting physically realistic values for model parameters so that the model reproduces observed values to the desired level of accuracy. A calibration exercise is required to demonstrate that the performance of the hydrodynamic model is considered to be of an appropriate accuracy to satisfy the objectives of the investigation. Hydrodynamic models are typically calibrated against measured water level and current data at a number of locations throughout the model domain. An assessment of the differences between the measured and modelled values is undertaken to enable the level of calibration achieved to be quantified. The calibration of a hydrodynamic model in which tidal forcing dominates requires a minimum of one spring neap tidal cycle (approximately 14 days) or preferably a full lunar cycle (approximately 29 days). Locations of the calibration sites for this investigation along with the extent of the model grid and the interpolated bathymetry are shown in Figure 13. The hydrodynamic model was calibrated against measured water level and current data. The model calibration has been undertaken at sites at the mouth and upstream of the proposed wharf for the period 01/05/15 to 30/05/15. Figure 13 Model calibration sites Water Levels Time series plots of the modelled and measured water levels at the mouth and upstream sites are shown in Figure 14 and Figure 15, respectively. The measured water levels have been processed to remove any residual water levels to make the comparison with the output water levels from the model which is forced by predicted tidal levels (i.e. no residual water level influences). The modelled and measured water levels agree very well at the mouth site and well at the upstream site. It order to further assess the level of calibration achieved, statistical analysis was undertaken to quantify the difference in elevation and timing between the modelled and measured high and low 14 March 2016 SKARDON RIVER BAUXITE PROJECT M&APA1066R001F01 16
28 water values. The results of the analysis for the difference in water level at high and low water are presented as absolute values in Table 2. Table 2 Water level calibration period statistics, May Statistical Description Mouth Upstream Mean HW Difference (m) Mean HW Difference relative to Tidal Range (%) Mean LW Difference (m) Mean LW Difference relative to Tidal Range (%) RMSD for HW (m) RMSD for LW (m) Mean HW Phase Lag (mins) Mean LW Phase Lag (mins) Note: The differences in phase of the high and low waters were derived by subtracting the time of the measured value from the time of the model value. A negative value therefore indicates that the model is early compared to the measured data. Mean water level differences were less than 0.05m for both sites over the calibration period, indicating only very small differences (<2%) relative to the tidal range. The difference in phasing was less than 15 minutes at both sites at high and low waters. The Root Mean Square Deviation (RMSD) values show that there is some variation between the modelled and measured water levels at the upstream site and very little variation at the mouth site. The differences are comparable for high and low water. 14 March 2016 SKARDON RIVER BAUXITE PROJECT M&APA1066R001F01 17
 and modelled water levels at the upstream site. 3.5.")
29 Figure 14 Measured (residual component removed) and modelled water levels at the mouth site. Figure 15 Measured (residual component removed) and modelled water levels at the upstream site Tidal Currents The measured tidal currents were analysed as part of a harmonic analysis to remove the influence of any residual events and ensure the currents used for the calibration were due to solely astronomical forcing (the tide). Time series plots for the calibration of current speed and direction are shown in Figure 16 to Figure 19 on the following pages. The plots show that the model is capable of 14 March 2016 SKARDON RIVER BAUXITE PROJECT M&APA1066R001F01 18
30 consistently predicting current speed at the two sites. The model consistently replicates the direction of the peak flood and ebb tidal currents at the upstream site. The differences in current direction shown in Figure 18 and Figure 19, when the measured directions are between 200 and 360, occur around slack water when the current speed is low and so the differences do not influence the models capability of accurately representing the flood and ebb tidal currents at the upstream site. There are some differences between the modelled and measured current directions at the mouth site; this is discussed in more detail below. A statistical summary of the calibration is provided in Table 3. The mean differences between the modelled and measured peak current speeds and directions, shown for the Mouth and Upstream sites, are less than 6% of the measured peak speeds over a lunar cycle. This percentage difference shows that the model is well calibrated based on typical guideline ranges for estuaries and coastal areas (e.g. speeds to within 10-20% of measured speeds). The RMSD values are relatively low showing that there is some variability in the model performance but that the modelled currents reasonably consistently replicate the measured currents. The average difference of 22 between the modelled and measured tidal current direction at the mouth site during the flood tide is related to the complex local bathymetry in this area. Figure 13 (Page 16) shows that the measurement location is to the south-east of a deep channel through the mouth of the river and to the north of a shallow intertidal area. The current directions will be controlled by both of these features and, as the bathymetry in the model for the intertidal area was inferred (Section 3.3.1), it is expected that this resulted in the directional difference between the model predictions and the measurements. Given the uncertainty associated with the bathymetry in the upstream, intertidal and mangrove areas, and the resultant uncertainty in the tidal prism of the Skardon River, the overall model calibration achieved for current speed and direction is considered to be good. Table 3 Current speed and direction calibration period statistics, May Statistical Description Mouth Upstream Mean Difference in Speed of Flood (m/s) Mean Difference in Flood Speed Relative to Maximum Observed Speed (%) Mean Difference in Speed of Ebb (m/s) Mean Difference in Ebb Speed Relative to Maximum Observed Speed (%) RMSD for Flood Speed (m/s) RMSD for Ebb Speed (m/s) Mean Difference in Direction of Flood (º) 22-6 Mean Difference in Direction of Ebb (º) 12 2 Note: The differences were derived by subtracting measured values from model values. A negative value therefore indicates that the model is underpredicting measured values. 14 March 2016 SKARDON RIVER BAUXITE PROJECT M&APA1066R001F01 19


31 Figure 16 Measured (residual component removed) and modelled tidal current speed and direction at the Mouth site over a lunar cycle. 14 March 2016 SKARDON RIVER BAUXITE PROJECT M&APA1066R001F01 20

32 Figure 17 Measured (residual component removed) and modelled tidal current speed and direction at the Mouth site over a 10 day period. 14 March 2016 SKARDON RIVER BAUXITE PROJECT M&APA1066R001F01 21


33 Figure 18 Measured (residual component removed) and modelled tidal current speed and direction at the Upstream site over a lunar cycle. 14 March 2016 SKARDON RIVER BAUXITE PROJECT M&APA1066R001F01 22

34 Figure 19 Measured (residual component removed) and modelled tidal current speed and direction at the Upstream site over a 10 day period. 14 March 2016 SKARDON RIVER BAUXITE PROJECT M&APA1066R001F01 23
35 3.6 Results Hydrodynamic Modelling As detailed by Van Rijn (2005), the parameters that will directly alter the strength and flow pattern of tidal currents are: channel dimensions (length, width and side wall slope); angle between the main channel axis and direction of approaching current; strength of local current; and local bathymetry. Due to the relatively small change in the bathymetry from the proposed levelling exercise as seen in Figure 12, it is expected that the impacts to the tidal currents will be relatively small and localised. The MIKE21 Hydrodynamic (HD) model was run for a lunar cycle (29 days) to investigate potential impacts of the bed levelling on the tidal currents. Figure 20 presents a map plot of peak ebb tidal currents and a time series of the peak ebb current speed at the ebb bar for the base and scheme cases during the largest spring tide over the simulation period (i.e. the period when any potential impacts will be largest). The extraction location for the time series point is shown in Figure 21. Due to the proposed bed levelling, modelled peak ebb currents at the time series point increase from 0.34 to 0.38m/s on the spring tide (a 12% increase in tidal current speed). Figure 21 shows the spatial pattern of changes in tidal current speed at peak ebb indicating that: the change in bathymetry from the bed levelling results in localised increases and decreases in current speed in the order of 0.05m/s (10 15% change in speed); increases in current speed occur to the west and east of the bed levelling zones, while the decreases in current speed occur to the north and south of the zones and within the eastern zone (Zone A); and changes are very localised to the area with a change in bathymetry and do not result in any changes outside of the ebb bar. Figure 22 presents a map plot of peak flood currents and a time series of the peak flood current speed at the ebb bar for the existing and scheme cases during the largest spring tide over the simulation period (i.e. the period when any potential impacts will be largest), the extraction location for the point in shown in Figure 23. Due to the proposed levelling scheme, maximum ebb currents can be seen to increase from 0.19 to 0.20m/s for the spring tide modelled. The spatial pattern of changes in tidal current speed shows that very little change to the flood currents occur due to the change in bathymetry from the bed levelling exercise. 14 March 2016 SKARDON RIVER BAUXITE PROJECT M&APA1066R001F01 24
36 Figure 20 2D plot of maximum ebb tidal currents within the entrance channel (top) as well as tidal phase and difference in current speeds between base and scheme bathymetric conditions at a point within the entrance channel. (bottom) 14 March 2016 SKARDON RIVER BAUXITE PROJECT M&APA1066R001F01 25

37 Time Series Location Figure 21 2D plot of the maximum difference in ebb tidal currents within the Skardon River entrance between base and scheme bathymetric conditions. Note: the pink areas show the proposed bed levelling zones. 14 March 2016 SKARDON RIVER BAUXITE PROJECT M&APA1066R001F01 26
 tidal phase and difference in current speeds between base and scheme bathymetric conditions at a point within the entrance channel.")
38 Figure 22 (top) 2D plot of maximum flood tidal currents within the Skardon River entrance channel. (bottom) tidal phase and difference in current speeds between base and scheme bathymetric conditions at a point within the entrance channel. 14 March 2016 SKARDON RIVER BAUXITE PROJECT M&APA1066R001F01 27

 the H s was approximately 1.")
39 Time Series Location Figure 23 2D plot of the maximum difference in flood tidal currents within the Skardon River entrance between base and scheme bathymetric conditions. Note: the pink areas show the proposed bed levelling zones Wave Modelling The peak significant wave height (H s ) condition in the vicinity of the Skardon River ebb bar during Tropical Cyclone Oswald (2013) is shown in Figure 24. The plot shows that at the offshore edge of the ebb bar (approximately the western edge of bed levelling Zone C) the H s was approximately 1.7m, while at the eastern bed levelling Zone A the H s had reduced to 0.65m. The nearshore wave heights along the shoreline fronted by the ebb bar were typically less than 0.5m, while the shoreline to the north and south of the bar had nearshore wave heights of approximately 1m. This shows how the shallow ebb bar reduces wave heights due to wave breaking and friction and protects the shoreline behind from large waves. Figure 25 shows the impact that the change in bathymetry due to the bed levelling has on wave heights. The results show an increase in wave height to the north of the bed levelling area of up to 0.12m and a reduction in wave height to the south of the bed levelling area of up to 0.2m. The area to the north has an increase in wave height as a direct result of refraction away from the deeper sections of the channel causing increased wave focussing. Similarly, the decrease in wave heights to the south is due to more wave energy being focussed towards the shallower banks to the north due to the greater gradient in bathymetry caused by the bed levelling. A predicted small reduction (0.02m) in wave height along the shoreline in the lee of the bed levelling areas is shown. The wave conditions modelled should be considered as representative of a worst-case scenario for this location and as the predicted impacts of the proposed scheme are small and localised for these conditions, any impacts for smaller wave events (i.e. typical conditions) are expected to be negligible. 14 March 2016 SKARDON RIVER BAUXITE PROJECT M&APA1066R001F01 28
.")


40 Figure 24 Peak significant wave height condition during Topical Cyclone Oswald (2013). Note: the pink areas show the proposed bed levelling zones. Figure 25 Change in peak significant wave height during Tropical Cyclone Oswald (2013) between the bed levelled scheme and base case. Note: the pink areas show the proposed bed levelling zones. 14 March 2016 SKARDON RIVER BAUXITE PROJECT M&APA1066R001F01 29
41 3.6.3 Sediment Transport Modelling A MIKE21 Mud Transport (MT) model was used to investigate potential impacts of the bed levelling activity to water quality. To represent the release of sediment from the seabed due to the bed levelling activity, sediment sources were included in the model at varying temporal and spatial frequencies. The locations of the sediment sources adopted in the model are shown in Figure 26. Sand and silt fractions were included in the model with varying release rates for each source location based on the variable sediment composition as discussed in Section Sediment was released in the model at each zone for a 1 week period (except Zone B2 where the release continued for 10 days). The timing, discharge and resultant SSC for each fraction can be seen in the lower plots in Figure 27 to Figure 30. The plots show that the SSC at the sediment release location of the model (i.e. the area with the highest concentration) was typically less than 20mg/l at Zones A and B1, up to 40mg/l at Zone B2 and up to 300mg/l at Zone C. Zone C has a significantly higher SSC as the sediment sampling showed that this area has a higher percentage of silt in the sediment and it is the silt which results in the highest SSC (see Section for further details). The peaks in SSC closely follow the 12 hour period when bed levelling was assumed to occur, with concentrations returning to zero in the 12 hours between bed levelling periods. Zone A Zone C Zone B2 Zone B1 Figure 26 Sediment source locations adopted to represent bed levelling in the different zones. 14 March 2016 SKARDON RIVER BAUXITE PROJECT M&APA1066R001F01 30
42 Figure 27 Time series of modelled (top)sediment concentrations at Zone A for both sediment fractions; Sand and Silt (bottom) corresponding discharge and concentration of each fraction at Source location A. Note: 1kg/m 3 = 1000mg/l. Figure 28 Time series of modelled (top) sediment concentrations at Zone B1 for both sediment fractions; Sand and Silt (bottom) corresponding discharge and concentration of each fraction at Source location B1. Note: 1kg/m 3 = 1000mg/l. 14 March 2016 SKARDON RIVER BAUXITE PROJECT M&APA1066R001F01 31
43 Figure 29 Time series of modelled (top)sediment concentrations at Zone B2 for both sediment fractions; Sand and Silt (bottom) corresponding discharge and concentration of each fraction at Source location B2. Note: 1kg/m 3 = 1000mg/l. Figure 30 Time series of modelled (top)sediment concentrations at Zone C for both sediment fractions; Sand and Silt (bottom) corresponding discharge and concentration of each fraction at Source location C. Note: 1kg/m 3 = 1000mg/l. 14 March 2016 SKARDON RIVER BAUXITE PROJECT M&APA1066R001F01 32
44 Figure 31 to Figure 36 show the 50 th and 95 th percentile plots for SSC (combined sand and silt concentrations) for each of the source release periods. The plots do not show an actual plume at any point in time but are duration-based plots which show statistical summaries of the plume dispersion over the calculation period. The percentile plots represent the concentration in each model grid cell for which SSC were below for either 50 or 95 percent of the simulation period. The plots show that although local advection and diffusion of the fine grained sediment occurs at the ebb bar and in the area directly offshore a plume is not transported into the entrance of the Skardon River, or along the coastline to the north or south. The concentrations resulting from bed levelling in Zones A and B are low (less than 4mg/l) away from the source location. Higher concentrations and larger percentile extents occur due to the bed levelling at Zone C; this is due to the higher composition of fine grained material in the bed sediment in this area. The 50 th percentile plume for Zone C does show that SSC was more than 10mg/l for 50% of the time for a 1km diameter zone directly offshore of the source location. It is important to note that the increased composition of silt sized sediment at Zone C (from 1% at Zones A and B to 6% at Zone C) is based on four sediment samples, with fine grained sediment percentages ranging from 0% to 21%. Due to the significant range of values in the limited sample set, it is possible that an erroneous sample has biased the estimated percentage of silt in this area. Accordingly, the plume modelling may be overestimating the amount of fine grained material which will be resuspended by the bed levelling activity. The tendency for the plumes resulting from the bed levelling activity to remain outside the entrance of the Skardon River can be attributed to the dominance of the ebb flow of the river; meaning any plume that is generated through the bed levelling activity will have a tendency to move offshore with the residual flow. 14 March 2016 SKARDON RIVER BAUXITE PROJECT M&APA1066R001F01 33
.")
45 Figure th percentile plot of SSC during Period A (for both Sand and Silt). Figure th percentile plot of SSC during Period A (for both Sand and Silt). 14 March 2016 SKARDON RIVER BAUXITE PROJECT M&APA1066R001F01 34
46 Figure th percentile plot of SSC during Periods B1 and B2 (for both Sand and Silt). Figure th percentile plot of SSC during Periods B1 and B2 (for both Sand and Silt). 14 March 2016 SKARDON RIVER BAUXITE PROJECT M&APA1066R001F01 35
.")
47 Figure th percentile plot of SSC during Periods C (for both Sand and Silt). Figure th percentile plot of SSC during Periods C (for both Sand and Silt). 14 March 2016 SKARDON RIVER BAUXITE PROJECT M&APA1066R001F01 36
48 Time series of total instantaneous SSC (both sand and silt fractions) throughout the modelled bed levelling activity are presented in Figure 37 and Figure 38 for eight locations (see Figure 36) Figure 37 and Figure 38 show: SSC was less than 5mg/l at all locations when bed levelling of Zones A, B1 and B2 occurred (from 28/04/2015 to 21/05/2015); during the bed levelling of Zone C (from 21/05/2015 to 28/05/2015), increased SSC at the sites offshore of the ebb bar occurred (points 1 to 6), while decreased SSC occurred at those inshore of the ebb bar (points 7 and 8); the highest concentrations were predicted at location P1, where SSC was typically less than 50mg/l except for during short duration peaks which exceeded 100mg/l; and for locations further away from the bed levelling area (points 2 to 8) the peak SSC remained less than 50mg/l. The increased SSC from the bed levelling of Zone C is a result of the increased amount of fine grained sediment in the bed material compared to the other bed levelling zones. Map plots showing the spatial extent of the instantaneous SSC plume during a single daily bed levelling cycle at Zones A, B1, B2 and C are shown in Figure 39 to Figure 42. The figures show: plume extent was limited to the area of the bed levelling activity and adjacent areas directly offshore and inshore; for Zones A, B1 and B2 the SSC was less than 10mg/l except for the immediate area where the bed levelling activity was being undertaken; for Zone C, a plume with SSC of up to 50mg/l occurred directly offshore of the bed levelling area. However, the extent of the plume where concentrations reached 50mg/l was relatively small; and the plume where SSC was in excess of 10mg/l extended approximately 1250m by 1250m. 14 March 2016 SKARDON RIVER BAUXITE PROJECT M&APA1066R001F01 37
49 Figure 37 Time series of total SSC (sand and silt) at Points 1 to 4 (see Figure 36 for locations). Note: SSC axis at Points 1 and 2 differ from Points 3 and March 2016 SKARDON RIVER BAUXITE PROJECT M&APA1066R001F01 38
50 Figure 38 Time series of total SSC (sand and silt) at Points 5 to 8 (see Figure 36 for locations). 14 March 2016 SKARDON RIVER BAUXITE PROJECT M&APA1066R001F01 39
51 a) Start of bed levelling daily cycle b) 3 hours after start c) 6 hours after start d) 9 hours after start e) 3 hours after end of daily bed levelling f) 9 hours after end of daily bed levelling Figure 39 Map plot of the instantaneous SSC plume resulting from the bed levelling activity over a daily cycle in Zone A. 14 March 2016 SKARDON RIVER BAUXITE PROJECT M&APA1066R001F01 40
52 a) Start of bed levelling daily cycle b) 3 hours after start c) 6 hours after start d) 9 hours after start e) 3 hours after end of daily bed levelling f) 9 hours after end of daily bed levelling Figure 40 Map plot of the instantaneous SSC plume resulting from the bed levelling activity over a daily cycle in Zone B1. 14 March 2016 SKARDON RIVER BAUXITE PROJECT M&APA1066R001F01 41

53 a) Start of bed levelling daily cycle b) 3 hours after start c) 6 hours after start d) 9 hours after start e) 3 hours after end of daily bed levelling f) 9 hours after end of daily bed levelling Figure 41 Map plot of the instantaneous SSC plume resulting from the bed levelling activity over a daily cycle in Zone B2. 14 March 2016 SKARDON RIVER BAUXITE PROJECT M&APA1066R001F01 42
54 a) Start of bed levelling daily cycle b) 3 hours after start c) 6 hours after start d) 9 hours after start e) 3 hours after end of daily bed levelling f) 9 hours after end of daily bed levelling Figure 42 Map plot of the instantaneous SSC plume resulting from the bed levelling activity over a daily cycle in Zone C. 14 March 2016 SKARDON RIVER BAUXITE PROJECT M&APA1066R001F01 43
55 3.7 Conceptual Model Based on the results of the numerical modelling along with the coastal processes understanding detailed in RHDHV (2015), a conceptual model of the sediment transport processes at the Skardon River ebb bar has been developed. The conceptual model is shown in Figure 43. The conceptual model demonstrates that sediment transport on the Skardon River ebb bar is driven by two primary processes, tidal currents and waves: Tidal currents dominate the sediment transport in the channel through the ebb bar, with the ebb dominance in the tidal current speed in this area resulting in a net transport in an offshore direction. Sand will therefore be transported as suspended load and bedload along the channel in the ebb bar until it reaches the offshore edge of the bar. Some of the sediment will then be deposited in deeper water on the offshore slope of the bar, promoting offshore growth of the bar, while some sediment will be transported in a net southerly direction due to wave action (as described below); and Waves dominate the sediment transport along the offshore edge of the ebb bar as this is where the wave energy is highest. The waves drive a net southerly longshore transport along the shoreline (estimated to be approximately 10,000m 3 (WorleyParsons, 2010)) due to the dominant wave direction (west-north-west) and the shoreline orientation. This longshore drift predominantly occurs in the Summer (some also occurs in the Autumn) when the waves are largest. During the Winter and Spring very little wave action occurs as the dominant wind direction is from the east and there is no offshore swell. The wave action allows sediment to be transported along the edge of the bar (it can be over the entire bar during extreme events) allowing sediment to be transported around the river mouth by longshore transport. 14 March 2016 SKARDON RIVER BAUXITE PROJECT M&APA1066R001F01 44

56 Figure 43 Conceptual Model of sediment transport at the ebb bar of the Skardon River. 14 March 2016 SKARDON RIVER BAUXITE PROJECT M&APA1066R001F01 45
57 3.8 Longshore Transport Impacts The ebb bar has built up over time in a dynamic equilibrium between the two dominant driving sediment transport mechanisms (waves and ebb dominated tidal currents). The ebb bar allows the natural net southerly longshore sediment transport of the region to bypass the Skardon River mouth. The ebb bar acts as a very large sediment sink, containing in excess of 10Mm 3 of sediment, periodically releasing sediment during wave events as part of the natural longshore drift process. The process of bed levelling on the ebb bar will move some sediment to the offshore edge of the bar. As such, the activity is replicating a natural process which already occurs on the bar, namely the movement of the bed sediment in the channel in an offshore direction to the offshore edge of the bar due to the ebb dominance in the tidal currents. The wave modelling demonstrated that bed levelling will not influence the wave conditions offshore of the bed levelling areas and as such once the sediment has been moved to the offshore edge of the ebb bar by bed levelling it is expected to behave in the same way as sediment which has been naturally transported to this area. That is some of the material will be transported in a southerly direction by wave action, while the remainder of the material will be deposited and promote the continued offshore growth of the ebb bar (until a sufficiently large wave event occurs which can transport the material). Effectively, the bed levelling activity will be replicating the natural processes which occur on the ebb bar. Based on the modelled wave conditions offshore of the ebb bar during TC Oswald, the depth of closure for the area can be estimated to be approximately 6m below LAT. This elevation is reached 400m offshore of the end of the bed levelling area, which is considerably further offshore than the bed levelling activity will transport any sediment. Therefore, the sediment moved by bed levelling will remain within the active zone and will not be lost from the longshore transport system. The activity is to some extent speeding up the natural processes by moving some sediment to the edge of the ebb bar at a higher rate than it is naturally transported. However, this is not expected to impact the transport of sediment around the ebb bar or the longshore drift along the shoreline to the north or south of the ebb bar as it will not change the amount of sediment available for transport on the edge of the bar. This is because there is already a large volume of sediment on the ebb bar and the wave conditions along the edge of the ebb bar will not be impacted by the change in bathymetry due to the bed levelling (see Section 3.6.2). 3.9 Summary Numerical modelling of the Skardon River has been undertaken to assess any potential impacts of bed levelling on the hydrodynamics, waves, coastal processes and water quality. The modelling has indicated: the change in bathymetry associated with the bed levelling activity will potentially cause: o o localised changes to the tidal currents directly adjacent to the bed levelling zones, with changes in current speed (increases and decreases) of up to 15% occurring during large spring tides; localised changes to the wave conditions on the ebb bar, with a reduction in wave heights to the south-east and an increase to the north. The reduction in wave heights to the south extends approximately to the shoreline, providing additional wave 14 March 2016 SKARDON RIVER BAUXITE PROJECT M&APA1066R001F01 46
58 sheltering to a small section of the shoreline, while the increase in wave heights to the north only covers a small section of the ebb bar and does not extend to the shoreline; the bed levelling activity has the potential to result in a small, short duration increase in SSC at the ebb bar and the area directly offshore. The SSC resulting from the bed levelling activity at Zones A and B (the eastern two zones), where bed levelling is proposed for 14 weeks, was up to 40mg/l at the bed levelling site, but typically less than 5mg/l away from the bed levelling activity. The SSC resulting from the bed levelling at Zone C, where bed levelling is proposed for 3 weeks, was up to 300mg/l at the bed levelling site, but typically less than 25mg/l away from the bed levelling; and the bed levelling activity is not predicted to impact on the longshore transport of sediment around the ebb bar and therefore at the shorelines to the north or south of the Skardon River. 14 March 2016 SKARDON RIVER BAUXITE PROJECT M&APA1066R001F01 47
59 4 Propeller Wash 4.1 Introduction Vessel movements generate a current field behind the ships propeller; this is commonly referred to as the propeller wash. As part of this study it was necessary to evaluate the impact of any propeller wash resulting from the movement of: barges in the Skardon River and along the ebb bar channel: and Panamax class cargo vessels at the transhipment location. The study has the following aims: to predict bed current speeds and shear stresses resulting from propeller wash due to barge operations in the Skardon River and cargo vessels at the transhipment location; and to estimate potential erosion rates and associated suspended sediment concentrations due to the propeller wash. 4.2 Natural Conditions A hydrodynamic model developed as part of the project has been used to describe the existing tidal currents in the Skardon River, further details on the model setup and configuration are provided in Section 3. The model extent is not sufficient to provide current speeds at the transhipment site. Currents resulting from the barge propellers have been calculated at four sites through the river, these locations are shown along with the water depth at high water in Figure 44. Figure 45 to Figure 48 show the peak flood and ebb tidal currents in the Skardon River (noting that the timing of peak flood and ebb differs between the river and the ebb bar). The plots show the following: the peak flood current speeds are typically in excess of 0.5m/s throughout the main channel up to the barge ramp location, where the peak flood currents drop to less than 0.5m/s; the highest peak flood current speeds occur at the mouth, with currents in excess of 0.9m/s; peak flood currents occur at the ebb bar approximately 1 hour 20 minutes earlier than in the river. The current speeds in the areas where bed levelling is proposed are less than 0.4m/s, while the areas of the ebb bar further inshore are typically more than 0.6m/s; the peak ebb current speeds are generally higher than the peak flood speeds. The current speeds are consistently more than 0.6m/s from the barge ramp to the mouth, with some areas in the mid channel area with current speeds of more than 0.8m/s; the highest peak ebb current speeds occur at the mouth, with currents exceeding 1.0m/s; and peak ebb currents occur at the ebb bar approximately 3 hours 30 minutes later than at the mouth, close to the time of low water. Current speeds of up to 0.7m/s occur in the inner and mid areas of the bar, reducing to less than 0.3m/s toward the seaward end of the ebb bar. 14 March 2016 SKARDON RIVER BAUXITE PROJECT M&APA1066R001F01 48

60 Figure 44 Water depth and propeller wash calculation locations. 14 March 2016 SKARDON RIVER BAUXITE PROJECT M&APA1066R001F01 49
61 Figure 45 Peak flood tidal currents in Skardon River. 14 March 2016 SKARDON RIVER BAUXITE PROJECT M&APA1066R001F01 50
62 Figure 46 Peak flood tidal currents at the ebb bar offshore of Skardon River. 14 March 2016 SKARDON RIVER BAUXITE PROJECT M&APA1066R001F01 51
63 Figure 47 Peak ebb tidal currents in Skardon River. 14 March 2016 SKARDON RIVER BAUXITE PROJECT M&APA1066R001F01 52

64 Figure 48 Peak ebb tidal currents at the ebb bar offshore of Skardon River. 14 March 2016 SKARDON RIVER BAUXITE PROJECT M&APA1066R001F01 53
65 A summary of the existing tidal currents at the four inshore sites is provided in Table 4. Table 4 Existing conditions at the five propeller wash calculation sites. Barge Mid Mouth Ebb Bar Offshore Depth (m MSL) Average Speed (m/s) Median Speed (m/s) th Percentile Speed (m/s) th Percentile Speed (m/s) Maximum Speed (m/s) Assumed Sediment type Sandy Mud Sandy Mud Coarse Sand Medium Sand Medium Sand Critical Erosion Threshold for Suspension (N/m 2 ) Average BSS (N/m 2 ) Maximum BSS (N/m 2 ) The table also shows: existing bed sediment types at the propeller wash sites. These have been defined based on the sediment samples collected in 2014 by RPS and in 2015 by Ports and Coastal Environmental Pty Ltd and the modelled tidal currents. calculated critical erosion threshold of the bed sediment. This has been estimated based on Van Rijn (1993). average and maximum bed shear stress (BSS) resulting from the tidal currents over a modelled 29 day lunar cycle at the sites derived from the hydrodynamic model). The modelled bed shear stresses indicate that it is only at the Mid site where any resuspension of bed material is expected to occur, and this would only occur during large spring tides with the highest tidal currents. However, it is expected that a thin mobile layer of loosely consolidated sediment will be present at some locations within the river (especially in the lower energy upstream areas); this material will have a relatively low critical erosion threshold and would therefore be expected to be regularly resuspended. 4.3 Approach A number of different approaches were considered and it was determined that the approach derived by Maynord (2000) was the most suitable for this assessment as it allows the impacts of multiple propellers to be included. As the proposed barges have three propellers it is therefore important to ensure the potential impacts of all the propellers are taken into consideration. In addition, this approach is also widely regarded as the most reliable Barge Vessel The near bed current speeds resulting from the barge propellers have been calculated at two different water levels which represent: the minimum water level that fully laden vessels can safely navigate the river and ebb bar; and the mean high high water (MHHW) level relative to the Skardon Barge Ramp. 14 March 2016 SKARDON RIVER BAUXITE PROJECT M&APA1066R001F01 54
66 The currents from the propellers have been calculated at four sites through the river as shown in Figure 44. The barge specifications assumed for the assessment are detailed in Table 5. Calculations have been made assuming the barge is fully laden. For an empty vessel the currents at the bed from the propellers would be lower due to the reduced draft. Assuming a fully laden vessel is therefore considered the worst case scenario. Table 5 Assumed vessel specification for the proposed barges. Aspect Details Length Overall (LOA) 110 m Width 21 m Summer loaded draft 3.9 m Draft Lightship 2.8 m Displacement (full load) 7500 t Gross Registered Tonnage (GRT) 4870 t Deadweight Tonnage (DWT) 5130 t Full Speed (fully loaded) 10 knots Propulsion 3 x 800 KW, 750 RPM Propeller 3 x 2000 mm diameter Cargo Vessel The near bed current speeds resulting from the Panamax cargo vessel propeller have been calculated for two different propeller depths which represent: a fully laden vessel moving away from the transhipment area, assuming a minimum underkeel clearance of 2m; and an unladen vessel arriving at the transhipment area, assuming the same water depth as for the fully laden vessel. The currents from the propellers have been calculated at a single site to represent the transhipment area. The vessel specifications assumed for the assessment are detailed in Table 6. Table 6 Aspect Assumed vessel specification for the proposed cargo vessels. Length Overall (LOA) Width Summer loaded draft Speed (fully loaded) Propulsion Propeller Details 290 m 32 m 12.0 m 14 knots 15,000 HP 1 x 4000 mm diameter 14 March 2016 SKARDON RIVER BAUXITE PROJECT M&APA1066R001F01 55
67 4.4 Results Barge Vessel The predicted maximum velocity which occurs adjacent to each of the three propellers of the proposed barges is 3.75m/s. As the jet travels away from the propeller its diameter increases, while its velocity decreases. As such, the jet has the potential to reach the sea bed (depending on the water depth) and therefore to result in increased bed shear stresses and potential erosion. The predicted near bed current speed, bed shear stress and erosion rate resulting from the barge propellers are shown for the four sites in Figure 49 to Figure 52. Figure 49 Calculated near bed current speeds, bed shear stresses and erosion rates from propeller wash at the Barge location for MSL (depth = 7m) and MHHW (depth = 8.3m). 14 March 2016 SKARDON RIVER BAUXITE PROJECT M&APA1066R001F01 56
68 Figure 50 Calculated near bed current speeds, bed shear stresses and erosion rates from propeller wash at the Mid river location for MSL (depth = 6.5m) and MHHW (depth = 7.8m). 14 March 2016 SKARDON RIVER BAUXITE PROJECT M&APA1066R001F01 57
69 Figure 51 Calculated near bed current speeds, bed shear stresses and erosion rates from propeller wash at the Mouth location for MSL (depth = 12m) and MHHW (depth = 13.3m). 14 March 2016 SKARDON RIVER BAUXITE PROJECT M&APA1066R001F01 58
70 Figure 52 Calculated near bed current speed, bed shear stress and erosion rate from propeller wash at the Ebb Bar location for MSL (depth = 4.5m) and MHHW (depth = 5.8m). The plots show how the current, bed shear stress and erosion rate varies with distance behind the propeller. The distance is measured along the centre line of the vessel path (i.e. where the highest bed velocities will occur due to the wash from the combined three propellers of the barge). A summary of the predicted currents is provided in Table 7. The depth averaged and estimated near bed maximum modelled current speed over a lunar cycle is also shown to put the speeds resulting from the propeller jet into perspective with the natural conditions. This shows that the maximum propeller induced bed current speed is higher than the natural maximum bed current speed predicted by the model at all the sites except for at the Mouth, indicating the potential for increased erosion at these sites. 14 March 2016 SKARDON RIVER BAUXITE PROJECT M&APA1066R001F01 59
71 Table 7 Site Predicted maximum bed current speed resulting from the propeller wash. Maximum Modelled Depth Averaged Current Speed (m/s) Maximum Modelled Near Bed Current Speed (m/s) Maximum Propeller Bed Current Speed (m/s) MSL MHHW Barge Mid Mouth Ebb Bar The table shows that the highest current speeds at the bed from the barge propellers jet is at MSL at the Ebb Bar site where speeds of up to 1.45m/s occur. When vessels pass at MHHW the current speeds are reduced to 0.81m/s. The lowest peak bed current speeds of 0.24m/s occur at the Mouth at MHHW when the depth is largest. The predicted distance behind the propeller where erosion is likely to occur as well as the predicted peak erosion rates are shown in Table 8. Table 8 Site Predicted erosion extent and rates resulting from the barge propeller wash. Erosion Extent (distance from Peak Erosion Rate (kg/s/m propeller (m)) 2 ) Assumed Critical Erosion Threshold for Suspension (N/m 2 ) MSL MHHW MSL MHHW Barge Mid Mouth Ebb Bar The table shows that at the Barge, Mid and Ebb Bar sites erosion is expected for between 150 and 180m behind the propeller at MSL, while no erosion is predicted at MHHW due to the additional 1.3m water depth. The erosion rates are variable, with the rates at the ebb bar being more than an order of magnitude higher than at the other two sites. The propeller jet does not result in any erosion at the Mouth site due to the existing depth at the site. If we assume that the barge is travelling at 4 to 6 knots (2.1 to 3.1m/s), then it will travel between 120 and 180m in 60 seconds. As such, at the Barge, Mid and Ebb Bar sites, erosion will occur at a single point on the bed for approximately 60 seconds as the vessel passes. The barges will sail down the centre line of the channel and therefore the erosion will be limited to the middle of the channel. A schematic prediction of the spatial distribution of bed current speeds resulting from the barge propeller wash at the Barge site is shown in Figure 53. Based on Figure 49 we can infer that erosion of the bed occurs when the current speed exceeds approximately 0.5m/s at this location, indicating that erosion would be expected to occur for a distance of approximately 125m behind the vessel over a width equal to the vessel width (20m). As such, the predicted area of erosion outside of the proposed navigational channel and berth area at the wharf, which occurs when a fully laden barge moves away from the wharf at mean sea level, is shown in Figure 54. The area is mainly focused around the old barge ramp where the bathymetric data from 2015 shows a number of scour holes are already present. As the predicted erosion zone is adjacent to the old barge ramp the scour holes are thought to be from previous propeller wash erosion during operation of the ramp. 14 March 2016 SKARDON RIVER BAUXITE PROJECT M&APA1066R001F01 60
 resulting from propeller wash at the wharf.")
72 Figure 53 Predicted spatial pattern of near bed current speeds resulting from the proposed barges at the barge site (depth = 6.8m). Figure 54 Predicted area of bed erosion (red rectangle) resulting from propeller wash at the wharf. 14 March 2016 SKARDON RIVER BAUXITE PROJECT M&APA1066R001F01 61
73 Based on the spatial extent of the erosion it is possible to predict the mass of sediment eroded per metre of the vessel path, this is shown in Table 9. In addition, if we assume that because of the high currents and associated turbulence caused by the propeller jet any sediment suspended would be rapidly mixed with the surrounding water we can predict the SSC resulting from the erosion. We will therefore assume that any suspended sediment will be entrained into the entire water column extending to the full width of the barge, based on this the predicted SSC resulting from the erosion is also detailed in Table 9. Table 9 Predicted mass of sediment eroded and resultant SSC from the propeller jet. Note that the calculations are for a single metre of the barge track. Site Predicted SSC resulting from the Average Erosion Rate Mass of Sediment Eroded per erosion per metre of vessel track (kg/s/m 2 ) metre of vessel track (kg) (mg//) MSL MHHW MSL MHHW MSL MHHW Barge Mid Mouth Ebb Bar The results show that SSCs of less than 3mg/l are expected at the Barge and Mid sites due to the propeller wash erosion, while at the Ebb Bar site they are 40mg/l. The higher SSCs at the Ebb Bar site will not occur for long as the sediment is predominantly made up of sand and as such will quickly settle out (medium sized sand settles at 0.03m/s (1.8m/minute)) once the barge has passed. When interpreting the results it is important to consider the following: erosion resulting from the propeller wash of the barge is expected to predominantly be within the centre of the navigation channel (predicted maximum width of approximately 20m). The only area where an impact outside of the navigation channel could occur is adjacent to the wharf when the barges manoeuvre onto and off the berths; it is expected that in the upstream areas there will be highly consolidated sediment under the softer surface layer assumed in this assessment. The consolidated sediment would be expected to have critical erosion thresholds in excess of 1N/m 2 and as such any erosion resulting from the propeller jet would be significantly reduced once the softer surface sediment has been eroded; along the ebb bar where the highest bed shear stresses are predicted due to the propeller wash it is likely that as the sand sized sediment is eroded by the propeller wash the bed would become armoured as coarser gravel sized sediment is left (material on the ebb bar is up to 25% gravel). This would protect the bed from future erosion as the critical erosion threshold for resuspension of granule sized gravel is approximately 50N/m 2 ; and resuspension of existing bed material due to propeller wash at MHHW is not predicted Cargo Vessel The predicted maximum velocity which occurs adjacent to the propeller of an example Panamax vessel is 6.5m/s. As the jet travels away from the propeller its diameter increases, while its velocity decreases. As such, the jet has the potential to reach the sea bed in the transhipment area and therefore to result in increased bed shear stresses and potential erosion. 14 March 2016 SKARDON RIVER BAUXITE PROJECT M&APA1066R001F01 62
74 The predicted near bed current speed, bed shear stress and erosion rate resulting from the Panamax vessel at the transhipment area are shown in Figure 55. The plots show that bed current speeds of up to 1.5m/s occur when the vessel is fully laden, while when the vessel is unladen bed current speeds are reduced to a maximum of 1.07m/s. The bed shear stresses resulting from the propeller induced currents have the potential to result in erosion for a distance of up to 250m from the propeller when the vessel is laden, while no erosion is predicted when the vessel is unladen. The sediment composition at the transhipment site is made up of approximately 15% gravels, 25% coarse sand, 50% fine to medium sand and 10% silt and clay. The silt, clay and fine to medium sand are all predicted to be resuspended by the maximum bed current speeds from the propeller wash, while sediment coarser than this (40% of the bed sediment) will only be transported short distances as bedload. As such, it is expected that the fine grained sediment will be eroded from the bed in the area impacted by the propeller wash, while the coarser grained sediment will remain with local bedload transport occurring. It is therefore expected that over time the sea bed will become armoured with coarser sediment protecting the sediment below from further erosion. 14 March 2016 SKARDON RIVER BAUXITE PROJECT M&APA1066R001F01 63
75 Figure 55 Calculated near bed current speed, bed shear stress and erosion rate from propeller wash at the Transhipment location for a laden and unladen Panamax class cargo vessel. 14 March 2016 SKARDON RIVER BAUXITE PROJECT M&APA1066R001F01 64
76 5 Vessel Wake Waves This section provides details of an assessment on vessel wakes expected along the Skardon River caused by barges on route to and from the offshore transhipment site. 5.1 Background There are two main types of waves generated by moving vessels: 1. Primary wave (or drawdown wave); and 2. Secondary waves caused by discontinuities in the hull profile Primary Waves As a vessel moves water flows past the hull in the opposite direction of travel, this flow is known as the return current. The velocity head of the water flowing past the vessel causes the water level along the vessel s length to fall in order to maintain the total head (energy) constant. Therefore the water level around the vessel is lowered (Figure 56). The transition between the undisturbed water level in front of the vessel and the water level depression is in the form of a sloping water surface referred to as the front wave. The transversal stern wave is the transition between the water level depression and the normal water level behind the ship. The combination of the water level depression, front wave and transversal stern wave act like a solitary wave with a similar length to the vessel. Drawdown does not break at the shoreline as normal waves, instead it is more like a tidal pulse rising and falling as the vessel passes. Primary waves tend to be relatively minor if the channel is sufficiently wide and deep. 14 March 2016 SKARDON RIVER BAUXITE PROJECT M&APA1066R001F01 65
77 Figure 56 Primary wave components of ship induced water motions (source: PIANC, 1987) Secondary Waves Due to the sharp rise and fall in the water surface at the bow and stern, inertia causes the water surface to lag behind its equilibrium position and produces a surface oscillation. This produces a pattern of free surface waves which propagate from the vessel that are known as secondary waves (Figure 57). The pattern spreads out from the vessel with decreasing wave amplitudes due to diffraction. The pattern consists of symmetrical sets of diverging waves that move obliquely out from the sailing line and a single set of transverse waves that move in the direction of the sailing line. The transverse and diverging waves meet to form cusps, the highest waves in the pattern are found along this cusp focus line. Secondary waves are the ones which are generally visible in the field and on aerial photographs. These waves may also break as they approach the bank shoreline. 14 March 2016 SKARDON RIVER BAUXITE PROJECT M&APA1066R001F01 66
78 Figure 57 Secondary wave pattern (Source: Schierech, 2001). 5.2 Approach The vessel speed is a critical parameter when calculating vessel wake waves. The barges proposed at Skardon River (specification provided in Table 5) will be travelling at speeds of between 4 and 6 knots along the channel. For this assessment the higher speed of 6 knots has been assumed as this is the worst case in terms of vessel wake waves. The cross-sectional area of the vessel, which is required to calculate the primary wave, was calculated assuming that the vessel was fully laden (e.g. draft of 3.92m). To represent the worst case scenario when calculating the primary wave the section of the navigation channel which lies within the smallest river channel cross-sectional area was used. This area is located approximately 300m north of the proposed wharf and has a cross-sectional area of 1,100m 2 relative to MSL (the minimum water level that the entire river can be navigated by a fully laden vessel). 5.3 Results It has previously been demonstrated that the theoretical effects of a ship transiting a channel can be derived from the Bernoulli equation (Schiereck, 2001). Calculated wave conditions based on this approach have previously been shown to correlate well with field-measurements (Moffatt & Nichol, 2003). Based on this approach a primary wave height of 0.12m has been predicted. Given the relatively small magnitude of this value, primary waves from the proposed barges are not expected to result in any significant erosion within the Skardon River. 14 March 2016 SKARDON RIVER BAUXITE PROJECT M&APA1066R001F01 67
79 To calculate the secondary waves (heights of the cusps) an approach detailed in a PIANC working group report on canal design was adopted (PIANC, 1987). The wave heights are closely linked to the vessel speed and the water depth, with wave heights increasing with increasing speed and decreasing with increasing depth. The secondary wave heights for the proposed barge, travelling at a speed of 6 knots, at a range of water depths which represent the possible depths when barges will be navigating the Skardon River are shown in Figure 58. It is important to note that the shallowest depth of 4.5m is only present at the ebb bar, where offshore waves will also occur. Depths of 6m and deeper are representative of the area within the Skardon River, where wave heights adjacent to the vessel are less than 0.2m. The plot shows that although wave heights of up to 0.25m can occur directly adjacent to the vessel, the heights are less than 0.07m at 50m away from the vessel sailing line and less than 0.05m 150m away from the vessel sailing line. There are two locations within the Skardon River where the navigation channel is relatively close to the channel bank: 1. upstream close to the proposed wharf the centreline of the channel is 80m away from the west bank of the river. This area would have a minimum depth of approximately 6m when the barge could navigate the entire river, and so the wave height at the bank is predicted to be less than 0.05m. This size wave is not expected to result in erosion of the bank, especially considering the stability and vegetated nature of the bank at present. In addition, due to the reduced vessel speed when berthing there is not expected to be any erosion in the vicinity of the wharf due to the vessel wake waves during this activity; and 2. the mouth of the Skardon River is relatively constrained and as a result the centreline of the channel is 100m away from the south bank of the river. This is a deep section of the river with a minimum depth of close to 12m when the barge could navigate the entire river, and so the wave height at the bank is predicted to be less than 0.03m. This size wave is not expected to result in erosion of the bank. The small wave height resulting from the vessel wakes is primarily a result of the relatively low vessel speeds adopted for navigation of the Skardon River. If the maximum barge speed of 9 knots was adopted then the resultant waves for a depth of 4.5m would be 1.2m adjacent to the barge and 0.33m at 50m away from the barge. Accordingly, it is important that 6 knots is adopted as the maximum speed within the Skardon River to ensure no impacts from vessel wake waves. 14 March 2016 SKARDON RIVER BAUXITE PROJECT M&APA1066R001F01 68
80 Figure 58 Secondary wave heights with horizontal distance from the vessel. 14 March 2016 SKARDON RIVER BAUXITE PROJECT M&APA1066R001F01 69
81 6 Cyclone Mooring Concept Design 6.1 Introduction As Skardon River is prone to tropical cyclones it is necessary for cyclone moorings to be available for the vessels operating in the river as part of the Bauxite Project. As such, concept designs for cyclone moorings for two barges and one supply vessel is provided in this section. The moorings have been designed with consideration to the following requirements specified by DEHP: Gulf Alumina will design, construct and locate cyclone moorings such that impacts to the marine environment are minimised, without compromising the safety function of the cyclone moorings; proposed cyclone mooring locations will avoid offshore reef habitats or any other sensitive marine areas, marine species and/or MNES; and cyclone moorings will be operated such that impacts on reefs and/or seagrass due to chain drag are avoided. 6.2 Concept Design A sketch drawing of possible storm moorings for the maritime fleet to be sheltered in the Skardon River during tropical cyclones is shown in Figure 59. These concepts are preliminary and subject to site investigations and confirmation of design parameters (vessel profiles and dimensions etc.). For this concept design exercise we have assumed the following: Fleet 2 x barges: 110m LOA x 21m beam x 2.8m draft. Windage air-draft 5.0m. Supply vessel: 80m LOA x 21m beam x 3.00m draft. Windage air-draft 5.0m. Design Storm Storm Ranking: 1:200 year Cyclone (Region C, AS ). Terrain Category second gust speed: 53.7 m/sec. Drag Coefficient, Cd = 2.0 for headwind. Wind Force 40 T. Corresponding wave impact load on bow 20T. Design load on anchor is 60T. Site Parameters Assumed (to be confirmed) Assumed water depth 10m (note: the design can be modified for shallower areas) Seabed material: medium soft clay with Cu = 20 KPa. The moorings are assumed to be located in a long narrow waterway; possible locations for the moorings in the Skardon River are shown in Figure 60. Additional site specific investigations, including hydrographic survey and benthic assessment, would be required prior to the location being confirmed. The moorings are configured as fore-and-aft so as to reduce movement of vessels and hence the heavy ground chains, minimising damage to the seabed and any benthic flora and fauna. 14 March 2016 SKARDON RIVER BAUXITE PROJECT M&APA1066R001F01 70
82 Figure 59 Skardon River Cyclone Moorings Concept Design. 14 March 2016 SKARDON RIVER BAUXITE PROJECT M&APA1066R001F01 71

83 Upstream of Metro Mining Facility Figure 60 Possible locations for cyclone moorings. 14 March 2016 SKARDON RIVER BAUXITE PROJECT M&APA1066R001F01 72
Inlet Management Study for Pass-A-Grille and Bunces Pass, Pinellas County, Florida
 Inlet Management Study for Pass-A-Grille and Bunces Pass, Pinellas County, Florida Final Report Submitted By Ping Wang, Ph.D., Jun Cheng Ph.D., Zachary Westfall, and Mathieu Vallee Coastal Research Laboratory
Request Number IR1-12: Flow Passage. Information Request
 Request Number IR1-12: Flow Passage Information Request Provide additional information about the 100 metre flow passage channel scenario between the Westshore Terminals and the proposed Project terminal
APPENDIX A Hydrodynamic Model Qualicum Beach Waterfront Master Plan
 Page 1 of 21 CLIENT: Town of Qualicum Beach PROJECT: SIGNATURE DATE CONTRIBUTORS : M. Marti Lopez REVIEWED BY : P. St-Germain, EIT APPROVED BY: J. Readshaw, P.Eng ISSUE/REVISION INDEX Issue Details Code
# Post Consultation and Submissions Resource Consent Conditions for Surfing Impact Mitigation August 2016
 # Post Consultation and Submissions Resource Consent Conditions for Surfing Impact Mitigation August 2016 Surf Mitigation Management Plan 1 1 Not less than 6 months prior to the commencement of the construction
HURRICANE SANDY LIMITED REEVALUATION REPORT UNION BEACH, NEW JERSEY DRAFT ENGINEERING APPENDIX SUB APPENDIX D SBEACH MODELING
 HURRICANE SANDY LIMITED REEVALUATION REPORT UNION BEACH, NEW JERSEY DRAFT ENGINEERING APPENDIX SUB APPENDIX D SBEACH MODELING Rev. 18 Feb 2015 1 SBEACH Modeling 1.0 Introduction Following the methodology
CALCASIEU SALINITY STRUCTURES. HYDRODYNAMIC MODELING (To Support Design of Salinity Barriers)
") CALCASIEU SALINITY STRUCTURES HYDRODYNAMIC MODELING (To Support Design of Salinity Barriers) Presentation Overview 1 2 3 4 5 Project Overview and CEA Circulation Modeling Vessel Hydrodynamics Modeling
CALCASIEU SALINITY STRUCTURES HYDRODYNAMIC MODELING (To Support Design of Salinity Barriers) Presentation Overview 1 2 3 4 5 Project Overview and CEA Circulation Modeling Vessel Hydrodynamics Modeling
Appendix E Cat Island Borrow Area Analysis
 Appendix E Cat Island Borrow Area Analysis ERDC/CHL Letter Report 1 Cat Island Borrow Area Analysis Multiple borrow area configurations were considered for Cat Island restoration. Borrow area CI1 is located
Feasibility Study for Dredging of Khaprabhanga Chapalir Don River in Patuakhali District for Improvement of Navigability
 IOSR Journal of Engineering (IOSRJEN) ISSN (e): 2250-3021, ISSN (p): 2278-8719 Vol. 04, Issue 06 (June. 2014), V3 PP 32-38 www.iosrjen.org Feasibility Study for Dredging of Khaprabhanga Chapalir Don River
Appendix 3. Hydrodynamic and sedimentation studies
 Appendix 3 Report EX 4945 Rev 3.0 November 2004 Document Information Project Report title Client Borough of Poole Client Representative Mr Stuart Terry Project No. DDR3553 Report No. EX 4945 Doc. ref.
Appendix D: SWAN Wave Modelling
 Appendix D: SWAN Wave Modelling D.1 Preamble The Eurobodalla Shire Council area is subject to extreme waves originating from offshore storms. When swell waves approach the coast, they are modified by the
: Hydrodynamic input for 2D Vessel Simulations (HY- 0027)
") Technical Note To : Christian Taylor (PoHDA) From : Rohan Hudson Cc : Ben Gray Date : 1/04/2015 (Final Draft) Subject : Hydrodynamic input for 2D Vessel Simulations (HY- 0027) Introduction This Technical
Technical Note To : Christian Taylor (PoHDA) From : Rohan Hudson Cc : Ben Gray Date : 1/04/2015 (Final Draft) Subject : Hydrodynamic input for 2D Vessel Simulations (HY- 0027) Introduction This Technical
Implications of proposed Whanganui Port and lower Whanganui River dredging
 PO Box 637 Wanganui 4540 Attention: Rowan McGregor Dear Rowan 1 Summary We understand that it has been proposed to bring large vessels into the Port at Whanganui requiring the excavation of a channel up
Preliminary Wake Wash Impact Analysis Redwood City Ferry Terminal, Redwood City, CA
 Technical Memorandum Preliminary Wake Wash Impact Analysis Redwood City Ferry Terminal, Redwood City, CA 1. Introduction The following preliminary wake wash impact analysis was initiated by the Port of
Available online at ScienceDirect. Procedia Engineering 116 (2015 )
") Available online at www.sciencedirect.com ScienceDirect Procedia Engineering 116 (2015 ) 320 325 8th International Conference on Asian and Pacific Coasts (APAC 2015) Department of Ocean Engineering, IIT
Available online at www.sciencedirect.com ScienceDirect Procedia Engineering 116 (2015 ) 320 325 8th International Conference on Asian and Pacific Coasts (APAC 2015) Department of Ocean Engineering, IIT
POOLE HARBOUR APPROACH CHANNEL DEEPENING EIA: SEDIMENT MANAGEMENT PLAN
 POOLE HARBOUR APPROACH CHANNEL DEEPENING EIA: SEDIMENT MANAGEMENT PLAN 1. Introduction The purpose of the Poole Harbour Sediment Management Plan (SedMP) is twofold: to mitigate the predicted impact of
INVESTIGATING STRATEGIES TO REPAIR HISTORIC TIDE WALLS ON THE CLARENCE RIVER AND ADJACENT BEACH AND RIVER BANK PROTECTION
 INVESTIGATING STRATEGIES TO REPAIR HISTORIC TIDE WALLS ON THE CLARENCE RIVER AND ADJACENT BEACH AND RIVER BANK PROTECTION I Jayewardene 1, A Hartley 2, B Blumberg 1, E Couriel 1 1 NSW Water Solutions,
Technical Brief - Wave Uprush Analysis Island Harbour Club, Gananoque, Ontario
 Technical Brief - Wave Uprush Analysis RIGGS ENGINEERING LTD. 1240 Commissioners Road West Suite 205 London, Ontario N6K 1C7 October 31, 2014 Table of Contents Section Page Table of Contents... i List
Poole Harbour Channel Deepening and Beneficial Use Review of Physical monitoring in Poole Harbour Technical Note 2 WITHOUT PREJUDICE
 Poole Harbour Channel Deepening and Beneficial Use Review of Physical monitoring in Poole Harbour Technical Note WITHOUT PREJUDICE. Introduction This technical note reviews the physical data that was collected
COUPLED MANAGEMENT STRATEGY LAKE CATHIE ESTUARY & COAST
 Lake Cathie Progress Association Inc. ABN 28 251 433 854 P.O. Box 247 Lake Cathie NSW 2445 PHONE/FAX: 02 6584 8211 EMAIL: r3packag@bigpond.com 20 th October 2009 Port Macquarie Hastings Council PO Box
THE WAVE CLIMATE IN THE BELGIAN COASTAL ZONE
 THE WAVE CLIMATE IN THE BELGIAN COASTAL ZONE Toon Verwaest, Flanders Hydraulics Research, toon.verwaest@mow.vlaanderen.be Sarah Doorme, IMDC, sarah.doorme@imdc.be Kristof Verelst, Flanders Hydraulics Research,
Impact of Dredging the Lower Narrow River on Circulation and Flushing
 Impact of Dredging the Lower Narrow River on Circulation and Flushing Craig Swanson Ph.D. Swanson Environmental Alex Shaw Ocean Engineering, URI Prof. Malcolm L. Spaulding Ocean Engineering, URI 29 January
SWASH MODELLING OF A COASTAL PROTECTION SCHEME
 SWASH MODELLING OF A COASTAL PROTECTION SCHEME Mark Klein 1, Andrew Symonds 2, Marcel Zijlema 3, Dan Messiter 4 and Michael Dufour 5 The Beresford shoreline, Australia, is subject to a complex interaction
Applications of ELCIRC at LNEC
 stratification in the Guadiana estuary tidal propagation in the Óbidos lagoon Lígia Pinto Anabela Oliveira André B. Fortunato 2 O utline Stratification in the Guadiana estuary The Guadiana estuary Objectives
Julebæk Strand. Effect full beach nourishment
 Julebæk Strand Effect full beach nourishment Aim of Study This study is a part of the COADAPT funding and the aim of the study is to analyze the effect of beach nourishment. In order to investigate the
Currents measurements in the coast of Montevideo, Uruguay
 Currents measurements in the coast of Montevideo, Uruguay M. Fossati, D. Bellón, E. Lorenzo & I. Piedra-Cueva Fluid Mechanics and Environmental Engineering Institute (IMFIA), School of Engineering, Research
SELECTION OF THE PREFERRED MANAGEMENT OPTION FOR STOCKTON BEACH APPLICATION OF 2D COASTAL PROCESSES MODELLING
 SELECTION OF THE PREFERRED MANAGEMENT OPTION FOR STOCKTON BEACH APPLICATION OF 2D COASTAL PROCESSES MODELLING C Allery 1 1 DHI Water and Environment, Sydney, NSW Abstract This paper presents an approach
Appendix M: Durras Lake Tailwater Conditions
 Appendix M: Durras Lake Tailwater Conditions M.1 Preamble WRL has completed a tailwater condition assessment for the entrance to Durras Lake, to be used as an ocean boundary condition for a future flood
CHAPTER 134 INTRODUCTION
 CHAPTER 134 NEW JETTIES FOR TUNG-KANG FISHING HARBOR, TAIWAN Chi-Fu Su Manager Engineering Department Taiwan Fisheries Consultants, Inc. Taipei, Taiwan INTRODUCTION Tung-Kang Fishing Harbor, which is about
Taranaki Tsunami Inundation Analysis. Prepared for Taranaki Civil Defence Emergency Management Group. Final Version
 Taranaki Tsunami Inundation Analysis Prepared for Taranaki Civil Defence Emergency Management Group Final Version June 2012 AM 12/07 HBRC Plan Number 4362 Asset Management Group Technical Report Prepared
IMPACTS OF COASTAL PROTECTION STRATEGIES ON THE COASTS OF CRETE: NUMERICAL EXPERIMENTS
 IMPACTS OF COASTAL PROTECTION STRATEGIES ON THE COASTS OF CRETE: NUMERICAL EXPERIMENTS Tsanis, I.K., Saied, U.M., Valavanis V. Department of Environmental Engineering, Technical University of Crete, Chania,
Cross-shore sediment transports on a cut profile for large scale land reclamations
 Cross-shore sediment transports on a cut profile for large scale land reclamations Martijn Onderwater 1 Dano Roelvink Jan van de Graaff 3 Abstract When building a large scale land reclamation, the safest
Concepts & Phenomena
 Concepts & Phenomena in coastal and port sedimentation R. Kamalian Ports and Maritime Organization of Iran and PIANC-Iran 7 9 December 2015 What is the problem? Many harbours have sedimentation problems
DUXBURY WAVE MODELING STUDY
 DUXBURY WAVE MODELING STUDY 2008 Status Report Duncan M. FitzGerald Peter S. Rosen Boston University Northeaster University Boston, MA 02215 Boston, MA 02115 Submitted to: DUXBURY BEACH RESERVATION November
MIKE Release General product news for Marine software products, tools & features. Nov 2018
 MIKE Release 2019 General product news for Marine software products, tools & features Nov 2018 DHI 2012 MIKE 3 Wave FM New advanced phase-resolving 3D wave modelling product A MIKE 3 FM Wave model - why?
The construction of Deepwater Navigation Channel (DNC) in the Bystry arm of the Danube Delta has started in The whole project provides the
 in the Bystry arm of the Danube Delta has started in The whole project provides the") Annex 45 Numerical Studies of Waves, Currents and Sediment Transport at the Marine Part of Deepwater Navigation Channel through the Bystry Arm of the Danube Delta and Model Verification based on Laboratory
Annex 45 Numerical Studies of Waves, Currents and Sediment Transport at the Marine Part of Deepwater Navigation Channel through the Bystry Arm of the Danube Delta and Model Verification based on Laboratory
Evaluation of June 9, 2014 Federal Emergency Management Agency Flood Insurance Study for Town of Weymouth, Norfolk, Co, MA
 Evaluation of June 9, 2014 Federal Emergency Management Agency Flood Insurance Study for Town of Weymouth, Norfolk, Co, MA Prepared For: Woodard & Curran 95 Cedar Street, Suite 100 Providence, RI 02903
Hydrodynamic and hydrological modelling to support the operation and design of sea ports
 Hydrodynamic and hydrological modelling to support the operation and design of sea ports Data needs and examples Martijn de Jong (port/nautical requirements, waves, currents) Sofia Caires (mean and extreme
FOR INFORMATION ONLY. Gold Coast Seaway Channel Scour and Rock Wall Stability Investigation. R.B doc December 2011
 A part of BMT in Energy and Environment Gold Coast Seaway Channel Scour and Rock Wall Stability Investigation R.B18625.001.00.doc December 2011 Gold Coast Seaway Channel Scour and Rock Wall Stability Investigation
Marine Renewables Industry Association. Marine Renewables Industry: Requirements for Oceanographic Measurements, Data Processing and Modelling
 Marine Renewables Industry Association Marine Renewables Industry: Requirements for Oceanographic Measurements, Data Processing and Modelling October 2009 Table of Contents 1. Introduction... 1 2. Measurements
THE HYDRAULIC AND MORPHOLOGICAL RESPONSE OF A LARGE COASTAL LAKE TO RISING SEA LEVELS
 THE HYDRAULIC AND MORPHOLOGICAL RESPONSE OF A LARGE COASTAL LAKE TO RISING SEA LEVELS Mr Evan K Watterson 1 Dr Joanna M Burston 1 Ms Heather Stevens 2 Mr Dan J Messiter 1 1 Author affiliation: WorleyParsons
EVALUATION OF BEACH EROSION UP-DRIFT OF TIDAL INLETS IN SOUTHWEST AND CENTRAL FLORIDA, USA. Mohamed A. Dabees 1 and Brett D.
 EVALUATION OF BEACH EROSION UP-DRIFT OF TIDAL INLETS IN SOUTHWEST AND CENTRAL FLORIDA, USA Mohamed A. Dabees 1 and Brett D. Moore 1 The paper discusses the analysis of up-drift beach erosion near selected
A Review of the Bed Roughness Variable in MIKE 21 FLOW MODEL FM, Hydrodynamic (HD) and Sediment Transport (ST) modules
 and Sediment Transport (ST) modules") A Review of the Bed Roughness Variable in MIKE 1 FLOW MODEL FM, Hydrodynamic (HD) and Sediment Transport (ST) modules by David Lambkin, University of Southampton, UK 1 Bed roughness is considered a primary
A Review of the Bed Roughness Variable in MIKE 1 FLOW MODEL FM, Hydrodynamic (HD) and Sediment Transport (ST) modules by David Lambkin, University of Southampton, UK 1 Bed roughness is considered a primary
Wave energy converter effects on wave and sediment circulation
 Wave energy converter effects on wave and sediment circulation Grace Chang and Craig Jones Integral Consulting Inc. cjones@integral-corp.com; gchang@integral-corp.com Jesse Roberts, Kelley Ruehl, and Chris
DUKC Chart Overlay. Presentation to IHO TWL and DQ Working Groups Wollongong, March 2014
 DUKC Chart Overlay Presentation to IHO TWL and DQ Working Groups Wollongong, March 2014 Outline Who is OMC? DUKC description & methodology. DUKC Chart Overlay concept. Chart Overlay application example.
Nearshore Placed Mound Physical Model Experiment
 Nearshore Placed Mound Physical Model Experiment PURPOSE: This technical note describes the migration and dispersion of a nearshore mound subjected to waves in a physical model. The summary includes recommendations
Shoreline Response to an Offshore Wave Screen, Blairgowrie Safe Boat Harbour, Victoria, Australia
 Shoreline Response to an Offshore Wave Screen, Blairgowrie Safe Boat Harbour, Victoria, Australia T.R. Atkins and R. Mocke Maritime Group, Sinclair Knight Merz, P.O. Box H615, Perth 6001, Australia ABSTRACT
Passage Key Inlet, Florida; CMS Modeling and Borrow Site Impact Analysis
 Passage Key Inlet, Florida; CMS Modeling and Borrow Site Impact Analysis by Kelly R. Legault and Sirisha Rayaprolu PURPOSE: This Coastal and Hydraulics Engineering Technical Note (CHETN) describes the
A FINAL REPORT BY PARTRAC LIMITED: MAY 2006
 A FINAL REPORT BY PARTRAC LIMITED: MAY 26 Measurement of Suspended Sediment Concentration & Tidal Current During Dredging Operations and Post-Dredge at the Offshore Disposal Area, Poole, Dorset QUALITY
Structure and discharge test cases
 Chapter 28 Structure and discharge test cases 28.1 Introduction Three test case have been implemented to test the performance and applicability of the structures and discharges modules. drythin Simulates
14 EFFECTS ON HARBOUR WAVES & CURRENTS
 14 EFFECTS ON HARBOUR WAVES & CURRENTS Effects of Channel Deepening Project on Waves and Tidal Currents in Lyttelton Harbour/Whakaraupō Derek G. Goring Prepared for: Lyttelton Port Company Ltd Client Report
INTRODUCTION TO COASTAL ENGINEERING
 The University of the West Indies Organization of American States PROFESSIONAL DEVELOPMENT PROGRAMME: COASTAL INFRASTRUCTURE DESIGN, CONSTRUCTION AND MAINTENANCE A COURSE IN COASTAL DEFENSE SYSTEMS I CHAPTER
CROSS-SHORE SEDIMENT PROCESSES
 The University of the West Indies Organization of American States PROFESSIONAL DEVELOPMENT PROGRAMME: COASTAL INFRASTRUCTURE DESIGN, CONSTRUCTION AND MAINTENANCE A COURSE IN COASTAL DEFENSE SYSTEMS I CHAPTER
Improving predictions of nearshore processes and shoreline dynamics for beaches along Australia s rocky and coral reef coasts
 Improving predictions of nearshore processes and shoreline dynamics for beaches along Australia s rocky and coral reef coasts Ryan Lowe Jeff Hansen, Graham Symonds, Mark Buckley, Andrew Pomeroy, Gundula
Physical Modeling of Nearshore Placed Dredged Material Rusty Permenter, Ernie Smith, Michael C. Mohr, Shanon Chader
 Physical Modeling of Nearshore Placed Dredged Material Rusty Permenter, Ernie Smith, Michael C. Mohr, Shanon Chader Research Hydraulic Engineer ERDC-Coastal Hydraulics Laboratory October 25,2012 Study
CLAM PASS RESTORATION AND MANAGEMENT PLAN BATHYMETRIC MONITORING REPORT NO. 7 Including Interior Bay Dredge Cuts and Tidal Data
 CLAM PASS RESTORATION AND MANAGEMENT PLAN BATHYMETRIC MONITORING REPORT NO. 7 Including Interior Bay Dredge Cuts and Tidal Data Submitted to: Florida Department of Environmental Protection DEP File No.
Paper for consideration by ENC Working Group. Use of AU6 ENC cells as an option for Bathymetric ENCs (benc)
") Paper for consideration by ENC Working Group Use of AU6 ENC cells as an option for Bathymetric ENCs (benc) Submitted by: Alvaro Sanchez (AHS) Executive Summary: Compilation of high density bathymetric
Paper for consideration by ENC Working Group Use of AU6 ENC cells as an option for Bathymetric ENCs (benc) Submitted by: Alvaro Sanchez (AHS) Executive Summary: Compilation of high density bathymetric
WOODFIBRE LNG VESSEL WAKE ASSESSMENT
 Woodfibre LNG Limited WOODFIBRE LNG VESSEL WAKE ASSESSMENT Introduction Woodfibre LNG Limited (WLNG) intends to build a new LNG export terminal at Woodfibre, Howe Sound, British Columbia. WLNG has engaged
Nearshore Dredged Material Placement Pilot Study at Noyo Harbor, CA
 1 Nearshore Dredged Material Placement Pilot Study at Noyo Harbor, CA Noyo Cove N 2011 National Conference on Beach Preservation Technology 9-11, February 2011 Lihwa Lin, Honghai Li, Mitchell Brown US
1 st Tidal and Water Level Working Group Meeting DHN, Niteroi, Brazil 31/03/09 02/04/09 Vertical Offshore Reference Framework (VORF) Chris Jones
 Chris Jones") 1 st Tidal and Water Level Working Group Meeting DHN, Niteroi, Brazil 31/03/09 02/04/09 Vertical Offshore Reference Framework (VORF) Chris Jones United Kingdom Hydrographic Office Presentation Structure
1 st Tidal and Water Level Working Group Meeting DHN, Niteroi, Brazil 31/03/09 02/04/09 Vertical Offshore Reference Framework (VORF) Chris Jones United Kingdom Hydrographic Office Presentation Structure
COST EFFECTIVE STORAGE CAPACITY INCREASE FOR ALUMINA TAILINGS DISPOSAL AREA THROUGH SPILLWAY OPTIMISATION
 COST EFFECTIVE STORAGE CAPACITY INCREASE FOR ALUMINA TAILINGS DISPOSAL AREA THROUGH SPILLWAY OPTIMISATION Abstract Lonie I * Tailings and Dams, GHD Brisbane, QLD, Australia Queensland Alumina Limited operates
April 7, Prepared for: The Caribbean Disaster Emergency Response Agency Prepared by: CEAC Solutions Co. Ltd.
 April 7, 2006 Prepared for: The Caribbean Disaster Emergency Response Agency Prepared by: Introduction CEAC Solutions Co. Ltd was commissioned in May 2005 to prepare coastal beach erosion hazard maps for
C3 VOLUME C: MIDDLE BANKS, MORETON BAY. Coastal Processes and Natural Features NEW PARALLEL RUNWAY DRAFT EIS/MDP FOR PUBLIC COMMENT C3-42
 C3 VOLUME C: MIDDLE BANKS, MORETON BAY Coastal Processes and Natural Features C3-42 C3 VOLUME C: MIDDLE BANKS, MORETON BAY Coastal Processes and Natural Features CONTENTS 3.1 Introduction 48 3.2 Proposed
Simulation of hydraulic regime and sediment transport in the Mekong delta coast
 Simulation of hydraulic regime and sediment transport in the Mekong delta coast 1. Introduction Coastal erosion in the Mekong Delta has been recorded in recent years and the erosion rate has been increasing
Training program on Modelling: A Case study Hydro-dynamic Model of Zanzibar channel
 Training program on Modelling: A Case study Hydro-dynamic Model of Zanzibar channel Mayorga-Adame,C.G., Sanga,I.P.L., Majuto, C., Makame, M.A., Garu,M. INTRODUCTION Hydrodynamic Modeling In understanding
Plan B Dam Breach Assessment
 Plan B Dam Breach Assessment Introduction In support of the Local Sponsor permit applications to the states of Minnesota and North Dakota, a dam breach analysis for the Plan B alignment of the Fargo-Moorhead
Ayrshire Shoreline Management Plan
 Appendix C: Data Gap Analysis - Coastal Processes IBE1107/D03 Draft D01 January 2018 rpsgroup.com/ireland Ayrshire Shoreline Management Plan Appendix C: Data Gap Analysis Coastal Processes DOCUMENT CONTROL
CHAPTER 8 ASSESSMENT OF COASTAL VULNERABILITY INDEX
 124 CHAPTER 8 ASSESSMENT OF COASTAL VULNERABILITY INDEX 8.1 INTRODUCTION In order to assess the vulnerability of the shoreline considered under this study against the changing environmental conditions,
Offshore engineering science
 Offshore engineering science In this research stream theoretical models advanced geotechnical models and new numerical techniques were used in applied offshore engineering topics such as loading, design
Exploring Localized Mixing Dynamics During Wet Weather in a Tidal Fresh Water System
 Exploring Localized Mixing Dynamics During Wet Weather in a Tidal Fresh Water System Ramona McCullough & Phil Duzinski Delaware Estuary Science & Environmental Summit January 27, 2015 Background and objectives
Metro Mining. Chapter 19 - Coastal Environment. Environmental Impact Statement
 Metro Mining Chapter 19 - Coastal Environment Environmental Impact Statement Table of Contents 19 Coastal Environment... 19-1 19.1 Project Overview... 19-1 19.2 Regulatory Framework... 19-2 19.2.1 Environment
Cline s Point Marina Ship Wave Analysis
 Cline s Point Marina Ship Wave Analysis Draft Technical Report April 13, 2015 Submitted To: Port of Corpus Christi Authority Prepared for: Port of Corpus Christi Authority This document is intended for
Technical Brief - Wave Uprush Analysis 129 South Street, Gananoque
 Technical Brief - Wave Uprush Analysis 129 South Street, Gananoque RIGGS ENGINEERING LTD. 1240 Commissioners Road West Suite 205 London, Ontario N6K 1C7 June 12, 2013 Table of Contents Section Page Table
Lecture Outlines PowerPoint. Chapter 15 Earth Science, 12e Tarbuck/Lutgens
 Lecture Outlines PowerPoint Chapter 15 Earth Science, 12e Tarbuck/Lutgens 2009 Pearson Prentice Hall This work is protected by United States copyright laws and is provided solely for the use of instructors
Artificial headlands for coastal restoration
 Artificial headlands for coastal restoration J. S. Mani Professor, Department of Ocean Engineering, Indian Institute of Technology Madras, Chennai 636, India Abstract Construction of a satellite harbour
Development and Implementation of a Relocatable Coastal and Nearshore Modeling System
 Development and Implementation of a Relocatable Coastal and Nearshore Modeling System James M. Kaihatu Zachry Department of Civil Engineering, Texas A&M University 3136 TAMU College Station, TX 77843-3136
MIAMI BEACH 32ND STREET HOT SPOT: NUMERICAL MODELING AND DESIGN OPTIMIZATION. Adam Shah - Coastal Engineer Harvey Sasso P.E.
 ABSTRACT MIAMI BEACH 32ND STREET HOT SPOT: NUMERICAL MODELING AND DESIGN OPTIMIZATION Adam Shah - Coastal Engineer Harvey Sasso P.E. - Principal Coastal Systems International, Inc. 464 South Dixie Highway
STUDIES ON THE TRANQUILITY INSIDE THE GOPALPUR PORT
 STUDIES ON THE TRANQUILITY INSIDE THE GOPALPUR PORT INTRODUCTION Sundar. V 1, Sannasiraj. S. A 2 and John Ashlin. S 3 Gopalpur port is an artificial harbor located in Odisha state. The geographical location
STUDY ON TSUNAMI PROPAGATION INTO RIVERS
 ABSTRACT STUDY ON TSUNAMI PROPAGATION INTO RIVERS Min Roh 1, Xuan Tinh Nguyen 2, Hitoshi Tanaka 3 When tsunami wave propagation from the narrow river mouth, water surface is raised and fluctuated by long
HARBOUR SEDIMENTATION - COMPARISON WITH MODEL
 HARBOUR SEDIMENTATION - COMPARISON WITH MODEL ABSTRACT A mobile-bed model study of Pointe Sapin Harbour, in the Gulf of St. Lawrence, resulted in construction of a detached breakwater and sand trap to
Analysis of Port Phillip Bay Tides Jan 2000 Dec 2009
 Analysis of Port Phillip Bay Tides Jan 2000 Dec 2009 Introduction Many people expressed concern that deepening the shipping channel a further 5 metres at the Entrance to Port Phillip Bay would permanently
ST LEONARDS COASTAL HAZARD VULNERABILITY ASSESSMENT
 Level 12, 333 Collins Street Melbourne VIC 3000 Australia Telephone: +61 3 8676 3500 Facsimile: +61 3 8676 3505 www.worleyparsons.com WorleyParsons Services Pty Ltd ABN 61 001 279 812 23 November 2011
Data Collection and Processing: Elwha Estuary Survey, February 2013
 Data Collection and Processing: Elwha Estuary Survey, February 2013 Ian Miller, WA Sea Grant Olympic Peninsula Field Office, 1502 E. Lauridsen Blvd #82, Port Angeles, WA 98362 immiller@u.washington.edu
Section 3.8 Coastal Processes
 Section 3.8 Coastal Processes Terminal 0 Environmental Impact Statement Abbot Point Coal Terminal 0 EIS Adani 3.8 Coastal Processes This section of the EIS describes the processes and environmental values
The Impact on Great South Bay of the Breach at Old Inlet Charles N. Flagg School of Marine and Atmospheric Sciences, Stony Brook University
 The Impact on Great South Bay of the Breach at Old Inlet Charles N. Flagg School of Marine and Atmospheric Sciences, Stony Brook University The previous report provided a detailed look at the conditions
CLAM PASS ANNUAL RESTORATION & MANAGEMENT PLAN TIDAL ANALYSIS ELEMENT REPORT NO. 13
 CLAM PASS ANNUAL RESTORATION & MANAGEMENT PLAN TIDAL ANALYSIS ELEMENT REPORT NO. 13 Submitted to: Pelican Bay Services Division Prepared by: Humiston & Moore Engineers H&M File No. 13-078 November 2012
PORTS AUSTRALIA. PRINCIPLES FOR GATHERING AND PROCESSING HYDROGRAPHIC INFORMATION IN AUSTRALIAN PORTS (Version 1.5 November 2012)
") PORTS AUSTRALIA PRINCIPLES FOR GATHERING AND PROCESSING HYDROGRAPHIC INFORMATION IN AUSTRALIAN PORTS (Version 1.5 November 2012) PREFACE These Principles have been prepared by the Hydrographic Surveyors
PORTS AUSTRALIA PRINCIPLES FOR GATHERING AND PROCESSING HYDROGRAPHIC INFORMATION IN AUSTRALIAN PORTS (Version 1.5 November 2012) PREFACE These Principles have been prepared by the Hydrographic Surveyors
Reading Material. Inshore oceanography, Anikouchine and Sternberg The World Ocean, Prentice-Hall
 Reading Material Inshore oceanography, Anikouchine and Sternberg The World Ocean, Prentice-Hall BEACH PROCESSES AND COASTAL ENVIRONMENTS COASTAL FEATURES Cross section Map view Terminology for Coastal
A STUDY OF THE LOSSES AND INTERACTIONS BETWEEN ONE OR MORE BOW THRUSTERS AND A CATAMARAN HULL
 A STUDY OF THE LOSSES AND INTERACTIONS BETWEEN ONE OR MORE BOW THRUSTERS AND A CATAMARAN HULL L Boddy and T Clarke, Austal Ships, Australia SUMMARY CFD analysis has been conducted on a 100m catamaran hull
Tidal Amplitude and Wave Setup in Trained and Untrained River Entrances.
 Tidal Amplitude and Wave Setup in Trained and Untrained River Entrances. Theo Moura 1, Mohammad Olfateh 1, David Callaghan 1, Peter Nielsen 1, Bob You 2 and Tom Baldock 1 1 School of Civil Engineering,
The Islands. Barbados. A prefeasibility study. R. Drieman M. Hinborch M. Monden E.A.J. Vendrik
 The Islands Barbados A prefeasibility study R. Drieman M. Hinborch M. Monden E.A.J. Vendrik General notice to the reader: In the academic programme for Hydraulic Engineering we have in the 4th year (i.e.
COFFS HARBOUR SEDIMENT MODELLING AND INVESTIGATION
 COFFS HARBOUR SEDIMENT MODELLING AND INVESTIGATION Luke McAvoy Undergraduate Engineer (Civil) Griffith School of Engineering, Griffith University, Gold Coast, Australia Daniel Rodger Senior Engineer Water
Effect of Hydrodynamics on Sediment Transport near a Coastal Inlet
 ICHE 2014, Hamburg - Lehfeldt & Kopmann (eds) - 2014 Bundesanstalt für Wasserbau ISBN 978-3-939230-32-8 Effect of Hydrodynamics on Sediment Transport near a Coastal Inlet H. Li, M. Brown, J. Rosati & Z.
Predicting the Surface Currents of Guanabara Bay Dr Andrew McCowan 1, Elise Lawry 2, Ryan Dermek 3
 Dr Andrew 1, Elise Lawry 2, Ryan Dermek 3 1 Managing Director, Water Technology Pty Ltd, Melbourne, Australia E-mail: Andrew.@watertech.com.au 2 Senior Engineer, Water Technology Pty Ltd, Melbourne, Australia
PhD student, January 2010-December 2013
 Numerical modeling of wave current interactions ata a local scaleand and studyof turbulence closuremodel effects MARIA JOÃO TELES PhD student, January 2010-December 2013 Supervisor: António Pires-Silva,
2. Water levels and wave conditions. 2.1 Introduction
 18 2. Water levels and wave conditions 2.1 Introduction This Overtopping Manual has a focus on the aspects of wave run-up and wave overtopping only. It is not a design manual, giving the whole design process
Numerical Model to Simulate Drift Trajectories of Large Vessels. Simon Mortensen, HoD Marine DHI Australia
 Numerical Model to Simulate Drift Trajectories of Large Vessels Simon Mortensen, HoD Marine DHI Australia Conceptual framework - multi-layered risk estimation Layer 1 (2011): Ship specific risk (proxy
Impacts of breakwaters and training walls
 Across the eastern seaboard of Australia, breakwaters and training walls have instigated fundamental perturbations to coastal and estuary processes. This has induced long-term changes to foreshore alignments,
HYDROGRAPHIC AND SITE SURVEY REPORT
 HYDROGRAPHIC AND SITE SURVEY REPORT Proposed Pen Site at Dounie, Sound of Jura Prepared for: Kames Fish Farming Ltd Kilmelford Argyll PA34 4XA Tel: +44 (0)1631 720699 TransTech Limited www.transtechltd.com
Evaluation of a proposed solution to beach erosion at Negril
 Mondon, E. M. and Warner, P.S. 2012. Evaluation of a proposed solution to beach erosion at Negril. Caribbean Journal of Earth Science, Volume 43, 11-23. Available online: 2 nd July 2012. Geological Society
Beach Profiles. Topics. Module 9b Beach Profiles and Crossshore Sediment Transport 3/23/2016. CE A676 Coastal Engineering
 Beach Profiles AND CROSS-SHORE TRANSPORT Orson P. Smith, PE, Ph.D., Professor Emeritus Topics Features of beach and nearshore profiles Equilibrium profiles Cross-shore transport References Text (Sorensen)