PINELLAS COUNTY COASTAL MANAGEMENT PROGRAM SUMMARY PLANNING DOCUMENT. Prepared For:
|
|
|
- Brianne Chase
- 5 years ago
- Views:
Transcription
1 PINELLAS COUNTY COASTAL MANAGEMENT PROGRAM SUMMARY PLANNING DOCUMENT Prepared For: Pinellas County Department of Environment & Infrastructure Engineering & Technical Support Division Prepared By: Coastal Planning & Engineering, Inc. A CB&I Company April 2012 Revised February 2013
2 EXECUTIVE SUMMARY This document details various aspects of the County s Coastal Management Program (CMP), including its history, program elements, funding needs for the next six years (FY ), and long term planning milestones through FY In addition, a discussion is included of how other coastal management programs in similar communities are run. Finally, three possible management strategies are outlined for the County with future planning recommendations. The summary planning document should be considered a living document to be updated by the County as needed to include new and changing coastal and programmatic issues. The information in this document is organized by section as follows: History SECTION 1: PINELLAS COUNTY COASTAL MANAGEMENT PROGRAM OPERATIONS Development of the barrier islands in Pinellas County began when the causeways connecting the islands to the mainland were constructed in the early 1900s. By the 1960s, the shoreline had eroded to the seawalls along most of the developed beaches and the water quality of the back bays had suffered from dredge and fill land building practices (Pinellas County Planning Department, 2008a). The erosion and degraded water quality prompted Pinellas County to sponsor their first Federal nourishment project and designate its first aquatic preserve (Pinellas County Planning Department, 2008a; USACE, 1966). In addition, civic activism encouraged the County to purchase its first public beach park on Sand Key, which opened in 1984 (Squires, 2012). Jim Terry, a surveyor and project manager for Public Works was the driving force in the development of the County s first Coastal Management Plan (Squires, 2011). By the mid-1980s, Pinellas County had participated in seven Federal nourishment projects. In 1985, Terry was appointed Vice Chairman of the Governor s Restore Our Coast Task Force. The task force proposed the first Comprehensive Beach Management Program for the State of Florida, which opened funding avenues and promoted increasing public access to beaches. The CMP continues to be responsible for coordinating the Federal, state and local shoreline protection projects, monitoring the beaches, and planning for the future of Pinellas County beaches. The County s CMP won the ASBPA s 2009 Coastal Project Award. The award recognized the County s shore protection project which restored 13 miles of its 35-mile shoreline via 29 restoration and nourishment projects over 40 years. The award presentation also noted the two beach parks, one preserve, nine public access parks, numerous public access points and more than 12,000 public parking spaces for beach access (Squires, 2011). i
3 Funding The Federal government has partially funded the construction of 25 shore protection projects including the construction of nourishments and structures within Pinellas County since 1969 and authorized even more studies of potential projects (USACE, 1984b; 1994; 2010). The Federal Shoreline Protection Project includes Sand Key, Treasure Island, Long Key and Clearwater Beach Island (ASBPA, 2009). The Federal share of the Sand Key, Treasure Island and Long Key projects has varied from 50% to 62.4% since 1969 (USACE, 2010). The terms and expirations of the projects are discussed in Section 2, Review of Federal Authorizations. Maintenance dredging of Federal navigation channels is also partially funded by the Federal government and often coincides with nourishment projects. The Federal navigation channels are John s Pass, Pass-A-Grille Pass and Clearwater Pass. The Federal cost share varies with each project (from 57% to 95%) (USACE, 2010). The Florida Department of Environmental Protection (FDEP) Beaches, Inlets and Parks Program (BIP's) (formerly the FDEP Bureau of Beaches and Coastal Systems, formerly the Department of Natural Resources, Division of Beaches and Shores) has maintained a comprehensive, long term, statewide management plan for erosion control and beach preservation since 1986 (FDEP, 2011a). The State of Florida s Beach Management Funding Assistance Program provides funding for the management of critically eroded shorelines in Florida. The state provides funding for up to 50% of the non-federal costs associated with eligible projects on publicly accessible beaches (FDEP, 2011a). Pinellas County funds the remainder of the non-federal costs via the Tourist Development tax, Penny for Pinellas and beach parking fees (Pinellas County Government Online, 2011). One half of one percent of the Tourist Development Tax (a five percent bed tax) is allocated to beach nourishment projects (St. Petersburg/Clearwater Area Convention & Visitors Bureau, 2011). The Penny for Pinellas tax has utilized percentages of sales tax to fund beach nourishment projects since the early 1990s. Local funds are essential to maintaining the elements of the CMP and a critical part of the cooperative agreements with the state and federal government. Recent Operations Pinellas County recently completed the construction of the Sand Key Federal Shore Protection Project in November The $31.54 million project included the nourishment of 8.7 miles of shoreline on Sand Key (Squires, 2012). In 2013, Pinellas County has scheduled the construction of the second phase of restoration at the Honeymoon Island State Park (Squires, 2012). The $5.2 million project includes structures, nourishment, planting and reconstruction of the parking lot. The beaches at the ends of Treasure Island, Sunshine Beach and Sunset Beach, are erosional hotspots (Roberts and Wang, 2012). Nourishment of Treasure Island and Upham Beach on Long Key occurred in 2010 as part of the John s Pass maintenance dredging (Pinellas County, 2010). ii
4 The next nourishment of Treasure Island and Long Key is scheduled for 2013/2014, pending funding availability (McClure, 2011). Repair of the geotextile T-groins at Upham Beach was conducted between November 2010 and July 2011 and included the removal and replacement of several geotextile tubes and scour aprons, patching and the application of a UV coating (CPE, 2011). As a result of the positive performance of the groins and part of continued hotspot management, a joint coastal permit application was submitted to reconstruct the T-groins at Upham Beach, Long Key into permanent rock structures. The permit was issued by FDEP-BIP's on October 30, Construction of the structures is anticipated to begin in 2013 or later pending funding acquisition (Squires, 2012). Recent Significant Storm Events Tropical Storm Debby resulted in severe beach and dune erosion along sections of Sand Key, Sunshine and Sunset Beach on Treasure Island and Upham Beach and Pass-A-Grille Beach on Long Key. Shoreline retreat rates varied from 15 to 30 feet. The storm occurred during the 2012 Sand Key Nourishment on June 24-26, 2012 (Wang and Roberts, 2012). Stakeholders and Partners The CMP cooperates and coordinates with many stakeholders affected by coastal management projects including the United States Army Corps of Engineers (USACE), FDEP-BIP's, FDEP Division of Recreation and Parks, Tampa Bay Aquatic and Buffers Preserves Program, Barrier Islands Government Council, Beach Stewardship Committees and the Pinellas County Board of County Commissioners. In addition, the CMP relies on consultants and special organizations including the University of South Florida, the Clearwater Marine Aquarium, Progress Energy and the Audubon Society for their professional services to accomplish its management goals. SECTION 2: FEDERAL AUTHORIZATIONS Pinellas County received its first federal authorization for a beach erosion control project on Sand Key, Long Key, Treasure Island and Clearwater Beach Island in 1954 (USACE, 1966). Since that time, Pinellas County has received seven additional federal authorizations for federal nourishments on Sand Key, Treasure Island, Long Key and Clearwater Beach Island, structures adjacent to severely erosional areas and the initial dredging and maintenance of federal navigation channels at John s Pass, North Channel (Pass-A-Grille Pass), Clearwater Pass and the Gulf Intracoastal Waterway. Following a review of the Federal authorizations, several recommendations were suggested for the CMP to maintain the Federal authorizations for the existing projects. The first recommendation was to continue pursuit of the reauthorization of funding for the Treasure Island Federal project whose authorization expires in Steps for reauthorization include the following: iii
5 The County should continue pursuit of Federal funding for 50% of the cost of Investigations by the USACE necessary for the reauthorization of the project ($500,000, requested for FY2012). The County will be responsible for the remaining portion of the cost-share for the Investigations estimated at $500,000. Once the funding is available, the County should request the USACE begin Investigations for the reauthorization of funding for the Treasure Island project. Assuming the Investigations conclude the project is eligible for Federal funding, the County will be eligible to request Federal funding until If the Investigations or recommendation of the USACE do not result in the reauthorization of Federal funding for the project, the County may pursue Federal funding by requesting direct sponsorship of the project from the USACE, obtaining Federal authorization for a new project on Treasure Island, or using Congressional Adds to get Federal authorizations and appropriations. There have been preliminary discussions by the legislature regarding the extension of the project life of all storm damage reduction projects from 50 years to 60 years (Harms, 2012). These discussions should continue to be tracked. The Federal authorizations could be modified in the following ways to better serve the needs of the Pinellas County CMP: Merge multiple project segments into one project for the entire County to avoid the independent schedule of the authorizations. The authorization would need to be included in a Water Resources Development Act bill. Merging the segments may take several years to complete. Develop official in-kind services agreement so the County can control some aspects of the Federal projects. This is an important item to have in place prior to any potential future changes in USACE project management, USACE project prioritization, and Congressional support. If the Federal authorizations cannot be reauthorized or modified to address the County s needs, or if future Federal funding for the County s projects becomes difficult to obtain, the County needs to prepare to take control of the shore protection project. Management responsibilities would include maintaining a design beach, identifying sand sources, addressing remaining hotspots to reduce erosion rates, developing new funding mechanisms and administrating contracts. iv

6 SECTION 3: SUMMARY ASSESSMENT OF HISTORICAL AND EXISTING CONDITIONS FOR EACH PHYSICAL CMP ELEMENT The historical and existing conditions of each element in the CMP are presented in Section 3. The elements include Anclote Key, Three Rooker Bar, Honeymoon Island, Caladesi Island, Clearwater Beach Island, Sand Key, Treasure Island, Long Key, Shell Key, Bunces Key, Mullet Key, Hurricane Pass, Clearwater Pass, John s Pass, Blind Pass, North Channel (Pass-A-Grille Pass), South Channel (Pass-A-Grille Pass), Bunces Pass, sediment borrow areas and artificial reefs. A brief description of each element follows: Figure ES-1. Anclote Key Anclote Key Anclote Key is a wave dominated barrier island approximately 3.5 miles offshore of the Pinellas/ Pasco County line. The pristine 4- mile island is subdivided into the Anclote Key State Preserve and the Anclote National Wildlife Refuge. As a result of the loss of seagrass beds, the spit at the north end of the island has grown by more than a half mile since the 1960s (Davis and Fitzgerald, 2004) (Figure ES-1). The southern end of the island accreted from the 1880s to the 1960s due to the landward migration and attachment of swash bars (Davis and Fitzgerald, 2004). As of June 2011, Anclote Key has been designated as noncritically eroded (FDEP, 2012a). Three Rooker Bar Three Rooker Bar is part of the Anclote Key State Park (Figure ES- Figure ES-2 Three Rooker Bar (PCPA, 2011) 2). The island has formed over the past 25 years (Davis and Elko, 2003). The sand supply may have come from the release of sand that occurred after a substantial loss of seagrass beds in the area (Evans et al., 1987). The rapid establishment of upland vegetation has helped stabilize the island. Vegetation was continuous along the spine of the semi-circle island in 1995 (Google Earth, 2012). Overwash during storms caused shoreline recession in the center of the island and loss of vegetation (1998). By 2005, the island had breached near the north end. As the breach widened, the north end of the island eroded to the vegetation line. By 2010, the center of the island was submerged at low tide. v
7 Honeymoon Island Honeymoon Island is a 3.6-mile long wave dominated barrier island bordered by Hurricane Pass to the south (Figure ES-3). Honeymoon Island was originally the north end of Hog Island, which breached during the 1921 Hurricane that formed Hurricane Pass. In 1969, developers dredged over one million cubic yards of sand and rock directly offshore of the island and placed it along the midsection of the island (Pinellas County Government Online, 2008a; FDEP, 1999; 2008). The southern half of the island severely eroded as a result (Davis and Elko, 2003). Honeymoon Island was acquired by the state in In 2008, the County in cooperation with the FDEP s Division of Recreation and Parks completed Phase I of the restoration project which included the reconstruction of a T-head groin near the parking areas and the placement of 140,000 cubic yards of sand from the Hurricane Pass ebb shoal (FDEP, 2006). Figure ES-3 Honeymoon Island (PCPA, 2011) In 2013, the County and State anticipate commencing Phase II of the restoration. The $5.2 million project consists of the construction of three additional T-head groins with fill (at R-8, R- 8.5, and R-9), vegetation removal, reconfiguration of the existing parking lot, and removal of 50 feet of an existing submerged groin (near R-8.5). Fill will be placed from R-7.5 to R-9.5, extending the berm approximately 112 feet to 184 feet at an elevation of 4.2 feet NAVD. Caladesi Island Caladesi Island is an undeveloped 2.3-mile long barrier island located 1.5 miles offshore of the City of Dunedin (Figure ES-4). Prior to the Hurricane of 1921, Caladesi Island was connected to Honeymoon Island forming Hog Island. The hurricane resulted in the opening of the Hurricane Pass and the splitting of Hog Island into separate islands (Elko and Davis, 2006). Caladesi Island was acquired by the state in 1966 and designated as a state park (USACE, 1980b). In 1978, Dunedin Pass, the island s southern boundary at the time, filled in. After Dunedin Pass closed, Clearwater Island Beach was connected to Caladesi Island. Caladesi Island has consistently been accretional. In the 1980s, the southern end of the island remained wide as swash bars, formed prior to the closure of Dunedin Pass, moved onshore (Elko, 2001). In the early 2000s, the north end of Caladesi Island rapidly accreted due to an increase in littoral drift from the south (Elko, 2001). Storm overwash is common on the island. Certain sections of the island are vi Figure ES-4 Caladesi Island (PCPA, 2011)
.")

8 protected from storm erosion by peat beds formed by mangrove detritus (Elko, 2001). Recently, the middle section of the island, in the vicinity of Dunedin Pass, has eroded, evidenced by a fairly continuous dune scarp (Wang, 2012). Clearwater Beach Island Clearwater Beach Island extends 3.3 miles south-southwest of Caladesi Island to Clearwater Pass (Figure ES-5). In the 1960s, the shoreline along the island fluctuated significantly, prompting residents to construct seawalls to protect their property. In addition, the City of Clearwater constructed many groins including a terminal groin to reduce end losses to Clearwater Pass. Several of these groins were included in the first federal beach erosion control project. In 1982, the jetty at Clearwater Pass was extended and the elevation of the beach was increased via federal nourishment (USACE, 1994). Since then, Clearwater Beach Island has not required nourishment. Sand Key Sand Key, a 14-mile long barrier island, is bordered by Clearwater Pass to the north and John s Pass to the south. Nine municipalities are located in Sand Key including Clearwater, Belleair Beach, Belleair Shore, Indian Rocks Beach, Indian Shores, Redington Shores, North Redington Beach, Redington Beach, and Madeira Beach. The County has co-sponsored four federal nourishments since the first in Sand Key has erosion control structures adjacent to the passes at the north and south and a breakwater at Redington Beach. The shoreline near Dan s Island (Rmonument 60.25) at the north end of the island continues to erode rapidly. A study of management options for this hotspot is suggested in Section 4. Treaure Island Treasure Island is a 3.3-mile barrier island, bordered by John s Pass to the north and Blind Pass to the south (Figure ES-7). By the 1960s, the island was facing serious erosion problems. In response, the City of Treasure Island constructed 56 concrete (originally timber) groins and a rubble mound jetty on the north side of Blind Pass (USACE, 1984b). These groins are no longer present or were buried by beach nourishments. vii Figure ES-5 Clearwater Beach Island (PCPA, 2011) Figure ES-6 Eroding and Accreting areas on Sand Key (Roberts et al., 2012)


9 The first Federal nourishment project on the west coast of Florida was on Treasure Island in After the initial construction and repair following Hurricane Gladys, Treasure Island was renourished every two to three years. The material used for the nourishments was sourced from Blind Pass, John s Pass and an offshore borrow area parallel to the island at Sunset Beach. Sunshine and Sunset beaches required frequent nourishment. Sunshine Beach, at the north end of Treasure Island, is historically erosional as a result of inlet effects. A terminal groin was constructed at John s Pass in 2000 to limit the end losses from Sunshine Beach to the inlet (Krock, 2005). Prior to its construction, the shape and beach width at Sunshine Beach fluctuated significantly. Sunset Beach, at the south end of Treasure Island, is sediment starved due to the sediment trapping that occurs in the center of the island and wave focusing that results from an offshore borrow area parallel to the island used in the 1960s (Roberts and Wang, 2011). The center of the island accretes in response to sand bypassing John s Pass and migrating onshore. Despite nourishment in 2010, Sunset Beach continued to rapidly erode through early 2012 between FDEP monuments R-137 to R (Caddy s on the Beach Restaurant to 77 th Street). Figure ES-7 Treasure Island (PCPA, 2011) Long Key Long Key is a drumstick shaped barrier island that extends 4.1 miles from Blind Pass to North Channel, Pass-A-Grille Pass (Figure ES-8). Beach management began early on Long Key with the construction of the first terminal groin adjacent to Blind Pass in The City of St. Petersburg Beach (now St. Pete Beach) armored the rapidly eroding ends of the island with seawalls and groins during the 1950s, 60s and 70s. In 1980, the island s first Federal nourishment project was constructed on the north end. Periodic nourishment continued on a five-year interval as part of the Federal Figure ES-8 Long Key project. Data indicates the fill eroded within two to five years after construction (Elko et al.). The north end of the island (Upham Beach) was severely erosional, eroding within two years after nourishment. The central segment was accretional and the south end (Pass-A-Grille) was stable. viii

. In 1998, the channel flowing through the center of the island closed (Google Earth, 2012c).")
, with the exception of a few privately owned parcels.")
10 In response to the erosion at Upham Beach on the north end of the island, five geotextile T-head groins were constructed in (Figure ES-9). The successful performance of the temporary groins prompted the CMP to begin planning and permitting to reconstruct the T- groins out of rock and make them permanent structures. Shell Key The Shell Key Preserve includes a barrier island, a series of mangrove islands, seagrass beds and sand flats (Figure ES-10). The barrier island was formed by the amalgamation of sand bars in the 1950s (ASBPA, 2009). In 1998, the channel flowing through the center of the island closed (Google Earth, 2012c). Over the next ten years, the island stabilized and the line of vegetation became continuous (CPE, 2010). Figure ES-9 Upham Beach Structures Pinellas County has leased the preserve from the state since 2000 (Lease No. 4228), with the exception of a few privately owned parcels. The Pinellas County Board of County Commissioners manages the preserve through the County Department of Parks and Conservation Resources (formerly managed through the Department of Environmental Management, Environmental Lands Division). Bunces Key Bunces Key was formed from sediments from the ephemeral south channel of the Pass-A-Grille Pass and the Bunces Pass ebb shoal (Wilhoit, 2004). From the 1960s on, the north end of the island lengthened, closing the south channel of Pass-A-Grille Pass and connecting to Shell Key (Wilhoit, 2004). At present, Bunces Key is connected to Shell Key. Figure ES-10 Shell Key Mullet Key Mullet Key is a V-shaped island at the south end of Pinellas County (Figure ES-11). The north end of the Key contains the historically-significant and recreationally-popular Fort DeSoto Park. The federal Mullet Key Beach Erosion Control Study was authorized in Federal nourishment projects using the offshore borrow area were constructed in 1973 and 1977 (USACE, 1980; Pinellas County, ix Figure ES-11 Mullet Key (PCPA, 2011)
11 2011). The 1973 project included the construction of a 1,150-foot long revetment at the south bend of the island. The project was deauthorized in 1990 as a result of a lack of funding obligations (USACE, 2010; USACE, 2009; FDEP, 2008). In response to erosion on the island, Pinellas County partnered with the USACE on a beneficial use of dredged material project at Fort De Soto Park in Inlets Pinellas County has seven inlets. Three of the inlets have federally maintained navigation channels, Clearwater Pass, John s Pass and North Channel (Pass-A-Grille Pass). Five of the inlets and their ebb shoals have been used as borrow areas for nourishments including Hurricane Pass, Clearwater Pass, John s Pass, Blind Pass and North Channel (Pass-A-Grille Pass) (Taylor, 2001; FDEP, 2008; Elko, 2006a). In the past, changes in the tidal prism due to development of the bay area caused destabilization of several of the inlets, resulting in the construction of structures and armoring on the barrier islands adjacent to the inlets. John s Pass and Blind Pass have state approved inlet management plans. Overall, the inlets are managed on an as-needed basis. Sediment Borrow Areas Sand resources along the west coast of Florida typically fall within three (3) broad categories: (1) ebb-tidal shoals, (2) shoreface sands and (3) sand ridges (Finkl et al., 2007). For decades, ebbtidal shoal deposits have been used for beach nourishment projects in Pinellas County. Egmont Channel Shoal is an ebb-tidal shoal located approximately 3.5 miles west of Mullet Key. Egmont Channel Shoal has been used as a sand source numerous times in the past for projects including Indian Rocks Beach Nourishment (1990), Indian Shores Beach Nourishment (1992), Treasure Island Beach Renourishment (1996), Long Key Beach Renourishment (1996) and Sand Key Renourishment (1998 and 2006). The Egmont Channel Shoal Borrow Area has also been previously authorized as the borrow area for Clearwater Beach Island and Mullet Key. John s Pass, Blind Pass, Pass-A-Grille north, and Pass-A-Grille south ebb-tidal shoals have all been investigated by the USACE and used in the past multiple times. In 1994, the U.S. Army Corps of Engineers (USACE) conducted a sand resource survey offshore of Sand Key to identify sand resources to be used as borrow areas for future nourishment projects (Dial Cordy and Associates, 2002). Over the course of the survey, they identified nine (9) study areas containing potentially beach compatible material. Further analysis of these areas led to the development of twenty (20) potential borrow areas. These borrow areas were developed by the USACE in In 2007, Pinellas County requested that Coastal Planning & Engineering, Inc. (CPE) re-evaluate the USACE data for dredgeability and beach compatibility (Forrest et al., 2007). Based on CPE s re-evaluation of the USACE data, the three (3) most promising sources of beach compatible material were Study Areas C, D and H. Upon further analysis, three (3) borrow areas, containing an estimated 72,000 cy of potentially beach compatible material were developed within Study Area D. Three (3) borrow areas containing an estimated 817,300 cy of potentially beach compatible material were developed within Study Area H. x
12 In 2008 and 2009, the County authorized CPE to conduct additional offshore sand search reconnaissance- and design-level investigations (Forrest et al., 2009). These investigations resulted in the identification of three potential sand source areas, labeled J, K, and L. A single borrow area containing 305,300 cy of potentially beach compatible material was developed within Study Area J. A single borrow area containing 1,480,600 cy of potentially beach compatible material was developed within Study Area L. Area L was used as the sand source for the 2012 Sand Key nourishment project. SECTION 4: NEEDS ANALYSIS AND SCHEDULE OF FUTURE ACTIVITIES We have identified needs to be included in the comprehensive management plan based on the analysis of the conditions of the CMP elements. A schedule of future activities has been suggested to address erosional hotspots and ensure continuity and consistency in program management. Program Management Identify potential opportunities to align project schedules and save on mobilization costs. The County needs to continue aligning schedules for the dredging of Blind Pass and the nourishment of Long Key. Continue to link projects, i.e. Treasure Island and Long Key for construction. Regional monitoring of the combined projects should also be continued. Study the value of including or excluding Bellair Beach with the nourishment of Sand Key. The study s findings can then be used to establish and adopt a policy for the case when a non-public section of beach is adjacent to public beaches with plans to be nourished. The best source of funding must also be determined. Be prepared to assess the damage, estimate losses and request emergency funding from state and federal agencies. In order for any non-federal beaches to qualify for FEMA funding, records from monitoring and a beach design template must be kept on file. Develop emergency response plans for state parks and other non-federal beaches. Honeymoon Island Offshore sand sources for Honeymoon Island nourishments need to be identified. Sand Key An island-wide monitoring program should be initiated. A sand source needs to be identified for the next Sand Key project, tentatively scheduled in the 2017 to 2019 time frame. xi
13 An analysis of the coastal processes near the hotspot at the north end of Sand Key (Dan s Island) is necessary to identify management options to slow the erosion rate in the area. The analysis may be part of the development of an inlet management plan for Clearwater Pass. The necessity and feasibility of removing the Redington Beach breakwater needs to be evaluated. The City of Madeira Beach and the County must continue to monitor the Madeira Beach groin system. The groins may require maintenance, safety inspections and performance evaluations. The County may need to consider proposing to extend the fill template at their cost as a betterment to the federal project. As part of the coastal processes analysis of John s Pass (see Inlet Management section), the performance of the terminal groin at the south end of Sand Key should be evaluated. The performance of the nourishment projects at the Headland (R-82 to R-89) should be analyzed to address erosional issues. The County should evaluate the benefits of extending pipeline corridors farther offshore of Sand Key into deeper water. This would increase the efficiency of current construction methodologies while adding the potential for additional construction method options in the future, resulting in increased bidding competition from contractors. Investigation and permitting longer pipeline corridors will require sidescan sonar surveys with potential diver verification of hardbottom resources. Treasure Island A feasibility study including morphology modeling of management options to address the hotspots should be conducted. Long Key Shell Key The County needs to continue pursuit of the joint coastal permit to nourish Pass-A- Grille Beach. Additionally, monitoring and design records need to be kept on file for use in requesting emergency funding as needed. The Shell Key Management Plan was released in The plan may need to be updated as environmental conditions or the intended use of the island changes. Funding resources for Shell Key need to be reviewed. xii
14 Mullet Key The County should continue to take advantage of dredge spoils from Tampa Bay ship channel to nourish Mullet Key and plan projects accordingly. Inlet Management An updated coastal processes analysis of the inlet dynamics at John s Pass needs to be conducted to evaluate the performance of the inlet stabilization structures and their need for modification, the wave focusing on the north end of Treasure Island and the shoaling inside the pass. The study will require wave and morphology modeling. Results from the study can be used to update the inlet management plan (IMP). IMPs for Clearwater Pass and Pass-A-Grille Pass need to be developed. Additionally, the management strategies in the Blind Pass and John s Pass IMPs should be updated to reflect current operations and needs. IMPs are a critical component in improving eligibility for state funding. IMPs can be adopted by the FDEP-BIP's and incorporated into the Statewide Strategic Beach Management Plan (SBMP), thus making some management activities eligible for state funding. Inlet management plans should consider the impacts of changing the inlet and ebb shoal configurations on the locations of sediment transport divergence and ebb shoal attachment points on the adjacent beaches. Hurricane Pass has been a passively managed long term sand source for nourishment projects on Honeymoon Island. The County should consider the maintenance needs of the channel through Hurricane Pass, identify trigger points for maintenance dredging and develop a plan for future dredging. Nourishment projects should be planned concurrently with inlet maintenance dredging projects to ensure any beach compatible dredge spoils are placed on the adjacent beaches. Several of the undeveloped barrier islands have naturally opening and closing passes or breaches. The County should have a response plan for the potential occurrence of a breach. Sediment Management Pinellas County needs to maintain a regional sand inventory including comprehensive mapping of offshore sediment resources in both state and federal waters. A better understanding of available resources will facilitate design and decision making. Further investigation is needed to determine if dredged material from the Tampa Harbor or other Federal navigation maintenance projects could be placed in the nearshore zone adjacent to the Egmont Key gulf shoreline. xiii
15 A regional sediment management strategy that uses beach quality sand from upland dredged material management areas and the maintenance dredging of the navigation projects, where possible, should continue to be incorporated into the maintenance of the beach restoration projects. An investigation is needed to determine the potential applications and resources available for the use of upland beach compatible sand hauled by truck for small nourishments. A potential application for these sands is to nourish estuary (bayside) beaches. Construction The County should evaluate alternative nourishment construction methods to potentially lower costs and add flexibility to the construction schedule. Contractors with small hopper dredges may be able to dredge large shallow areas or small hills at a reduced cost and during times when other dredges are not available. Environmental Resource Planning Mapping of the nearshore hardbottom in the vicinity of North Madeira Beach needs to be updated to assist in design and permitting of future shore protection projects. Projects located within and near the aquatic preserve boundaries require additional protection, including more stringent water quality standards than in non-aquatic preserve waters, during permitting and construction to ensure preservation of the existing conditions. The Shell Key Management Plan recommends collaborating with the Environmental Land Division (now the responsibility of Pinellas County Parks and Conservation Resources) to reduce propeller scarring and nutrient loads and to promote healthy seagrass beds around Shell Key (PCDEM, 2007). The County should continue to encourage dune restoration of stable beaches by local municipalities and individual owners in order to increase storm protection and improve habitat. SECTION 5: DESCRIPTION OF OTHER COASTAL COMMUNITIES MANAGEMENT PLANS Manatee County Coastal management responsibilities in Manatee County are part of the Marine Resources program under direction of the Department of Natural Resources. The Marine Resources program is responsible for beach nourishment projects on Anna Maria Island s nine miles of sandy beaches, artificial reefs and waterways, Aids to Navigation and abandoned vessel removal. The County s responsibility extends the length of Anna Maria Island from R-1 to R-41 xiv
16 approximately 37,300 feet. There are four public beaches along Anna Maria Island; Anna Maria Bayfront Park, Manatee County Public Beach in Holmes Beach, Bradenton Beach/Cortez Beach, and Coquina Beach. The existing coastal management strategy consists of shore protection in the form of beach nourishment and implementation of well-designed coastal structures with ongoing monitoring programs. In Manatee County, the engineering, design, permitting, and coordination of beach nourishment projects, and development of artificial reefs is contracted to outside consultants (CPE) with oversight by the Natural Resources Department Director. Three in-house employees work on coastal management. Federal, state and local sources provide the primary funding for the coastal projects. The local sponsor, Manatee County, provides support through the use of funds dedicated to beach nourishment provided by a one cent sales tax administered by the Tourist Development Council (TDC). Additionally, the County has adopted a Capital Improvement Program, which appropriates the funding necessary to cost share the Anna Maria Island Beach Renourishment Program with the State. The Cities of Anna Maria Island (Anna Maria, Holmes Beach and Bradenton Beach) have also adopted an annual operating budget to fund the Cities on-going maintenance of the beach and park systems (outside of nourishment costs). Manatee County assumed control of the Federal project under the provisions of the 1992 Water Resources Development Act (WRDA) which provided for local government project control and Federal cost-sharing on a reimbursable basis. As the non-federal sponsor, Manatee County proceeded under the authority of Section 206 of the Water Resources Development Act of 1992, Public Law , with the first periodic beach nourishment project. Section 206 allows a local sponsor, Manatee County in this case, to engineer and construct the beach nourishment project and then receive reimbursement for the Federal share of the project costs. In 2002, USACE reviewed the County's engineering products, issued a permit for the upcoming nourishment project and participated in project cost-sharing. Coastal protection within Manatee County is a large and complex program with many features and multiple funding sources. Manatee County relies heavily on their consultant to manage their coastal program. Manatee County has seen the benefits of creating well maintained beaches with scheduled nourishment. The Manatee County Natural Resources Department is of the opinion that the present shoreline management strategy is functioning well and they intend to maintain a similar program management strategy into the future. Bay County The Bay County Tourist Development Council (TDC), a semi-independent County department, maintains the recreational beaches of Panama City to support the local economy and provide storm protection. The beach management program is managed by one consultant, hired by the TDC who was formally an employee of the County. The TDC and County staff provide in house support to the consultant. The consultant and staff manage the beach nourishment projects, perform monitoring and beach cleaning programs, and provide design and permitting-related xv
17 services. In addition, the consultant is responsible for coordinating with stakeholders on behalf of the County. The Bay County coastline extends 17.5 miles along the Gulf of Mexico. The County includes two state parks, five inlets, a federally authorized shore protection project, and a Federal navigation project. The Panama City Beaches Federal Shore Protection Project was initially federally authorized under the Water Resources Development Act of The Bay County TDC, on behalf of the County, assumed control of the Federal project under Section 206 of the Water Resources Development Act of 1992, Public Law The Panama City Beaches Federal Shore Protection Project has been constructed twice (1999 and 2005) with three hurricane repairs (1995, 1999 and 2011). The strategy of the beach management program is to maintain active permits and have sufficient sand sources available to restore the beach at regular intervals and in response to emergencies. Project funding is obtained from the USACE, FEMA, the FDEP-BIP's and the Bay County TDC. In addition to the Panama City Beaches Shore Protection Project, the USACE funds the Federal navigation project in St. Andrews Inlet, including maintenance of the jetties. FEMA has funded emergency restoration projects. The local source of funding for beach nourishment projects is a 5% bed tax collected from a special taxing district within the county. Of the 5% tax, 3% is used for the promotion of Panama City Beaches, beach cleaning, maintenance and improvements. Funds from the tourist development tax have been enough to fund nourishment projects and generate reserves. Bay County would prefer to continue to receive funding from the USACE and the state. However, the TDC has built up reserves to be able to fund projects on its own, at a lower level of service. In an effort to prepare for future projects, the TDC submitted a ten-year multi-use joint coastal permit application in Collier County The Coastal Zone Management (CZM) Department, a department under the Public Services Division, manages the coastal programs for Collier County. With a staff of six employees, the Department s Staff Director administers contracts, conducts construction and maintenance inspections, and performs environmental monitoring. The staff also manages contracts with consultants hired for engineering, permitting, monitoring and construction services. The majority of the staff s time is spent on coastal management related issues. The Coastal Zone Management Department implements the County s objectives after coordination with several stakeholders. The Board of County Commissioners (BCC), a panel of five elected officials, is responsible for the legislation necessary for the CZM to provide services to Collier County. The BCC is advised by the Coastal Advisory Committee, a nine member appointed committee. The Committee advises the Commission on project priorities and funding availability. In addition, the CZM coordinates with the municipalities of the City of Naples and Marco Island. xvi
18 The Coastal Zone Management Department is responsible for preserving and protecting Collier County s coastal ecosystem while providing access and complementary facilities. The elements of the program include artificial reef management, beach maintenance, park facilities, channel marker maintenance, derelict vessel removal, estuary management and inlet management. The CZM maintains four of the six inlets within Collier County. The USACE maintains one of the other two inlets. Collier County does not yet have a Federal shore protection project but has been pursuing one over the past several years. Beach nourishment programs in Collier County are funded in part by tourist development taxes. The County levies a four percent (4%) tourist development tax on all rental income rented for less than 6 months (Ordinance ). Approximately two thirds of two percent (2%) is allocated to fund beach improvement, nourishment, restoration and inlet management. One third of two percent (2%) is allocated for beach park facilities. The remaining tax is allocated to tourism promotion and museums. Additionally, Collier County collects funds from parking permits, meter collections and parking tickets. The remaining funds required are sourced from property tax revenue or contributions by local municipalities. Collier County property tax revenue provides $500,000 per year for the county s beach fund, part of a $1 million annual contribution for parks and recreation services. Private beaches are funded by local municipalities. The Coastal Zone Management Department will continue to optimize inlet maintenance, sand bypassing and beach maintenance. Securing funding for future projects will continue to be a major issue for the County and they are taking various cost saving steps i.e. pursuing Federal funding and altering beach designs. SECTION 6: MANAGEMENT OPTIONS FOR PINELLAS COUNTY Three management options for Pinellas County were developed after reviewing the strategies employed by the communities described in Section 5. Option 1, Coordination & Cooperation, is similar to Pinellas County s existing coastal management program. The approach entails relying on external agencies and consultants to perform most technical services required to run the coastal management program with the exception of coordinating with stakeholders, administering and managing non-federal design and construction projects, and facilitating the local sponsorship necessary for state and federal projects. The advantage of the Coordination and Cooperation option is the limited work and funding required by the County. Disadvantages of this approach include its lack of control over the design and schedule of federal projects. The process of authorization and appropriation of funds can take multiple years and result in construction schedule delays. Option 2, Autonomous Management, relies on in house expertise for program management and coordinates with stakeholders to construct projects with federal and state reimbursements. The CMP administers contracts, coordinates with regulatory agencies to obtain permits and funding, conducts construction and maintenance xvii
19 inspections, and performs environmental monitoring. The CMP may or may not contract with consultants for engineering and additional construction services. The County may setup an advisory panel to direct the project priorities and manage funding resources. The advantage of the autonomous approach is the control over schedule. The disadvantage is the need to compete for federal reimbursement. Federal reimbursement is limited on reimbursable projects to $50 million annually (nationwide) with no project receiving more than $10 million in any given year. Reimbursement may occur over several appropriations (a portion of the requested funds are received with each appropriation). Option 3, Consultant Management, is similar to Bay County s existing coastal management program. The approach entails relying on consultants to perform all services required to run the coastal management program including coordinating with stakeholders and facilitating the local sponsorship necessary for state and federal projects. The hired consultants report directly to the BCC or a CMP advisory board. The advantage of hiring consultants to manage the program is the relief of the County s workload, the access to coastal experts and the continuity provided by allowing one expert source to coordinate projects and tasks. The disadvantage may be the consultant s fees and the dependence of the CMP on the consultant. SECTION 7: FINAL RECOMMENDATIONS CPE recommends that Pinellas County pursue a hybrid management strategy that incorporates coordination and cooperation with Federal and State agencies and the flexibility to transition to a more financially self-reliant program aided by consultants and in-house staff. This recommendation is based on the existing conditions at this time, including: The unpredictability of federal appropriations, The unknown outcome of reauthorizations for expired projects, The need for the flexibility to align construction schedules, conducting maintenance dredging and nourishment projects simultaneously, when possible, The opportunity to control project schedule under Section 206 of the Water Resources Development Act of The County needs to explore ways to be prepared to take over management and maintenance of any federal projects when federal funds are not available. Steps towards developing a new strategy include the following: The County should pursue obtaining approval and authority to construct federal projects without federal funding. Negotiating an in kind services agreement to begin planning and construction with County funds may be the first step. xviii
20 The County needs to develop a management mechanism to regularly maintain navigation channels that lack national priority and federal funding. The County should maintain their relationship with the USACE and pursue their federal authorized beach projects since having federally authorized projects increases the likelihood of obtaining state funding. The CMP should continue to manage the coast as a countywide program. The CMP should prioritize reducing sand needs over time and increasing the nourishment interval of each element. The County should rely on their consultants to assist them in hotspot management. The success of the structures at Upham Beach is an example of using advanced engineering and hotspot management to achieve these goals. The County should also prioritize emergency response planning by maintaining design and monitoring records to maintain eligibility for emergency funding. By addressing hot spots, maintaining funding eligibility, and planning for times when federal and state funds are not available, the CMP will evolve into a manageable and sustainable program. xix
21 CONTENTS Executive Summary... i SECTION 1: PINELLAS COUNTY COASTAL MANAGEMENT PROGRAM OPERATIONS History of the CMP Description of Internal Organizational Operation Funding Avenues Federal Funding Federal Authorization and Appropriations Federal Funding Eligibility Constraints of a Federally Funded Project Continuing Authorities Program Federal Emergency Funding FEMA Funding for Permanent Work FEMA Funding for Emergency Work State Funding State Funding Eligibility State Funding Requests Funding Amounts Funding Conditions Funding Source Local Funding Penny for Pinellas Tourist Development Tax Parking and Park Use Fees Municipal Contributions Ad Valorem Taxes Recent Operations Honeymoon Island Sand Key Treasure Island/Long Key Hurricane Pass South Channel, Pass-A-Grille Pass (Shell Key Pass) Recent Significant Storm Events xx
22 Stakeholders and Partners United States Army Corps of Engineers Florida Department of Environmental Protection, Beaches, Inlets and Parks Program FDEP Division of Recreation and Parks Tampa Bay Aquatic and Buffers Preserves Program Barrier Islands Government Council University of South Florida Clearwater Marine Aquarium Beach Stewardship Committees Board of County Commissioners Progress Energy Audubon Society Suncoast Seabird Sanctuary, Inc SECTION 2: Federal Authorizations Pinellas County Beach Erosion Control Project Mullet Key Federal Navigation Projects Section 107 River and Harbor Act of John s Pass North Channel, Pass-A-Grille Pass Clearwater Pass Gulf Intracoastal Waterway Recommendations for Management of Federal Projects SECTION 3: Summary Assessment of Historical and Existing Conditions for each Physical CMP Element Historical and Existing Conditions Anclote Key Three Rooker Bar Honeymoon Island Caladesi Island Dunedin Pass (now closed) Clearwater Beach Island Sand Key Funding Eligibility of Belleair Shore and Belleair Beach xxi
23 Existing Conditions Snapshot Summary for Sand Key Recommendations from Sand Key Stakeholders Treasure Island Existing Conditions Snapshot Summary for Treasure Island Long Key (Upham Beach and Pass-A-Grille Beach) Pass-A-Grille Beach Existing Conditions Snapshot Summary for Long Key Shell Key Bunces Key Mullet Key Hurricane Pass Clearwater Pass John s Pass Maintenance Dredging Scour John s Pass Inlet Management Plan Blind Pass Impact of 1993 Tampa Bay Oil Spill on Blind Pass Blind Pass Inlet Management Plan Environmental Resources North Channel, Pass-A-Grille Pass South Channel, Pass-A-Grille Pass (Shell Key Pass) Bunces Pass Summary of Known Borrow Areas Existing Borrow Areas USACE Sand Resource Survey CPE Constructability Analysis Study Area C Study Area D Study Area H Borrow Area Development Previously Used Borrow Areas Identification of Additional Potential Offshore Sand Resources xxii
24 Ebb-Tidal Shoals Shoreface Sands Sand Ridges West Central Florida Coastal Studies Project Recommendations Artificial Reef Program Mitigation Reefs SECTION 4: Needs Analysis and Schedule of Future Activities Program Management Project Planning Policy for Non-Public Beaches Emergency Response Monitoring Data Archive Funding Sources Overall Program Funding Needs Management of CMP Elements Anclote Key & Three Rooker Bar Honeymoon Island Caladesi Island Clearwater Beach Island Sand Key Treasure Island Long Key Shell Key Mullet Key Inlet Management Sediment Management Construction Environmental Resource Planning SECTION 5: Description of Other Communities Coastal Management Plans (3) Manatee County Structure and Responsibilities of the CMP Program Elements Environmental Resources xxiii
25 Inlet Management Borrow Areas Nourishment Interval Federal Projects Funding Local Funding State and Federal Funding Other Funding Upcoming Projects Structures Nourishment Public Opinion Future of the Program Bay County Structure and Responsibilities of the CMP Program Elements Environmental Resources Inlet Management Borrow Areas Nourishment Interval Federal Projects Funding State and Federal Funding Local Funding Recent and Upcoming Projects Public Opinion Future of the Program Collier County Structure and Responsibilities of the CMP Program Elements Environmental Resources Inlet Management Borrow Areas xxiv
26 Nourishment Interval Federal Projects Funding Local Funding State and Federal Funding Recent and Upcoming Projects Public Opinion Future of the Program SECTION 6: Management Options FOR PINELLAS COUNTY Option 1: Coordination & Cooperation Overview Project Planning Requirements Advantages and Disadvantages Option 2: Autonomous Management Overview Project Planning Requirements Advantages and Disadvantages Option 3: Consultant Management Overview Project Planning Requirements Advantages and Disadvantages SECTION 7: Final Recommendation SECTION 8: References xxv
27 List of Figures Figure 1-1 Impacts of Tropical Storm Debby on Sand Key (Wang, 2012) a) Belleair Beach (R-64), b) Indian Rocks Beach (R-84), c) North Redington Beach (R-107) Figure 1-2 Impacts of Tropical Storm Debby on Treasure Island (Wang 2012) a) Sunshine Beach (R-127) b) Sunset Beach (R-139) Figure 1-3 Impacts of Tropical Storm Debby on Long Key (Wang 2012) a) Upham Beach (LK-3) b) Pass-A-Grille Beach (R-164) Figure 1-4. Critically Eroded Beaches in Pinellas County. Critically eroded shoreline shown in red, noncritical shoreline shown in blue. (FDEP, 2012a) Figure 1-5. Pinellas County Aquatic Preserve (FDEP, 2010) Figure 1-6. Boca Ciega Bay Aquatic Preserve (FDEP, 2010) Figure Authorized Federal Project (USACE, 1966) Figure 2-2. Federally Authorized Study and Project Areas in Pinellas County (USACE, 2004) Figure 2-3. Federally Authorized Study and Project Area on Mullet Key (USACE, 2010) Figure 2-4. John s Pass Federal Navigation Channel (USACE, 2010) Figure 2-5. Pass-A-Grille Pass Federal Navigation Channel (USACE, 2010) Figure 2-6. Clearwater Pass Federal Navigation Channel (USACE, 2010) Figure 3-1. Anclote Key Spits (CPE, 2010) Figure 3-2. Three Rooker Bar (PCPA, 2011) Figure 3-3 Honeymoon Island (PCPA, 2011) Figure 3-4. Honeymoon Island (CPE, 2010) Figure 3-5 Caladesi Island Figure 3-6. Dunedin Pass (CPE, 2010) Figure 3-7. Dunedin Beach on Honeymoon Island (USGS, 1987) Figure 3-8. Clearwater Beach Island (PCPA, 2011) Figure 3-9. Pile and panel groins on Clearwater Beach in 1978 (USACE, 1980b) Figure Southern Terminal Groin at Clearwater Beach Island (PCPA, 2011) Figure Sand Key in 1978 (USACE, 1980b) Figure Sand Key Nourishment Project Area (Pinellas County Government Online, 2012) Figure Sediment transport on Sand Key (units of cubic meters of sand) Figure Dan s Island Hotspot (R60) Figure North Sand Key Figure 3-16a-g. Sand Key Beach Profiles (Roberts and Wang, 2012) Figure 3-17 Indian Shores Hotspots Figure Redington Breakwater Figure Treasure Island Figure Structures at North End of Treasure Island Figure Treasure Island in January Photograph (looking north) shows shoreline from R-129 (ebb shoal attachment point) to R-143 (Sunset Beach). Blind Pass is south of Treasure Island Figure Sunshine Beach Figure Accreting and Eroding Areas on Treasure Island (units of cubic meters of sand) Figure 3-24 Treasure Island Beach Profiles (Roberts and Wang, 2012) Figure Central Treasure Island Figure Sunset Beach, R Figure Long Key Figure North End of Long Key xxvi
28 Figure Upham Beach on Long Key in January 2012, facing north. Yellow shoreline structures are the temporary T-head groins installed in 2006 and repaired in 2010/2011. Blind Pass is the inlet north of Long Key (top of photograph). Treasure Island (Sunset Beach) is north of Blind Pass (top of photograph) Figure Upham Beach on Long Key in April 2012 (Google Earth, 2012b) Figure Sediment transport along Long Key (units of cubic meters of sand) Figure Long Key Beach Profiles (Roberts and Wang, 2012) Figure Central Long Key, R Figure Pass-A-Grille Beach (CPE, 2010) Figure Shell Key (CPE, 2010) Figure Evolution of Bunces Key Figure Mullet Key (PCPA, 2011) Figure Mullet Key Structures Figure Shore Parallel Borrow Area Offshore of Mullet Key (USACE, 1971) Figure Hurricane Pass Figure Clearwater Pass Figure Clearwater Pass in 1970, 1975 and 1980 (left to right) Figure Rubblemound Groins on North Side of Clearwater Pass (CPE, 2010) Figure John s Pass (PCPA, 2011) Figure Crescent Bar Migrating Towards Treasure Island in October 1969 (CPE, 1992) Figure John s Pass Figure Blind Pass (PCPA, 2011) Figure Blind Pass Aerials Figure Oiled Sediments on Long Key (Saint John, 2004) Figure Pass-a-Grille Pass Figure South Channel (Shell Key Pass) (CPE, 2011) Figure Bunces Pass (PCPA, 2011) Figure Map of current potential borrow areas Figure Potential sand resources identified offshore of Pinellas County Figure Artificial reef locations (modified from Craft and Kruempel, 2007) Figure 4-1. Pinellas County Coastal Management Program Planning Milestones (Program Management, Honeymoon Island, and Sand Key) Figure 4-2. Pinellas County Coastal Management Program Planning Milestones (Treasure Island and Long Key) Figure 4-3. Pinellas County Coastal Management Program Planning Milestones (Inlet Management) xxvii
29 List of Tables Table 1-1. State Funding Distribution from 2009 through Table 2-1. Federal Shore Protection & Navigation Project Authorizations, Pinellas County, Florida Table 2-2. Elements of Federal Shore Protection & Navigation Project Authorizations, Pinellas County, Florida Table 3-1. Coastal Management Projects on Clearwater Beach Island Table 3-2. Coastal Management Projects on Sand Key Table 3-3. Coastal Management Projects on Treasure Island (USACE, 1994; Pinellas County, 2010) Table 3-4. Coastal Management Projects on Long Key Table 3-5. Coastal Management Projects in John s Pass Table 3-6. Coastal Management Projects in Blind Pass Table 3-7. Coastal Management Projects in North Channel, Pass-A-Grille Pass Table 3-8. Summary of Known Borrow Areas Table 5-1. Summary of Coastal Management Programs xxviii
30 List of Appendices Appendix A Appendix B Appendix C Summary of Funding Needs for Pinellas County Beach Nourishment, Inlet Dredging and Shore Protection Projects in Pinellas County Comparisons of Historic Photographs of Pinellas County Coastal Elements xxix
31 SECTION 1: PINELLAS COUNTY COASTAL MANAGEMENT PROGRAM OPERATIONS History of the CMP Development of the barrier islands in Pinellas County began when the causeways connecting the islands to the main land were constructed in the early 1900s (Pinellas County Planning Department, 2008a). Resorts at Pass-A-Grille and St. Petersburg Beach (now St. Pete Beach) were among the first developments on the islands. In the 1930s, Pinellas County supported development by supplying water to the beaches and constructing several additional causeways (Pinellas County Planning Department, 2008a). The causeways significantly influenced the tidal prisms of adjacent inlets and altered erosion and accretion patterns along the beaches (CPE, 1992; ASBPA, 2009; Davis and Elko, 2006). From the period of initial development until the 1970s, response to shoreline erosion was managed by developers, private property owners and local municipalities. Small nourishments projects, groins and seawalls were constructed to slow erosion and protect property (USACE, 1980). By the 1960s, the shoreline had eroded to the seawalls along most of the developed beaches and the water quality of the back bays had suffered from dredge and fill land building practices. In response to civic activism, coastal and environmental management became a priority for the County in 1969 (Pinellas County Planning Department, 2008a). Pinellas County became the local sponsor for the County s first Federal shoreline protection project. The project called for nourishment of all of the developed beaches on Treasure Island, Sand Key, Clearwater Beach and Long Key (USACE, 1984b). In a separate effort, the County began their first environmental resource management program which included the prohibition of dredging in Boca Ciega Bay, the designation of the Boca Ciega Bay Aquatic Preserve, and the acquisition and protection of environmentally sensitive lands. To manage the acquisition of the public lands, the County s Department of Environmental Management (DEM) was created in The first beach park was the collaboration of the City of Clearwater and the DEM to purchase 66 acres on the north end of Sand Key in A citizen group, Save Sand Key, Inc., advocated the $6.3 million purchase after the US Steel Corporation began developing high rise condominiums on Sand Key (Pinellas County Planning Department, 2008a). Over time, the DEM, in collaboration with the Coastal Management Program (CMP), citizen advocacy groups and the Pinellas County Parks Department, created nine county beach access parks and the Shell Key Preserve (ASBPA, 2009). In the mid-1980s, Jim Terry, a surveyor and project manager for Public Works was the driving force in the development of the County s CMP (Squires, 2011). By 1984, Pinellas County had participated in seven Federal nourishment projects. In 1985, Terry was appointed Vice Chairman of the Governor s Restore Our Coast Task Force. By 1986, the task force proposed the first Comprehensive Beach Management Program for the State of Florida. To implement the program, beach management districts with similar geomorphic characteristics were proposed, 1-1
32 one of which was District Two: Pinellas County. Each district was to have an administrator appointed by the local board and a small staff. The districts were tasked with providing the local share of funds for erosion control projects, obtaining public access to beaches and providing parking at beach access points. Each district had the authorization to levy ad valorem taxes to fund the required local contribution (25% of beach project cost). Florida s Comprehensive Beach Management Program was adopted by the state legislature in 1986 (FDNR, 1986). Jim Terry became Pinellas County s first coastal manager, within the Public Works Department (Squires, 2011). In 2003, Nicole Elko, Ph.D. took over the role of coastal manager. In 2004, the CMP was reassigned from Public Works to the DEM. The CMP began a two-year transition period with Dr. Elko departing the County in 2009, a reorganization of County government that led to the dissolution of DEM in October 2010, a continuation of the CMP briefly within the Public Works Department in 2010, and the merger of Public Works into a large newly formed 840-employee Department of Environment & Infrastructure (DEI) in October During this transition period, the management of the CMP was handed over to Andy Squires, the former Assistant Director of DEM (Squires, 2011). The CMP continues to be responsible for coordinating the Federal, state and local shoreline protection projects, monitoring the beaches, and planning for the future of Pinellas County beaches. The County s CMP won the ASBPA s 2009 Coastal Project Award. The award recognized the County s shore protection project which restored 13 miles of its 35-mile shoreline via 29 restoration and nourishment projects over 40 years. The award presentation also noted the two beach parks, one preserve, nine public access parks, numerous public access points and more than 12,000 public parking spaces for beach access (Squires, 2011). Description of Internal Organizational Operation DEI has a staff of approximately 840 employees and consists of the following divisions: Administration & Business Support, Engineering & Technical Support, Finance, Solid Waste, Transportation & Stormwater, and Water & Sewer. Coastal Management resides within the Division of Engineering & Technical Support (Squires, 2011). The sole staff member of the CMP is the former Assistant Director of Environmental Management. Since 2009, the former Assistant Director has served as the Coastal Manager, responsible for coordinating shoreline protection projects, requesting funding, reviewing engineering reports and design, and participating in field observations. The CMP also depends on support and assistance from contracted consultants, section engineers in its division and other divisions within DEI. The CMP is considering adding an additional staff member in The CMP is a central clearinghouse for all beach related questions, information requests and public outreach (Squires, 2011). 1-2
33 Funding Avenues Federal Funding The Federal government has partially funded the construction of 25 shore protection projects including the construction of nourishments and structures within Pinellas County since 1969 and authorized even more studies of potential projects (USACE, 1984b; 1994; 2010). The Federal Shoreline Protection Project includes Sand Key, Treasure Island, Long Key and Clearwater Beach Island (ASBPA, 2009). The Federal government will fund up to 65% of the project cost (USACE, 1989). Project costs include pre-construction and construction costs associated with engineering, design and construction. Annual monitoring is not covered by the federal cost share. The Federal share of the Sand Key, Treasure Island and Long Key projects has varied from 50% to 62.4% since 1969 (USACE, 2010). The terms and expirations of the projects are discussed in Section 2, Review of Federal Authorizations. Maintenance dredging of Federal navigation channels is also partially funded by the Federal government and often coincides with nourishment projects. The Federal navigation channels are John s Pass, Pass-A-Grille Pass and Clearwater Pass. Anclote River and the Intracoastal Waterway are also federally authorized waterways in Pinellas County. The Federal cost share varies with each project (from 57% to 95%) (USACE, 2010). Federal Authorization and Appropriations Prior to requesting Federal funding, Congress must first authorize the study and evaluation of the potential Federal shoreline protection project. If Federal participation is warranted, Congress can then authorize the construction of the project and appropriate funds (USACE, 1989). The construction of projects can only be authorized during the years Congress enacts a Water Resource Development Act (WRDA). As a result, the process of authorization and appropriation of funds can take multiple years and result in construction schedule delays. The US Senate Environment and Public Works Committee (EPW) may consider a new WRDA bill soon. This bill may contain policy revisions to allow the Corps to assess Federal interest in continuing participation in expiring Federal shore protection projects. The WRDA policy change is critical for a new study to be initiated. In 2011, the American Shore & Beach Preservation Association initiated an effort, with Marlowe & Co. under contract, to help present and then move a new WRDA bill with the required policy change through the committee (Squires, 2011). This policy change could potentially affect the continuation of Federal support for Treasure Island (project funding authorization expires in 2019) and the time required for future evaluation studies, reviews, and approvals. Federal Funding Eligibility Policy dictates the primary purpose of a beach nourishment project recommended by the USACE must be hurricane and storm damage reduction (not recreation). In addition, the project area must be publicly owned and publicly accessible. The Federal cost share percentage may be less than 1-3
34 65% if any part of the project is not publicly owned or accessible. Private property is not eligible for Federal funding (USACE, 1989). Undeveloped barrier island segments are not eligible for Federal funding either, pursuant to the Coastal Barrier Resource Act, Public Law (96 Stat. 1653; 16 U.S.C. 3501). Constraints of a Federally Funded Project The existing Federal shore protection projects are administered by the Jacksonville District of the U.S. Army Corps of Engineers (USACE). The USACE is responsible for evaluating design alternatives and providing a recommendation to Congress. The USACE may consider requests by the local sponsor during the alternative evaluation; however, their recommended alternative will depend on a cost-benefit analysis. The local sponsor s influence over a Federal project design may or may not be limited as a result. Continuing Authorities Program The Continuing Authorities Program (CAP), pursuant to Section 206 of the Water Resources Development Act of 1996, allows the USACE to participate in projects without specific congressional authorization for each project. Under this authority, the studies and initial reports are conducted by the local sponsor and their consultants without waiting for Federal appropriations. The local sponsor is responsible for initial study and design costs; however, these costs may be eligible for Federal cost sharing and reimbursement later. Reimbursements are dependent on the successful negotiation and execution of a Federal Cost Sharing Agreement (FCSA) and a Project Cooperation Agreement (PCA) and the availability of congressional appropriations to fund the reimbursements. Pinellas County has not participated in the CAP. Manatee and Bay Counties have completed projects under the authority of the Continuing Authorities Program (further discussion in Section 5). In Pinellas County, the Jacksonville District USACE began an erosion control project in Whitcomb and Kreamer Bayous in Tarpon Springs under the authority of CAP in Federal Emergency Funding The USACE has authority to repair federally authorized shore protection projects under the Flood Control and Coastal Emergency Act (PL84-99). An eligible shore protection project can be restored to its pre-disaster condition at no cost to the Federal sponsor and at 20% cost to the non-federal sponsor. Funding is provided by Congress through the annual Energy and Water Development Appropriation Act. Pinellas County has received Federal emergency funding for Sand Key project (1990 and 1997) and the Treasure Island/ Long Key project (2006) (ASBPA, 2009). FEMA Funding for Permanent Work Federal funding is available to replace sand on non-federally sponsored storm damaged public engineered and maintained beaches under certain conditions, as part of Federal Emergency 1-4
35 Management Agency (FEMA) Program, under authority of the Robert T. Stafford Disaster Relief and Emergency Assistance Act, 42 U.S.C , as amended, Sections 403 and 406, and 44 CFR and A beach may be eligible if improved property is vulnerable to the damage caused by a five-year storm. The amount of sand eligible for replacement is limited to the amount of sand lost as a result of a storm event. The local sponsor is responsible for obtaining all permits (FEMA, 2009). FEMA Funding for Emergency Work Funding from FEMA for emergency work is available for the construction of temporary sand berms. The work must eliminate or lessen the immediate threats to the public or to improved property in expectation of an event that could occur within five years. A five-year event is expected to cause on average six cubic yards per linear foot of shoreline erosion. As a result, FEMA will fund the construction of berms with six cubic yards per linear foot of sand above the five-year stillwater elevation and any necessary base below the berm (FEMA, 2009). State Funding The Florida Department of Environmental Protection (FDEP) Beaches, Inlets and Parks Program (BIP's) (formerly the FDEP Bureau of Beaches and Coastal Systems, formerly the Department of Natural Resources, Division of Beaches and Shores) has maintained a comprehensive, long term, statewide management plan for erosion control and beach preservation since 1986, pursuant to Sections and , Florida Statutes (FDEP, 2011a). The State of Florida s Beach Management Funding Assistance Program provides funding for the management of critically eroded shorelines in Florida (pursuant to Chapter 62B-36, F.A.C.). In order for a project to receive state funding it must provide for adequate public access, protect natural resources and provide for the protection of endangered and threatened species (Chapter 161, F.S.). State Funding Eligibility The following public shorelines are eligible for up to 50% reimbursement of non-federal costs by FDEP-BIP's (Chapter 161, F.S.): (a) The shoreline of a primary public beach access site plus the shoreline one half mile in each shore parallel direction from the beach access site. A primary public beach access site is a site with at least 100 public parking spaces and public restrooms (62B F.A.C.). (b) The beachfront footage of a public lodging establishments times the percentage of units available to the public (rounded to the nearest 10%). (c) The shoreline of a secondary public beach access site plus the shoreline up to one quarter mile in each shore parallel direction from the access at a rate of 52.8 linear feet per parking space, if the parking space is within one quarter mile of the access site and there are signs and clear designation the parking is for the general public. A secondary public beach access is a site with parking and amenities that does not qualify as a primary public beach access (62B F.A.C.). 1-5
36 (d) The shorelines above cannot overlap for more credit. (e) The percentage of shoreline eligible for cost sharing is determined by dividing the sum of the eligible shoreline lengths by the total project length. Note: As of 2013, eligibility requirements were being updated and rewritten by the FDEP. State Funding Requests Annually, eligible local governments are requested to submit to the FDEP an updated Annual Funding Request and Local Long Range Budget Plan for projects expected to be initiated or continued in the current fiscal year (Note: the FDEP notifies the local government entities of the 60-day submittal period). The projects are reviewed and ranked for funding in the next fiscal year. The order of priority of the projects is based on the severity of erosion and threat, benefits, project history and Federal sponsorship (Chapter 62B-36, F.A.C.). Funding Amounts The Florida Legislature may authorize appropriations up to 75% of the costs associated with restoring and nourishing critically eroded beaches (Chapter 161, F.S.) or up to 100% of costs if the project is on state lands. However, it is the intent of the Legislature to cost-share the costs with the local sponsor equally. Thus, federally authorized and federally financed projects are eligible for cost sharing of up to 50% of the non-federal share of the cost. Costs eligible for state cost sharing include feasibility study and design costs, construction costs, environmental and performance monitoring costs required by permit, and approved costs associated with private contractual services necessary to conduct the project. Funding Conditions The conditions for receiving state funding are outlined in Chapter 161, F.S. Several conditions are listed below: The project engineer must be selected on the basis of competitive negotiation as provided in Chapter 287, F.S. The local sponsor must assume full responsibility for all project costs in excess of the state cost limitation. If the local government desires to initiate and pay the costs associated with a project prior to the state initiating construction, the state will reimburse the costs according to Section , F.S. if the project was approved by the FDEP-BIP's before construction, if funds are available and if it furthers the provisions of Section , F.S. The state s cost share cannot exceed 75% (except for projects on state lands) even if projects are combined to reduce the local cost-share. 1-6
37 The non-federal portion of a federally authorized project is not eligible for state cost sharing unless an immediate threat to upland properties and financial loss is demonstrated (Chapter 62B (8)). Funding Source Documentary stamp tax collections contribute to the General Revenue Fund which provides funding for the state s beach program. The Florida Department of Revenue distributes a maximum of $30 million of the taxes collected (or the 2.12% of the remainder after the required payment towards the Preservation 2000 bonds, the Florida Forever bonds and the Save Our Everglades Trust Fund) each fiscal year to the Ecosystem Management and Restoration Trust Fund for the preservation and repair of beaches (Section Florida Statutes). In recent years, documentary stamp tax receipts have declined from $4 billion at the peak in Fiscal Year to $1.16 billion in (EDR, 2011). As a result, funds available for the beach program are significantly less than $30 million. In Fiscal Year , only $5 million was contributed to the Ecosystem Management & Restoration Trust Fund (EDR, 2011). To obtain additional funding necessary for the state s priority projects, no longer available from the Ecosystem Management and Restoration Trust Fund, appropriations from the General Revenue Fund by the state legislature are requested for individual projects on an annual basis. The dependence on the legislative process for funding introduces a level of uncertainty to the project schedules. The level of state funding and its distribution is listed in Table 1-1 (Florida Senate, 2009; 2010; 2011). As an alternative to requesting appropriations from the legislature for individual projects, funding may be obtained from the Aid to Local Governments line item in the General Appropriations Bill. The Honeymoon Island State Park Restoration was funded in this way. The lack of funding available from documentary stamp tax collections prompted the FDEP-BIP's to encourage Pinellas County to sponsor the project and be eligible for funds through Aid to Local Governments. As previously stated, the State has the authority to fund up to 100% of a project on state owned lands. An agreement was reached between Pinellas County and FDEP-BIP's to cost share the project 75% (State funds) to 25% (County funds) for design and monitoring with the state covering 100% of construction. As a result of obtaining funding in this way, Pinellas County must front the full cost of the project and receive reimbursement upon completion. 1-7
38 Year Total Funds to State Beach Program Table 1-1. State Funding Distribution from 2009 through 2011 Portion Portion from from Trust General Funds (1) Revenue Fund 2009 $25,824,738 $20,021,678 $5,803, $20,836,398 $9,995,051 $10,841, $13,050,532 $5,045,216 $8,005,316 Fund Distribution Priority projects ready to proceed that maximize Federal funds leveraged Top 3 inlet management projects Post construction monitoring Alternate projects from 2007 and priority projects that maximized Federal funds leveraged Projects the state committed partial funding to in Fiscal Year Top 12 individual projects on the priority list Top 3 inlet management projects (10%) Post construction monitoring (10%) 1-8
39 Local Funding Penny for Pinellas Pinellas County has utilized percentages of sales tax to fund beach nourishment projects since the early 1990s. Voters first passed the Penny for Pinellas referendum, a 1% increase in sales tax, to fund the Capital Improvement Program (CIP) and avoid increases in property taxes. The Penny for Pinellas levy began in 1990; it lasted for ten years and has been extended twice since then. The existing Penny for Pinellas program expires January 31, 2020 (Pinellas County Government Online, 2011). Funds are earmarked for road improvements, flood control, parks, acquisition of endangered lands and public safety. The Penny generated $826 million from 1990 to 2000 and $1.26 billion from 2000 to During the 2000 to 2010 period, the funds were split between the County and the twenty four municipalities (distribution was formula based). Approximately 3.9% of the funds were designated to coastal management; however, fund transfers into the CIP from the Tourist Development tax cover the costs of capital coastal management projects as noted below. The projected funding estimate for the 2010 to 2020 period is $1.4 billion; the project list is modified when the funding is not available (Pinellas County Government Online, 2011). Tourist Development Tax A 5% sales tax is collected on accommodations rented for less than six months pursuant to Florida Statute The Pinellas Board of County Commissioners established the requirements and conditions of the tax in 1990 under Ordinance 90-50, Sections through One half of one percent of the tax is allocated to beach nourishment projects. The remaining portion of the tax is spent on marketing and operations (60%), debt service for sports facilities (23%), tax collection (2%), and held in reserves (6%) (St. Petersburg/Clearwater Area Convention & Visitors Bureau, 2011). Tourist Development Tax dollars are transferred into the County s CIP fund annually. Beach projects that qualify as CIP projects are thus paid for by Tourist Development Taxes collected. Parking and Park Use Fees Beach parking fees are an additional source of local funding approved by the Pinellas County Commission. At Fred Howard Park and Fort De Soto Park, a $5 parking fee was implemented January 3, The County will also sell annual park passes for $75 dollars (Pinellas County Government Online, 2011b). The entrance fee at Honeymoon Island State Park is $4 to $8 dollars. Note: Sand Key has had parking fees for decades. The City of Clearwater administered fee collection until October The County took over fee collection administration in October 2011 and changed the parking fee from $1.25 per hour to $1.50 per hour with a daily maximum of $5. 1-9
40 Municipal Contributions Since the implementation of the Federal shore protection program, the municipalities within Pinellas County have not been directly contributing to the cost of the beach nourishment projects. The City of Madeira Beach, the City of Clearwater, the City of Treasure Island and the City of St. Pete Beach have sponsored local nourishment and dredging projects in the past (USACE, 1984). Recently, the City of Treasure Island sponsored the design and permitting of a sand sharing contingency plan for Treasure Island (discussed in Section 3). Ad Valorem Taxes Ad valorem taxes are not used to fund the CMP (Pinellas County Tax Collector, 2011). Recent Operations Honeymoon Island The initial phase of the Honeymoon Island Restoration project was constructed in 2008 (FDEP Permit No JC). Phase I included the construction of a T-head groin and the placement of 140,000 cubic yards of sand dredged from the Hurricane Pass ebb shoal. The County is the local sponsor for the project (Humiston & Moore, 2011a). The second phase of the restoration of Honeymoon Island includes the construction of three additional T-head groins (at R-8, R-8.5, and R-9) with fill from the Hurricane Pass ebb shoal, vegetation removal, reconfiguration of the existing parking lot and removal of 50 feet of an existing submerged groin (near R-8.5). Fill will be placed from R-7.5 to R-9.5, extending the berm approximately 112 feet to 184 feet at an elevation of 4.2 feet NAVD (Humiston and Moore, 2011b). The borrow area for the fill is the Hurricane Pass ebb shoal. Construction of the estimated $5.63 million project is set to begin in 2013, if the permit is approved. Sand Key The construction of the Sand Key Federal Shore Protection began in April 2012 with the first sand placement in mid-may A 10-year Joint Coastal Permit to nourish the beach with approximately 1.25 million cubic yards of sand (8.7 miles) was issued in July The Norfolk Dredging Company was contracted to construct the $31.54 million project. The project was completed by November Treasure Island/Long Key The beaches at the ends of Treasure Island, Sunshine Beach and Sunset Beach, are erosional hotspots (Roberts and Wang, 2012). Nourishment of Treasure Island occurred in 2010 as part of the John s Pass maintenance dredging (FDEP Permit No JC, expiration date of March 29, 2020). The 2010 project also included the nourishment of Upham Beach on neighboring Long Key. The next nourishment of Treasure Island is scheduled for 2013/2014, 1-10
41 pending permit and funding acquisitions (Squires, 2012). If the project is delayed, a new joint coastal permit will be required. The existing permit was issued March 29, 2010 and expires May 17, 2014 (FDEP Permit No JM). Repair of the geotextile T-groins at Upham Beach commenced in November 2010 and was substantially complete in July The plans and specifications were developed by CPE and the work was conducted by Waterfront Property Services, LLC. The repair consisted of the removal and replacement of destroyed geotextile tubes (T-groins #1 and #2 and part of #3) and scour aprons, patching holes and tears in existing tubes (T-groins #4 and #5) and applying a UV protective polyurea coating to the new tubes and as needed on the existing tubes (CPE, 2011). The authorization of the maintenance phase of the geotextile T-head groins at Upham Beach expires on February 28, 2013 (FDEP Permit No JC). As a result of the positive performance of the groins, a joint coastal permit application was submitted to reconstruct the T-groins out of rock and make them permanent structures (FDEP Permit No JC). As part of the permitting process, numerical modeling was conducted to refine the design of the permanent structures. The permit was issued on October 30, Construction of the structures is anticipated to begin in 2013 pending funding acquisition (Squires, 2012). Hurricane Pass Hurricane Pass is a non-federal channel that was last dredged in 2000 (12,500 cubic yards) (FDEP, 2008). The County CIP budget has assigned $1 million for maintenance dredging, if needed. The Hurricane Pass ebb shoal is scheduled to be dredged as the sand source for the Phase II Honeymoon Island Restoration in Discussion of the project history of Hurricane Pass is presented in Section 3. South Channel, Pass-A-Grille Pass (Shell Key Pass) In March 2011, the County commissioned CPE to observe the coastal processes occurring in the vicinity of South Channel, Pass-A-Grille Pass (also referred to as Shell Key Pass). Local interests have reported infilling of the pass and have obtained a permit for maintenance dredging. CPE recommended surveys of the channel and shorelines, a review of historic aerial photography, monitoring of water quality, and predictive modeling to improve the understanding of processes in the area. 1-11

, Sunshine and Sunset Beach on Treasure Island (Figures 1-2a")
.")
42 Recent Significant Storm Events Tropical Storm Debby resulted in energetic wave conditions and elevated water levels of 2 to 3 feet along Pinellas County shorelines. The shoreline was impacted primarily on June 24-26, The 2012 Sand Key nourishment was under construction. The nourishment from R-57 to R-61 on Sand Key was partially complete. Beach and dune erosion occurred along most of Sand Key (Figures 1-1a through c), Sunshine and Sunset Beach on Treasure Island (Figures 1-2a and b), Upham Beach on Long Key (Figure 1-3a) the southern section of Pass-A-Grille Beach (Figure 1-3b). Shoreline retreat ranged from 15 to 30 feet on average (Wang and Roberts, 2012). a) b) c) Figure 1-1 Impacts of Tropical Storm Debby on Sand Key (Wang, 2012) a) Belleair Beach (R-64), b) Indian Rocks Beach (R-84), c) North Redington Beach (R-107). 1-12
.")
. St")


43 a) b) Figure 1-2 Impacts of Tropical Storm Debby on Treasure Island (Wang 2012) a) Sunshine Beach (R- 127) b) Sunset Beach (R-139). a) b) Figure 1-3 Impacts of Tropical Storm Debby on Long Key (Wang 2012) a) Upham Beach (LK-3) b) Pass-A-Grille Beach (R-164). Stakeholders and Partners United States Army Corps of Engineers The U.S. Army Corps of Engineers (USACE, Corps, COE) is the Federal sponsor for the Federal Shore Protection and Federal Navigation projects in Pinellas County. These projects have included the nourishment and construction of erosion control structures on Sand Key, Treasure Island and Long Key, in addition to the maintenance dredging of the Federal navigation channels in John s Pass, North Channel (Pass-A-Grille Pass) and Clearwater Pass. The USACE is also responsible for reviewing joint coastal permit applications for compliance with federal regulations. 1-13
44 Florida Department of Environmental Protection, Beaches, Inlets and Parks Program The Florida Department of Environmental Protection (FDEP), Beaches, Inlets, and Parks Program (BIP's) oversees three state programs under the authority of the Florida Beach and Shore Preservation Act (Chapter 161, F.S.) including two of the state s permitting programs. Additionally, FDEP-BIP's funds eligible projects through the Beach Erosion Control Program or Beach Management Funding Assistance Program. In areas where a Coastal Construction Control Line exists, the CCCL program enforces special siting and design criteria for upland property to prevent the destabilization or destruction of the beach and dune system. The Coastal Construction Control Line demarks the area of beach and dune system subject to severe fluctuation from a 100-year storm, seaward of which the BIP's has regulatory authority. Chapter 62B-33, F.A.C. provides the requirements for a CCCL permit (FDEP, 2011c). The Joint Coastal Permit program implements the concurrent processing of applications for coastal construction, environmental resource permits (navigational dredging of inlets and deepwater ports), wetland resource permits (dredge and fill) and sovereign submerged lands authorizations and coordinates interagency review (Section F.S., Chapter 253, F.S., Chapter 373, F.S.). The reviewing agencies include the Florida Fish and Wildlife Conservation Commission (FWC), the Florida Division of Historical Resources (DSHR) in the Department of State, other state agencies as incorporated in the Florida Coastal Zone Management Program and the USACE (FDEP, 2011c). A JCP is required for any activity that is seaward of the mean high water line, on the natural sandy beach, on sovereign submerged lands, or affects the distribution of sand along the beach. FDEP-BIP's typically reviews permit applications to assess the following: compatibility of the proposed fill and the native material, the potential impacts to benthic and upland habitats and the dune system, turbidity levels at the borrow and placement site, the potential impact of construction on nesting and hatching marine turtles, manatees, Gulf sturgeon and nesting and migrating shorebirds the potential water quality impacts if projects are within or near Aquatic Preserves or Outstanding Florida Waters. Permit conditions may include restrictions on construction schedule and methods, physical and environmental monitoring and mitigation requirements to offset any anticipated environmental impacts. Failure to obtain permits before performing work or failure to abide by permit conditions is a violation of state and federal law and may result in fines and requirements to restore the area. Violations are reported by various agencies actively monitoring environmental resources and projects. In 1986, the Florida Legislature adopted the policy of protecting and restoring beaches through a comprehensive management planning program, the Beach Erosion Control Program (BECP). 1-14
45 The Statewide Strategic Beach Management Plan (SBMP) (originated in 2000, updated in 2008), developed by the FDEP-BIP's, contains a multiyear repair and maintenance strategy to implement the state s strategies of comprehensive long term erosion control, beach preservation, restoration and nourishment, storm and hurricane protection and inlet management. The activities listed in the plan are referenced from inlet management plans adopted by the FDEP- BIP's, local government feasibility studies, federal and state studies and reports and studies of federal shore protection projects. All projects are required to obtain the appropriate federal and state permits and authorizations, must comply with local comprehensive plans and ordinances, must comply with state water quality standards and must protect threatened and endangered species as required by the Biological Opinions issued by the National Marine Fisheries Service (NMFS) and the United States Fish and Wildlife Service (USFWS). Segments of shoreline listed as critically eroded in the annually updated Critically Eroded Beaches in Florida report and activities listed in the SBMP are eligible for state funding (Pinellas County sections shown in Figure 1-4) (FDEP, 2012a). The project costs for activities referenced in the plan including feasibility and design studies, construction of structures and nourishments and post- construction monitoring are eligible for state funding in an amount up to 75% (refer to State Funding, Section 1). FDEP-BIP's is authorized to pay up to 100% of the costs associated with constructing and maintaining beach erosion control projects on state lands ( (10), F.S). The 10-year funding needs for SBMP activities are summarized in the current Long Range Budget Plan (LRBP), developed annually based on local government requests and information from the USACE District Offices. The SBMP and the LRBP are grouped by region. Project managers within the BECP are assigned to manage projects within each region. The LBRP and project manager for Pinellas County can be found on the FDEP-BIP's website ( 1-15

46 Figure 1-4. Critically Eroded Beaches in Pinellas County. Critically eroded shoreline shown in red, noncritical shoreline shown in blue. (FDEP, 2012a) 1-16
47 FDEP Division of Recreation and Parks The Florida Department of Environmental Protection Division of Recreation and Parks has sponsored the restoration of Honeymoon Island. They also own and operate Caledesi Island and Anclote Key State Parks within the County. As state-owned lands, these parks qualify for up to 100% state reimbursement of shore protection projects. At this time only Honeymoon Island receives funds for shore protection projects, Caladesi Island and Anclote Key currently exist as natural, un-engineered coastal systems. Tampa Bay Aquatic and Buffers Preserves Program The Tampa Bay Aquatic and Buffer Preserves Program (TBABP) is under the direction of the Office of Coastal and Aquatic Managed Areas (CAMA), which is under the administration of the Florida Department of Environmental Protection s Deputy Secretary for Land and Recreation Use. CAMA manages state-owned coastal and submerged lands to ensure their protection. The TBABP manages two preserves for the State of Florida within Pinellas County, the Pinellas County Preserve and the Boca Ciega Preserve (Figure 1-5 and Figure 1-6), under the authority of F.S. 258 and 253 and F.A.C and The aquatic and buffer preserves within Pinellas County include 336,265 acres of sovereign submerged lands, 182 natural and dredge spoil islands and the adjacent shoreline habitat. The TBABP also manages the Cockroach Bay Aquatic Preserve, the Terra Ceia Aquatic Preserve and their adjacent buffer preserves, all of which are outside of Pinellas County (FDEP, 2002). The uncertainty of ownership of the islands within the aquatic preserve has continued to be an issue. The state owned spoil islands, of which there are 33, are legally considered submerged lands despite being uplands since their source of material was the bay bottom. The state also owns 45 natural or mangrove islands within the preserve. Other government entities own 20 of the remaining islands in the preserve, another 34 are in private ownership, and five islands have dual ownership. Of the total 182 islands, 45 islands lack ownership information (FDEP, 2002). In 2002, the TBABP developed the Pinellas County Island Management Plan to address the need to assign appropriate management strategies to each island based on their location, biology and use in order to preserve, maintain and restore the natural ecosystems. The development of the plan required an extensive data collection effort including topographic, vegetation and biological surveys. The island management categories included (1) conservation, (2) education, (3) recreation and (4) combination (FDEP, 2002). Any person requesting use of state-owned land must have approval from the Board of Trustees of the Internal Improvement Trust Fund (the Governor and the Cabinet) (Section , F.S.). Management authority of the aquatic preserves has been delegated to the FDEP-BIP's, CAMA. FDEP-BIP's staff can comment on potential environmental impacts of projects within preserves through the permitting process (Chapter 403, F.S. and Chapters 17-3, 17-4 and 17-12, F.A.C.). Additionally, all aquatic preserve waters are classified as Outstanding Florida Waters which enhances the protective provisions of Chapter 258, F.S. (FDEP, 2002). 1-17

48 Prior to July 1, 2011, FDEP-BIP's provided support management services including coastal education and resource monitoring to Pinellas County. These services were discontinued as part of the state s 15% reduction mandate required by the 2011 legislative session. The support services may be reinitiated if funding is available. In 2012, the local office of the Tampa Bay Aquatic Preserves was re-opened. Permit review by the FDEP-BIP's regulatory staff continues. Figure 1-5. Pinellas County Aquatic Preserve (FDEP, 2010) 1-18

49 Figure 1-6. Boca Ciega Bay Aquatic Preserve (FDEP, 2010) 1-19
50 Barrier Islands Government Council The Barrier Islands Governmental Council, BIG-C, is a governmental council that exists to communicate the interests of the 11 Pinellas County Gulf-coast municipalities to the County, State and Federal government. The municipalities represented include Clearwater, Belleair Beach, Belleair Shore, Indian Rocks Beach, Indian Shores, Redington Shores, North Redington Beach, Redington Beach, Madeira Beach, Treasure Island, and St. Pete Beach. The Pinellas County CMP provides project status updates to the council and funds dune walkover and vegetation projects. Resolutions passed by the council related to beach management between 2003 and 2009 include: Resolution No : The council unanimously opposes offshore drilling in state controlled waters off the coastline of Florida. Resolution No : The council supports the Board of County Commissioners in extending the Penny for Pinellas program from 2010 to Resolution No : The council opposes amendments to existing state law that allocates $30 million annually in documentary stamp tax revenues to the Ecosystem Management and Restoration Trust Fund for beach construction and repair. University of South Florida The University of South Florida (USF) Department of Geology has agreements with the County to conduct physical monitoring of Pinellas County beaches. Funding for the work is sourced from the Tourist Development Tax through the County s Capital Improvement Program. The individual agreements include: Surveys of 116 beach profiles along Sand Key, every two months from January 2011 through December 31, The contract amount is not to exceed $141, Mapping of the high tide line, berm crest, vegetation line, and the seaward edge of the dune along Honeymoon Island, Caladesi Island, Clearwater Beach Island, Sand Key, Treasure Island and Long Key after storm events. The contract amount is not to exceed $46, and expires December 30, Surveys of 27 beach profiles within the Upham Beach T-groin project area monthly for a two-year period ending in March The contract amount is not to exceed $49, The survey analysis will report on the performance of the two repaired northernmost T-groins. Clearwater Marine Aquarium The Clearwater Marine Aquarium (CMA), under contract with the County, conducts daily sea turtle surveys along much of the Pinellas County coastline during the months of April through October. The survey is conducted along the barrier islands of St. Pete Beach (Upham and Pass- A-Grille beaches only), Treasure Island, Sand Key, and Clearwater Beach for a total of 29.5 miles of nesting beach front. In addition to data collection, the contract also includes nest 1-20
51 marking, nest relocation and data reporting to the FWC. The CMA must send a monthly summary report to the County on the 10 th of each month and an annual report on December 1 st. The estimated cost for monitoring over three years ( ) is $390,000 (Pinellas County Environmental Management, 2009). CMA will survey the St. Pete Beach shoreline between Upham and Pass-A-Grille beaches when required by an active state permit for beach nourishment or when not monitored by a private volunteer under a Florida Wildlife Conservation Commission sea turtle permit (Elko, 2007). Individuals with sea turtle permits are permitted to conduct nesting surveys, relocate nests, screen nests and conduct stranding/salvage activities for a specific area in adherence with FDEP- BIP's and USFWS guidelines. Four of the five marine turtle permits in Pinellas County are held by representatives of the CMA. Bruno Faulkenstein, a local sea turtle advocate, also holds a marine turtle permit. In addition, the CMA is under contract to provide two lighting surveys to the County per year (in May and late June). The survey must include a list of properties not in compliance with municipal lighting ordinances. The CMA staff has also worked with local municipalities, including the City of St. Pete to draft turtle lighting ordinances (Elko, 2007). Beach Stewardship Committees The Beach Stewardship Committees, one for Treasure Island and one for St. Pete Beach, hold quarterly meetings for interested citizens to discuss beach related issues. Meeting topics have included the Upham Beach project, the Treasure Island Sand Sharing program, and coastal processes impacting beach erosion. Board of County Commissioners The Board of County Commissioners has the authority, under the state constitution, to adopt local ordinances, approve the County budget, set millage rates, and establish the requirements for the certain departments. The Pinellas County Water and Navigation Control Authority was created by Special Act of the Legislature (Chapter 31182, Laws of Florida, 1955) in response to rampant dredge and fill activities in Pinellas County waterways, particularly in Boca Ciega Bay. The Board of County Commissioners (BCC) historically made up the members of the Authority. In 2006, the Special Act was abolished as part of the Pinellas County Charter review process and the functions of the Authority were wrapped into the County Charter. The BCC s responsibilities and powers remained the same; however, they now act as the BCC rather than the Pinellas County Water and Navigation Control Authority. Under the Water and Navigation code, the BCC has jurisdiction over all saltwater bodies in the County (including within municipalities) and a few freshwater lakes (lakes Seminole, Tarpon, Chatauqua, Salt, Leisure, Walsingham, and Taylor). Projects requiring Water and Navigation permits include: single family docks, multi-use private docks, commercial docks, boat lifts and tie poles, dredging, filling (wetland encroachments), and shoreline stabilization. Projects are reviewed for environmental impacts, navigational impacts, 1-21
52 construction requirements, as well as consistency with the Pinellas County Water and Navigation Code (Squires, 2011). Progress Energy Pinellas County works with Progress Energy and the local municipalities to reduce lights that are visible from the beach prior to turtle nesting season. Audubon Society Audubon volunteers monitor shorebirds and shorebird nesting. Additionally, they act as bird stewards, protecting nests and educating the public. Both the St. Petersburg Audubon Society and the Tampa Audubon Society are part of the Suncoast Shorebird Partnership (SSP) which coordinates data collection and shore protection with other groups and agencies (SSP, 2012). Shorebird data collected is submitted to the FWC shorebird database. None of the above organizations are under contract with the County. Suncoast Seabird Sanctuary, Inc. The Suncoast Seabird Sanctuary, Inc. is a wild bird rehabilitation center and sanctuary located in Indian Shores. The Sanctuary treats an average of 8,000 birds annually and host 600 wild birds on the premises (SSSI, 2012). 1-22
53 SECTION 2: FEDERAL AUTHORIZATIONS Pinellas County Beach Erosion Control Project The USACE coordinated with the BCC under the provisions of the 1930 River and Harbor Act to conduct the first beach erosion control study for Pinellas County (including the shoreline from Dunedin Pass to North Channel, Pass-A-Grille Pass) (Figure 2-1). The study was completed in 1953 (USACE, 1953). The first Federal project authorized for construction was in 1954 which required the local interests to complete one island segment (or the whole project) within 10 years of authorization (USACE, 1966). The design included the placement of 1,319,000 cubic yards of fill to build a 60-foot wide berm on Sand Key, Long Key and Treasure Island and the construction of groins at the end of Clearwater Beach Island. All of the first costs for Sand Key and one-third of the costs for the other public beaches were eligible for funding. Due to lack of progress, the project was declared inactive in 1961 and expired in 1964 (USACE, 1994). The first Federal beach erosion control project that was actually constructed was authorized in 1966, under the Rivers and Harbors Act of 1966, Public Law (Table 2-1). The Pinellas County Shore Protection Project included the construction of a 40-foot wide, 6-foot high berm (from mean low water) on Sand Key (9.3 miles, first constructed in 1988, emergency fill placed in 1969), Treasure Island (1.7 miles, first constructed in 1969), Long Key (1.1 miles, first constructed in 1980), and Clearwater Beach Island (1 mile, first constructed in 1982) (USACE, 1980) (Table 2-2, Figure 2-2). Honeymoon Island, Caladesi Island and Mullet Key were excluded from the project. A Mullet Key erosion control project was federally authorized separately in 1966 (see following section). The Pinellas County Federal project had a cost-benefit ratio of 1.6 over the entire area. The Federal share of the first project cost ($299,000) was only 5.9% for Clearwater Beach Island, 1.9% for Sand Key, 5.7% for Treasure Island, and 50% for Long Key (USACE, 1980). Federal participation was recommended for the project presented in House Document 519/89/2 in 1966; however, several addendums modified the project over time. General and Detail Design Memoranda were released for the Treasure Island Beach Restoration in 1968, 1969 (authorized design), and 1975 (Addendum I, third nourishment). In 1978, a General and Detail Design Memorandum Addendum pertaining to Long Key was released which included a 25-foot berm at elevation +6 feet (from mean low water), a modification from the original design (constructed in 1980) (USACE, 1984b). In 1980, a letter report from the USACE was released recommending the extension of Federal participation in the continued nourishment of Treasure Island through project year 15. General and Detail Design Memorandum Addendum III was released in 1982 to include the design of southern Treasure Island and the rehabilitation of the Pass-A-Grille groin on Long Key in the project (USACE, 1980). 2-1

54 Figure Authorized Federal Project (USACE, 1966) 2-2

55 Figure 2-2. Federally Authorized Study and Project Areas in Pinellas County (USACE, 2004) 2-3
56 The project was re-evaluated in 1984 and modified to be in compliance with the March 4, 1976 resolutions adopted by the Committee on Public Works of the United States Senate and the September 23, 1976 resolutions adopted by the Committee on Public Works and Transportation of the House of Representatives (Dial Cordy and Associates Inc., 2002). The Water Resources Development Act of 1986 reauthorized the construction of the Pinellas County beach erosion control project as presented in the Board of Engineers for Rivers and Harbors report (April 23, 1985) with a first Federal cost share of $32,700,000. The authorization for the Treasure Island segment of the project (which had expired) was extended to include periodic nourishment for 50 years of project life (from date of initial construction in 1969). In April 1994, a Limited Reevaluation Report to the Beach Erosion Control Project Review Study was drafted to summarize the results of the Federal project. The cost benefit ratios presented in the Limited Reevaluation Report were 1.2, 9.8, 7.6 and 1.8 for Clearwater Beach Island, Sand Key, Treasure Island and Long Key, respectively. Benefits were based on annual recreation, downdrift effects, and storm damage prevention (USACE, 1994). Following the study, a design memorandum and environmental assessment was issued in November 1996, revised March 1997 (Dial Cordy and Associates Inc., 2002). A Project Cooperation Agreement was executed in April 1995 for an extension of the construction of the Pinellas County Shore Protection Project (authorized under Water Resources Development Act, Section 501 (b), Public Law ). The design of the project is consistent with the original (approved by USACE on November 4, 1994). The extension authorizes periodic nourishment of Sand Key (14.2 miles) until December 2043, Treasure Island (3.5 miles) until December 2019, and Long Key (4.1 miles) until December 2030 (Figure 2-2). The total projected cost in the agreement was $143,362,000. The overall project Federal and non- Federal shares were 59.3% and 40.7%, respectively. The cost share breakdown of the Sand Key nourishment was 62.8% Federal and 37.2% Non-Federal (USACE, 1997). The cost share breakdown of the Treasure Island nourishment was 58% Federal and 42% Non-Federal (USACE, 2000). The cost share breakdown of the Long Key nourishment was 60.8% Federal and 39.3% Non-Federal (USACE, 1994). The Federal cost sharing applies to costs associated with planning and engineering costs after October 1, 1985, engineering and design (advanced, preconstruction and construction), hazardous substance investigations, historic preservation activities, construction, alteration of railroad bridges, supervision and administration costs, project coordination team, contract dispute settlements, value of lands, easements, rights of way and suitable borrow and dredged or excavated material disposal areas. Costs for repairs or replacement are not included in the agreement. The local sponsor is responsible for maintaining public ownership and access of beaches. Bidding of a project will not begin until the local sponsor has provided its share of the cost. If additional funds are required from the local sponsor, the local sponsor has 60 days to provide the funds after notice is given (Project Cooperation Agreement, 1995). 2-4
57 Mullet Key Prior to federal authorization of the Mullet Key project, the Pinellas County Park Department dredged 516,769 cubic yards of material from Mullet Key Bayou (USACE, 1971). The County placed 138,000 cubic yards of the material along the gulfside recreational beach area between June and November 1964 (northern 1,400 feet of the key was not nourished) (USACE, 1967; 1971). The initial placement raised the berm from an elevation of 2-4 feet to 5-6 feet. The remaining fill was used to fill low lying areas around Fort De Soto and the Bayway (USACE, 1967). Between November 1963 and August 1964, the County constructed the southern L-groin (420 feet long) and the southwest revetment (1,150 feet long) at a cost of $275,565 (USACE, 1967; 1971). In 1966, the Mullet Key Beach Erosion Control Project was federally authorized (USACE, 1980). The project consisted of the construction of 6,750 feet of beach, 60 feet wide (already partially constructed by the County, another 145,000 cubic yards was recommended by 1966 study, total of 213,000 cubic yards was authorized in 1966), an anchor groin at the south end (already constructed by County), a revetment along southwest edge (already constructed by County), a deferred groin at the north end if needed and justified (never constructed), periodic nourishment for 10 years and reimbursement for parts of the project completed after the study was initiated but prior to authorization (USACE, 1967; 1971; 1980). The 1971 federal study concluded the beach restoration was only partially complete and an additional 325,000 cubic yards would be needed to fill the project area (USACE, 1971). As a result of severe erosion along the central part of the key and accretion at the north and south ends, the initial federal fill area only extended approximately 6,000 feet in the center of the key (USACE, 1971). The initial federal fill placement occurred in 1973 (Figure 2-3) (USACE, 1980). In May 1977, approximately 750,000 cubic yards was placed along the gulf shore of Mullet Key (Figure 2-3) (USACE, 1980). The material was sourced from the Tampa Bay Harbor dredging project. In June 1977, approximately the south shore was nourished with 350,000 cubic yards of material from the same dredging project. The south shore project was not part of the federal project (USACE, 1980). The Mullet Key Federal shore protection project was reportedly deauthorized in 1990 as a result of a lack of funding obligations (USACE, 2010; USACE, 2009; FDEP, 2008). In response to erosion on the island, Pinellas County partnered with the USACE on a beneficial use of dredged material project at Fort De Soto Park in Dredge spoils from Tampa Bay were placed on Fort De Soto Park and Egmont Key. Between 100,000 and 350,000 cubic yards were placed by Bean Stuyvesent and Wilkinson & Jenkins (exact volumes listed in references were conflicting) (Squires, 2011; Pinellas County, 2010; FDEP, 2008). 2-5


58 Figure 2-3. Federally Authorized Study and Project Area on Mullet Key (USACE, 2010) 2-6
59 Federal Project Location Legislation Table 2-1. Federal Shore Protection & Navigation Project Authorizations, Pinellas County, Florida Initial Constr. Completed Expiration Pinellas County, Florida, Shore Protection Clearwater Beach to Pass-A-Grille Rivers and Harbors Act of 1954, Public Law, September 3, 1954 Not constructed Expired Pinellas County, Florida, Shore Protection Clearwater Beach to Pass-A-Grille Rivers and Harbors Act of 1966, Section 101, Public Law H. Doc. 519/89/2 November 7, 1966 July Water Resources Development Act of 1976, Section 156, Public Law * October 22, 1976 (Sand Key) (* This changed the project life from 10 to 15 years, CESAJ, 1984a) Pinellas County, Florida, Shore Protection Clearwater Beach to Pass-A-Grille Water Resources Development Act of 1986, Section 501(b), Public Law H. Doc. 519/89/2 November 17, 1986 December July 1969 April Sand Key 12/31/2043 Treasure Is. 12/31/2019 Long Key 12/31/2030 Mullet Key, Florida Beach Erosion Control Mullet Key (Fort DeSoto) Rivers and Harbors Act of 1965, Public Law H. Doc. 516/89/2 November 7, 1966 March 1973 January 1, 1990 John s Pass John s Pass Rivers and Harbors Act of 1960, Public Law, N/A- July 14, 1960 River and Harbors Act 1966, Public Law November 7, 1966 May N/A- Pass-A-Grille Pass Pass-A-Grille Pass Rivers and Harbors Act of 1960, Public Law, N/A- July 14, N/A- Clearwater Pass Clearwater Pass Rivers and Harbors Act of 1960, Public Law, H. Doc. 293/86/2 July 14, N/A- Intracoastal Waterway Intracoastal Waterway Rivers and Harbors Act of 1945, Public Law, H. Doc. 371/76/1 March 2, 1945 Caloosahatchee River to Lee to Pinellas County, FL Rivers and Harbors Act of 1948, Public Law, N/A- June 30, 1948 Anclote River Rivers and Harbors Act of 1950, Public Law, N/A- May 17, 1950 Rivers and Harbors Act of 1954, Public Law, N/A- September 3, 1954 H. Doc. 109/85/1 May 10-16, N/A- March 1, N/A- -N/A- March 1, 1963 (Pinellas County, 2010; USACE, 1984a; 1995; 2010) 2-7
60 Table 2-2. Elements of Federal Shore Protection & Navigation Project Authorizations, Pinellas County, Florida Federal Project Originally Authorized Design Elements Modifications Constructed Federal Cost Share Pinellas County, Florida, Shore Protection 60-foot berm width Groins at Clearwater Beach Island 100% Sand Key % all other public beach First Project Costs: Pinellas County, Florida, Shore Protection Sand Key: 9.3 miles 40-foot berm width, 600-foot revetment on Long Key TI project extended 2,000 feet north, 1971 Sand Key: 1.9% Treasure Island: 1.7 miles 6-foot berm height Two groins adjacent to Blind Pass, Treasure Island: 5.7% Long Key: 1.1 miles North Groin at Blind Pass extended, 1983 Long Key: 50% Clearwater Beach Island: 1 mile Rehabilitation of Pass-A-Grille Groin, 1984 Clearwater Beach Island: 5.9% Pinellas County, Florida, Shore Protection Sand Key: 14.2 miles South Groin at Blind Pass extended, 1986 Sand Key: 62.8% Treasure Island: 3.5 miles 40-foot berm width, Redington Shores Breakwater, 1986 Treasure Island: 58% Long Key: 4.1 miles 6-foot berm height Rehabilitation of North Groin at John s Pass, 1987 Long Key: 60.8% Clearwater Beach Island: 1 mile Extension of Sand Key project, 1988, 1991, 1992 Mullet Key, Florida Beach Erosion Control 6,750 feet shoreline 60-foot berm width Anchor groin at south end (420 feet) 70% of first cost Groin at north end Revetment along southwest end (1,150 feet) John s Pass 2.2 mile channel 10 feet x 150 feet across bar 700-foot revetment on south side % 8 feet x 100 feet in pass of John s Pass 6 feet x 100 feet in IWW Pass-A-Grille Pass 2.9 mile channel 10 feet x 150 feet across bar 57% 8 feet x 100 feet in IWW 10 feet x 150 feet from GOM through pass; Clearwater Pass 3 mile channel 8 feet x 100 feet IWW 86.6% 8 feet x feet, turning basin Intracoastal Waterway Caloosahatchee River to Anclote River 9 feet x 100 feet 6 feet x 80 feet (USACE, 1980; 1984; 1994; 1995; 2010) 2-8
61 Federal Navigation Projects The Federal navigation projects in Pinellas County include the North Channel (Pass-A-Grille Pass), St. Petersburg Harbor, John s Pass, Clearwater Pass, Ozona Channel, Anclote River, and the Intracoastal Waterway from the Caloosahatchee River to the Anclote River. The following sections summarize the authorizations for the inlet navigation projects pertinent to the CMP. Section 107 River and Harbor Act of 1960 The Federal navigation projects in Pinellas County were authorized under the authority of Section 107 the River and Harbor Act of Under this authority, the USACE adopts small navigation projects that are feasible to construct and economically justified after a detailed investigation. Projects may include construction of entrance channels with structural protection, major channels and turning basins. Each project is limited to a maximum Federal expenditure of $4 million including costs for feasibility studies, planning, engineering, construction, administration and supervision. The national program limit is $35 million annually. The non-federal cost-share of a feasibility study under $100,000 is 0%. Costs in excess of $100,000 are split equally between the non-federal and Federal sponsors. Cost sharing of the construction costs is dependent on channel depth. If the depth of the channel is less than 20 feet below mean low water, the non-federal share is 10%. For channel depths between 21 and 45 feet, the non-federal share is 25%. If channel depths exceed 45 feet, the non-federal share is 50%. Post-construction, the non-federal sponsor must pay an additional 10% of the navigation project costs, which may be financed for thirty years with interest. The value of the easements, lands, rights-of-way relocations and disposal areas may be credited towards the 10% payment. The local sponsor is responsible for providing and maintaining basic marina facilities and public access to shore facilities. Construction and maintenance of these facilities cannot be paid by the Federal sponsor. John s Pass The John s Pass Federal navigation project was constructed under the authority of Section 107 of the River and Harbor Act of 1960 (USACE, 1970). The original 1,800-foot cut was authorized to begin 1,000 feet offshore and extend seaward. No dredging in the channel inside the pass was needed. The dredge spoils were placed offshore south of the pass in The navigation project was modified under the authorization of Public Law (89 th Congress, 2d Session) to include a 700-foot rubblestone revetment to protect the pass from eroding material approaching from the south. Public Law stated the non-federal cost share of the revetment was to be 40%. Construction of the revetment was completed in May The total cost of the initial project was $1,120,605 with a 95.2% Federal share and 4.8% non-federal share (USACE, 2010). The authorized channel in 1965, modified from the original, was 10 feet deep with a bottom width of 150 feet from the Gulf of Mexico to State Road 699 Bridge, 8 feet deep with a 100-foot bottom width from State Road 699 Bridge north to Mile 0.92 and 6 feet deep with a 100 feet bottom width from Mile 0.92 north to the intersection with the Gulf Intracoastal Waterway 2-9
, 1981 (80,000 cubic yards), 1983 (80,000 cubic yards), 1991 (56,000), 2000")
62 (authorized under the River and Harbor Act of 1965, House Document Number 214, 89 th Congress, First Session) (Figure 2-4). Since the original dredging of John s Pass in 1966, the pass has been dredged 6 times during 1979 (77,650 cubic yards), 1981 (80,000 cubic yards), 1983 (80,000 cubic yards), 1991 (56,000), 2000 (390,000 cubic yards) and 2010 (275,000 cubic yards) (ASBPA, 2009). Additional management history of John s Pass, including structural stabilization of the inlet, is discussed in Section 3, John s Pass. Figure 2-4. John s Pass Federal Navigation Channel (USACE, 2010) North Channel, Pass-A-Grille Pass Improvement of the north entrance channel of Pass-A-Grille Pass was authorized in 1964 under the terms set by the 1960 River and Harbor Act. Dredging was first completed in 1966 (USACE, 1980b). The total cost of the initial project was $96,188. The project was cost shared using Federal (57%) and non-federal (43%) funds (USACE, 2010). The authorized channel is 10 feet deep by 150 feet wide at the seaward end and 8 feet by 100 feet at the Intracoastal Waterway boundary (Figure 2-5). Maintenance dredging has not been required to maintain a navigable channel (FDEP, 2008). However, North Channel, Pass-A-Grille Pass was dredged in conjunction with the Federal Shore Protection project to provide sand for Treasure 2-10

63 Island in 1986 (73,000 cubic yards) and 2004 (95,000) (USACE, 2010; ASBPA, 2009). Additional management history of North Channel, including structural stabilization of the inlet by local government, is discussed in Section 3, North Channel. Clearwater Pass Figure 2-5. Pass-A-Grille Pass Federal Navigation Channel (USACE, 2010) The Clearwater Pass Federal Navigation project was first authorized under the River and Harbor Act of 1960 (House Document 293, 86 th Congress, Second Session). The construction of the navigation channel was completed in 1961 (USACE, 2010). Dredge spoils were dumped offshore and in the harbor (FDEP, 2008). The total cost of the initial project was $319,678. The project was cost shared using Federal (86.6%) and non-federal (13.4%) funds (USACE, 2010). The authorized channel is 10 feet deep by 150 feet wide at the entrance and transitions to 8 feet deep by 100 feet wide inside the pass (Figure 2-6) (USACE, 1986; 2010). The authorized project includes a turning basin (8 feet deep, 100 to 450 feet wide and 850 feet long). Maintenance dredging occurred in 1973, 1977 and 1981 through 1984 (FDEP, 2008). The dredged material was placed on Sand Key. Additional dredging and structural stabilization history is discussed in Section 3. The federal maintenance dredging of the channel has not occurred since 1985 (FDEP, 2008). In August and September 2012, the City of Clearwater paid the USACE approximately $500,000 to dredge 30,000 cubic yards from the pass and part of Clearwater Harbor. Dredge spoils were disposed of offshore of Clearwater Beach (Goff, 2012). 2-11

64 Figure 2-6. Clearwater Pass Federal Navigation Channel (USACE, 2010) 2-12
65 Gulf Intracoastal Waterway The Gulf Intracoastal Waterway, extending from the Caloosahatchee River to the Anclote River, was first federally authorized in 1945 (House Document 371/76/1). The channel was 100 feet wide and 9 feet deep. In 1963, the channel in Boca Ciega Bay was added (6 feet deep by 80 feet wide). Pertinent Authorizations: Section 145 of the Water Resources Development Act of 1976 authorizes the placement of beach quality sand obtained from dredging operations on adjacent beaches if requested by the interested state government and in public interest. Section 933 of Water Resources Development Act of 1986 allows 50/50 cost sharing of cost increase resulting from placing dredge spoils. This dredging authority applied to material being dredged from channels for navigation purposes not for beach placement. Section 207 of Water Resources Development Act of 1992 allows political subdivisions of the state to place dredge spoils at a 65/35 (Federal/non-Federal) cost share. Section 206 of the Water Resources Development Act of 1996, Beneficial Use of Dredged Material allows Federal interest in a disposal option that is not the least cost option if cost difference is reasonable in relation to environmental benefits. The cost share is 75/25 (Federal/ non-federal) of the costs in excess of the disposal costs. Recommendations for Management of Federal Projects To maintain the Federal authorizations for the existing projects, the County should: Continue to pursue the reauthorization of funding for the Treasure Island Federal project whose authorization expires in o Pursue Federal funding for 50% of the cost of Investigations by the USACE necessary for the reauthorization of the project. o The County received a FDEP-BIP's grant of $80,000 (FDEP Grant 12PI3) that expires October 31, Matching federal and county funds of $160,000 and $80,000, respectively would be needed for $320,000 of work on USACE investigations. o Once the funding is available, the County should request the USACE begin Investigations for the reauthorization of funding for the Treasure Island project. 2-13
66 o Assuming the Investigations conclude the project is eligible for 50 more years of Federal funding, the County will be eligible to request Federal funding until o If the Investigations or recommendation of the USACE does not result in the reauthorization of Federal funding for the project. The County may pursue Federal funding by requesting direct sponsorship of the project from the USACE, obtaining Federal authorization for a new project on Treasure Island, or using Congressional Adds to get Federal authorizations and appropriations. The Federal authorizations could be modified in the following ways to better serve the needs of the Pinellas County CMP. Merge multiple project segments into one project for the entire county to avoid the independent schedule of the authorizations. The authorization would need to be included in a Water Resources Development Act bill. Merging the segments may take several years to complete. The current PCA does not clearly allow for in-kind services (PCA, 1995). Therefore, an official in-kind services agreement should be developed, allowing Pinellas County to contribute engineering, planning and management services rather than funds towards cost of the project, so Pinellas County can control some aspects of the Federal projects. This is an important item to have in place prior to any potential future changes in USACE project management, USACE project prioritization, and Congressional support. If the Federal authorizations cannot be reauthorized or modified to address the County s needs, or if future Federal funding for the County s projects becomes difficult to obtain, the County needs to prepare to take control of the shore protection project. Management responsibilities would include maintaining a design beach, identifying beach-compatible sand sources, addressing remaining hotspots to reduce erosion rates, developing new funding mechanisms and administrating contracts. 2-14

67 SECTION 3: SUMMARY ASSESSMENT OF HISTORICAL AND EXISTING CONDITIONS FOR EACH PHYSICAL CMP ELEMENT Historical and Existing Conditions The historical and existing conditions of CMP elements are presented in the following sections. The barrier island and beach elements are presented first, followed by the inlet elements. The elements are presented in order of their location from north to south. The barrier island and beach elements include Anclote Key, Three Rooker Bar, Honeymoon Island, Caladesi Island, Clearwater Beach Island, Sand Key, Treasure Island, Long Key, Shell Key, Bunces Key and Mullet Key. The inlet elements include Hurricane Pass, Clearwater Pass, John s Pass, Blind Pass, North Channel (Pass-A-Grille Pass), South Channel (Shell Key Pass) and Bunces Pass. Following the discussion of inlet elements is a discussion of the known sediment borrow areas. Anclote Key Anclote Key is a wave dominated barrier island approximately 3.5 miles offshore of the Pinellas/Pasco County line (Figure 3-1a and 3-1b). The pristine 4-mile island is subdivided into the Anclote Key State Preserve and the Anclote National Wildlife Refuge. The state park includes Anclote Key, the north and south sand bars and Three Rooker Bar. The area is habitat for 43 species of birds including the American Oystercatchers, bald eagles, and piping plovers (Florida Division of Recreation and Parks, 2011). The southern end of Anclote Key is under the jurisdiction of the Pinellas County Board of County Commissioners (Loeb, 1994). The park is only accessible by private boat or ferry. Figure 3-1. Anclote Key Spits (CPE, 2010) a) Northern Spit b) Southern spit on Anclote Key Major morphological changes have occurred on Anclote Key over the past few decades (Davis Fitzgerald, 2004; Hine et al., 1987). Despite being located in a sediment starved region, Anclote Key has gained land area. An analysis of aerial photographs from the 1950s and 1960s led to the conclusion that the loss of seagrass beds adjacent to the Key (extending to a depth of 10 feet or more) destabilized a large amount of sand that was later driven to shore by waves and 3-1
68 transported alongshore to the north spit (Davis and Fitzgerald, 2004). As a result of the loss of the seagrass beds, the spit at the north end of the island has grown by more than a half mile since the 1960s (Figure 3-1a). The terminus of the north spit is driven by the location of the tidal channel. The southern end of the island accreted from the 1880s to the 1960s due to the landward migration and attachment of swash bars (Figure 3-1b) (Davis and Fitzgerald, 2004). As of June 2012, Anclote Key has been designated as non-critically eroded (FDEP, 2012a). Three Rooker Bar Three Rooker Bar is part of the Anclote Key State Park (Figure 3-2). The island has formed over the past 25 years (Elko, 2003). The sand supply may have come from the release of sand that occurred after a substantial loss of seagrass beds in the area (Evans et al., 1987). The rapid establishment of upland vegetation has helped stabilize the island. Vegetation was continuous along the spine of the semi-circle island in 1995 (Google Earth, 2012). Overwash during storms caused shoreline recession in the center of the island and loss of vegetation (1998). By 2005, the island had breached near the north end. As the breach widened, the north end of the island eroded to the vegetation line. By 2010, the center of the island was submerged at low tide. Honeymoon Island Figure 3-2. Three Rooker Bar (PCPA, 2011) Honeymoon Island is a 3.6-mile long wave dominated barrier island bordered by Hurricane Pass to the south (Figure 3-43 and 3-4). Honeymoon Island was originally the north end of Hog Island, which breached during the 1921 Hurricane that formed Hurricane Pass (Pinellas County Government Online, 2008a). Prior to World War II, the island was a popular and well-advertised honeymoon location. In 1965, the causeway to the island was constructed (see Dunedin Pass and Hurricane Pass for effects of causeway on tidal prism). In 1969, developers dredged over one million cubic yards of sand and rock directly offshore of the island and placed it along the midsection of the island (FDEP, 1999; 2008). The southern half of the island severely eroded as a result. The placed fill eroded quickly leaving behind limestone rubble and creating a headland. 3-2
. Figure 3-3 Honeymoon Island (PCPA, 2011) Figure 3-4.")
69 The unnatural shoreline orientation and headland has resulted in a nodal point near the middle of the island, preventing a stable beach from being maintained in the area (Davis and Elko, 2003). Figure 3-3 Honeymoon Island (PCPA, 2011) Figure 3-4. Honeymoon Island (CPE, 2010) 3-3
70 Honeymoon Island was acquired by the state in 1974 (southerly 2,500 feet of island, with options to buy more parcels) (USACE, 1980b). In 1979, the average annual net change in volume on the island was a loss of 15,200 cubic yards per year (USACE, 1980b). Reddish hued upland sand was used to nourish the island in 1989 (230,000 cubic yards). The sand rapidly migrated south into Hurricane Pass (Davis and Elko, 2003). In 1999, the County applied for and was issued a permit to create a non-federal navigation channel, 50 feet wide by 7 feet deep (from mean low water) in Hurricane Pass and use the dredge spoils (12,500 cubic yards) to nourish the southwest beach on Honeymoon Island, USACE Permit No (IP-TF) (USACE, 1999). The permit did not require regular maintenance or compensatory mitigation. Approximately 12,500 cubic yards was removed from the channel in 2000 and placed between R-10 and R-12 (FDEP, 2008). In 2002, the County applied for a permit (USACE Permit Application No ) to place 100,000 cubic yards of sand on the south end of the island (200 feet north of R-10 to 300 feet south of R-12) and construct a 450 feet long by 84 feet wide terminal groin at the south end of the project (south of R-12). The proposed borrow area was offshore of Hurricane Pass and contained sand of grain size 0.17 mm (native grain size was 0.19 mm). Mofatt & Nichol Engineers designed the project. This project was not constructed. In 2006, the County was issued a Joint Coastal Permit (JCP No JC) to place 130,000 to 155,000 cubic yards of sand along Honeymoon Island (R-8 to R-10.5). In addition, Phase I of the project included reconfiguring an existing groin near R-10 into a longer, lower T- head groin (250 feet long, 15 feet wide at stem). To prevent overwashing of shorebird nests near R-12 and R-13, approximately 580 cubic yards of fill was to raise the elevation. In 2008, the County, in cooperation with the FDEP s Division of Recreation and Parks, completed the construction of the T-head groin and nourishment (Phase I). The permitted borrow area was the Hurricane Pass ebb shoal (dredged to a depth of 9 feet with 1 additional foot of overdredge). The berm height was +5 feet NGVD and the slope was 1V:10H. A variance was also issued to expand the mixing zone (300 meters offshore, 1000 meters downcurrent from point of discharge). Originally, hourly turbidity samples were required by the permit when dredging below 9.5 feet due to high silt content. The permit was modified to allow sampling to be conducted every 4 to 6 hours since a cutter-head dredge was to be used. Phase II of the project includes the construction of three additional T-head groins with fill (at R- 8, R-8.5, and R-9), vegetation removal, reconfiguration of the existing parking lot, and removal of 50 feet of an existing submerged groin (near R-8.5). A joint coastal permit application was submitted in July 2011 by Humiston & Moore Engineers, on behalf the FDEP Division of Recreation and Parks and Pinellas County, to construct Phase II. Construction is scheduled to begin in The County is fronting the estimated $5.63 million for construction costs. Since Honeymoon Island is a State Park, the State is expected to reimburse 100% of the construction costs and 75% of non-construction costs (i.e. design, permitting and monitoring). 3-4
71 Caladesi Island Caladesi Island is an undeveloped 2.3-mile long barrier island located 1.5 miles offshore of the City of Dunedin (Figure 3-5). In the 1600s, the Tocobaga Indians built shell mounds on the island to be used as burial grounds (FDEP, 1999; 2007). The mounds were excavated in 1903 (Moore, 1903). In the late 1800s, the island was homesteaded by a single family (Heritage Village, 2012). Some components of the original structures remain. Prior to the Hurricane of 1921, Caladesi Island was connected to Honeymoon Island forming Hog Island (Elko and Davis, 2006). The hurricane resulted in the opening of Hurricane Pass and the splitting of Hog Island into separate islands. Caladesi Island was acquired by the state in 1966 and designated as a state park (USACE, 1980b). In 1978, Dunedin Pass, the island s southern boundary at the time, filled in. After Dunedin Pass closed, Clearwater Island Beach was connected to Caladesi Island. No structures or nourishment projects have been constructed on the island. Caladesi Island has consistently been accretional. In 1979, the average annual net volume change was 15,000 cubic yards per year (USACE, 1980b). In the 1980s, the southern end of the island remained wide as swash bars, formed prior to the closure of Dunedin Pass, moved onshore. In the early 2000s, the north end of Caladesi Island rapidly accreted due to an increase in littoral drift from the south (Elko, 2001). Storm overwash is common on the island. Certain sections of the island are protected from storm erosion by peat beds formed by mangrove detritus (Elko, 2001). Dunedin Pass (now closed) Figure 3-5 Caladesi Island (PCPA, 2011) Dunedin Pass, once a large tidal inlet, began to rapidly decrease in size in the 1920s after the opening of Hurricane Pass (1921) and the construction of the Clearwater Causeway (1926). The tidal prism was diverted to Hurricane Pass and to the south by the Causeway. The construction of the Dunedin Causeway (1965) further reduced the size of Dunedin Pass. Navigation aids were removed from the pass in In 1978, Dunedin Pass had reportedly closed (USACE, 1980). By 1984, the pass had reopened (Pinellas County Government Online, 2011). However, the loss of the ebb shoal during Hurricane Elena (1985) resulted in the infilling and eventual closure of the pass (Elko, 2003). The existing closed pass is shown in Figure

 led to a discontinuation of the study and an unfavorable report from the USACE (USACE,")
72 Figure 3-6. Dunedin Pass (CPE, 2010) The City of Clearwater requested a study by the Federal government for a Dunedin Pass navigation channel in An unfavorable reconnaissance report was submitted stating further study was not economically feasible. In 1971, the County requested a study for a project that disposed of dredged material from Dunedin Pass on the southern end of Honeymoon Island. Litigation issues over the ownership of Dunedin Beach (Figure 3-7) led to a discontinuation of the study and an unfavorable report from the USACE (USACE, 1980a). Figure 3-7. Dunedin Beach on Honeymoon Island (USGS, 1987) 3-6
73 After a request by the County, the USACE completed a brief reconnaissance report of the feasibility of Federal navigation improvements in the Dunedin Pass area in 1976 (USACE, 1980a). In 1977, Congress adopted a resolution (Section 107 of the River and Harbor Act) which authorized the Board of Engineers for Rivers and Harbors to review the feasibility of a navigation channel at Dunedin Pass. The recommended plan combined the Dunedin Pass and Hurricane Pass improvements and included excavating 389,000 cubic yards of material to be placed on the adjacent beaches and the construction of a rock revetment along Dunedin Pass for an initial cost of $1,403,000 and $286,000 in annual maintenance costs. In 1984, the County applied for a permit to remove the shoals within Dunedin Pass (Coastal Tech, 1992). The agencies responded with concerns regarding negative impacts to foraging habitat of the piping plover and recommended the use of Hurricane Pass and Clearwater Pass for navigational needs. The County withdrew the permit application. In 1989, 66% of voters wanted the pass opened (total of 8,334 votes). In 1990, the County submitted a joint coastal permit application to reopen Dunedin Pass at a location 1,500 feet south of the natural location. The Florida Game and Fresh Water Fish Commission recommended denial based on potential adverse impacts to the environment. The County withdrew the application. The City of Clearwater funded a feasibility study to open the pass (1992). The study suggested a project with an initial cost of $900,000 and annual maintenance costs of $275,000 that would require maintenance dredging every two years. Due to the low cost to benefit ratio of opening the pass, the project was not pursued further. The location of the pass in an aquatic preserve, its proximity to Caladesi State Park, and the potential impacts to nesting grounds, seagrasses and benthic communities further inhibits the likelihood opening the pass would be permitted. In 2011, the United States Coast Guard stated that they would prefer to transfer maintenance responsibilities of the channel markers along the entrance channel from the GIWW to the now closed Dunedin Pass (Squires, 2011). The City of Clearwater may take over maintenance responsibilities. Clearwater Beach Island Clearwater Beach Island extends 3.3 miles south-southwest of Caladesi Island to Clearwater Pass (Figure 3-8). The construction of the Clearwater Memorial Causeway in 1926 led to the rapid development of the island. The island was first nourished in 1950 (Table 3-1) (USACE, 1966). Reportedly, Clearwater Beach Island accreted 26,000 cubic yards per year during the 1950s and 1960s (USACE, 1966). However, the shoreline fluctuated significantly, prompting residents to construct seawalls to protect their property (USACE, 1980b). In addition, the City of Clearwater constructed many groins including a terminal groin to reduce end losses to Clearwater Pass (Figure 3-9 Figure 3-10, Table 3-1). The average annual volume change remained relatively 3-7 Figure 3-8. Clearwater Beach Island (PCPA, 2011)
")

. Figure 3-9.")
74 constant through the 1970s (27,200 cubic yards) (USACE, 1980b). In 1982, the jetty at Clearwater Pass was extended and the elevation of the beach was increased via nourishment (Figure 3-10) (USACE, 1994). Since then, Clearwater Beach has not required nourishment. A discussion of Clearwater Pass is included in Section 3, Clearwater Pass. Clearwater Pass was dredged August September Approximately 30,000 cubic yards of dredged material was placed in the nearshore (between -8 feet NGVD and -12 feet NGVD) adjacent to the south end of Clearwater Beach Island (FDEP, 2002, Squires, 2012). Figure 3-9. Pile and panel groins on Clearwater Beach in 1978 (USACE, 1980b) Figure Southern Terminal Groin at Clearwater Beach Island (PCPA, 2011) 3-8
75 Year Sand Key Table 3-1. Coastal Management Projects on Clearwater Beach Island Description of Coastal Management Project Nourishment: 150,000 cubic yards on southern end of island Construction of two groins at southern end of public property Construction of 500-foot concrete pier groin Sponsor City of Clearwater Cost N/A City of Clearwater $12,000 City of Clearwater $42, Construction of seven groins City of Clearwater $40, Construction of concrete pier groin, placement of rubble and fill north of City of Clearwater $55,000 Clearwater Pass 1975 Construction of curved jetty at Clearwater Pass City of Clearwater $2.5 million 1982 Extension of jetty at Clearwater Pass USACE/ Pinellas into 800-foot long curved jetty and County nourishment of beach north of jetty N/A Attempts at coastal management on Sand Key began in the 1950s when severe erosion threatened homes and infrastructure. In response, private owners and the local municipalities constructed groins and seawalls. By 1965, most of the island was armored by seawalls. The average net erosion rate along the entire island during this time period was approximately 2,000 cubic yards per year (USACE, 1966). The northern two-thirds of the island were eroding and the south end was accreting. The accretion at the south end resulted from the construction of groins and a jetty at John s Pass (Figure 3-11). The beach benefited from multiple nourishments during the 1970s (Table 3-2). Two emergency fill projects were funded by the Federal Disaster Assistance Administration, after Hurricane Gladys (1969) and Hurricane Agnes (1973) using material from the intracoastal waterway and Clearwater Pass (Table 3-2). In addition, material dredged from the Clearwater Pass Federal Navigation Project was placed on Sand Key in 1974 and 1977 (USACE, 1984b). By 1979, the average beach width was 50 feet. The shoreline at the north end of Sand Key was retreating at a rate of 83 feet per year (USACE, 1984b). Little to no beach existed between the ends of the island. The southern end of island was advancing at a rate of 83 feet per year. In addition, the jetty at John s Pass was in need of major rehabilitation. Overall, the net annual volume change was a loss of 107,800 cubic yards per year (USACE, 1984b). 3-9


")
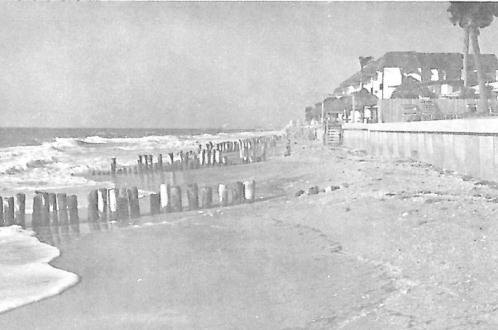
76 Figure Sand Key in 1978 (USACE, 1980b) 3-10
77 Year Table 3-2. Coastal Management Projects on Sand Key Description of Coastal Sponsor Management Project Construction of 37 adjustable timber pile and concrete panel groins Construction of curved jetties on north side of John s Pass; Nourishment: 30,000 cubic yards on north side of jetty, dredged from pass Authorization of nourishment of 9.3 miles of Sand Key as part of Pinellas County Federal Shore Protection Project Nourishment: 143,000 cubic yards of emergency fill from intracoastal waterway placed on Indian Rocks Beach (5,500 ft) after Hurricane Gladys Nourishment: 400,000 cubic yards of emergency fill on Indian Rocks Beach (5 miles) after Hurricane Agnes Construction of jetty at north end of Sand Key Beach disposal of 126,000 cubic yards from maintenance dredging of Clearwater Pass Beach disposal of 186,000 cubic yards from maintenance dredging of Clearwater Pass Beach disposal of ~600,000 cubic yards from Clearwater s program for inlet improvement for bridge stability placed along north end of Sand Key (2 miles) Nourishment: 60,000 cubic yards placed at Redington Shores beach after being dredged from John s Pass, stockpiled on Treasure Island and moved by land to fill site Construction of 350-foot long breakwater at elevation +1.5 feet mean low water located 340 feet offshore of Redington Shores seawall First Federal Nourishment: 380,000 cy placed on N Redington Beach & Redington Shores; Breakwater lowered by one foot 3-11 City of Madeira Beach City of Madeira Beach USACE/ Pinellas County Federal Disaster Assistance Administration Federal Disaster Assistance Administration Cost $10,000 $300,000 $856,000 $1,677,600 Local $2,500,000 USACE USACE City of Clearwater USACE/ Pinellas County USACE/ Pinellas County USACE/ Pinellas County $719,000 $2.9 million
78 Second Federal Nourishment: ,325,000 cubic yards placed on Indian Rocks Beach (2.65 miles) Truck Fill: 19,000 cubic yards Third Federal Nourishment: 1,002,000 cubic yards placed on Indian Shores 1992 (2.6 miles); 58,000 cubic yards placed on North Redington Beach (1,800 feet) GIWW Dredge Spoil Placement: 7, cubic yards Federal Nourishment: Seven beach communities Federal Nourishment: 2 million cubic yards from Egmont Shoal Borrow Area placed on Sand Key (9 miles) includes Sand Key (Clearwater), Belleair Beach, Indian Rocks Beach, Indian Shores, Redington Shores and North Redington Beach USACE/ Pinellas County USACE/ Pinellas County USACE/ Pinellas County USACE/ Pinellas County Federal Nourishment: Approx USACE/ Pinellas 2012 million cubic yards placed County Sources: (USACE, 1984b; 1994; ASBPA, 2009; FDEP, 2011e) $14.5 million $10 million $26 million $45 million $31.54 million Three hurricanes impacted Pinellas County in 1985 (Davis and Andronaco, 1987). Pinellas County had not had a significant hurricane season since 1921 (see Section 3, Hurricane Pass). The strongest storm in 1985, Hurricane Elena, stalled for 24 hours offshore of Cedar Key (80 miles to the north of Sand Key). Storm wave heights were on the order of 7.5 feet. The hurricane caused severe damage to seawalls and some damage to buildings (Davis and Andronaco, 1987). The post storm conditions of the beach on Sand Key prompted the first Federal Shore Protection Project on Sand Key (originally authorized in 1966). As mentioned above, the Federal Disaster Administration funded emergency fill projects in 1969 and The first Federal nourishment was constructed in phases from 1988 to 1992 (Table 3-2) (Davis et al., 2000). The first phase was constructed at Redington Beach and included the lowering of the Redington Beach breakwater (originally constructed in 1986). The breakwater was intended to reduce erosion at the public access and extend the design lifetime of the nourishment by one year (USACE, 1984b). The formation of a tombolo, attached to the breakwater, prompted the USACE to remove stones and lower the elevation of the breakwater during the nourishment project. The nourishment was constructed using borrow material taken via suction dredge from the John s Pass ebb shoal (Davis et al., 2000). The Indian Rocks Beach (Phase II) nourishment utilized the Egmont Key shoal. Material was collected from the shoal via suction dredge, transported by barge, offloaded offshore of Sand Key and pumped onshore via suction dredge (Davis et al., 2012). The Indian Shores project (Phase III) used a series of draglines and conveyor belts to excavate sand from the Egmont Key 3-12
79 shoal, load it onto barges and offload the sand onto the beach. The transportation method resulted in a cost savings (Table 3-2); however, the material placed was looser than the other projects and eroded slightly faster. Overall, the project performed very well, exceeding the design life times (Davis et al., 2000). Six years later (1998), the second nourishment occurred as a single project instead of in phases to reduce construction costs. Due to the proximity of hardbottom and the potential impacts of the nourishment, the permit required the construction of 7.95 acres of reef (See Mitigation Reefs). The nourishment did not include Belleair Shore and subsequently a hotspot formed in that area and erosion increased at the adjacent beach, Indian Rocks (BMP, 2004). Eight years later (2006), Sand Key was renourished again as part of the Federal Shore Protection Project. At the time, the majority of Sand Key was eroding, with the exception of 2 miles of shoreline adjacent to Clearwater Pass (nourished by the City of Clearwater) and 3 miles of shoreline just north of John s Pass at Madeira Beach (BMP, 2004). The 2006 project was the largest in volume and most costly yet, relative to previous Sand Key nourishments (Table 3-2). The fill was sourced from the Egmont Key borrow area (See Section 3, Borrow Areas). Six years after the last nourishment, Sand Key began the 2012 nourishment project in May (Figure 3-12). Norfolk Dredging Company bid $31.54 million and placed approximately 1.25 million cubic yards of sand. Sand was sourced from Borrow Area L, designed by CPE (see Section 3, Borrow Areas). The project construction was completed in November The permit (FDEP Permit # JC) authorizes multiple nourishments, as needed until the permit expiration on July 26, Funding Eligibility of Belleair Shore and Belleair Beach Belleair Shore does not accept federal funding for beaches so that they do not have to grant access and parking to non-residents. In the 1940s, the original developers deeded three beach parks in Belleair Shore to the residents. The towns have interpreted the deeds as exclusionary to others. In 1974, town officials cited violation of deed restrictions may result in legal issues and potentially a reversion of property to the original owners or their heirs (Bridges, 1974). Belleair Beach Park at Morgan Drive, however, does not have the same deed restrictions (Bridges, 1974). In 2011, Belleair Beach wanted to be included in the Sand Key federal nourishment. However, they were short 28 parking spaces in order to be eligible for state funding (total needed was 79). The location of the Belleair Beach Resort Motel in the middle of an ineligible area and the USACE s reluctance to reduce the length of shoreline renourished prompted the County to agree to nourish all of Belleair Beach in However, the Town must work to meet the state s eligibility requirements in order to ensure receiving nourishments in the future (Estrada, 2011; Squires, 2012). The Belleair City Council voted to not meet the additional parking requirements on April 23, 2012 (Ayers, 2012). On July 25, 2012, the Pinellas County Administrator presented a draft agreement to the BIG-C requiring beach communities to maintain the number of public parking spaces necessary to qualify for state nourishment funding 3-13
. Figure 3-12.")
80 or reimburse the county for any funds the county spends nourishing an ineligible shoreline (McClure, 2012). Figure Sand Key Nourishment Project Area (Pinellas County Government Online, 2012) 3-14
81 Existing Conditions Snapshot Summary for Sand Key In 2006, fill was placed along North Sand Key (R-56 R-60), Indian Rocks Beach (R-70-R-81), the Headland (R-81- R-89), Indian Shores (R-89- R-100) and North Redington Beach (R-100- R- 107). No fill was placed along Belleair Shore (R-65- R-70), Madeira Beach (R-107- R-113) or immediately adjacent to the John s Pass terminal groin. By 2010, approximately 78% of the fill placed during the 2006 nourishment remained on Sand Key (Roberts and Wang, 2011, appended 2012). While the most recent nourishment project was completed in November 2012, a summary of the previous monitoring results for Sand Key from the 2010 Beach Summary Report developed by the University of South Florida is presented below and in Figure 3-13 (Roberts and Wang, 2011): North Sand Key (R-52 to R-65) No fill was placed from R-52 to R-55 in Therefore, no monitoring of the beach immediately adjacent to Clearwater Pass was conducted in The North Sand Key project area extends 1.7 miles from 1290 Gulf Boulevard (R-56) to 23 rd Street (R-65). A nodal point exists at the north end of Sand Key between R-56 to R-65 as a result of wave refraction that occurs over the Clearwater Pass ebb shoal (Figure 3-13, 3-14 and 3-15). The divergence of alongshore sediment transport results in a substantial accretion at the Clearwater Pass jetty (to the north) and an erosional hotspot between R-59 and R-61 (to the south) (Figure 3-15). Beach profile lacks a sandbar. Lack of sand bar and divergent alongshore transport has resulted in significant erosion of total active profile (Figure 3-16a). Hotspot exists near R-60-R-61 (Dan s Island) (Figure 3-14). 3-15

 (Roberts and Wang,")
")
82 Figure Sediment transport on Sand Key (units of cubic meters of sand) (Roberts and Wang, 2012) Figure Dan s Island Hotspot (R60) Figure North Sand Key 3-16
83 Figure 3-16a-g. Sand Key Beach Profiles (Roberts and Wang, 2012) a) North Sand Key R-60 b) Belleair Shore (R-68) 3-17
84 c) Indian Rocks Beach d) Headland (R-84) 3-18
85 e) Indian Shores (R-91) f) North Redington (R-105) 3-19
86 g) Madeira Beach (R-109) Belleair Shore (R-65 to R-70) (Figure 3-16b) Belleair Shore extends approximately one mile from 23 rd Street (R-65) to 5 th Street (R-70). No fill was placed at Belleair Shore in Sandbar-like feature formed offshore after 2006 nourishment. The sand bar moves onshore and offshore seasonally. The shoreline has advanced and the nearshore area has had volumetric gains due to longshore spreading. Volumetric loss from updrift and downdrift beaches is greater than gains at Belleair Shore. Indian Rocks Beach (R-70 to R-81) (Figure 3-16c) Indian Rocks Beach extends approximately 2 miles from 5 th Street (R-70) to 5 th Avenue North (R-81). Sandbar migrates offshore and onshore during winter and summer, respectively. Shoreline is stable after the initial profile equilibration. Volume loss is likely due to the lack of sand input from the unnourished updrift beaches. Headland (R-82 to R-89) (Figure 3-16d) The Headland area is the 1.4-mile section of beach from 4 th Avenue (R-82) to 199 th Avenue (R-89). 3-20
 (Figure 3-16e) Indian Shores extends approximately 3.")

87 In winter, the shoreline retreats and the sandbar moves offshore. The sandbar moves onshore during the summer, nearly attaching to the shoreline in 2008 and The profile had equilibrated three years post-construction. Indian Shores (R-89 to R-106) (Figure 3-16e) Indian Shores extends approximately 3.2 miles from 199 th Avenue (R-89) to 171 st Avenue East (R-106). The profile had equilibrated four years post-construction. The sandbar migrates seasonally and nearly attached in 2008, as a result of distal hurricanes. Hotspots have occurred near R-99 and between R-104A and R-106 (Figure 3-16f, Figure 3-17a and Figure 3-17b). The Long Pier, 1,000 feet in length, is located at R-104A (17490 Gulf Boulevard). Figure 3-17 Indian Shores Hotspots a) at R-99 b) between R-104A and R-106 Redington Breakwater (R-100A to R-101) The Redington Breakwater is adjacent to the Redington Shores Beach Access at Gulf Boulevard (Figure 3-18). A broad tombolo has formed landward of the breakwater (not directly related to the 2006 nourishment). Immediately south of the breakwater, the shoreline advanced. The shoreline north of the breakwater (R-99) has retreated 90 feet between 2006 and
 to 157 th Avenue (R-113). The Madeira Beach shoreline was relatively stable (R-107 to R-113).")
88 Figure Redington Breakwater Madeira Beach and Southern End of Sand Key (R-107 to R-124) (Figure 3-16g) Madeira Beach extends approximately 1.1 miles from 169 th Avenue (R-107) to 157 th Avenue (R-113). The Madeira Beach shoreline was relatively stable (R-107 to R-113). The southernmost profile adjacent to the John s Pass ebb shoal has a slight gain in dry beach (R-124). Overall The north end of Sand Key is accreting as a result of sand transported north from the nodal point near R-60. Within the vicinity of the nodal point (R-59-R-64), hotspot erosion is occurring. The rest of the island is stable except for the headland area along the bend in the island, Indian Rocks Beach and Indian Shores Beach, which is moderately erosional. Except in the divergent zone at the north end of Sand Key, the longshore transport gradient is not persistent or significant. Cross-shore transport gradients dominate beach profile changes, as evidenced by onshore-offshore movement of the nearshore bar and relatively stable shorelines. The majority of fill was retained four years post construction. Recommendations from Sand Key Stakeholders In 2004, the community of Indian Rocks Beach developed their own Beach Management Plan. The plan recommended a Dune Preservation Zone with a minimum width of 50 feet. Within the zone, the planning committee suggested developing slow growth dunes as opposed to artificial dunes, preventing the construction of dune fencing, planting a diversity of locally native species, and preventing beach raking. In addition, the planning committee recommended unmetered free parking and no new parking areas. 3-22
89 Treasure Island Treasure Island is a 3.3-mile barrier island bordered by John s Pass to the north and Blind Pass to the south (Figure 3-19). Development of resorts on the island began in the 1920s. There was a surge in development in the 1950s. By the 1960s, the island was facing serious erosion problems. In response, the City of Treasure Island constructed 56 concrete (originally timber) groins and a rubble mound jetty on the north side of Blind Pass (USACE, 1984). These groins are no longer present or were buried by beach nourishments. Sunshine Beach The first Federal nourishment project on the west coast of Florida was on Treasure Island in 1969 (Table 3-3) (USACE, 1984b). After the initial construction and repair following Hurricane Gladys, Treasure Island was renourished every two to three years. The material used for the nourishments was sourced from Blind Pass, John s Pass and an offshore sand pit parallel to the island. Sunshine and Sunset beaches required frequent nourishment. Sunshine Beach, at the north end of Treasure Island, is historically erosional as a result of inlet Sunset Beach Figure Treasure Island (PCPA, 2011) effects. The only time periods Sunshine Beach has been accretional was after a nourishment or in the 1970s when dredge spoils disposed offshore migrated onshore. In 1989, an angled structure was constructed near 126 th Avenue to protect development to the south (Figure 3-20a) (Krock, 2005). No evidence was found on why or when it was removed. A terminal groin was constructed at John s Pass in 2000 to limit the end losses from Sunshine Beach to the inlet (Krock, 2005). Prior to its construction, the shape and beach width at Sunshine Beach fluctuated significantly. After the groin s construction, the beach was fixed and straight, in proportion to the effective length of the groin (Figure 3-20b). 3-23
 in 1989 (Krock, 2005) b) in 2010 (CPE, 2010) Sunset Beach, at the south end of Treasure Island, extends from R-127 to Blind Pass")


90 Figure Structures at North End of Treasure Island a) in 1989 (Krock, 2005) b) in 2010 (CPE, 2010) Sunset Beach, at the south end of Treasure Island, extends from R-127 to Blind Pass (Figure 3-21). Sunset Beach is sediment starved due to the sediment trapping that occurs in the center of the island and wave focusing that results from an offshore borrow area used in the 1960s (Roberts and Wang, 2011). The center of the island accretes in response to sand bypassing John s Pass and migrating onshore. The wave climate, potentially influenced by the islandparallel offshore borrow pit, is eroding the southern end of the island rather than dispersing sand from the center of the island. Despite nourishment in 2010, Sunset Beach continues to rapidly erode between FDEP monuments R-137 to R (Caddy s on the Beach Restaurant to 77 th Street). Figure Treasure Island in January Photograph (looking north) shows shoreline from R-129 (ebb shoal attachment point) to R-143 (Sunset Beach). Blind Pass is south of Treasure Island. 3-24

91 As a safeguard, the County, the City of Treasure Island and the State organized a sand sharing program to redistribute sand on the island quickly if needed (FDEP Permit Number JC). During a shoreline emergency, the City of Treasure Island is authorized to move up to 134,000 cubic yards of sand from the wide section of beach to the narrow sections at the ends until the Federal shore protection project can be mobilized. The onshore borrow area is considered to be filled sovereignty lands; however, an Erosion Control Line was not required to implement the sand sharing program. The City of Treasure Island renounced their rights to lands seaward of the 1968 mean high water line via Resolution (07-114), transferring their interest to the Board of Trustees of the Internal Improvement Trust Fund under governance of the FDEP Division of State Lands. The portion of beach within the City of St. Petersburg was not included due to their reluctance to issue a similar resolution. In 2010, the City of Treasure Island hired Coastal Tech to design an emergency sand sharing project. The City plans on bidding the project and retaining a contractor to be ready in case of emergency. The City s emergency reserves budget is $500,000. If the project is constructed, the City is expected to be reimbursed by the County, which in turn could receive 50% reimbursement by the State (City of Treasure Island Beach Stewardship Committee, 2010; Squires, 2011). Existing Conditions Snapshot Summary for Treasure Island A summary of the monitoring results for Treasure Island from the 2010 Beach Summary Report developed by the University of South Florida is presented below (Roberts and Wang, 2011): Sunshine Beach (R-127 to R-128) Sunshine Beach (Figure 3-22), at the north end of Treasure Island, extends 0.38 miles from John s Pass to 121 st Avenue. The beach width from the vegetation line varied from 45 to 158 feet in 2010 and erodes at a rate of 30 feet per year. Wave refraction around the John s Pass ebb shoal causes a reversal in sediment transport along Sunshine Beach (Figure 3-23). Figure Sunshine Beach (CPE, 2010) Sunshine Beach is dominated by the longshore transport gradient, lacks bar formation and continues to retreat landward (Figure 3-24a). Substantial erosion occurred during the El Nino winter months of The cross-shore morphology of John s Pass ebb shoal changes from year to year. In 2009, natural sand bypassing (and longshore transport) across John s Pass formed a large shoal in an area that was previously a trough. In 2010, the eastern side of the 3-25

92 shoal began to erode. The western side of the shoal migrated onshore (Volume II, Roberts and Wang, 2011). Figure Accreting and Eroding Areas on Treasure Island (units of cubic meters of sand) (Roberts and Wang, 2012) 3-26
93 a) b) c) Figure 3-24 Treasure Island Beach Profiles (Roberts and Wang, 2012) a) Sunshine Beach (R-127), b) Treasure Island (R-133), c) Sunset Beach (R-140) 3-27
, especially after winter due to the transport driven by the energetic northerly approaching waves.")
.")
94 Central Treasure Island (R-129-R-133) The John s Pass ebb shoal attachment point is located near R-129 (Figure 3-25). The shoreline has advanced at this location (Figure 3-24b), especially after winter due to the transport driven by the energetic northerly approaching waves. Onshore sandbar migration and shoreline accretion occurred during the winter months between 2006 and The wide beach between R- 131 and R-133 is also due to the filling in of O Brien s lagoon in 1980 (Wang and Beck, 2012). Sunset Beach (R-137 to R-141) During the first winter post construction (2007), the shoreline at Sunset Beach retreated and a large volume of sand was lost. The shoreline has continued to retreat since 2006 (Figure 3-24c). Sandbars formed in 2007, 2009, and 2010 but not in The sandbar migrated onshore during summer months with little benefit to the shoreline. The greatest erosion occurred at R- 140 (Figure 3-26). Figure Central Treasure Island (CPE, 2010) A slight advancement of the shoreline occurred just north of the Blind Pass jetty between 2006 and Figure Sunset Beach, R-140 (CPE, 2010) 3-28
95 Table 3-3. Coastal Management Projects on Treasure Island (USACE, 1994; Pinellas County, 2010) Year Description of Coastal Management Project Sponsor Cost 1960 Construction of 56 concrete groins Construction of native stone, rubble mound jetty on north side of Blind Pass Nourishment: 10,000 cubic yards of fill dredged from Blind Pass placed on adjacent public beach First Federal Nourishment: 790,000 cubic yards from Blind Pass (108,000 cubic yards) and offshore (682,000 cubic yards) placed along 9,200 feet of shoreline Nourishment: 143,000 cubic yards of emergency fill placed after Hurricane Gladys Nourishment: 75,000 cubic yards of fill from the shore connected bar was placed at the north end Nourishment: 155,000 cubic yards of fill from the 1969 borrow area was placed at the south end 1972 Construction of two groins at south end Nourishment: 380,000 cubic yards from offshore borrow area placed on southern 1.5 miles of island Modification of Blind Pass north jetty: jetty was raised 2.5 feet Nourishment: 50,000 cubic yards of dredge spoils from Blind Pass Dredge spoils (119,000 cubic yards) from John s Pass placed in O Brien s Lagoon at north end of island Dredge spoils (70,000 cubic yards) from maintenance of John s Pass placed Nourishment: 220,000 cubic yards from Blind Pass placed on southern 4,200 feet of island City of Treasure Island City of Treasure Island City of Treasure Island USACE/ Pinellas County Federal Disaster Assistance Administration USACE/ Pinellas County USACE/ Pinellas County USACE/ Pinellas County USACE/ Pinellas County USACE/ Pinellas County USACE/ Pinellas County USACE/ Pinellas County $228,000 $18,
 Nourishment: 56,000 cubic yards of fill dredged from John s Pass and placed along the shoreline 1000 feet south of the")
96 Nourishment: 445,000 cubic yards of emergency fill from Pass-A-Grille ebb shoal placed on southern 10,400 feet of island after Hurricane Elena Construction of angled erosion control structure at 126 th Avenue (Figure 3-20a) Nourishment: 56,000 cubic yards of fill dredged from John s Pass and placed along the shoreline 1000 feet south of the pass Nourishment: 51,280 cubic yards of fill placed along Sunset Beach Nourishment: 348,772 cubic yards dredged from John s Pass and placed along the southern third of the island (5,100 feet) Construction of 400-foot long jetty at north end of island at John s Pass Nourishment: 225,000 cubic yards of fill from the Pass-A-Grille channel placed on Sunset Beach Nourishment: 270,000 cubic yards of fill from the Egmont shoals used to repair the beach after the 2005 hurricane season (included Long Key) Nourishment: 253,000 cubic yards of fill from John s Pass placed on Sunshine Beach and Sunset Beach Federal Disaster Assistance Administration Unknown USACE/ Pinellas County USACE/ Pinellas County USACE/ Pinellas County FDEP/ Pinellas County USACE/ Pinellas County USACE (Flood Control and Coastal Emergencies) USACE/ Pinellas County $1.3 million $6 million $3.5 million (total cost including Upham Beach was $5.2 million) Long Key (Upham Beach and Pass-A-Grille Beach) Long Key is a drumstick shaped barrier island that extends 4.1 miles from Blind Pass to North Channel, Pass-A-Grille Pass (Figure 3-27). Long Key was a popular destination for wealthy tourists in the 1920s. As a result, beach management began early on Long Key with the construction of the first terminal groin adjacent to Blind Pass in 1936 (Table 3-4) (ASBPA, 2009). The groin was constructed to reduce land loss at the north end caused by the southern migration of Blind Pass (Figure 3-28a). The City of St. Petersburg Beach (now St. Pete Beach) armored the rapidly eroding ends of the island with seawalls and groins during the 1950s, including a terminal groin at Pass-A-Grille Pass 3-30 Figure Long Key (PCPA, 2011)

.")
97 (USACE, 1980b). Development rapidly increased after the construction of two causeways to the island in 1962 and The construction of the causeways caused a reduction in the tidal prism and destabilization of the ebb shoal. Unregulated development allowed construction seaward of the dunes. In response to the erosion, the City continued constructing and extending groins during the 1960s and 1970s. In 1974 and 1975, the terminal groin at the north end of Long Key was extended by the City and two kingpile groins were constructed with fill south of the pass (USACE, 1980b). Within two years, the shoreline receded to its pre-construction position (Figure 3-28a). Additionally, Pass-A- Grille beach had lost nearly 500 feet of beach in 25 years, exposing properties to increased wave energy and erosion (Pinellas County Government Online, 2011). Figure North End of Long Key a) in 1978 (USACE, 1980) b) in January 2012 In 1980, the island s first Federal nourishment project was constructed (USACE, 1984b). The Federal project nourished the north end of the island (Table 3-4). In addition to the nourishment, a breakwater made of sand was constructed offshore of the north end (100,000 cubic yards) (USACE, 1980b). Post-construction, the artificial sand bar moved onshore as expected. At the time, the Pass-A-Grille jetty was performing well and holding the shoreline at the south end of the island. Periodic nourishment continued on a five-year interval as part of the Federal project. Data indicate the fill erodes within two to five years after construction (Elko et al., 2001). The north end of the island (Upham Beach) was severely erosional, eroding within two years after nourishment. The central segment was accretional and the south end (Pass-A-Grille) was relatively stable (Elko et al., 2001). Hurricane Frances caused significant erosion of Pass-A- Grille beach in 2004 (Wang, 2012). In response to the erosion at Upham Beach on the north end of the island, five geotextile T-head groins were constructed in (Figure 3-28b and 3-29) (CPE, 2010b). The intent of the project was to increase the interval between nourishments, maintain the 40-foot wide design beach, and reduce downdrift erosion. The performance of the T-groins was monitored for 25 months by the University of South Florida Department of Geology. The groins were observed to 3-31

98 have reduced erosion by approximately 40% as compared to losses after the previous nourishment and to have no clear impact on the downdrift beach. Repair of the geotextile T- groins at Upham Beach was conducted between November 2010 and July 2011 and included the removal and replacement of several geotextile tubes and scour aprons, patching and the application of a UV coating (CPE, 2011). In October 2011, a joint coastal permit application (FDEP Permit Number JC) was submitted to reconstruct the T-groins out of rock and make them permanent structures. The orientation and design of the permanent structures was altered from the temporary geotextile groins to provide an increased level of storm protection, maintain a 40-foot wide beach and more open space for surfing and recreation. Groin T4 was proposed to be moved north about 130 feet to compensate for the removal of T3 based on results from the associated numerical modeling study (CPE, 2010b). Figure Upham Beach on Long Key in January 2012, facing north. Yellow shoreline structures are the temporary T-head groins installed in 2006 and repaired in 2010/2011. Blind Pass is the inlet north of Long Key (top of photograph). Treasure Island (Sunset Beach) is north of Blind Pass (top of photograph). FDEP-BIP's issued a joint coastal permit for the permanent Upham Beach groins on October 30, 2012 (FDEP File No JC). The permit will expire 5 years from the date of issuance. The permit authorizes the replacement of the five temporary geotextile tubes with four limestone rock T-head groin structures. The average armor unit sizes will be 2.4 tons in the stem of the groin and 6.9 tons in the head section. A one- foot thick marine gabion mattress foundation will support the groins. Pass-A-Grille Beach Pass-A-Grille Beach, the southern Long Key segment, was authorized under the Rivers and Harbors Act of 1966, Public Law , as part of the federal Pinellas County Beach Erosion Control Project. The beach was nourished as part of the Federal project in 1989 and Since 1992, Pass-A-Grille Beach has not been nourished regularly or monitored. The lack of 3-32

99 nourishment was due to the belief that Upham Beach was acting as a feeder beach and adequately supplying Pass-A-Grille Beach with sand. The 2004 hurricanes caused significant erosion of Pass-A-Grille Beach and led to an emergency nourishment. Hurricanes impacted the shoreline again in 2005 but Pass-A-Grille Beach was not eligible for rehabilitation funding under the Flood Control Coastal Emergency Act (PL 84-99), likely as a result of a lack of monitoring data. In 2006, a sediment transport analysis was conducted for Pass-A-Grille Beach (Elko, 2006). The analysis found that the majority of sand from Upham Beach bypassed Pass-A-Grille Beach due to the interaction of inshore sand bars and the ebb shoal. Following the analysis, Pinellas County initiated a joint coastal permit application to nourish Pass-A-Grille Beach and planned to add the southern Long Key segment into the Federal nourishment plan. Additionally, the County planned for future monitoring of the project in order to qualify for emergency funding. As of December 2011, the permit application was incomplete and USF was under contract to monitor Long Key. Existing Conditions Snapshot Summary for Long Key A summary of the monitoring results for Long Key from the 2010 Beach Summary Report developed by the University of South Florida is presented below (Roberts and Wang, 2011): Upham Beach (Blind Pass to LK5) (Figure 3-30) Figure Upham Beach on Long Key in April 2012 (Google Earth, 2012b). The shoreline has progressively retreated landward due to large negative longshore sand transport gradient (Figure 3-31). The greatest dry beach loss occurred at LK3 (Figure 3-32a). Little to no shoreline retreat occurred at LK6. Magnitude of volumetric loss at Upham Beach exceeds loss at Sunshine Beach (the beach just south of structures at John s Pass). Terminal structures at Blind Pass prevent sand bypassing to Upham Beach. LK3 had the greatest losses from the active profile in Pinellas County (2006 to 2010). In 2009 and 2010, sand accumulated offshore at LK2, suggesting the growth of the Blind Pass ebb shoal. Growth of the ebb shoal was also documented by Wang et al. (2011). 3-33

100 Figure Sediment transport along Long Key (units of cubic meters of sand) (Roberts and Wang, 2012) 3-34
101 a) b) c) Figure Long Key Beach Profiles (Roberts and Wang, 2012). a) Upham Beach (LK-3), b) Long Key (R-155), c) Pass-A-Grille Beach (R-163) 3-35
. The shoreline between R-149 and R- 160 has advanced.")
 Pass-A-Grille Beach R-160 to R-165 Volumetric losses occurred offshore between 2006 and 2010")
 and minor dry beach gains (0 to 8 feet) occurred between R-160 and R-165 (Figure 3-32c and")
102 Central Long Key (R-149 to R-157) Downdrift of nourished area at Upham Beach, volumetric gains have occurred. The largest gain and dry beach advancement occurred at R-152 (Figure 3-33). The shoreline between R-149 and R- 160 has advanced. Sandbar migrates onshore and offshore seasonally (Figure 3-32b). Figure Central Long Key, R-152 (CPE, 2010) Pass-A-Grille Beach R-160 to R-165 Volumetric losses occurred offshore between 2006 and 2010 due to inlet effects. Little to no change in volume occurred in the nearshore. Minor shoreline retreat (0 to 5 feet) and minor dry beach gains (0 to 8 feet) occurred between R-160 and R-165 (Figure 3-32c and Figure 3-34a and 3-34b). Figure Pass-A-Grille Beach (CPE, 2010) a) at Paradise Grille (R-163.5) b) South Groin at Long Key 3-36
103 Year s Table 3-4. Coastal Management Projects on Long Key Description of Coastal Sponsor Management Project Construction of jetty on south side of Blind Pass (100 feet in length) Construction of groins and seawall at south end of the island Construction of rubble mound jetty at North Channel, Pass-A-Grille Pass Construction of bulkhead at Upham Beach (~900 feet in length) Extension of jetty and addition of fishing platform Dredging of Blind Pass; spoils placed 1968 south of Pass Extension of South Blind Pass jetty by feet (total of 261 feet) Construction of two king pile and panel 1975 groins south of Blind Pass; Placement of 75,000 cubic yards of fill Federal Nourishment: 143,000 cubic yards of fill placed at north end; 1980 advance nourishment was placed offshore to act as partial breakwater (100,000 cubic yards) Nourishment: 170,000 cy placed at 1986 southern end and at Upham Beach dredged from Pass-A-Grille channel Construction of attached breakwater on 1986 the south side of Blind Pass Nourishment: 223,700 cubic yards 1991 placed at Upham Beach dredged from Blind Pass Nourishment near Pass-A-Grille Nourishment: 252,400 cubic yards 1996 placed at Upham Beach dredged from Egmont Channel Nourishment: 309,000 cubic yards 2000 placed at Upham Beach dredged from Blind Pass Local City of St. Petersburg Beach City of St. Petersburg Beach Local City of St. Petersburg Beach USACE USACE City of St. Petersburg Beach USACE/ Pinellas County Cost $115,000 $23,000 $36,500 $1.5 million $1.73 million 3-37
 Construction of geotextile T-groins at Upham Beach Nourishment: 160,000 cubic yards of fill from Blind Pass placed on Upham")
104 Nourishment: 366,000 cubic yards placed at Upham Beach, 147,000 cubic yards placed at Pass-A-Grille Nourishment: 270,000 cubic yards of fill from the Egmont shoals used to repair the beach after the 2005 hurricane season (included Treasure Island) Construction of geotextile T-groins at Upham Beach Nourishment: 160,000 cubic yards of fill from Blind Pass placed on Upham Beach Repair of geotextile T-groins at Upham Beach USACE/ Pinellas County USACE (Flood Control and Coastal Emergencies) USACE/ Pinellas County $804,500 $6 million $1.73 million (total incl. T.I.: $5.2 million) (Beach Performance of Long Key, Pinellas County, FL: Final Report, 2001; Long-term Beach Performance and Sediment Budget of Long Key, Pinellas County, Florida, 1999; Rehabilitation Effort for the Pinellas County Shore Protection Project, 2006; Beach Performance of Long Key, Pinellas County, FL: Final Report, 2001; Limited Re-Evaluation Report and Environmental Summary, 1994; USACE, 1978) Shell Key The Shell Key Preserve (Figure 3-35) includes a barrier island, a series of mangrove islands, seagrass beds and sand flats. The barrier island was formed by the amalgamation of sand bars in the 1950s (ASBPA, 2009). In 1998, the channel flowing through the center of the island closed (Google Earth, 2012c). Over the next ten years, the island stabilized and the line of vegetation became continuous (CPE, 2010). Pinellas County has leased the preserve from the state since 2000 (Lease No. 4228), with the exception of a few privately owned parcels. The Pinellas County Board of County Commissioners manages the preserve through the County Department of Parks and Conservation Resources (formerly managed through the Department of Environmental Management, Environmental Lands Division). In 2007, the Shell Key Preserve Management Plan was developed by stakeholders. Stakeholders include the FDEP, the County, the Florida Audubon Society, the St. Petersburg Audobon Society, the FWC, and the public. Management of Shell Key includes the removal of Australian pines, 3-38 Figure Shell Key (CPE, 2010)

. Bunces Key Prior to 1997, Pass-A-Grille Pass had a north and south channel (Wilhoit, 2004) (Figure 3-36a).")
 (Figure 3-36b).")
105 management of nest-threatening species (raccoons and gulls), and implementation of public ordinances to preserve natural resources. Funding for removal of the Australian pines was budgeted in 2007 through the Penny for Pinellas program, with matching grants from the USFWS. From 2007 to 2019, two hundred thousand dollars was budgeted in the County s Capital Improvement Program funded by the Penny for Pinellas tax (Pinellas County Department of Environmental Management, 2007). Bunces Key Prior to 1997, Pass-A-Grille Pass had a north and south channel (Wilhoit, 2004) (Figure 3-36a). Bunces Key was formed from sediments from the ephemeral south channel of the Pass-A-Grille Pass (Wilhoit, 2004). North Bunces Key formed from the northern swash bar in 1963 (Wilhoit, 2004) (Figure 3-36b). Over the next decade, North Bunces Key lengthened, eventually causing the closure of the south channel (Wilhoit, 2004). Simultaneously, the Bunces Pass ebb shoal grew and South Bunces Key emerged from the swash bar in 1975 (Figure 3-36c). The islands were breached and overwashed by several severe storms. The overwash widened North Bunces Key. By 1997, North Bunces Key extended north, closing the south channel of Pass-A-Grille Pass and connecting to Shell Key. South Bunces Key migrated east and formed the northern tip of Mullet Key (Wilhoit, 2004). Bunces Pass is discussed in a following section. Figure Evolution of Bunces Key a) 1945 b) 1963 c) 1976 (Wilhoit, 2004) Mullet Key Mullet Key is a V-shaped island at the south end of Pinellas County, surrounded by Class II Waters (F.A.C 17-3) (Figure 3-37). One of six surface water designations given by the state, Class II waters require the second highest degree of protection due to their use for shellfish propagation or harvesting (potable water supplies are the first, Class I). The north end of the Key contains the historically-significant and 3-39 Figure Mullet Key (PCPA, 2011)
.")
.")
106 recreationally-popular Fort DeSoto Park. Mullet Key was utilized as a blockade during the Civil War and occupied again during the Spanish- American War (Pinellas County, 2011). Hillsborough County used the eastern side of the island as a quarantine station for foreign immigrants entering the country from 1889 to 1937 (Pinellas County, 2011). In 1938, Pinellas County purchased the island for $12,500. In 1941, the Federal government purchased the property back for use as a bombing range. The County regained ownership of the island in Fort De Soto Park opened in 1962 after the completion of the Pinellas Bayway, which connected the island to the mainland (Pinellas County, 2011). In 1964, an L-shaped groin was constructed at the south end of the island (Figure 3-38a) and the back bay area was dredged in order to nourish the beach. Figure Mullet Key Structures a) L-shaped groin b) revetment. The Mullet Key Beach Erosion Control Study was authorized in A General Design Memorandum was released by the USACE in 1971 (USACE, 1971). The recommended design included the use of a shore parallel borrow area (Figure 3-39) and construction of a 60-foot wide berm. Federal nourishment projects using the offshore borrow area were constructed in 1973 and The 1973 project included the construction of a 1,150-foot long revetment at the south bend of the island (Figure 3-38b). The Mullet Key Federal shore protection project was reportedly deauthorized in 1990 as a result of a lack of funding obligations (USACE, 2010; USACE, 2009; FDEP, 2008). WRDA 1986 (Public Law ) deauthorized projects that had not received obligations of funds in the preceding 10 years. However, a reference to the Mullet Key Beach Erosion Control Project was not found in the Federal Register or the WRDA 1988 (Public Law ) (as referenced by the USACE (2010)). 3-40
 In response to erosion on the island, Pinellas County partnered with the USACE on a beneficial use of dredged material project at Fort")
 (Squires, 2011; Pinellas County, 2010; FDEP, 2008).")
107 Figure Shore Parallel Borrow Area Offshore of Mullet Key (USACE, 1971) In response to erosion on the island, Pinellas County partnered with the USACE on a beneficial use of dredged material project at Fort De Soto Park in Dredge spoils from Tampa Bay were placed on Fort De Soto Park and Egmont Key. Between 100,000 and 350,000 cubic yards were placed by Bean Stuyvesent and Wilkinson & Jenkins (exact volumes listed in references were conflicting) (Squires, 2011; Pinellas County, 2010; FDEP, 2008). In 2007, the L-groin terminal structure adjacent to the pier was rehabilitated (Pinellas County, 2010). Hurricane Pass The Hurricane of 1921 breached Hog Island (a composite of Caladesi Island and Honeymoon Island) and formed Hurricane Pass (Figure 3-40). The ebbdominated pass increased in size until the construction of the causeways (Barnard, 1998). The causeways effect on the tidal prism and the northern migration of the Caladesi Island spit has since reduced the size of the pass Figure Hurricane Pass (PCPA, 2011)
 and 2007 (Phase I of the Honeymoon Island Restoration project, 140,000 cubic yards) with the placement of dredge spoils on")
108 Hurricane Pass has been a sand source for Honeymoon Island since it was first dredged in 1969 (Taylor, 2001). A non-federal navigation channel was dredged through the pass in Maintenance dredging of the pass occurred in 2000 (12,500 cubic yards) and 2007 (Phase I of the Honeymoon Island Restoration project, 140,000 cubic yards) with the placement of dredge spoils on Honeymoon Island (FDEP, 2008). The Florida Department of Environmental Protection Division of Recreation and Parks and Pinellas County have applied for a joint coastal permit to construct Phase II of the Honeymoon Island Beach Restoration project and use the Hurricane Pass ebb shoal as a borrow area. Approximately 110,000 cubic yards is planned to be dredged from the ebb shoal in Note: In 2001, the County was issued a permit from the USACE (Permit No IP-TF) to dredge a non-federal navigation channel in Hurricane Pass, designed by Moffat & Nichol Engineers (50 feet wide, depth of -7 feet mean low water with 1-foot overdredge) (USACE, 2001). The project was completed in 2002 (Squires, 2012). Clearwater Pass Clearwater Pass, the inlet bordered by Clearwater Beach Island and Sand Key (Figure 3-41), was known as Little Pass in the late 1800s (Pinellas County Government Online, 2008b). The pass increased in width from approximately 300 feet to over a half a mile wide after the Hurricane of Over the next 50 years, the channel narrowed and deepened in response to changes in the tidal prism and the northern migration of Sand Key (Pinellas County Government Online, 2008b). The depth of the channel increased from 10 to 20 feet in the late 1960s, scouring bridge pilings and threatening the stability of the structure (Pinellas County Government Online, 2008b). In response, the City of Clearwater constructed a curved jetty on the south Figure Clearwater Pass (PCPA, 2011) side of Clearwater Pass (Sand Key) to stabilize the pass in 1975 (Pinellas County Government Online, 2008b) (Figure 3-42). In 1982, the City of Clearwater constructed an 800-foot long jetty at the south end of Clearwater Beach Island where a rubble mound had previously been placed in 1963 (USACE, 1984b). 3-42
. Dredged material was disposed of in the gulf and the Intracoastal Waterway (FDEP, 2008).")
. The USACE has been responsible for maintaining and stabilizing the channel. However, the City of Clearwater has conducted some maintenance dredging.")
, adjacent to the south end of Clearwater Beach Island (FDEP, 2002; Mora,")
109 Figure Clearwater Pass in 1970, 1975 and 1980 (left to right) (Tackney & Associates, Inc., 2006) The initial dredging of the navigation channel was completed in 1961 (USACE, 2010). The design channel is 8 to 10 feet deep, 100 feet wide and 850 feet long (USACE, 1986; 2010). Dredged material was disposed of in the gulf and the Intracoastal Waterway (FDEP, 2008). Maintenance dredging of the channel has since occurred in 1974 (126,000 cubic yards), 1977 (186,000 cubic yards), 1994 (6,000 cubic yards) and 2002 (Taylor, 2001; Pinellas County Government Online, 2008b). The USACE has been responsible for maintaining and stabilizing the channel. However, the City of Clearwater has conducted some maintenance dredging. For example in 2011, the City of Clearwater approved the dredging of 70,000 cubic yards at a cost of $1,000,000 to allow navigation from Clearwater Beach Marina to Clearwater Pass (Harwell, 2011). Approximately 40,000 cubic yards of dredged material was placed in the nearshore (between -8 feet NGVD and -12 feet NGVD), adjacent to the south end of Clearwater Beach Island (FDEP, 2002; Mora, 2012). The work was completed in 2012 by a USACE dredging vessel (Harwell, 2011). The USACE holds the joint coastal permit to conduct the maintenance dredging (FDEP Permit No JN). On November 15, 2011, a statutory time extension was granted to postpone the expiration of the permit from January 15, 2012 to January 15, In 1986, a group of property owners on the north side of Clearwater Pass sponsored the construction of five rubble mound groins (Figure 3-43). The purpose of the groins was to stabilize the shoreline and prevent the fill placed in 1984 by the City of Clearwater from migrating east. A dredge and fill permit (DF-635) was issued by the Pinellas County Water and Navigation Control Authority for one of these groins (the other four were located outside of the Authority s jurisdiction at that time). In 2006, the South Beach Association, consisting of six resort owners, applied for a joint coastal permit to modify three of the existing groins and construct one new groin and eight pre-filled breakwaters (Tackney & Associates, Inc., 2006). The project is still in the permitting process and no new information has been provided to the state since August The Association also presented their proposal to Pinellas County at that time. Concerns were raised by County staff about aspects of the project and a formal application was never submitted (Squires, 2011). There is no erosion control line in the project area. The Coastal Construction Control Line terminates at the Gulfview Resort. A public easement exists 3-43
 John s Pass is a mixed energy federally maintained navigation channel with a large ebb-tidal delta, adjacent to Sand Key and Treasure")
.")

110 for the land more than 50 feet water-ward of the property owners bulkheads (underwater in 2011) (Tackney & Associates, Inc., 2006). John s Pass Figure Rubblemound Groins on North Side of Clearwater Pass (CPE, 2010) John s Pass is a mixed energy federally maintained navigation channel with a large ebb-tidal delta, adjacent to Sand Key and Treasure Island (Figure 3-44) (Wang and Beck, 2012). John s pass has continually become the dominant inlet, over Blind Pass, capturing the majority of the tidal prism (Wang and Beck, 2012). Bypassed sediment accretes at the ebb shoal attachment point just south of Sunshine Beach (Wang and Beck, 2012). The channel was cut during the Gale of 1848, a severe storm with storm surge of approximately 15 feet (Coastal Tech, 1993; Dunn and Miller, 1964). In 1926, the causeway connecting Long Key to the mainland was constructed, reducing the Figure John s Pass (PCPA, 2011) hydraulic efficiency of Blind Pass and increasing flow through John s Pass (USACE, 1970). After the artificial closure of Indian Pass by the USACE (5 miles to the north) in 1929, John s Pass migrated south 700 feet and widened 80 feet from 1939 to 1948 (USACE, 1970). The channel continued to increase in volume during the 1950s as a result of the construction of the causeways and dredge and fill operations in the bay (USACE, 1970). 3-44

111 To reduce erosion from the south end of Sand Key, the City of Madeira Beach constructed a rubble mound terminal groin on the north side of John s Pass in 1960 (USACE, 1970). To reduce erosion on the south side of John s Pass, local interests sponsored the dredging of a newly formed northern channel and disposal of material into the shoaling southern channel, effectively closing the southern channel. Despite the shoaling, sand was effectively bypassing the inlet and being stored in the offshore southern ebb shoal during this time. In 1961, the shoal was observed to migrate towards the shore, simultaneously forcing the swash channel closer to shore. As a result, the previously accretional north end of Treasure Island began eroding (USACE, 1970). In 1966, the first Federal navigation project was constructed in John s Pass (USACE, 1970). The dredge spoils were placed on the offshore bar, southwest of the inlet. The dredged material eventually merged with the two shoals to form a single bar (Figure 3-45). As the bar migrated onshore, the influence of the swash channel contributed to continued erosion on the north end of Treasure Island (USACE, 1970). However, once the crescent shaped bar attached to the shore (forming O Brien s Lagoon), the area was considered accretional. In 2000, a terminal groin was constructed by Durocher Dock & Dredge of Jacksonville on the south side of John s Pass (Treasure Island) (SPTO, 2000). The function of the jetty is to reduce erosion and force the swash channel further offshore. Figure Crescent Bar Migrating Towards Treasure Island in October 1969 (CPE, 1992) Maintenance Dredging Federal maintenance dredging of John s Pass occurred in 1966, 1979, 1981, 1983, 1991, 2000 and 2010 (Table 3-5). Shoaling rates have decreased since the initial dredging from 22,000 cubic 3-45
112 yards per year to 11,000 cubic yards per year (Coastal Tech, 1993; Taylor, 2001). The low rate of shoaling has resulted in the postponement of schedule dredging projects. To further delay projects, navigation aids have been moved to deeper waters to maintain navigable waters. 3-46
113 Year 1926 to Table 3-5. Coastal Management Projects in John s Pass Description of Coastal Shoaling Rate Management Project 20,000 to 22,000 cy per year Local dredging of 30,000 cy from the north side of the pass for placement on the south end of Sand Key Construction of 460-foot long jetty on north side of John s Pass (Sand Key) by City of Madeira Beach Locally sponsored infilling of southern channel w/fill dredged from newly formed northern channel (15,000 cy) Initial Federal dredging of 77,650 cy placed on offshore bar Construction of a 920-foot long revetment along south bank of John s Pass 1979 Federal maintenance dredging of 80,000 cy ,000 cy per year 1981 Federal maintenance dredging of 70,000 cy 1983 Federal maintenance dredging of 80,000 cy 1985 to Dredging of 529,150 cy from John s Pass ebb shoal for Redington Shores nourishment 1991 Federal maintenance dredging of 56,000 cy 2000 Construction of 760-foot long jetty on south side of John s Pass (Treasure Island) 2000 Federal maintenance dredging of 390,000 cy 11,000 cy per year 2010 Federal maintenance dredging of 252,683 cy (Coastal Tech, 1993; FDEP, 2008; ASBPA, 2009; Pinellas County, 2010) A permit for maintenance dredging was issued to the USACE on March 29, 2010 and expires on March 29, 2020 (FDEP Permit Number: JC). The permitted dredging includes maintenance of the authorized channel and widening the seaward end of the channel an additional 225 feet. The authorized channel is 6 to 10 feet deep, 100 to 150 feet wide. The total project length is 2.6 miles. The authorized dredge depths of the channel, northeastern subarea of the ebb shoal borrow area and southwestern subarea of the ebb shoal borrow area are feet NAVD, feet NAVD and feet NAVD, respectively. Spoil may be placed 1) at Sunshine Beach (R-126 to R-129, 160,000 cubic yards per event) and 2) south of 97 th Street (R- 136 to R-141, 200,000 cubic yards per event) (FDEP, 2010). 3-47


114 Scour In line with the net direction of littoral transport, the channel in John s Pass migrates to the south side of the pass. The armoring of the south side of the pass with a jetty and seawall prevents the channel from migrating further south. As a result, the channel deepens. The 1998 Scour Evaluation Report produced by the Florida Department of Transportation has suggested the south side of the pass may deepen by 25 feet before an equilibrium state is reached. The report recommends planning for any future coastal projects in the area must consider the critical scour elevations of the bridge piles. Dredging of the inlet is expected to have a temporary effect and not expected to increase the equilibrium depth of the inlet (FDOT, 1998). A new three-lane bridge was constructed over John s Pass, adjacent to the existing bridge, between 2006 and 2009 which may have altered the erosional and depositional patterns in the inlet since the FDOT study. Since the construction of the new bridge over John s Pass, shoaling has occurred on the north side of the pass (Figure 3-46) (CPE, 2010). The shoaling may affect the navigation of vessels traveling outside of the channel. Areas outside of the authorized channel are not eligible for federal maintenance dredging under existing agreements, authorizations and permits. Figure John s Pass a) January 2006 without visible shoaling along north side of pass b) John s Pass in 2010 with visible shoaling adjacent to marina (CPE, 2010) John s Pass Inlet Management Plan Coastal Technology Corporation developed an inlet management plan for John s Pass in 1993 (Coastal Tech, 1993). The inlet maintenance and alternative bypassing systems evaluated include: Do Nothing Inlet Closure Alternative Bypassing Systems 3-48

115 o Construction of a north jetty and excavation of a deposition basin adjacent to the jetty o Channel maintenance dredging with use of Pass-A-Grille or Egmont Key borrow sediments to offset inlet impacts o Channel maintenance dredging and use of ebb shoal as borrow area o A fixed dredge plant at the north groin to transfer sand to Treasure Island o Jet pump system o Mobile bypassing plant o Construction of a terminal groin on the south side of the pass The recommended Comprehensive Management Plan included continued maintenance dredging of the channel as needed funded by the Federal sponsor, the construction of a terminal groin on the south side of the pass if eligible for Federal funding, and the placement of dredge spoils where needed after construction of the terminal groin. The terminal groin was constructed in 2000 using state and local funds and federal maintenance dredging has occurred in 2000 and 2010 (Table 3-5). Blind Pass Blind Pass flows between Treasure Island and Long Key (Figure 3-47). Blind Pass is a wavedominated inlet with a characteristic 90-degree bend (Wang and Beck, 2012). The bend causes weak ebb flushing and contributed to the historic southern migration of the inlet (Wang and Beck, 2012). After the formation of John s Pass in 1848, Blind Pass destabilized and migrated almost a mile south (CPE, 1992). Small passes opened north of Blind Pass but were filled naturally or with dredge spoils. In the 1950 s, the construction of the causeways and engineered islands built by dredge and fill operations in the bay caused a severe reduction in the backbay open water area and tidal prism (CPE, Figure Blind Pass (PCPA, 2011) 1992; Wang and Beck, 2012). The Blind Pass ebb shoal destabilized and migrated to shore during this time. The ebb shoal amalgamation was a singular episode of sand bypassing, dissimilar to the continuous sand bypassing that occurs at John s Pass (Wang and Beck, 2012). The shoreline just north of Upham Beach accreted significantly as the shoal moved onshore. The migration of the pass and change in tidal prism have resulted in an extension in Treasure Island, the accretion of St. Pete Beach, the migration and/or degradation of the ebb shoals, and erosion of beaches previously protected by the ebb shoals (Upham Beach) (CPE, 1992). 3-49
 (CPE, 1992).")
.")
.")
116 Blind Pass was an unstable inlet that could not maintain its cross-section, despite the use of stabilization structures (Figure 3-48). The pass is fully armored by jetties, revetments and seawalls. Terminal groins were constructed on the south and north sides of Blind Pass in 1937 and 1962, respectively, by the local municipalities to stabilize the inlet (Table 3-6) (CPE, 1992). The terminal groins were extended, raised and modified over the years. Despite the structural stability, the pass closed naturally several times (last reopened in 1979 when dredged for nourishment of Long Key). The closure of the pass is evidence of high rates of shoaling suspected to be related to a reduced tidal prism. The estimated shoaling of Blind Pass in 1960 was 30,000 cubic yards per year (USACE, 1980b). Shoaling of the inlet has provided a sand source for Federal nourishment projects on Treasure Island and Long Key. Dredging of the pass is necessary to maintain navigation. Approximately 1.6 million cubic yards of material was dredged from Blind Pass for the nourishment of Treasure Island (1964 to 1983) and Upham Beach (1975 to 2010). Figure Blind Pass Aerials from 1960, 1978, 1991 (in order from left to right) (CPE,1992) Impact of 1993 Tampa Bay Oil Spill on Blind Pass In 1993, two tanker barges collided resulting in the release of 330,000 gallons of No. 6 fuel oil, 32,000 gallons of Jet A diesel and an unknown quantity of gasoline into lower Tampa Bay (Featherstone et al., 2009). A few days after the spill, a storm drove oil into inlets and onto the beaches. Some of the oil reportedly sank, depositing in mats in the depressions of Blind Pass and Boca Ciega Bay. In preparation for the maintenance dredging of Blind Pass in 1999, geotechnical borings were collected from the pass. Oil was not observed in the borings, with the exception of one sample smelling of oil. Blind Pass was dredged in 2000 and 50 gallon pockets of petroleum hydrocarbons were discovered. Dredging of the pass continued in an effort to remove the oil (2,000 gallons of oil/water were recovered) (Featherstone et al., 2009). Oiled sediments were placed unintentionally along several sections of Long Key. Dark bands of oil cohesive material were observed in the scarp and large clumps of oiled material were observed in the swash zone (Figure 3-49). An attempt to remove the oiled material was made in 2003 and the scarps were regraded. Some of the cohesive material remained (Saint John, 2004). 3-50
 a) Dark cohesive bands of oiled sediments in scarp (2004) b) Clumps of oiled material in swash zone (2003) As a result of the discovery of oil during")

117 Figure Oiled Sediments on Long Key (Saint John, 2004) a) Dark cohesive bands of oiled sediments in scarp (2004) b) Clumps of oiled material in swash zone (2003) As a result of the discovery of oil during past dredging events, the 2004 Joint Coastal Permit required measures to detect the presence of an oil sheen during night time dredging, measures to contain sheen, measures to detect and avoid placement of contaminated material on the beach and an oil spill contingency plan if oiled sediments were placed to be included in the final plans and specifications. Blind Pass Inlet Management Plan CPE developed an inlet management plan for Blind Pass in 1992 (CPE, 1992). The plan evaluated management alternatives including Closing the inlet o No Action o Remove jetties and fill channels o Nourish Upham Beach from an offshore source Implementing Sand Bypassing Systems o Dredge Blind Pass and nourish Upham Beach every 6 years o Construct a groin field at Upham Beach, dredge Blind Pass, nourish Upham Beach every 6 years o Dredge Blind Pass and deposition basin and nourish Upham Beach every 4 years o Purchase and operate a dedicated dredge o Crane mounted jet pump on Treasure Island Beach o Jet pump/ fluidizer system in the inlet o Dredge Blind Pass every 6 years and nourish Upham Beach every 3 years o Construct detached breakwaters at Upham Beach and dredge Blind Pass and nourish Upham Beach every 6 years Pinellas County initially selected the second option for implementing a sand bypassing system including constructing two groins at Upham Beach, dredging Blind Pass, and placing 172,000 cubic yards of sand initially and maintenance fill every 6 years (Terry, 1993). However, this plan was not implemented. 3-51
118 In , five temporary geotextile T-head tubes were constructed at Upham Beach on Long Key, south of Blind Pass, to control erosion. The success of the temporary groins prompted the design and permitting of permanent structures. In October 2012, FDEP-BIP's issued a joint coastal permit authorizing the replacement of the five temporary geotextile tubes with four limestone rock T-head groin structures (see Section 3: Long Key, Upham Beach). Environmental Resources Blind Pass has several artificial reefs approximately one mile offshore. The reefs were constructed out of automobile tires in a semi-circle (Mehta et al., 1976). Year Table 3-6. Coastal Management Projects in Blind Pass Description of Coastal Shoaling Rate Management Project 1926 Construction of Blind Pass bridge Construction of a 90-foot long low groin along the south side of Blind Pass (Long Key) and dredging of channel Landward extension of south groin (Long Key) Construction of 425- foot groin on north side of Blind Pass (Treasure Island) Dredging of 10,000 cubic yards for placement at Sunset Beach Federal dredging of 108,000 cubic yards of fill from Blind Pass to nourish Treasure Island after Hurricane Gladys Federal dredging of 230,000 cubic yards Seaward extension of south groin to a total length of 261 feet (Long Key) City of St. Petersburg Beach dredges 75,000 cubic yards of material for placement at Upham Beach 30,000 cubic yards per year 3-52
119 1976 Extension of north groin (Treasure Island) 1978 Blind Pass closed naturally North groin was raised 2.5 feet (Treasure Island) Federal dredging of 50,000 cubic yards to nourish Sunset Beach Dredging of 253,000 cubic yards of sand from Blind Pass for placement at Upham Beach (cost $780,000) Extension of north groin by 520 feet (Treasure Island) Federal dredging of 220,000 cubic yards of sand from Blind Pass ebb shoal for nourishment of Treasure Island Construction of a 315-foot long breakwater, attached to south groin (Long Key) Federal dredging of 75,000 cubic yards of material from Blind Pass to nourish Treasure Island Federal dredging of 280,000 cubic yards of material from Blind Pass to nourish Long Key Federal dredging of 309,000 cubic yards, placed at Upham Beach Blind Pass South Terminal Groin Modification Federal dredging of 160,000 cubic yards, placed on Upham Beach (USACE, 1950; CPE, 1992; Taylor, 2001) 47,000 cubic yards per year 3-53
. A jetty was constructed by the City of St. Petersburg Beach (now St.")
120 North Channel, Pass-A-Grille Pass North Channel, Pass-A-Grille Pass flows between Long Key and Shell Key (Figure 3-50). The inlet is dominated by tides and influenced by waves. The inlet is skewed to the south as a result of the net longshore transport in the area (Elko, 2006). A jetty was constructed by the City of St. Petersburg Beach (now St. Pete Beach) on the north side of the pass (Long Key) to reduce erosion from Pass-A-Grille beach to the inlet. Although, sand continues to bypass the jetty via a nearshore sandbar, the strong tidal flow maintains the navigable water depths in the channel (Elko, 2006). Figure Pass-a-Grille Pass (PCPA, 2011) The channel was federally authorized as a navigation project in 1964 under the 1960 River and Harbors Act. The first Federal navigation project was completed in 1966 (Table 3-7). Dredging has occurred twice since the initial navigation project to provide sand for the Federal Shore Protection projects on Treasure Island. However, maintenance dredging has not been required to maintain navigable depths (FDEP, 2008). North Channel, Pass-A-Grille Pass does not have an inlet management plan. The USACE did not hold a permit to dredge the navigation channel in Pinellas County does hold a Joint Coastal Permit to dredge the pass as part of the Federal Shore Protection Project, which expires May 17, Table 3-7. Coastal Management Projects in North Channel, Pass-A-Grille Pass Description of Coastal Annual Year Management Project Shoaling Rate Construction of rubble mound jetty on north side of 1960 North Channel, Pass-A-Grille Pass by City of St. Petersburg Beach 1960 Dredging of 160,000 cubic yards of material Federal authorization for navigation project at North Channel, Pass-A-Grille Pass; channel is 8-10 feet deep and 100 to 150 feet wide (1960 River and Harbors Act) Extension of north jetty and addition of fishing platform by City of St. Petersburg Beach Federal navigation project completed, 205,650 cubic yards of material dredged (cost of $63,508) 3-54
 Federal dredging of 590,000 cubic yards of material for 2004 placement on Treasure Island and Upham Beach (Taylor, 2001; FDEP, 2008; Elko, 2006).")
121 Rehabilitation of north jetty by local interests Federal dredging of 520,000 cubic yards of material for placement on Treasure Island and Upham Beach after Hurricane Elena (cost of $435,357) Federal dredging of 590,000 cubic yards of material for 2004 placement on Treasure Island and Upham Beach (Taylor, 2001; FDEP, 2008; Elko, 2006). 20,000 cubic yards South Channel, Pass-A-Grille Pass (Shell Key Pass) South Channel, Pass-A-Grille Pass (also referred to as Shell Key Pass) is a small tidal pass in between Shell Key and Colony Key that flows in a north-south direction into North Channel, Pass-A-Grille Pass (Figure 3-51). The channel width is approximately 60 feet and 8 to 10 feet deep. In 2011, a large sand bar had developed on the southwest side of the channel in an area protected by the Shell Key spit. Observations of the flow velocities in the pass in March 2011 suggest it is unlikely to close naturally (CPE, 2011). Continued shoaling of the pass has raised concerns for navigation through the pass by local residents. Two small marina facilities and twenty-eight residents have docks within one mile of the pass. Figure South Channel (Shell Key Pass) (CPE, 2011) Colony Key has four rubble mound groins varying in length from 30 to 90 feet along the east side of South Channel (Shell Key Pass) (Figure 3-51). The northernmost groin has a submerged attached breakwater. In 2007, Colony Key was cleared for development and the shoreline between the groins was armored with revetments. In 2011, homeowners on Tierra Verde (the island facing the landwardside of Shell Key) received a permit to dredge South Channel (Squires, 2012). Prior to dredging, the County must be notified. 3-55
. As of September 2012, these recommendations have not been implemented.")
122 To gain an understanding of the coastal processes occurring in the area, CPE recommended surveys of the channel and shorelines, a review of historic aerial photography, monitoring of water quality and predictive modeling in an observation report dated March 2011 (CPE, 2011). As of September 2012, these recommendations have not been implemented. Bunces Pass Bunces Pass is a natural (un-engineered) tide dominated inlet that flows between Shell Key and Mullet Key (Figure 3-52). The shape, size and orientation of the inlet have not changed in the past 130 years (Willhoit, 2004). Strong ebb tidal currents and a large tidal prism are responsible for keeping the pass in equilibrium and supporting the formation of a large elongated ebb shoal. The entrance to the pass is shallow and unmarked. Bunces Pass is not considered a navigable waterway; however, skilled boaters do travel through the pass. Depths in the pass vary from 4 to 35 feet. Summary of Known Borrow Areas Figure Bunces Pass (PCPA, 2011) The barrier islands in Pinellas County have a history of serious shoreline erosion caused by storms, wave action and currents. In an attempt to control this erosion and increase storm protection, fill material has been placed at several locations along the Pinellas County shoreline. Early nourishment projects were constructed using sediment excavated from Pinellas County s inlets and ebb shoals, shore-parallel nearshore borrow areas, bay areas, and upland sources. 3-56
123 Existing Borrow Areas A brief history outlining the development of Pinellas County s existing borrow areas is provided below. Table 3-8 summarizes the characteristics and status of these borrow areas. The locations of existing borrow areas are provided in Figure USACE Sand Resource Survey In 1994, the U.S. Army Corps of Engineers (USACE) conducted a sand resource survey offshore of Sand Key to identify sand resources to be used as borrow areas for future nourishment projects. Over the course of the survey, they identified nine (9) study areas (Study Areas A-I) containing potentially beach compatible material. The locations of these nine (9) areas are shown in Figure Further analysis of these areas led to the development of twenty (20) potential borrow areas. These borrow areas were developed by the USACE in CPE Constructability Analysis In 2007, Pinellas County requested that CPE re-evaluate the USACE data for dredgeability and beach compatibility (Forrest et al., 2007). The borrow areas designed by the USACE in 2004 were re-analyzed and revised using current FDEP-BIP's sediment quality standards and guidelines. Core logs from each study area were reviewed and a 2-ft buffer was placed above any obviously unsuitable material. Material that was considered unsuitable included >5% silt, >5% gravel, green clay, brown sandstone, etc. The revised cut elevations were compared to NOAA bathymetry to estimate the thickness of potential beach quality material in each borrow area. The limits of each USACE designed borrow area were then refined to encompass only areas thick enough to efficiently dredge, and thereby imposing a minimum 2-ft cut thickness. Each borrow area was further refined to include only areas having a minimum 150-ft wide swath, which is the space required for most cutterhead dredges to operate efficiently. Based on CPE s re-evaluation of the USACE data, the three (3) most promising sources of beach compatible material were Study Areas C, D and H. Study Area C This study area is located 5 to 7 miles west of R-60, off the northern end of Sand Key. It is a broad, low-relief sand shoal located under 19 to 30 ft of water. Study Area C covers an area of 419 acres. A total of twenty-seven (27) vibracores were collected from Study Area C (twentyfive (25) cores from Ardaman & Associates and two (2) cores from USGS). The material is described as a gray, fine to coarse grained, poorly graded carbonate sand with trace sand and gravel. Two (2) borrow areas were developed by the USACE in Study Area C in Borrow Area C- West consisted of eleven (11) dredge cuts with elevations ranging from -23 ft MLW to -32 ft MLW. Borrow Area C- East consisted of three (3) dredge cuts with elevations ranging from -22 ft MLW to -25 ft MLW. 3-57
124 Study Area Approximate Location Estimated volume of beach compatible material (cubic yards) Mean Grain Size Range (mm) Table 3-8. Summary of Known Borrow Areas Average Silt Wet Color/ Water Carbonate Content Munsell depth Content (%) Values (ft) (%) A 7 miles offshore of Sand Key 26, Light Gray -20 to -30 B C D 7 miles offshore of northern Sand Key 5 miles offshore of northern Sand Key 2 miles offshore of northern Sand Key 85, Gray -20 to , Gray -19 to , to to to to to -23 E 3 miles offshore of Sand Key Gray -14 to -17 F 3 miles offshore of Sand Key 88, Gray -16 to -25 G 1 mile offshore of Sand Key 63, Gray -10 to -20 H 3 miles offshore of Sand Key 817, to and to to to -20 I 3 miles offshore of Sand Key 86, Gray -15 to -20 J 5 miles offshore of Sand Key 305, to -28 K L 7 miles offshore of northern Sand Key 12 miles offshore of northern Sand Key in Federal waters , to -52 Egmont Channel Shoal 3.5 miles offshore of Mullet Key 4,600, to John's Pass, Blind Pass, Pass-A- Ebb Tidal Shoals unknown unknown unknown unknown unknown unknown Grille north, Pass-A-Grille south Additional Potential ebb shoals, shoreface sands, unknown unknown unknown unknown unknown unknown Offshore resources sand ridges 1 Estimated volumes of dredgeable material based on 2007 CPE recommendations 2 Estimated volumes of dredgeable material based on 2009 CPE borrow area development 3 Estimated volume remaining after the 2012 Sand Key nourishment. Borrow Area Development 2 borrow areas developed by USACE in 2004 based on reconnaissance data; revisions recommended by CPE in borrow area developed by USACE in 2004 based on reconnaissance data; revisions recommended by CPE in borrow areas developed by USACE in 2004 based on reconnaissance data; revisions recommended by CPE in borrow areas developed by USACE in 2004 based on reconnaissance data; revisions recommended by CPE in 2007; reconnaissance and design level data collected in 2008; diver verification of hardbottom conducted in 2008; 3 borrow areas designed by CPE in borrow area developed by USACE in 2004 based on reconnaissance data; revisions recommended by CPE in borrow areas developed by USACE in 2004 based on reconnaissance data; revisions recommended by CPE in 2007; reconnaissance and design level data collected in 2008; diver verification of hardbottom conducted in borrow areas developed by USACE in 2004 based on reconnaissance data; revisions recommended by CPE in 2007; reconnaissance and design level data collected in 2008; diver verification of hardbottom conducted in borrow areas developed by USACE in 2004 based on reconnaissance data; revisions recommended by CPE in 2007; reconnaissance and design level data collected in 2008; diver verification of hardbottom conducted in 2008; 3 borrow areas designed by CPE in borrow area developed by USACE in 2004 based on reconnaissance data; revisions recommended by CPE in 2007; reconnaissance level data collected in 2008 potential sand resource identified during 2008 reconnaissance investigation; 1 borrow area developed by CPE in 2009 potential sand resource identified during 2008 reconnaissance investigation; no borrow area development potential sand resource identified during 2008 reconnaissance investigation; 1 borrow area developed by CPE in borrow areas exist (West and East); borrow area delineation has not changed since 1980 borrow areas have been developed and used numerous times in the past some geophysical and geotechnical data exist; no borrow area development Borrow Area Permit Status None permitted None permitted None permitted None permitted None permitted None permitted None permitted None permitted None permitted None permitted None permitted Permitted and scheduled for 2012 use Egmont West's permit is expired; Egmont East was not permitted unknown None permitted Recommendation Require additional investigation Require additional investigation Require additional investigation Permit/re-evaluate as needed Require additional investigation Require additional investigation Require additional investigation Permit/re-evaluate as needed Require additional investigation Permit/re-evaluate as needed Require additional investigation Will require post construction survey quantify volume remaining Permit with possible design-level investigation. Re-permit/Re-evaluate as needed Require additional investigation 3-58

125 Figure Map of current potential borrow areas (Map compiled from Dial Cordy and Associates, 2007; Forrest et al., 2009; and GEC, 2011). 3-59
126 CPE recommended refining Borrow Area C-West to include five (5) smaller areas with cut elevations ranging from -27 ft MLW to -32 ft MLW. Borrow Area C-East did not contain any dredgable sediment based on CPE s review. Based on the recommendations made the estimated volume of dredgable material in Study Area C is 326,400 cy. It should be noted that Area C- West has not been cleared for potential cultural resources or hardbottom. Thus, no buffers have been applied and potential volume estimates may be further reduced. Study Area D Study Area D is located approximately 2 miles offshore from the northern end of Sand Key, in water depths ranging from -14 to -23 ft. (NAVD88). Four (4) borrow areas were developed by the USACE in or around Study Area D in Borrow Area D- Southwest consisted of three (3) dredge cuts with elevations ranging from -20 ft MLW to -21 ft MLW. Borrow Area D- Southeast had one (1) dredge cut to elevation -19 ft MLW. Borrow Area D- Northwest consisted of three (3) dredge cuts with elevations ranging from -19 ft MLW to -23 ft MLW. Borrow Area D- Northeast consisted of five (5) dredge cuts with elevations ranging from -16 ft MLW to -32 ft MLW. Based on the recommendations made by CPE, Borrow Area D-Southwest should be reduced in size to four (4) smaller areas with dredge cut elevations ranging from ft MLW to ft MLW. Borrow Area D-Southeast should be reduced in size and have a dredge cut elevation of ft MLW. It is recommended that Borrow Area D-Northwest be reduced to three (3) smaller areas with dredge cut elevations at ft MLW. Borrow Area D-Northeast should be reduced to six (6) smaller areas with dredge cut elevations that range from ft MLW to ft MLW. Based on the recommendations made, the estimated volume of material in Study Area D is 467,400 cy. Study Area H Study Area H is located approximately 3 miles offshore from Sand Key, with water depths ranging from approximately -11 to -20 ft. (NAVD88). Five (5) borrow areas were developed within this study area in Borrow Area H- Southeast consisted of two (2) dredge cuts with elevations ranging from -16 ft MLW to -18 ft MLW. Borrow Area H- Northeast consisted of four (4) dredge cuts with elevations ranging from -17 ft MLW to -19 ft MLW. Borrow Area H- North had one (1) dredge cut to -18 ft MLW. Borrow Area H- Northwest consisted of four (4) dredge cuts with elevations ranging from -13 ft MLW to -19 ft MLW. Borrow Area H- Southwest consisted of three (3) dredge cuts with elevations ranging from -16 ft MLW to -18 ft MLW. CPE recommends that Borrow Area H-Southeast should be refined to one (1) smaller area with a cut elevation of -18 ft MLW. Borrow Area H-Northeast should be refined to four (4) areas with elevations ranging from ft MLW to MLW. Borrow Area H-North s one (1) cut should be reduced in size and have an elevation of ft MLW. Borrow Area H-Northwest should be refined to two (2) areas with elevations of -17 ft MLW and -19 ft MLW. Borrow Area H-Southwest should be refined to two (2) areas with elevations of -16 ft MLW and -18 MLW. 3-60
127 Based on the recommendations made, the estimated volume of dredgeable material in Study Area H is 585,600 cy. Borrow Area Development Following the constructability analysis discussed above, Pinellas County directed CPE to collect geophysical data from the northern study areas (USACE Study Areas I and D), central study areas (USACE Study Areas F and G) and southern study areas (USACE Study Area H). In 2008 reconnaissance level data was collected across the five (5) study areas. The survey plan was modified during the reconnaissance survey and design level data was collected within the most promising areas. Vibracores were then collected from the areas most likely to contain the greatest volume of beach quality material (Study Areas D and H). The 2008 investigations confirmed the results of the 2007 constructability analysis. Study Areas D and H contained beach quality material. However, they did not contain significant volumes of material. No additional material was identified within Area G. In response, CPE was contracted by Pinellas County in 2009 to conduct reconnaissance and detailed investigations to identify additional material. Pinellas County directed CPE to conduct a reconnaissance geophysical survey within Study Areas A, B and C, despite the low probability of identifying additional material. Due to the low probability of identifying additional material in these areas, several prominent sand ridges in the vicinity of the USACE Study Areas were also investigated. Vibracores were collected from locations selected based on the results of the reconnaissance geophysical survey. The geophysical data, coupled with analysis of the vibracores was used to determine sediment quality and to ascertain the presence of material unsuitable for dredging. Three (3) new sand resource areas, designated Areas J, K and L, were identified during the reconnaissance investigation. These three (3) areas were presented to Pinellas County and the FDEP-BIP's, who expressed a preference for developing areas J and L. Eight (8) borrow areas that contain potentially beach compatible material were designed in or around areas D, H, J and L. Three (3) borrow areas, containing an estimated 72,000 cy of potentially beach compatible material were developed within Study Area D (Borrow Area D1, D2 and D3). Three (3) borrow areas containing an estimated 817,300 cy of potentially beach compatible material were developed within Study Area H (Borrow Areas H1, H2 and H3). A single borrow area containing 305,300 cy of potentially beach compatible material was developed within Study Area J. A single borrow area containing 1,480,600 cy of potentially beach compatible material was developed within Study Area L. The locations of these eight (8) borrow areas are shown in Figure It is important to note that, Area L was used as the sand source for the 2012 Sand Key nourishment project. Previously Used Borrow Areas For decades, ebb-tidal shoal deposits have been used for beach nourishment projects in Pinellas County. Egmont Shoals is an ebb-tidal shoal located approximately 3.5 miles west of Mullet Key. The shoal covers 1,596 acres and contains an estimated 19 to 23 million cy of sand suitable for beach nourishment (GEC, 2011). Egmont Shoals has been used as a sand source numerous 3-61
128 times in the past for projects including Indian Rocks Beach Nourishment (1990), Indian Shores Beach Nourishment (1992), Treasure Island Beach Renourishment (1996), Long Key Beach Renourishment (1996) and Sand Key Renourishment (1999 and 2005). The Egmont Shoals Borrow Area has also been previously authorized as the borrow area for Clearwater Beach Island and Mullet Key. Egmont Shoals is currently divided into two (2) sections, East and West (Barbara Nist USACE, personal communication, March 23, 2012). Egmont West s permit is currently expired, while Egmont East has never been permitted. After the 2005 Sand Key Beach Renourishment, Egmont West contains approximately 4,600,000 cy of previously permitted beach compatible material (GEC, 2011). The delineation of the borrow area has not changed since 1980 (Elko, 2006). John s Pass, Blind Pass, Pass-A-Grille north, and Pass-A-Grille south ebb-tidal shoals have all been investigated by the USACE and used in the past multiple times. These shoals consist of wide, shallow areas of sand with portions exposed during low tide events. Further investigations are needed to estimate the total amount of sand remaining and beach compatibility. No hardbottom or seagrass has been documented within these ebb shoal areas (DC&A, 2002). John s Pass was used in 1988 for the Redington Beach Nourishment Project. In 2000, John s Pass and Blind Pass were used for the Treasure Island Beach Renourishment Project and the Long Key Beach Renourishment Project. Identification of Additional Potential Offshore Sand Resources Sand resources along the west coast of Florida typically fall within three (3) broad categories: (1) ebb-tidal shoals, (2) shoreface sands and (3) sand ridges. The sediment-starved continental shelf off the central west coast of Florida has traditionally supplied beach quality sediment from ebbtidal shoals and shoreface sands (Finkl et al 2007). Recently, studies of seafloor deposits off west-central Florida indicate the presence of sedimentary environments, such as sand ridges, that warrant further exploration (Locker et al., 2003 and Twichell et al., 2003, Finkl et al 2007). Figure 3-54 shows mapped units including ebb shoals, sand sheets and sand ridges. Ebb-Tidal Shoals Inlets along the west coast of Florida constitute an important source of clean sand for beach nourishment. Ebb-tidal shoals accumulate sediments that are transported by alongshore currents in the surf zone. These high energy conditions result in the accumulation of sediment that is devoid of fines and organic materials, which makes the material suitable for beach nourishment. Most of these inlets have been modified by engineering works including maintenance dredging to improve navigation conditions, sand removal for beach restoration, and stabilization by coastal structures, inlet opening and closure, etc. Even though the tide range is relatively small (less than 3 ft), low wave energy and large back bay (lagoonal) areas contribute to the opening and maintenance of tidal inlets. Additionally, low wave energy facilitates the build-up and maintenance of large ebb-tidal shoals that store large volumes of sand. 3-62

129 Figure Potential sand resources identified offshore of Pinellas County (modified from Finkl et al., 2007) 3-63
130 Shoreface Sands Shoreface sands along the west coast of Florida occur at relatively shallow depths (7 to 20 ft) and are generally thin and discontinuous (Finkl et al., 2007). The extent of these deposits is limited because of the sediment starved nature of the west coast of Florida (Finkl et al., 2007). Although uncommon, there are some sand deposits that blanket shallow (10 to 33 ft) waters. Locker et al. (2003) provide evidence of nearshore sand blankets that are 3 to 13 ft thick located offshore Anclote Key, Mullet Key and Treasure Island. These deposits may be worth exploring for coastal restoration. Sand Ridges Sand ridges generally occur in water depths from 13 to 98 ft and are associated with modern shelf processes and relict geological and geomorphological controls (e.g. bedrock slope) (Finkl et al., 2007). The ridges off the southwest coast may be associated with cuspate forelands and sedimentary headlands or with reworked paleo-ebb tidal shoals and barriers. The ridges are obliquely oriented to the coast, although shore parallel and shore transverse ridges occur in restricted locations (Finkl et al., 2007). The Anclote Ridge Field (Finkl et al., 2007), covers an area of approximately 1,236 square miles, and lies offshore southern Pasco and northern Pinellas counties on the northern portion of the west-central Florida coast. These well-developed ridges range up to 0.6 miles wide and 9 miles in length. Their slightly variable azimuths average about 290, 3 to 12 miles from shore. The Sand Key Ridge Field (Finkl et al., 2007), covers an area of approximately 1,042 square miles and lies offshore from the Indian Rocks headland in Pinellas County. This ridge field contains well-developed sand waves that can reach sizes up to 0.9 miles wide by 6 miles long by 13 ft high. West Central Florida Coastal Studies Project The West Central Florida Coastal Studies Project was an extensive five-year collaborative regional coastal study between the U.S. Geological Survey, the University of South Florida College of Marine Science, the University of South Florida Department of Geology, and Eckerd College. This project was a regional study examining the geologic framework of the west central Florida coastal zone and inner shelf. The primary goal was to understand the natural variability of coastal morphology, seafloor bathymetry, surface sediment distribution and subsurface stratigraphy of the west Florida coastal system. Research efforts focused on the northern half of the west central Florida barrier island coast (Anclote Key to the Venice headland). As part of this project, USGS scientists and collaborators systematically mapped the thickness of sand deposits near the coast through seismic surveys and vibracoring. The first phase was a regional mapping with widely spaced geophysical and sample data that found that most beach 3-64
131 quality sand is concentrated in active ebb-tidal deltas located just off tidal inlets and in long, linear ridges found on the inner shelf. Across the entire study area, bottom samples and core samples were collected and analyzed to develop a map of sea-floor sediment types. USGS scientists and collaborators also completed detailed studies north and south of the entrance to Tampa Bay. Detailed sidescan sonar maps were made of localized areas which were used to understand the variability in sediment distribution of beach-quality sand, carbonate shell material, and hardgrounds. The wealth of geophysical and geotechnical data compiled during this study should be further assessed. This data may help target new potential sites that could be further investigated and developed. Recommendations Pinellas County has a number of options available to address the County s long term sediment needs. CPE s recommendations include the following: Historic National Ocean Service (NOS) bathymetry from the National Oceanographic and Atmospheric Administration (NOAA) covering the nine (9) USACE study areas shows what appear to be a series of prominent sand ridges offshore of Sand Key. These ridges are oriented roughly northwest/southeast and range from approximately 3,000 to 30,000 ft. in length. Several of these fifteen (15) ridges were targeted by the USACE but extended beyond the limits of their study areas. These areas should be further investigated to evaluate their potential for future borrow area development. Similarly, several uninvestigated sand hills are present in Federal waters that have potential for containing beach compatible material. These areas should also be further investigated to evaluate their potential for future borrow area development. Although eight (8) potential borrow areas were identified as a result of the constructability analysis and subsequent 2008 and 2009 sand search investigations, the volume of material in these areas could potentially be increased. o Borrow Area L was dredged in o Three (3) borrow areas were identified in or around Study Area D. The total volume of material identified in this area is 72,000 cy. Because the volume of this material is small, these areas should be considered to supplement other sand sources. o Three (3) borrow areas were developed in area H and one (1) borrow area was developed in area J. These areas contain relatively dark, coarse, high- 3-65
132 carbonate sand having grain sizes ranging from 0.26 to 0.35 mm. The grain size of the material found in areas H and J is coarser than the Egmont Shoal Borrow Area that was used for several previous nourishments. This sand is therefore likely to perform well and require the placement of less material to achieve the same results that would be accomplished using sand from Egmont Shoals and areas L or D. While color was not identified as a requirement as part of the original sand search investigation and was not considered during borrow area design, color and carbonate content of these borrow areas may indeed be an aesthetic concern of importance to local communities as well as a marine turtle nesting issue. The carbonate content is significantly higher, and color of this material is significantly darker than the existing beach. o CPE recommends the design-level investigation of area K as well as reconnaissance level investigations of previously uninvestigated sand hills in order to identify beach compatible sand resources for future Sand Key (and other Pinellas County) shore protection projects. Based on reconnaissance level vibracores, area K contains material similar in quality to that identified in Borrow Area L, making it a promising target for future work. Material may still exist in the Egmont Shoals Borrow Area. Potentially beach quality sediment may also still exist in the ebb shoals at John s Pass, Blind Pass and Pass-A- Grille. These areas should be further investigated. Re-evaluate the geophysical and geotechnical data collected during the West Central Florida Coastal Studies Project to identify potential sand resource that could be further investigated and developed into borrow areas. Artificial Reef Program The Pinellas County Solid Waste Operations Department presently manages a much reduced Pinellas County Artificial Reef Program. Since 1975, Pinellas County Utilities has placed approximately 50,000 tons of clean inert debris offshore to create artificial reefs. The materials used to construct the reefs have evolved over time. Tires were once dumped within a few miles of shore, which led to tires washing up on the beach (TBRPC, 2011). The program, as of 2011, primarily uses concrete construction materials including bridge debris, telephone poles and culverts. The County holds six active permits from the USACE for construction and maintenance of four offshore reefs (20 feet of water, concrete structures and barges) and two deep water reefs (40 to 60 feet of water, large ships). The permits expire in 2018 and 2019 (Mangio, 2009). In 2004, the operational budget of the program was $387,610 funded by Solid Waste Management (Internal Audit Division, 2004). Budget cuts in 2007 led to a reduction in staff and services. At present, the County allocates $60,000 annually for artificial reef related activities (Sea Grant, 2011). Additional funds are provided by the FWC statewide artificial reef program. 3-66
133 Maintenance of the reefs includes replacing ineffective material and repairing buoy markers. Monitoring of the reefs is conducted by volunteers several times a year. In 2009, a study was conducted by the University of Florida and Florida Sea Grant to evaluate income generated by the artificial reefs in six southwest Florida counties including Pinellas County. The study reported more than 1800 people use the artificial reefs daily in Pinellas County and the economic output of the reefs is $75.84 million annually. The study also found that 89% of reef users and 71% of non- reef users supported the use of public funds for the maintenance of artificial reefs (Sea Grant, 2011). Artificial reefs have been discussed as a disposal option for the upcoming demolition of the Friendship Trail (Gandy) bridge. Material may be stored at an upland location prior to disposal to reduce transportation costs. A new reef will not be created for the upcoming project but existing reefs may be expanded in accordance with permit conditions (TBRPC, 2011). Mitigation Reefs The construction of artificial reefs was required as mitigation for impacts related to the 1998 Sand Key Nourishment (FDEP Permit No ). The permit required the construction of 7.95 acres of hardbottom habitat to offset the project s anticipated impact to 5.3 acres of hardbottom. The FDEP-BIP's approved the locations of sixteen artificial reef sites (Figure 3-55). The reefs were to be constructed within two years of the permit issuance. The success of the artificial reefs depended on their biological similarity to the natural hardbottom areas after two years. The permit stipulated additional remedial action would be required if the reefs were unsuccessful after two years and further monitoring would be required until the FDEP-BIP's determined the reefs to be functionally equivalent. Two years after the 1997 permit was issued, only three reefs had been constructed. The remaining reefs were constructed over the next six years ( ). Not until the County began the permit application process for the 2005 Sand Key Nourishment was it discovered that certain biological and physical monitoring requirements from the previous permit had not been satisfied. As-built surveys and post construction video surveys were not conducted for each reef. To address the issues, the County conducted a biological assessment of 14 of the reefs in 2004 (the remaining two reefs were constructed in ). The FDEP-BIP's found the construction and submittals to be in violation of the permit and issued a warning letter on June 1, The County contracted CPE to coordinate with the FDEP-BIP's and develop a biological monitoring and research plan to bring the County s reef mitigation program into compliance. In May 2007, CPE assessed five artificial reefs identified by FDEP-BIP's to be inadequately constructed (believed to consist of exposed rebar and steel). The divers observed some metal in the reefs which may have been exposed due to the deterioration of the concrete (CPE, 2007). The reefs were surveyed again, one year later. Based on the biologists observations, the artificial reefs reached functional equivalency with the natural hardbottom between two and five years post-construction. Ten years after construction, the artificial reefs were observed to contain a community complexity greater than that of the natural hardbottom (Craft and Kruempel, 2007). 3-67
134 Additional monitoring of the reefs has not been required by the FDEP-BIP's. However, a local non-profit organization, Reef Monitoring, has organized a volunteer monitoring program. The organization has been active since Future mitigation would only be necessary if any project has the potential to negatively impact environmental resources. A mitigation plan will be required as part of the permitting process if planned nourishments, structures or activities are likely to impact seagrass beds, hardbottom or other environmental resources. 3-68

135 Figure Artificial reef locations (modified from Craft and Kruempel, 2007) 3-69
136 SECTION 4: NEEDS ANALYSIS AND SCHEDULE OF FUTURE ACTIVITIES We have identified needs and milestones recommended for inclusion in the Coastal Management Program based on the analysis of the historical management and the existing conditions of the CMP elements. A schedule of future activities and planning milestones has been suggested to address erosional hotspots and ensure continuity and consistency in program management (Figures 4-1, 4-2, and 4-3). Funding needs for the period from 2012 to 2018 were estimated based on the anticipated activities and milestones, the Capital Improvement Budget and the FDEP-BIP s 2013/2014 Long Range Budget Plan. The funding needs of each CMP element are summarized in Table A-1, Appendix A. As the political and environmental conditions change, these milestones and funding needs will need to be updated. The analysis of the conditions of the CMP elements suggests the CMP plan should be updated to include the following components, planning milestones and funding apportionments: Program Management Project milestones, funding requirements, and suggested activities for each Coastal Management Plan Program Management items are described below individually. Project Planning The County should continue to identify potential opportunities to align project schedules and save on mobilization costs. By scheduling maintenance dredging and nourishments together, dredge spoils can be used to benefit adjacent beaches. The County needs to analyze the feasibility of aligning schedules for the dredging of Blind Pass and the nourishment of Long Key. Additional cost savings may result from continuing to link projects, i.e. Treasure Island and Long Key for construction. Regional monitoring of the combined projects should also be continued. Policy for Non-Public Beaches Pinellas County contains private beaches that are not included in federal or state projects including Belleair Beach. The County needs to study the value of including or excluding Belleair Shore with the nourishment of Sand Key. The study s findings can then be used to establish and adopt a policy for the case when a non-public section of beach is adjacent to public beaches with plans to be nourished. The best source of funding must also be determined. Emergency Response Storm damage to the beaches and erosion control structures of Pinellas County can trigger the need to perform unscheduled maintenance nourishment or repairs. The County 4-1
137 must be prepared to assess the damage, estimate losses and request emergency funding from state and federal agencies. In order for any non-federal beaches to qualify for FEMA funding, records from monitoring and a beach design template must be kept on file. In preparation for potential application for FEMA funding, the eligibility of nonfederal beaches should be assessed. Emergency response plans for state parks and other non-federal beaches need to be developed. Plans should include a post-storm visual inspection of beaches and structures, reporting to the appropriate agencies, topographic and bathymetric surveys, decision making guidelines for response level and permitting, financing and bidding procedures. Monitoring Monitoring is a key component of Pinellas County s CMP. Nourished beaches are required to be monitored according to permit conditions. Additionally, emergency funding of projects is contingent upon monitoring records. The County has had two-year contracts with USF to survey Sand Key, the mean high water line on several coastal elements, and the Upham Beach T-groin project area. These contracts expire on December 31, 2012, December 30, 2013 and March 30, 2013, respectively. The County must continue to plan for continuous annual physical monitoring in accordance with permits. Sea turtle and shorebird nest monitoring is also required by permit on nourished beaches. At present, CMA is contracted to survey the barrier islands of St. Pete Beach (Upham and Pass-A-Grille beaches only), Treasure Island, Sand Key, and Clearwater Beach during the period between the months of April and October. In addition, the CMA is under contract to provide two lighting surveys to the County per year (in May and late June). The estimated cost for sea turtle and shorebird monitoring annually is $130,000 (Pinellas County Environmental Management, 2009). Data Archive The CMP needs to develop a digital data archive for reports and geotechnical data. Preserving relevant information from plans and studies may prevent the need for duplicative field efforts and potentially reduce front end investigation work. Requesting data in digital format (i.e. CAD files and shape files) from consultants for the archive will be helpful for future design projects and modeling studies. Funding Sources Pinellas County will need to prepare to extend the Penny for Pinellas program and/or pursue alternate funding sources. The ten-year program expires in
138 Overall Program Funding Needs The total expenditure of County funds on coastal management is estimated to be $24,519,410 over the next six years according to the 2012 Capital Improvement Plan FY 2012 through State and federal programs will contribute an additional $25,848,800 and $37,831,619, respectively, according to the FDEP-BIP s FY 2013/2014 Long Range Budget Plan (FDEP, 2012b). The majority of funds are dedicated to the construction of upcoming projects on Sand Key, Treasure Island, Long Key and Honeymoon Island. Additional funds are needed for physical and environmental monitoring, design, permitting, federal reauthorization, programmatic management and evolution, inlet management and coastal research, and other improvements. Management of CMP Elements Project milestones, funding requirements, and suggested activities for each Coastal Management Plan element are described below individually. Anclote Key & Three Rooker Bar No funding is anticipated to be needed for Anclote Key or Three Rooker Bar in the next five years. The undeveloped barrier islands appear to be sustainable systems. Honeymoon Island The County should continue its pursuit of a JCP for Phase II of the Honeymoon Island Restoration (JCP No JC). Construction of Phase II is planned for Phase II of the Honeymoon Island Restoration is expected to be constructed in 2013 at a cost of $5,630,000. Although the project is fully funded by the state, Pinellas County will be required to front the funds and be reimbursed after the completion of the project. Following construction, monitoring will be required by permit. Pinellas County is anticipated to fund 25% of the post-construction monitoring, at a cost of $21,250. For the following four years, Pinellas County will be responsible for 25% of the cost of the physical monitoring required by the permit ($21,250 annually) (CIP, 2012). Offshore sand sources for future Honeymoon Island nourishments need to be identified. The Hurricane Pass ebb shoal was permitted for use in Phase I and Phase II of the restoration; however, alternative offshore resources may be needed in the future. FDEP- BIP's has included a renourishment in 2018 in their long range budget plan (FDEP, 2011b). Borrow area investigations and design need to be completed in time to modify the permit prior to construction. Additionally, Honeymoon Island should continue to be monitored even if not required by permit conditions. Monitoring provides data for design purposes and assists in calculations of sand volume loss due to storms. 4-3
139 Caladesi Island No funding is anticipated to be needed for Caladesi Island in the next five years. Clearwater Beach Island No funding is anticipated to be needed for Clearwater Beach Island in the next five years. Sand Key The last federal nourishment of Sand Key was completed in The cost of the project was $31,540,000. The County s local share (18.6%) was expected to be $5,866,440. Following construction, tilling and monitoring will be required by permit. For the following four years, Pinellas County will be responsible for 50% of the cost of the physical monitoring required by the permit ($75,000 annually according to CIP budget, $70,532 annually if the USF contract is renewed). The subsequent re-nourishment is expected to be constructed in 2019 at a cost of $35 million (62.8% federal, 18.6% state and 18.6% local share). Prior to designing this nourishment, the following should be considered and pursued: A sand source needs to be identified for the next Sand Key project. Borrow Area L was used for the 2012 project. Borrow Area L does not have enough volume for multiple large projects, however, some material remained within Borrow Area L after the 2012 Sand Key project for potential use on smaller volume projects in the future. See Section 3, Summary of Known Borrow Areas for options. An analysis of the coastal processes near the hotspot at the north end of Sand Key (Dan s Island) is necessary to identify management options to slow the erosion rate in the area. The analysis may be part of the development of an inlet management plan for Clearwater Pass. The necessity and feasibility of removing the Redington Beach breakwater needs to be evaluated. The exposed rip rap may be a public safety hazard and the performance of the structure has not been evaluated. The fill template for the Federal Shore Protection Project does not include the very north end of Sand Key (R-52- R-56), Belleair Shore (R-66-R-72) or the south end of Sand Key (R-107-R-125). The County may need to consider proposing to extend the fill template at their cost as betterment to the federal project. If these beaches are included in the federal project, they would be eligible for post-storm emergency nourishment funds. 4-4
140 As part of the coastal processes analysis of John s Pass (see Inlet Management section), the performance of the terminal groin at the south end of Sand Key should be evaluated. The County should evaluate the benefits of extending construction pipeline corridors farther offshore Sand Key into deeper water. This would increase the efficiency of current construction methodologies while adding the potential for additional construction method options in the future, resulting in increased bidding competition from contractors. Investigation and permitting longer pipeline corridors will require sidescan sonar surveys with potential diver verification of environmental resources. Additionally, future management of Sand Key should include the following: The County must continue to monitor the Madeira Beach groin system. The groins may periodically require maintenance, safety inspections and performance evaluations. The County should pursue long term nourishment permits. FDEP-BIP's has recently considered issuing permits for 15 years. Treasure Island The next planned nourishment of Treasure Island and Long Key is expected to be constructed in 2013/2014 pending funding availability. The estimated cost of the Treasure Island project is $12,000,000 (FDEP, 2012b). The County s local share (20%) is expected to be $2,400,000 (2013 CIP budget lists $1,823,400 from TDC funds). For the following two years, the County will be responsible for 50% of the cost of the physical and turtle monitoring and tilling required by the permit ($12,500 annually). Nourishments are anticipated to occur every three years (2016 and 2019). A new joint coastal permit will be required for any projects constructed after May 17, Prior to designing and permitting these nourishments, the following should be considered and pursued: The shoreline at Sunset Beach, at the southern end of Treasure Island, has continued to retreat since A feasibility study including morphology modeling of management options to address the hotspot should be conducted with the goal of extending the nourishment interval. The potential for reducing the permeability of the groin at R-141 or adding additional structures should be evaluated as part of the study. Funds for a coastal processes analysis of Sunset Beach and a feasibility study of alternatives to address erosion at Sunset Beach including morphology modeling will be required prior to the 2016 nourishment. Recommendations from the study can then be incorporated 4-5
141 into the design and permit to address hotspots on Treasure Island. The approximate cost of the study and modeling was included in the summary table in Appendix A as $40,000 in 2013 and $80,000 in As part of the coastal processes analysis of John s Pass (see Inlet Management section), management options for the hotspot at Sunshine Beach at the north end of Treasure Island should be evaluated. Costs associated with the design, permitting, construction and monitoring of the 2016 project were assumed to be the same as the 2013/2014 project and were included in the 5-year budget (Appendix A). Additionally, a new joint coastal permit for emergency sand sharing will be required after June 7, Prior to permitting, discussions with the stakeholders need to be held to determine if the City of St. Petersburg or any other communities have changed their position on their beaches being used as a borrow area for the emergency sand sharing plan. An estimated cost of $100,000 was included in FY 2015, split equally between the County and municipalities (Appendix A). In order to pursue the reauthorization of funding for the Treasure Island Federal project, whose authorization expires in 2019, the USACE will have to conduct investigations. The cost will be $1,000,000. The County will be responsible for half of the costs, or $500,000. Long Key The construction of four permanent rock groin structures as part of the Upham Beach Stabilization Project is scheduled to begin in The estimated cost of the groins is $8,000,000 of which the County and State will each be responsible for half depending on funding availability (FDEP, 2012b). The groins will require monitoring and maintenance after construction. Physical monitoring required by the permit for the structures is expected to cost between $45,000 and $75,000 annually (2013 CIP budget, 2012). The County will be responsible for $22,500 to $37,500 annually. The next planned nourishment of Long Key will be in conjunction with the Treasure Island project expected to be constructed in 2013/2014 pending funding availability. The estimated total cost of the project is $5,289,286 (2013 CIP budget, 2012). The local share (20%) is expected to be $1,036,700. For the following two years, the County will be responsible for 50% of the cost of the physical and turtle monitoring and tilling required by the permit ($12,500 CIP budget, $20,000 FDEP LRBP). The nourishment interval for Long Key and Treasure Island is approximately three years. Costs associated with the design and permitting for the 2016/2017 project are estimated at $165,000. A new joint coastal permit will be required for any projects constructed after 4-6
142 May 17, The new permit will likely require physical and environmental monitoring after construction which will require additional funds. The County needs to continue pursuit of the joint coastal permit to nourish Pass-A-Grille Beach and evaluate the potential of adding the southern Long Key segment to the Federal Shore Protection Project. Additionally, monitoring and design records need to be kept on file for use in requesting emergency funding as needed. Shell Key Limited funding is anticipated to be needed for Shell Key over the next five years. The Shell Key Management Plan was developed in If environmental conditions or management goals for the island change within the next five years an update to the plan and funding apportionment may be required. Funding resources for Shell Key need to be reviewed. Mullet Key The County should continue to take advantage of dredge spoils from Tampa Bay ship channel to nourish Mullet Key and plan projects accordingly. Pinellas County Parks and Conservation Resources Department intends to apply for RESTORE Act funds to repair the North Beach of Ft. DeSoto Park from TS Debby damage. They have requested $8,000,000 for the project. Inlet Management Inlet management is a critical component of the CMP. The following actions should be pursued to improve performance of projects, preserve adjacent beaches and take advantage of inlet resources and funding opportunities: An updated coastal processes analysis of the inlet dynamics at John s Pass needs to be conducted to evaluate the performance of the inlet stabilization structures and their potential need for modification, the wave focusing on the north end of Treasure Island and the shoaling inside the pass. The study will require wave and morphology modeling. The ongoing study of John s Pass and Blind Pass by USF and the USACE may provide some or all of this information (Wang and Beck, 2012). Results from the study can be used to update the inlet management plan (IMP). The latest John s Pass IMP was developed in IMPs for Clearwater Pass and Pass-A-Grille Pass need to be developed. Additionally, the management strategies in the Blind Pass and John s Pass IMPs should be updated to reflect current operations and needs. IMPs are a critical component in improving eligibility for state funding. IMPs can be adopted by the FDEP-BIP's and incorporated into the SBMP, thus making some management activities eligible for state funding. 4-7
143 The County should develop an IMP for Hurricane Pass. Hurricane Pass is a locally maintained navigation inlet and has been a long term sand source for nourishment projects on Honeymoon Island. A complete coastal processes analysis of Hurricane Pass should be conducted. The study should consider the maintenance needs of the channel through Hurricane Pass, identify trigger points for maintenance dredging and develop a plan for future dredging. An estimated cost of $150,000 was included in the budget for FY2015 for this study (Appendix A). Several of the undeveloped barrier islands have naturally opening and closing passes. The County should have a response plan for their potential occurrence. Nourishment projects should be planned concurrently with inlet maintenance dredging projects to ensure any dredge spoils are placed on the adjacent beaches. Clearwater Pass was dredged in To date, maintenance dredging of Clearwater Pass has occurred every 9.5 years. The inlet management plan should evaluate the opportunities for the use of Clearwater Pass dredge spoils and recommend a regular maintenance dredging interval. Prior to the next maintenance dredging, the permit for maintenance dredging of Clearwater Pass needs to be renewed (JCP No JC expires January 15, 2014). Dredge spoil from North Channel, Pass-A-Grille Pass should be placed as part of the 2013/2014 Long Key Nourishment. As mentioned previously, the Hurricane Pass ebb shoal is scheduled to be dredged as part of the Honeymoon Island Phase II Restoration project, at a cost of $1,040,000 in The Blind Pass Inlet Management Plan recommended a maintenance dredging interval of 6 years. The next maintenance dredging of Blind Pass is therefore scheduled to occur in The dredge spoils have previously been placed at Upham Beach. The John s Pass Inlet Management Plan recommended a maintenance dredging interval of 9 years. The next maintenance dredging of John s Pass is therefore scheduled to occur in The 2019 maintenance dredging could be coordinated with a nourishment project as feasible. In preparation for future maintenance dredging, a permit extension request or new JCP application to dredge John s Pass should be filed to avoid permit expiration during construction, if delays occur. JCP No JC expires March 29,
144 Sediment Management The following sediment management objectives should be pursued by the CMP: Pinellas County needs to maintain a regional sand inventory including comprehensive mapping of offshore sediment resources including federal resources. A better understanding of available resources will facilitate design and decision making. Further investigation is needed to determine if dredged material from the Tampa Harbor or other Federal navigation maintenance projects could be placed in the nearshore zone adjacent to the Mullet and/or Egmont Key gulf shorelines. A regional sediment management strategy that uses beach quality sand from upland dredged material management areas and the maintenance dredging of the navigation projects should continue to be incorporated into the maintenance of the beach restoration projects. An investigation is needed to determine the potential applications and resources available for the use of upland beach compatible sand hauled by truck for small nourishments. Construction The County should evaluate alternative nourishment construction methods to potentially lower costs and add flexibility to the construction schedule. Contractors with small hopper dredges may be able to dredge large shallow areas or small hills at a reduced cost and during times when other dredges are not available. Environmental Resource Planning The following environmental resource objectives should be pursued by the CMP: Mapping of the nearshore hardbottom in the vicinity of North Madeira Beach needs to be updated to assist in design and permitting of fill protection projects. Projects located within and near the aquatic preserve boundaries require additional protection, including more stringent water quality standards than in non-aquatic preserve waters, during permitting and construction to ensure preservation of the existing conditions. The Shell Key Management Plan recommends collaborating with the Environmental Land Division to reduce propeller scarring and nutrient loads and to promote healthy seagrass beds around Shell Key (PCDEM, 2007). Pinellas County Parks and Conservation Resources staff took over Shell Key Preserve management in October The County should continue to encourage dune restoration by local municipalities in order to increase storm protection and improve habitat. 4-9


145 Figure 4-1. Pinellas County Coastal Management Program Planning Milestones (Program Management, Honeymoon Island, and Sand Key) 4-10


146 Figure 4-2. Pinellas County Coastal Management Program Planning Milestones (Treasure Island and Long Key) 4-11

147 Figure 4-3. Pinellas County Coastal Management Program Planning Milestones (Inlet Management) 4-12
148 SECTION 5: DESCRIPTION OF OTHER COMMUNITIES COASTAL MANAGEMENT PLANS (3) The structure, responsibilities and strategies of three coastal management programs were reviewed as part of the development of this document in order to provide information and example coastal management strategies to Pinellas County for their information and consideration. The coastal management programs of Manatee County, Bay County and Collier County were included in the review (CPE, 2011b; 2011c). A summary table of the findings is provided at the end of this section (Table 5-1). Manatee County Structure and Responsibilities of the CMP Coastal management responsibilities in Manatee County are part of the Marine Resources program under direction of the Department of Natural Resources. The mission of the Manatee County Department of Natural Resources is to protect the area s natural resources. The Marine Resources program is responsible for beach nourishment projects on Anna Maria Island s nine miles of sandy beaches, artificial reefs and waterways, Aids to Navigation and abandoned vessel removal. In Manatee County, the engineering, design, permitting, and coordination of beach nourishment projects, and development of artificial reefs is contracted to outside consultants (Coastal Planning and Engineering, Inc.) with oversight by the Natural Resources Department Director. Three in-house employees work on coastal management. Primarily the director and his staff handle the coastal work. The director and his primary staff oversee work of consultants and coordinate with the Board of County Commissioners. Approximately 20% of staff time (or about 1664 hours per year) is spent on coastal management issues. The Manatee County Department of Natural Resources coordinates and maintains a positive working relationship with the stakeholders and coastal cities (City of Anna Maria, the City of Holmes Beach, City of Bradenton Beach and the Town of Longboat Key). Stakeholders involved with the CMP include the USACE, FDEP-BIP's, USFWS, NMFS, FWC, County consultants, WCIND, the Manatee County Board of County Commissioners, Turtle Time, and the Town of Longboat Key. The engineering consultants coordinate with the regulatory agencies and Turtle Time (the company hired to monitor sea turtle and shorebird nesting) on behalf of the County and are present at County Commission meetings as needed. The County coordinates with the West Coast Inland Navigation District (WCIND) and Longboat Key on issues related to the dredging of the adjacent passes. 5-1
149 Program Elements The County s responsibility extends the length of Anna Maria Island from R-1 to R-41 approximately 37,300 feet. There are four public beaches along Anna Maria Island; Anna Maria Bayfront Park, Manatee County Public Beach in Holmes Beach, Bradenton Beach/Cortez Beach, and Coquina Beach. The existing coastal management strategy consists of shore protection in the form of beach nourishment and implementation of well-designed coastal structures with ongoing monitoring programs. Beach Nourishment and coastal structures as needed for the maintenance of recreational areas, storm protection and for the protection of the natural resources (shorebirds, turtles, hardbottom and reefs). Physical and environmental monitoring are large parts of the coastal protection program in Manatee County as data is utilized for engineering design decisions. Environmental Resources Anna Maria Island has both natural and man-made offshore reefs, habitat for nesting shorebirds, sea turtles and both an open ocean and a bay environment. There is both naturally existing hardbottom and artificial reef along Anna Maria Island. Manatee County constructs and monitors reefs offshore of Anna Maria Island both as mitigation for the impacts of beach nourishment and as part of the County s material of opportunity program. The County has constructed recreational reefs with material of opportunity for nearly 30 years. The three mitigative artificial reefs combined approximately 19.4 ac: 1993 One Mile artificial reefs 7.3 ac 1993 Nearshore artificial reefs 6.7 ac 2005 AR (limestone boulders) 0.5 ac 2011 AR (limestone boulders) 4.9 ac In 2011, the County constructed a 4.87 ac limestone boulder reef near the 1993 Nearshore artificial reefs and the 2005 artificial reefs towards the southern end of the island. Due to the low elevation of the dunes along Anna Maria Island and the wide beach widths Manatee County does not typically prioritize dune restoration. There was a dune vegetation planting project in 2004 within the City of Anna Maria 2002 Beach Nourishment Area. Inlet Management Passage Key Inlet is a natural, unimproved inlet at the north end of Anna Maria Island. Passage Key is not maintained; however, material from the Passage Key ebb shoal was utilized for the 2002 beach nourishment project and the 2005 hurricane damage repair fill project. 5-2
150 Longboat Pass is located to the south of Anna Maria Island and is a federally managed inlet. The USACE constructed the Longboat Pass Federal navigation project in 1977, which provided a 12- foot by 150-foot channel from the Gulf of Mexico to Longboat Bridge, and a 10-foot by 100-foot channel from the Longboat Bridge to deep water in Sarasota Bay. The U.S. Army Corps of Engineers maintains Longboat Pass and was the last to dredge the inlet. Manatee County coordinates with the Town of Longboat Key on projects related to Longboat Pass. An Inlet Management Plan for Longboat Pass was developed in In 2011, Manatee County and the Town of Longboat Key coordinated in the development of an updated Inlet Management Study for Longboat Pass. The primary focus of the Inlet Management Plan was to assess the existing coastal processes of Longboat Pass and vicinity. This information will be used to improve regional sediment management in order to better conserve the sediment resources of the area and improve the efficiencies of the erosion control programs, while maintaining navigation through the pass and protecting local natural resources. Borrow Areas The USACE defined the borrow area for the 1992/93 initial beach nourishment project. The ebb tidal shoal complex of Passage Key Inlet underwent sand search studies associated with the 2002 and the 2005/06 beach nourishment projects. There has been no need to investigate alternate sand sources. The upcoming Port Dolphin project will be a beneficial use project with the borrow area available on a one-time basis associated with the Port Dolphin pipeline construction. The County will utilize the approximately 500,000 cy available within the Port Dolphin Pipeline Corridor for placement along portions of the north end of Anna Maria Island with construction occurring in The sediment placement on the previously unnourished north end of Anna Maria Island will help to alleviate some of the erosion pressures along that stretch of shoreline and will act as a Beneficial Use project for the sediment contained within the pipeline corridor. Nourishment Interval Historically, the federally authorized project area has been maintained every 10 years. The upcoming nourishment project will be timed with other projects along Anna Maria Island for cost savings on project mobilization costs. Additionally, storms are a trigger point for beach nourishments on Anna Maria Island. The April 2000 Limited Reevaluation Report for Manatee County indicates that, based upon the minimum annual cost, the optimum nourishment interval for the Central Project Area (Federal project) is 10 years. The nourishment interval for the Northern Project Area is 8 years; the Central Project Area nourishment interval is 10 years; and the Coquina Beach Project Area is 3 years; however it will be incorporated into the Central Project in 2014/2015 for cost savings. 5-3
151 Federal Projects The Federal Shore Protection Project for Manatee County, Florida was authorized by Public Law dated October 27, 1965, Title II Flood Control Act of 1965, and was amended by Section 131 of the 1976 Water Resources Development Act. Resolutions approving the project under the provisions of Section 201 of Public Law were adopted by the Senate Public Works Committee on November 20, The Chief of Engineers authorized the shore protection project for Manatee County on December 19, The entire island (R-1 to R-41) was initially congressionally authorized, but the entire shore protection project was not constructed as a Federal project. Other components have been constructed locally. The end date of the Federal Authorization is The Federal project R-12 to R-36 has been constructed twice (1992/93 and 2002) with one hurricane repair (2005/2006). FEMA funded a portion of the 2011 nourishment. The third Federal nourishment is planned for 2014/2015. Manatee County assumed control of the Federal project under the provisions of the 1992 Water Resources Development Act (WRDA) which provided for local government project control and Federal cost-sharing on a reimbursable basis. As the non-federal sponsor, Manatee County proceeded under the authority of Section 206 of the Water Resources Development Act of 1992, Public Law , with the first periodic beach nourishment project. Section 206 allows a local sponsor, Manatee County in this case, to engineer and construct the beach nourishment project and then receive reimbursement for the Federal share of the project costs. For the 2002 project, USACE reviewed the County's engineering products, issued a permit for the project and participated in project cost-sharing. Summarized Federal Project Descriptions 1992/93 initial shore protection project o 2.32 million cubic yards, o 4.6-mile project, o R-12 and R-36, o December 1992 to February 1993, o The design berm width was 75 feet on average with an advanced fill of 85 feet. The borrow area was located approximately 1,300 feet offshore of the project area, seaward of FDEP monuments R-24 to R-36. The 1992 beach nourishment project was constructed under the direct supervision of the U.S. Army Corps of Engineers (USACE) first beach nourishment project o 1.9 million cubic yards, o 5.2-mile project, o R-12 and R-36 and the City of Anna Maria segment R-7 and R-10 (State and local government funded), o March and May,
152 Funding 2005/2006 minor hurricane damage repair fill project o 213,000 cubic yards added within the Federal project area to replace sediment lost due to 2004 hurricane activity, o R-12 and R Coquina Beach and City of Anna Maria Segments o 24,700 cy City of Anna Maria between R-7 and R-10 (FEMA Funded), o 204,800 cy on Coquina Beach between R to R , which includes a 600-foot gap between R and R-38. The fill placement in the gap was limited to landward of MHW, o April 14, 2011 to April 16, 2011 Local Funding Federal, state and local sources provide the primary funding for the coastal projects. The local sponsor, Manatee County, provides support through the use of funds dedicated to beach nourishment provided by a one cent sales tax administered by the Tourist Development Council (TDC). The one cent sales tax is to be used solely for beach preservation and maintenance of the Gulf of Mexico beaches of Manatee County. Additionally, the County has adopted a Capital Improvement Program, which appropriates the funding necessary to cost share the Anna Maria Island Beach Renourishment Program with the State. The Cities of Anna Maria Island (Anna Maria, Holmes Beach and Bradenton Beach) have also adopted an annual operating budget to fund the Cities on-going maintenance of the beach and park systems (outside of nourishment costs). The Town of Longboat Key shared in the cost of the Longboat Pass Inlet Management Plan. State and Federal Funding State and Federal cost sharing are required to continue the program at this time. The FDEP-BIP's has previously assisted in funding the 1992/1993 Anna Maria Island Beach Nourishment Project and the 2002 Anna Maria Island Beach Renourishment Project. The Longboat Pass Inlet Management Plan, the construction of the Cortez groins and the geotextile tube place and subsequent reconstruction at the south end jetty are all shared 50/50 between the state and local governments. Four nourishment projects have been federally funded in Manatee County. The Federal project R-12 to R-36 has been constructed twice (1992/93 and 2002) with one hurricane repair (2005/2006). In addition, FEMA funded a portion of the 2011 nourishment. The 2014/2015 islandwide nourishment will be a federally project. 5-5
153 Cost Share percentages: North Project Area (R-7 to R-10): 50% state cost share; 50% local cost share. The north project area was nourished in 2002 Central Project Area (R-12 to R-36): 56.4% Federal cost share; 21.8% state cost share; 21.8% local cost share. Coquina Beach Project Area: 50% state cost share; 50% local cost share Other Funding The Port Dolphin project is a beneficial use project. This project will be funded through the Port Dolphin escrow account (funded by Port Dolphin LLC). Upcoming Projects Structures In 2012, the County placed a geotextile tube along the island s southern jetty to sand tighten the structure. Additionally, a permanent structural solution was being considered for the south jetty, as part of the inlet management study. It is anticipated that repair and/or replacement of the existing rock jetty at the south end of Anna Maria Island will occur in 2014/2015. The three existing, deteriorated groins, located between R-34 and R-36 at Cortez Beach are proposed to be removed and replaced with three permeable adjustable groins. The replacement groins will continue to protect Gulf Drive. A feasibility study for the replacement of these groins has been approved and was under development in 2012/2013. As part of the 2011 beach restoration project, CPE designed a 4.9-acre artificial reef approximately 1,100 feet off the coast of Coquina Beach. The reef consists of 13,500 limestone boulders, each weighing an average of 2.5 tons. The reef was designed to mitigate impacts to nearshore habitat, which may become covered by sand as waves readjust the constructed beach into the natural varying shape of its profile. It is also a part of Manatee County s artificial reef program, developed to increase and enhance recreational fishing and diving in addition to creating and restoring marine habitats. Nourishment In 2013, material dredged from the pathway of the Port Dolphin Pipeline will be placed on Manatee County beaches (funding from Port Dolphin LLC). An island-wide nourishment is scheduled to be constructed in 2014/2015 (Federal funding). Public Opinion Beach nourishment and coastal protection receive wide public support. Residents of Anna Maria Island are particularly supportive. The three Cortez groin structures are popular with surfers. 5-6
154 Future of the Program Coastal protection within Manatee County is a large and complex program with many features and multiple funding sources. Manatee County relies heavily on their coastal engineering consultant (CPE) to manage their coastal program. Manatee County has seen the benefits of creating well maintained beaches with scheduled nourishment. The Manatee County Natural Resources Department is of the opinion that the present shoreline management strategy is functioning well and they intend to maintain a similar program management strategy into the future. Bay County Structure and Responsibilities of the CMP The Bay County Tourist Development Council (TDC), a semi-independent County department, maintains the recreational beaches of Panama City to support the local economy and provide storm protection. The TDC is comprised of nine members appointed by the Bay County Board of County Commissioners. The members include tourist development tax collectors, representatives of tourist-related businesses and elected officials. The primary responsibility of the TDC is to manage marketing and promotional activities with the Panama City Beach Convention & Visitors Bureau. The TDC has hired a consultant to manage the beach program. The beach management program is managed by one consultant, who was formerly an employee of the County. The TDC and County staff provide in house support to the consultant. The consultant and staff manage the beach nourishment projects, monitoring and beach cleaning programs and provide design and permitting-related services. In addition, the consultant is responsible for coordinating with stakeholders on behalf of the County. The stakeholders include the USACE, FDEP-BIP's, other consultants and the City of Panama City Beach. The consultant spends 100% of their time on coastal management related issues on an as needed basis. Program Elements The Bay County coastline extends 17.5 miles along the Gulf of Mexico. The County includes two state parks, five inlets, a federally authorized shore protection project, and a Federal navigation project. The strategy of the beach management program is to maintain active permits and have sufficient sand sources available to restore the beach at regular intervals and in response to emergencies. Environmental Resources The county is known for its wide white sand beaches. There is no artificial reef program. Dune restoration is not prioritized by the county due the difficulty in obtaining easements and the associated costs. However, a dune restoration project was funded by the County and the State in
155 Inlet Management St. Andrews Inlet, a man made inlet, is federally maintained and provides access to the Port of Panama City. The inlet was cut and stabilized with jetties in Maintenance dredging occurs every 1.5 to 2 years. Dredge spoils have been disposed of offshore and along the interior shoreline of the inlet. The interior shoreline of the inlet has continuously eroded since the construction of the inlet. The erosion threatens environmental resources in St. Andrews State Park, which lines both sides of the inlet. In response to the erosion, the USACE deposited dredge spoils on the interior shorelines. An Inlet Management Plan was developed in The plan recommended bypassing, placing spoils along the adjacent beaches and the construction of four segmented breakwaters along the interior shoreline. Bay County has four other inlets besides St. Andrews Pass. Two of the inlets are ephemeral. The County, in cooperation with the Florida Park Service, has periodically reopened the ephemeral channels or cut an adjacent channel. The Town of Mexico Beach maintains its own channel for small watercraft navigation. The fourth inlet is naturally widening and is not maintained. Borrow Areas Since 1997, the TDC has continuously searched for sand sources. The Federal Panama City Beaches Shore Protection Project utilizes sand obtained from multiple offshore borrow areas. Several of these shore parallel borrow areas are within a few miles from shore. Additionally, the St. Andrews Inlet ebb shoal was suggested as a potential sand source by the Inlet Management Plan. Nourishment Interval The planned nourishment interval for Panama City Beaches is 6 years; however, construction schedules have deviated in the past. The schedule has accelerated or been delayed depending on Federal funding availability and the existing conditions relative to the beach width standard. Emergency restorations have also occurred after hurricanes in between regularly scheduled nourishments. Federal Projects The Panama City Beaches Federal Shore Protection Project was initially federally authorized under the Water Resources Development Act of The Bay County TDC, on behalf of the County, assumed control of the Federal project under Section 206 of the Water Resources Development Act of 1992, Public Law The authority of Section 206 provides for local government project control and Federal cost-sharing on a reimbursable basis. The local sponsor, the Bay County TDC is authorized to engineer and construct the beach nourishment project and then receive reimbursement for the Federal share of the project costs. 5-8
156 The Panama City Beaches Federal Shore Protection Project has been constructed twice (1999 and 2005) with two hurricane repairs (1995 and 1999). The third nourishment was completed The initial restoration (1999) placed approximately 8.3 million cubic yards of sand along 16.3 miles of shoreline to build a berm 30 to 50 feet wide at elevation 6.6 feet NAVD. The second nourishment (2005) placed approximately 3.3 million cubic yards. The third nourishment (2011) placed approximately 1.2 million cubic yards in selected sections of the authorized project area, including a new reach added to the Federal project in The Federal shore protection project area does not contain structures or inlets. Additionally, the project area is not immediately adjacent to any inlets. However, at one end of the project area, near the Federal navigation project, there is a moderate inlet effect which is mitigated by increased Federal cost sharing. The St. Andrews Inlet Federal Navigation Project has included periodic maintenance dredging and the construction of structures on both sides of the inlet. Maintenance dredging occurs every 1.5 to 2 years with spoils deposited on the shorelines of the adjacent St. Andrews State Park. Funding State and Federal Funding The cost of the 2005 Federal nourishment project was $9.8 million and was entirely federally funded. The TDC and their consultants secured Federal Flood Control and Coastal Emergencies funds for the project to replace sands lost during the 2005 storms. This funding opportunity was available because the project was previously constructed and federally authorized. Previous projects received funding from the USACE, FEMA, the FDEP-BIP's and the Bay County TDC. The USACE funds the Federal navigation project in St. Andrews Inlet, including maintenance of the jetties. Additionally, the Federal government funds its share of the Panama City Beaches Shore Protection Project. FEMA has funded emergency restoration projects. Local Funding The local source of funding for beach nourishment projects is a 5% bed tax collected from a special taxing district within the county. The Board of County Commissioners of Bay County levied the tourist development tax under the authority of the Florida Local Option Tourist Development Tax, Florida Statute The tourist development tax is locally administered by the Clerk of Circuit Court. The Tourist Development Council manages the programs funded by the tax. Of the 5% tax, 3% is used for the promotion of Panama City Beaches, beach cleaning, maintenance and improvements. A separate taxing district funds nourishment projects in Mexico Beach. Funds from the tourist development tax have been enough to fund nourishment projects and generate reserves. 5-9
157 Recent and Upcoming Projects In 2010, Bay County completed an emergency closing of Philips Inlet in response to the Deepwater Horizon oil spill. Upcoming projects include potential storm recovery nourishments and the initial construction of a new reach within the county. The next planned nourishment is scheduled for 2014/2015. Public Opinion The public is supportive of wide white sandy beaches. The public is in favor of financing beach projects under the 2011 TDC program. Structures are not needed; therefore, the public has not been polled on the issue. Future of the Program Bay County would prefer to continue to receive funding from the USACE and the State. However, the TDC has built up reserves to be able to fund projects on its own, at a lower level of service, possibly meaning smaller or more infrequent projects. In an effort to prepare for future projects, the TDC submitted a ten-year multi-use joint coastal permit application in Collier County Structure and Responsibilities of the CMP The Coastal Zone Management (CZM) Department, a department under the Public Services Division, manages the coastal programs for Collier County. With a staff of six employees, the Department s Staff Director administers contracts, conducts construction and maintenance inspections, and performs environmental monitoring. The staff also manages contracts with consultants hired for engineering, permitting, monitoring and construction services. The majority of the staff s time is spent on coastal management related issues. The Coastal Zone Management Department implements the County s objectives after coordination with several stakeholders. The Board of County Commissioners (BCC), a panel of five elected officials, is responsible for the legislation necessary for the CZM to provide services to Collier County. The BCC is advised by the Coastal Advisory Committee, a nine member appointed committee. The Committee advises the Commission on project priorities and funding availability. In addition, the CZM coordinates with the municipalities of the City of Naples and the City of Marco Island. Program Elements The Coastal Zone Management Department is responsible for preserving and protecting Collier County s coastal ecosystem while providing access and complementary facilities. The elements of the program include: Artificial Reef Deployments, Inspection and Management 5-10
158 Beach Maintenance and Management Beach Park Facilities Channel Marker Maintenance and Management Derelict Vessel Removal Estuary Management Inlet Maintenance and Management Environmental Resources Environmental resources found in Collier County include vegetated dunes, nearshore hardbottom, parks and others resources common to south Florida. The restoration of dune vegetation is the primary dune preservation strategy employed by the County. Mitigation of impacted nearshore hardbottom began with the construction of 1.1 acres of artificial reef as part of the first nourishment in Additionally, the County preserves several natural coastal areas adjacent to public access areas. Inlet Management The CZM maintains four of the six inlets within Collier County. The USACE maintains one of the other two inlets. Four of the inlets have Inlet Management Plans. The Inlet Management Plans help in obtaining permits for navigation projects. In 2000, Wiggins Pass, a rapidly infilling channel, was widened and deepened providing dredge spoils to nourish the adjacent state parks. Clam Pass, a tidal inlet, is periodically dredged to improve the hydrology of the inland waters. Fine dredged material is disposed of upland. Doctors Pass, a structurally stabilized inlet, is dredged every four years to meet minimum bypassing goals. Gordon Pass, a Federal navigation project, is maintained by the USACE. The inlet is armored and is dredged every seven years. The other inlets are natural or maintained in collaboration with the adjacent municipalities. Borrow Areas Collier County has a large but distant offshore borrow area. The offshore source is a product of the sand search investigations conducted prior to the 1999 and 2005 nourishments. Inlet bypassing has provided sand for smaller nourishments of the inlet adjacent beaches. Upland borrow areas have been used for interim nourishments of non-federal projects. Nourishment Interval Nourishments are planned at regular intervals, but proceed to construction based on trigger points. The 2005 nourishment was designed for a six-year interval. The nourishment interval was driven by the need to avoid impacting nearshore hardbottom and the reluctance of the regulators to approve additional fill. The County plans to transition to a 10-year interval with the next nourishment by altering design parameters. 5-11
159 Federal Projects Collier County does not yet have a Federal shore protection project but has been pursuing one over the past several years. The County received authorization for a feasibility study of its first beach restoration project under the 2007 Water Resource and Development Act. The County has requested $100,000 from the Federal government to fund engineering studies and permitting in In addition, Collier County has one federally authorized and maintained navigation project, at Gordon Pass. The project was initially constructed in Groins and armoring structures have been constructed on the north and south sides of the inlet. Maintenance dredging has occurred seven times, at approximately a seven-year interval. Funding Local Funding Beach nourishment programs in Collier County are funded in part by tourist development taxes. The County levies a four percent (4%) tourist development tax on all rental income rented for less than 6 months (Ordinance ). Approximately two thirds of two percent (2%) is allocated to fund beach improvement, nourishment, restoration and inlet management. One third of two percent (2%) is allocated for beach park facilities. The remaining tax is allocated to tourism promotion and museums. Additionally, Collier County collects funds from parking permits, meter collections and parking tickets. Collier County sells a $50 annual parking permit to nonresidents and visitors. Alternatively, visitors can pay the daily parking fee at the beach parks. Residents pay for the parking permit through property taxes. The County issues approximately 84,000 parking permits including residents and visitors. The remaining funds required are sourced from property tax revenue or contributions by local municipalities. Collier County property tax revenue provides $500,000 per year for the County s beach fund, part of a $1 million annual contribution for parks and recreation services. Private beaches are funded by local municipalities. State and Federal Funding FDEP-BIP's has provided funding to Collier County for feasibility studies, design, construction and monitoring. Projects partially funded by the State include Wiggins Pass Inlet Management Plan study, the Collier County Beach Renourishment and the Marco Island Beach Nourishment. Collier County has requested $15 million from FDEP-BIP's for projects in FY 12/13 through FY 16/17. Collier County requested and received Federal funding for beach nourishment through FEMA in Collier County has requested $7.6 million from FEMA for beach nourishment projects 5-12
160 through FY 13/14. Other than emergency funding, Collier County is not yet receiving funds from the Federal government. Recent and Upcoming Projects Collier County has an active nourishment and inlet management program. Collier County nourished two hotspots with truck hauled sand in Maintenance dredging of Wiggins Pass occurred in In 2012, CPE conducted an inlet management study for Wiggins Pass and recommended straightening the channel, restoring an ebb shoal and restoring an eroded shoreline. In addition, the CPE is developing conceptual design report for the 2013/2014 nourishment, which includes a larger wider beach. Public Opinion Overall, the public values the storm protection added from beach nourishments. However, there are environmental non-governmental organizations that would prefer less interference with natural areas. Some discord exists over the allocation of funds by the Tourist Development Council, but it does not overshadow the program. The public prefers light colored sand and is generally not adverse to structures. Future of the Program The Coastal Zone Management Department will continue to optimize inlet maintenance, sand bypassing and beach maintenance. Securing funding for future projects will continue to be a major issue for the County and they are taking various cost saving steps that include pursuing Federal funding and altering beach designs. 5-13
161 Table 5-1. Summary of Coastal Management Programs Coastal Management Program Shoreline Length (miles) Program Elements Annual Staff Time (hours) Funding Sources Local Cost Share (%) TDC Tax No. of Nourishments Nourish- ment Interval (years) Year of Initial Federal SPP Relationship with Consultants Manatee County Marine Resources Program 7 Five County parks, Federal SPP, two inlets, one Federal Navigation Project 1664 (3 employees) TDC, Captial Improvement Program, State, Federal, Municipalities 21.8 to 50 One cent sales tax 4 North: 8, Central: 10, South: 10 (previously 3) 1992 Consultant responsible for engineering, design, permitting, coordination of projects and development of artificial reefs Bay County Tourist Development Council 17.5 Two state parks, five inlets, Federal SPP, Federal Navigation Project 2080 (1 consultant) TDC, Federal, State 0 to 25 5% bed tax (3% to CMP) Consultant manages beach program with support from County staff. Responsibilities include design, permitting and project coordination, monitoring and beach cleaning programs, and coordinating with stakeholders on behalf of the County. Collier County Coastal Zone Management Department 28 Four County parks, six inlets, two Federal Navigation Projects (6 employees) TDC, local municipalities, property taxes 50 to 100 4% bed tax (1.3% to CMP), $50 annual parking permit 3 6 (10 in future) TBD Consultant hired for engineering, permitting, monitoring and construction services. Pinellas County Environmental Management (Coastal Division) 35 Three County parks, two state parks, seven inlets, three Federal Navigation Projects, Federal SPP 2080 (1 employee) TDC, sales tax, parking, municipal, Federal, State 38.6 to 50 5% bed tax (1/2 of 1% to CIP), 25+ Sand Key: 7 years; Treasure Is./ Long Key: 3 years 1954; 1966 (partially built in 1969) Consultants hired for engineering, permitting, monitoring and construction services. 5-14
162 SECTION 6: MANAGEMENT OPTIONS FOR PINELLAS COUNTY As the Pinellas County CMP evolves, successful and proven management strategies should continue to be implemented. In Section 5, the elements, objectives and strategies of three coastal communities were discussed. Based on an analysis of the management styles of these communities and Pinellas County, there are currently three general options for managing coastal resources in implementation. These options are presented in this section for reference. The County may find one option fits the needs of the community better than another depending on the economic, social and environmental conditions at the time. Option 1: Coordination & Cooperation Overview The Coordination and Cooperation management option is similar to Pinellas County s existing coastal management program. The approach entails relying on external agencies and consultants to perform monitoring and design, permit and construct coastal management program projects. The program administrator coordinates with stakeholders and facilitates the local sponsorship necessary for state and federal projects. Federal shore protection projects and Federal navigation channel maintenance projects are administered by the Jacksonville District of the United States Army Corps of Engineers (USACE). Non-federal elements of the program should be administered by the State if possible. The management of the remaining elements can be outsourced to consultants, under the direction of the County s program administrator. Project Planning With this approach, less planning effort is required by the local sponsor with respect to design and decision making. The USACE is responsible for evaluating nourishment design alternatives and providing a recommendation to Congress. Congress authorizes and appropriates the funding for studies and construction. The need for congressional authorization and appropriations in advance of a project requires federal projects to be extensively planned. Adjustment to project design is minimal. Coordination between agencies and stakeholders, as well as strong Congressional support, is critical to making this approach functional. Requirements The management approach requires a coordinator that is fully informed on the details of all cooperation agreements, funding resources and stakeholder interests. Funding resources include Federal and state appropriations, Tourist Development taxes, contributions from the local municipalities, the Capital Improvement Program, public access to beaches and beach parking fees. 6-1 A Shaw Group Company
163 Advantages and Disadvantages The advantage of the Coordination and Cooperation is the limited work and funding required by the County. Disadvantages of this approach include its lack of control over federal project design and schedule and the need for strong political and Congressional support. The process of authorization and appropriation of funds can take multiple years and result in construction schedule delays. Option 2: Autonomous Management Overview The Autonomous Management approach relies on in-house expertise for program management and coordinates with stakeholders to construct projects with federal and state reimbursements. The CMP would administer contracts, coordinate with regulatory agencies to obtain permits and funding, conduct construction and maintenance inspections, and perform environmental monitoring. The CMP may or may not contract with consultants for engineering and additional construction services. The County may setup an advisory panel to direct the project priorities and manage funding resources. Under Section 206 of WRDA 1992, the County can assume responsibility for the preparation of all preliminary project documentation with USACE review and approval. If appropriated by Congress, the County can receive federal reimbursement for construction costs. Similarly, the State can approve and reimburse eligible project costs. While the County continues to benefit from Federal and State funding, under this approach, the CMP has more control over the design and schedule. Project Planning The Autonomous approach allows adaptive planning. Prior to the construction of each project, the design can be modified by the County based on existing conditions and stakeholders interests. The design would be continuously altered with each project based on feedback from the previous project. Under Section 206, the County can construct projects on their own schedule and plan for reimbursement. Reimbursements are dependent on the successful negotiation and execution of a Federal Cost Sharing Agreement (FCSA) and a Project Cooperation Agreement (PCA) and the availability of congressional appropriations to fund the reimbursements. Requirements The Autonomous approach requires an in-house staff of experts capable of completing tasks typically delegated to a consultant i.e. monitoring, engineering and administration. In order to fund all costs up front, the CMP will need substantial continuous funding sources. Funding resources would include Tourist Development taxes, property taxes, beach parking fees, local municipality contributions and federal and state reimbursement. 6-2 A Shaw Group Company
164 Advantages and Disadvantages The advantage of the autonomous approach is the control over project design, schedule, and implementation. The disadvantage is the need to compete for federal reimbursement. Federal reimbursement is limited on reimbursable projects to $50 million annually (nationwide) with no project receiving more than $10 million in any given year. Reimbursement may occur over several appropriations (a portion of the requested funds are received with each appropriation). Option 3: Consultant Management Overview The Consultant Management option is similar to Bay County s existing coastal management program. The approach entails relying on consultants to perform all services required to run the coastal management program including coordinating with stakeholders and facilitating the local sponsorship necessary for state and federal projects. The hired consultants report directly to the BCC or a CMP advisory board. This option could be implemented for either a Section 206 reimbursable project or a standard USACE administered project. Project Planning With this approach, planning efforts are coordinated by consultants with direction from County advisors. The approach takes advantage of private sector managers and coastal experts having the best knowledge about regulatory issues and the engineering required to address coastal issues. Requirements This approach likely requires the least amount of staff due to its reliance on consultants. The consultants will be responsible for coordinating projects with federal and state agencies when funding is available and adapting the project design and schedule when funding is not available. Advantages and Disadvantages The advantage of hiring consultants to manage the program is the relief of the County s workload, the access to coastal experts and the continuity provided by allowing one expert source to coordinate projects and tasks. The disadvantage may be the consultant s fees and the dependence of the CMP on the consultant. 6-3 A Shaw Group Company
165 SECTION 7: FINAL RECOMMENDATION CPE recommends that Pinellas County pursue a hybrid management strategy that incorporates coordination and cooperation with Federal and State agencies and the flexibility to transition to a more financially self-reliant program aided by consultants and in house staff. This recommendation is based on the existing conditions at this time, including: The unpredictability of federal appropriations, The unknown outcome of reauthorizations for expiring Federal projects, The need for the flexibility to align construction schedules, conducting maintenance dredging and nourishment projects simultaneously, when possible, The opportunity to control project schedule under Section 206. The County needs to explore ways to be prepared to take over management and maintenance of any federal projects when federal funds are not available. Steps towards developing a new strategy include the following: The County needs to enter into a formal agreement with the USACE for in-kind services so that the county can expend their cost-matching funds on specific projectrelated tasks under the direct control of the County. This will allow the County to assume some control over important components of the overall project without impacting their cost-sharing equations. The County should consider pursuing a Section 206 federally reimbursable project, giving the County the authority to construct federal projects based on the County s design standards and schedules independent of USACE project appropriations. The County needs to develop a management mechanism to regularly maintain nonfederal priority dredging projects when funding is not available. Examples of how this may be accomplished include using local government/ TDC funds for an emergency dredging project (similar to Bay County or Collier County) or developing multiple self-taxing erosion control districts capable of funding special projects (similar to the Town of Longboat Key). The County should maintain their relationship with the USACE since having federally authorized projects is critical for obtaining a good ranking for state funding. The County needs to optimize design and project construction by implementing hotspot management to both increase renourishment intervals while decreasing the volume of sand resources needed to maintain the County s beaches. The success of the structures at Upham Beach is an example of using engineering and hotspot management to achieve these goals. The 7-1 A Shaw Group Company
166 County should also prioritize emergency response planning by maintaining design and monitoring records to maintain eligibility for emergency funding. By addressing hot spots, maintaining funding eligibility and planning for times when federal and state funds are not available, the CMP will evolve into a manageable and sustainable program. 7-2 A Shaw Group Company
167 SECTION 8: REFERENCES Ayers, W Nourishment rules called an attack. Belleair Bee. June 6, 2012 Barnard, P.L Historical Morphodynamics of Inlet Channels: West-central Florida, unpl. Master s thesis, University of S. Florida, Tampa, 179 p. Beach Management Plan Committee Beach Management Plan: Final Report to the City Commission, Indian Rocks Beach. February 19, p. Bridges, P Private beaches may be against the law. St. Petersburg Independent. August 6, p. 3A. Capital Improvement Program Budget Pinellas County Capital Improvement Program Project Budget Detail Report. Released October 18, City of Treasure Island Stewardship Committee Meeting Minutes from March 10, Coastal Planning & Engineering, Inc Blind Pass Inlet Management Plan. Submitted to Board of County Commissioners, Pinellas County, Florida. Coastal Planning & Engineering, Inc. 2010a. Aerial photographs of Pinellas County taken in response to Deepwater Horizon spill. May Coastal Planning & Engineering, Inc. 2010b. Upham Beach Stabilization Project: Structural Alternatives Development and Analysis Report. Prepared for Pinellas County. Boca Raton, Florida. Coastal Planning & Engineering, Inc Project Completion Report, Geotextile T-head Groin Repair at Upham Beach. Prepared for Pinellas County in compliance with FDEP Permit No JM. Coastal Planning & Engineering, Inc Personal Interview with Steve Keehn, Project Manager and Consultant for Bay County and Collier County Coastal Management Projects. Boca Raton, Florida. Coastal Planning & Engineering, Inc Personal Interview with Manatee County: Project Managers and Consultants for Manatee County. Boca Raton, Florida. Coastal Technology Corporation John s Pass Inlet Management Plan. Prepared for Pinellas County, Florida. Capital Improvement No A Shaw Group Company
168 Craft, J., and Kruempel, C Sand Key Beach Renourishment Project: Biological Monitoring Report. Boca Raton, Florida. Coastal Planning & Engineering, Inc. 31 p. (Prepared for Pinellas County). Davis, R.A. Jr., Andronaco, M Impact of Hurricanes on Pinellas County, Florida, Florida Sea Grant College Publication. Technical Paper No. 51. Davis, R.A. Jr., Wang, P., Silverman, B Comparison of the Performance of Three Adjacent and Differently Constructed Beach Nourishment Projects on the Gulf Peninsula of Florida. 16(2) Davis, R.A. Jr., Elko, N Geology and Morphodynamics of Caladesi and Honeymoon Islands, Florida. Field Trip Guidebook for Coastal Sediments Davis, R.A. Jr., Fitzgerald, D.M Beaches and Coasts. Blackwell Publishing Company. Victoria, Australia. pp Dial Cordy and Associates Pinellas County Shore Protection Project Comprehensive Borrow Area Study Borrow Area Resource Identification and Impact Assessment. Jacksonville Beach, Florida: Dial Cordy and Associates Inc. 35p (Prepared for U.S. Army Corps of Engineers). Dial Cordy and Associates Alternative Sand Source Utilization for the Pinellas County Beach Erosion Control Project. Final Environmental Assessment. Prepared for USACE, Jacksonville District. Dunn, G. Miller, B Atlantic Hurricanes, 2nd Edition. Louisiana University Press. Library of Congress Catalogue Number: EDR (Office of Economic & Demographic Research) Documentary Stamp Tax Collections and Distributions Post-session March 18, Elko, N Morphodynamics of Caladesi Island, Pinellas County, Florida. U.S. Geologic Survey, Center for Coastal Geology, St. Petersburg, FL, 18 p. Elko, N., Bortnick, B. Davis, R Beach Performance of Long Key, Pinellas County, FL. Pinellas County Board of County Commissioners. Coastal Research Laboratory, Department of Geology, University of South Florida. Elko, N., Davis, Jr., R.A Morphologic Evolution of Similar Barrier Islands with Different Coastal Management. Journal of Coastal Research, Special Issue 39. P A Shaw Group Company
169 Elko, N. 2006a. Joint Coastal Permit Application, Pass-A-Grille Beach Nourishment Project, Permit No l-JC. Elko, N. 2006b. Storm-influenced sediment transport gradients on a nourished beach. Tampa, Florida: University of South Florida, Ph.D. dissertation, 194p. Elko, N Request for Additional Information #2. Joint Coastal Permit Application, Pass-A- Grille Beach Nourishment Project, Permit No l-JC. Estrada, S. M Belleair Beach to discuss options for getting beach renourishment funds. Tampa Bay Times. September 21, Evans, A., Davis, Jr., R.A., Belknap, D Depositional response to seagrass mortality along a low-energy barrier-island coast: west-central Florida. Journal of Sedimentary Petrology. 57(3) p Featherstone, C., Proni, J., Carsey, T., Brown, C., Adler, M., Blackwelder, P., Alsayegh, H., Hood, T., Piela, C., McCorquodale, D Spatial distribution of petroleum hydrocarbons in sediment cores from Blind Pass, St. Pete Beach, Florida. Atlantic Oceanographic and Meteorological Laboratory. Miami, Florida. NOAA Technical Memorandum, OAR AOML-97. FEMA Disaster Assistance Fact Sheet DAP9580.8, Eligible Sand Replacement on Public Beaches. U.S. Department of Homeland Security. Washington, DC. Finkl, C.W.; Benedet, L.; Andrews, J.L.; Suthard, B.C., and Locker, S.D., Sediment ridges on the west Florida inner continental shelf: Sand resources for beach nourishment. Journal of Coastal Research, 23(1), Florida Department of Environmental Protection Honeymoon Island State Park Unit Management Plan. Division of Recreation and Parks. Approved October 21, Florida Department of Environmental Protection. 2002a Pinellas County Island Management Plan. Office of Coastal and Aquatic Managed Areas, Tampa Bay Aquatic and Buffer Preserves Program, Terra Ceia, Florida. Florida Department of Environmental Protection Consolidated Joint Coastal Permit and Intent to Grant Sovereign Submerged Lands Authorization, Permit No JC, Clearwater Pass Maintenance Dredging Project. Date of Issue: January 15, Florida Department of Environmental Protection Consolidated Joint Coastal Permit and Intent to Grant Sovereign Submerged Lands Authorization, No JC. July 28, A Shaw Group Company
170 Florida Department of Environmental Protection Caladesi Island State Park Unit Management Plan. Division of Recreation and Parks. Approved June 18, Florida Department of Environmental Protection Strategic Beach Management Plan for the Southwest Gulf Coast Region. Bureau of Beaches and Coastal Systems. May p. Florida Department of Environmental Protection. 2010a. Aquatic Preserve Maps for Pinellas County and Boca Ciega Bay. Florida Department of Environmental Protection. 2010b. Consolidated Joint Coastal Permit and Intent to Grant Sovereign Submerged Lands Authorization, Permit Number JC, John s Pass Maintenance Dredging. March 29, Florida Department of Environmental Protection. 2011a. Beach Erosion Control Program. December 15, Florida Department of Environmental Protection. 2011b. Fixed Capital Outlay Local Government Funding Requests for FY 2011/2012. Beach Management Funding Assistance Program. January 5, Florida Department of Environmental Protection. 2011c. FDEP-BBCS. Florida Department of Environmental Protection. 2011e. Consolidated Joint Coastal Permit and Sovereign Submerged Lands Authorization. Permit number: JC, Sand Key Beach Nourishment. Florida Department of Environmental Protection FY 2013/ 2014 Long Range Budget Plan. Draft version. Florida Department of Environmental Protection Critical Eroded Beaches in Florida. Bureau of Beaches and Coastal Systems, Division of Water Resource Management, Department of Environmental Protection, State of Florida, Tallahassee, FL. Florida Department of Environmental Protection DRAFT Consolidated Joint Coastal Permit and Intent to Grant Sovereign Lands Authorization. FDEP File No JC. September 28, Florida Division of Recreation and Parks Anclote Key. Florida Department of Natural Resources A proposed comprehensive beach management program for the state of Florida. Tallahassee, Florida. 8-4 A Shaw Group Company
171 Florida Department of Transportation Sour Evaluation Report: Bridge Numbers / , John s Pass Boca Ciega Bay. Prepared by Hartenstein & Associates, Inc. Florida Senate Senate Bill Tallahassee, Florida. Senate/SB2600_Enrolled_2nd_Engrossed.pdf Florida Senate House Bill Tallahassee, Florida pdf Florida Senate Senate Bill Tallahassee, Florida. eportonsenatebill2000.pdf Forrest, B., Larenas, M., Mann, D. and Rupert, M., Sand Key Sand Source Investigation Constructability Analysis. Boca Raton, Florida: Coastal Planning & Engineering, Inc. 37 p. (Prepared for Pinellas County). Forrest, B.M.; Larenas, M.; Suthard, B. and Andrews, J.L., 2009 Geophysical and Geotechnical Investigations to Identify Sand Resources for Beach Nourishment on Sand Key, Pinellas County, Florida. Boca Raton, Florida: Coastal Planning & Engineering, Inc. 70p. (Prepared for Pinellas County). GEC, 2011 Final Supplemental Environmental Assessment, Supplemental Sand Source for Sand Key Beach Renourishment Pinellas County Beach Erosion Control Project, Pinellas County, Florida. Baton Rouge, Louisiana: Gulf Engineers & Consultants. 81p (Prepared for U.S. Army Corps of Engineers). Goff, B Dredging planned for Clearwater Pass. TBN Weekly. February 29, Google Earth. 2012a. Three rooker bar N, W. January 27, Accessed on October 26, Google Earth. 2012c. Shell Key N, W. December 29, Accessed on October 26, Harms, J Personal Communication with CPE. Marlowe & Company. Harwell, D Dredging of channel may cost Clearwater up to $1 million. St. Petersburg Times. April 20, A Shaw Group Company
172 Hepner, T Effect of El Nino ( ) on the Peninsular Gulf Coast of Florida. Master s Thesis. Department of Geology, University of South Florida. Heritage Village Caladesi Memories. Hine, A., Evans, M., Davis, R.A. Jr., Belknap, D.F Depositional response to seagrass mortality along a low energy, barrier-island coast: west-central Florida. J. Sed. Petrology. V.57, No.3, May, 1987, p Hine, A.C., Brooks, G.R., Davis, R.A., Jr., Doyle, L.J., Gelfenbaum, G., Locker, S.D., Twichell, D. C., and Weisberg, R. H A Summary of Findings of the West-Central Florida Coastal Studies Project. USGS Open File Report Humiston & Moore. 2011a. Honeymoon Island Beach Restoration Project 42-Month Post Construction Monitoring Report No. 5, HM File No Submitted to: FDEP File No JC; USACE Permit SAJ (IP-MN), November 29, Humiston & Moore. 2011b. Honeymoon Island Beach Restoration Project- Phase II. Submitted to: FDEP, DEP File No JC; USACE Permit SAJ (IP-MN), June 1, Humiston & Moore. 2011a. Honeymoon Island Beach Restoration Project 42-Month Post Construction Monitoring Report No. 5, HM File No Submitted to: FDEP, DEP File No JC; USACE Permit SAJ (IP-MN), November 29, Krock, J Historical morphodynamics of John s Pass, west-central Florida. Theses and Dissertations. Paper Locker, S.D.; Hine, A.C. and Brooks, G.R., Regional stratigraphic framework linking continental shelf and coastal sedimentary deposits of west-central Florida. Marine Geology, 200, McClure, B Beach nourishment to start in March. Belleaire Bee. October 5, McClure, B Agreement targets beach nourishment. TBNweekly.com. July 30, Mehta, A.J., Jones, C.P., Adams, W.D John s Pass and Blind Pass Glossary of Inlets Report #4. Florida Sea Grant Program. Report Number 18. Moore, C.B Certain aboriginal mounds of the Florida Central West-Coast. Available from the Florida State Geological Survey, Tallahassee, FL. 8-6 A Shaw Group Company
173 Mora, Milan communication with Andrew Squires. United States Army Corps of Engineers. Pinellas County Department of Environmental Management Shell Key Preserve Management Plan. Mgmt%20Plan%202007%20web.pdf Pinellas County Planning Department. 2008a. Pinellas County Historical Background. Prepared for the Pinellas County Board of Commissioners. Pinellas County Planning Department. 2008b. Coastal Management Element of the Pinellas County Comprehensive Plan. Prepared for the Board of County Commissioners of Pinellas County, Florida. Pinellas County (ASBPA) The History of Pinellas County s Federal Shore Protection Project. Field Trip Guidebook for the American Shore and Beach Preservation Association (ASBPA) 2009 National Coastal Conference. St. Pete Beach, Florida. Pinellas County Coastal Management: Treasure Island- Long Key Nourishment. Pinellas County Fort De Soto County Park Historic Guide. Pinellas County Government Online. 2008a. Hurricane Pass Coastal Management History. Pinellas County Government Online. 2008b. Clearwater Pass Coastal Management History. Pinellas County Government Online. 2008c. John s Pass Coastal Management History. Pinellas County Government Online Sand Key. Pinellas County Government Online. 2011a. Penny for Pinellas. Pinellas County Government Online. 2011b. Pinellas County Beaches and Beach Access. Pinellas County. 2011c. Shell Key Preserve History A Shaw Group Company
174 Pinellas County Tax Collector Millage Rates. Project Cooperation Agreement Project cooperation agreement between the Department of the Army and Pinellas County for continued participation in the Pinellas County Shore Protection Project at Sand Key, Treasure Island and Long Key. Executed April 7, Roberts, T., Wang, P Four-year Performance of the 2006 Pinellas County Beach Nourishment along Sand Key, Treasure Island, and Long Key: University of South Florida. vol. I & II. Roberts, T., Wang, P Four-year performance and associated controlling factors of several beach nourishment projects along three adjacent barrier islands, west-central Florida, USA. Coastal Engineering. v. 70. pp Saint John, A Characteristics of a chronically, rapidly eroding beach: Long Key, Pinellas County, Florida. Thesis and Dissertations. Paper Squires, A. 2012, May. Comments on draft report. Pinellas County Coastal Management Program. Coastal Planning & Engineering, Inc. Boca Raton, Florida. Squires, A. 2011, August 25. Personal interview. Pinellas County Coastal Management Program. Coastal Planning & Engineering, Inc. Boca Raton, Florida. St. Petersburg/ Clearwater Area Convention & Visitors Bureau Bed tax information. St. Petersburg Times Online Jetty and pier near completion. Accessed on January 28, Suncoast Shorebird Partnership Shorebirds. Accessed January 28, Suncoast Seabird Sanctuary, Inc About the Suncoast Seabird Sanctuary. Tackney & Associates, Inc Cover Letter: JCP File Number JC, South Beach Association, Clearwater Pass Stabilization Project. July 7, Taylor Engineering, Inc Regional Sediment Management Southwest Gulf Coast Regional Sediment Budget. Prepared for the USACE. 8-8 A Shaw Group Company
175 Twichell, D.; Brooks, G.; Gelfenbaum, G.; Paskevich, V. and Donahue, B., Sand Ridges off Sarasota, Florida: a complex facies boundary on a low-energy shelf environment. Marine Geology, 200, USACE John's, Blind, and Pass-A-Grille Passes, Pinellas County, Florida. Office of the District Engineer. Jacksonville, Florida. SAKGW 827. USACE Summary of formal report dated February 1, House Document No.380, 83d Congress, 2d session. USACE Letter from the Secretary of the Army. 89 th Document No Congress, 2d Session. House USACE Section 111 Reconnaissance Report John s Pass, Pinellas County, Florida. Report No. 20. Department of the Army, Jacksonville District, Corps of Engineers, Jacksonville, Florida. USACE General Detail Design Memorandum: Mulley Key, Florida Beach Erosion Control Project. Jacksonville, Florida. Serial No. 29. USACE Pinellas County Beach Erosion Control Project General and Detail Design Memorandum Addendum (Long Key). Jacksonville District Corps of Engineers, Jacksonville, Florida. USACE. 1980a. Dunedin and Hurricane Passes, Pinellas County, Detailed Project Report, Improvements for Small Boat Navigation. USACE. 1980b. Beach Erosion Control Project Review Study for Pinellas County, Stage II Documentation. Jacksonville District, Corps of Engineers. 58 p. USACE Beach Erosion Project Review Study and Environmental Impact Statement for Pinellas County, Florida. US Army Corps of Engineers, Jacksonville District, Jacksonville, FL. USACE. 1984b. Pinellas County Florida, Sand Key Segment, Addendum IV to the GDM (Beach Nourishment). Prepared by: Jacksonville District, South Atlantic Division, U.S. Army Corps of Engineers. 250 p. USACE Working Papers for Clearwater, Florida (Spoil Disposal). U.S. Army Corps of Engineers, Jacksonville District, Jacksonville, FL. 29 p. USACE Water Resources Policies and Authorities - Federal Participation in Shore Protection. Washington, DC. Publication No. ER A Shaw Group Company
176 USACE Limited Re-evaluation Report and Environmental Summary. US Army Corps of Engineers, Jacksonville District, Jacksonville, FL. USACE, Public Notice Number PN-JPA-201, Joint Application for Works in the Waterways of Florida. USACE st Renourishment Sand Key Segment Design Memorandum with Environmental Assessment Pinellas County, Florida Beach Erosion Project. US Army Corps of Engineers, Jacksonville District, Jacksonville, FL. USACE Permit No (IP-TF). U.S. Army Engineer District, Jacksonville, Florida. USACE Department of the Army Permit No (IP-TF), Hurricane Pass. USACE Environmental Assessment, Maintenance Dredging John s Pass, Pinellas County, Florida. U.S. Army Engineer District, Jacksonville, Florida. USACE Pinellas County Shore Protection. on/docs/projectmaps/pinellas.pdf USACE, Report of the Secretary of the Army on Civil Works Activities for FY USACE Digital Project Notebook. U.S. Army Corps of Engineers- Jacksonville District. Programs and Project Management Division. USACE Vallianos, L Beach and Nearshore Placement of Material Dredged from Federally Authorized Navigation Projects. Institute for Water Resources. Policy Study-90-PS-I. Wang, P., Beck, T.M., and Roberts, T.M., Modeling regional-scale sediment transport and medium-term morphology change at a dual inlet system examined with the Coastal Modeling System (CMS): A case study at John s Pass and Blind Pass, west-central Florida. Journal of Coastal Research, Special Issue 59, Wang, P Review of draft report. University of South Florida. Coastal Planning & Engineering, Inc. Boca Raton, Florida A Shaw Group Company
177 Wang, P., Roberts, T., Volume and shoreline changes along Pinellas County beaches during Tropical storm Debby. Coastal Research laboratory. University of South Florida. 141 pp. Wang, P., Beck, T Morphodynamics of an anthropogenically altered dual-inlet system: John s Pass and Blind Pass, west-central Florida, USA. Marine Geology (2012) Wilhoit, J Morphodynamics of Bunces Pass, Florida. Thesis and Dissertations. Paper A Shaw Group Company
178 APPENDIX A SUMMARY OF FUNDING NEEDS
179 Project Description Funding Source TABLE A 1 SUMMARY OF FUNDING NEEDS FOR PINELLAS COUNTY 2012 THROUGH Penny for Pinellas $0 $500,000 $0 $0 $0 $0 $0 Coastal Management (Includes all projects listed in table) Professional Services, construction, and monitoring Tourist Development Tax $7,766,500 $2,628,260 $8,938,260 $740,760 $7,575,760 $3,330,760 $589,260 FDEP $7,787,480 $4,501,740 *5,921,250 in 2012/2013 LRBP $8,791,740 *$4,557,910 in 2012/2013 LRBP $554,240 *$1,991,340 in 2012/2013 LRBP $7,509,240 *$170,500 in *$151,750 in 2012/2013 LRBP $3,244, /2013 LRBP $650,740 Federal $0 $22,704,138 $12,263,498 $0 $22,348,726 $0 $0 Municipalities $0 $0 $0 $0 $50,000 $0 $0 TOTAL $15,553,980 $7,630,000 $17,730,000 $1,295,000 $15,085,000 $6,575,000 Beach Lighting Install lighting at access points Tourist Development $0 $100,000 $0 $100,000 $0 $100,000 $0 TOTAL $0 $100,000 Construction $0 $100,000 Construction $0 $100,000 Construction $0 Tourist Development Tax $140,000 $140,000 $140,000 $140,000 $140,000 $140,000 $140,000 Coastal Research/ Improvements Monitoring storm effects and nourishment performance (USF) FDEP $140,000 $140,000 $140,000 $140,000 $140,000 $140,000 $140,000 TOTAL $280,000 $150,000 for Prof. Svcs, $130,000 for Monitoring $280,000 $150,000 for Prof. Svcs, $130,000 for Monitoring $280,000 $150,000 for Prof. Svcs, $130,000 for Monitoring $280,000 $150,000 for Prof. Svcs, $130,000 for Monitoring $280,000 $150,000 for Prof. Svcs, $130,000 for Monitoring $280,000 $150,000 for Prof. Svcs, $130,000 for Monitoring $280,000 $150,000 for Prof. Svcs, $130,000 for Monitoring Recommended Coastal Research Tourist Development Tax $0 $20,000 Post storm inspection plan $20,000 FEMA funding review $20,000 Analysis of Regional Sediment Mgmt $0 $0 $0 Dune Construction & Walk overs Funding for municipalities to construct walkovers and plant dune veg Tourist Development Tax $45,000 $37,500 $37,500 $40,000 $40,000 $40,000 $40,000 FDEP $45,000 $37,500 $37,500 $40,000 $40,000 $40,000 $40,000 TOTAL $90,000 $75,000 $75,000 $80,000 $80,000 $80,000 $80,000 Turtle Monitoring Daily turtle nest monitoring by CMA Tourist Development Tax $89,510 $89,510 $89,510 $89,510 $89,510 $89,510 $89,510 FDEP $40,490 $40,490 $40,490 $40,490 $40,490 $40,490 $40,490 TOTAL $130,000 $130,000 $130,000 $130,000 $130,000 $130,000 $130,000 Notes: The amounts listed in the left column of each year were included in the Pinellas Capital Improvement Plan, FY2011 through FY2016 Budget. The amounts and notes in the right column of each year pertain to the FY 2012/2013 FDEP Long Range Budget Plan (LRBP). Amounts bolded in green are estimates based on the federal cost share percentage and the amounts included in the Pinellas County 2011 CIP Budget. Amounts in purple denote a difference between the CIP and LRBP reports. 1 COASTAL PLANNING ENGINEERING, INC.
180 Project Description Funding Source TABLE A 1 SUMMARY OF FUNDING NEEDS FOR PINELLAS COUNTY 2012 THROUGH Tourist Development Tax $35,000 $46,250 $31,250 *LBRP $56,250 County $31,250 *LBRP $67,500 County $31,250 *LBRP $56,250 County $31,250 *LBRP $67,500 County $31,250 Honeymoon Island Improvements Phase II: Renourishment and construction of structures in state park FDEP $105,000 $2,138,750 TOTAL $140,000 Prof. Svcs $2,185,000 *LRBP $2,380,000 for nourishment, $3,250,000 for structures $60,000 Prof. Svcs, $2,000,000 Construction, $125,000 Monitoring $93,750 *LBRP $18,750 County $93,750 *LBRP $22,500 County $93,750 *LBRP $18,750 County $93,750 $125,000 Monitoring $125,000 Monitoring $125,000 Monitoring $125,000 *LBRP $22,500 County Monitoring not required this year by permit; Need $0 $93,750 $125,000 Monitoring 2018 Honeymoon Island Renourishment Hurricane Pass Improvements Phase III: Renourishment Design and construction of Hurricane Pass Navigation Channel Tourist Development Tax $0 $0 $0 $0 $0 $0 $6,000 FDEP $0 $0 $0 $0 $0 $0 $54,000 TOTAL $0 $0 $0 $0 $0 $0 $60,000 Prof. Svcs Tourist Development Tax $0 $520,000 $0 $0 $75,000 $0 $0 FDEP $0 $520,000 $0 $0 $75,000 TOTAL $0 $1,040,000 $1,000,000 for construction, $40,000 for Prof.Svcs $0 $0 $150,000 *Potential funding if IMP is approved Inlet Management Plan $0 $0 $0 $0 Clearwater Pass Research and modeling Tourist Development Tax $0 $0 $0 $0 $0 $0 $75,000 FDEP $0 $0 $0 $0 $0 $0 $75,000 TOTAL $0 $0 $0 $0 $0 $0 $150,000 *Potential funding if IMP update Notes: The amounts listed in the left column of each year were included in the Pinellas Capital Improvement Plan, FY2011 through FY2016 Budget. The amounts and notes in the right column of each year pertain to the FY 2012/2013 FDEP Long Range Budget Plan (LRBP). Amounts bolded in green are estimates based on the federal cost share percentage and the amounts included in the Pinellas County 2011 CIP Budget. Amounts in purple denote a difference between the CIP and LRBP reports. 2 COASTAL PLANNING ENGINEERING, INC.
181 TABLE A 1 SUMMARY OF FUNDING NEEDS FOR PINELLAS COUNTY 2012 THROUGH 2017 Project Description Funding Source Tourist Development Tax $7,384,490 $1,077,500 $62,500 $62,500 *LRBP $125,000 County $0 *LRBP $125,000 County $0 $62,500 Sand Key Nourishment 2010 * Project construction delayed until 2012 Design, construction and monitoring of Sand Key FDEP $7,384,490 *Not in 2012/2013 LRBP $1,077,500 Federal (62.8%) $0 $21,980,000 *Not in 2012/2013 LRBP $62,500 *$10,657,000 appropriated in 2010, $11,323,000 requested in 2011 *LRBP $125,000 FDEP $62,500 *LRBP $125,000 FDEP $0 *LRBP $125,000 FDEP $0 $62,500 $0 $0 $0 $0 $0 TOTAL $14,768,980 $24,135,000 $125,000 Prof. Svcs, Monitoring $125,000 Prof. Svcs, Monitoring $0 Monitoring; Need $125,000 $0 $125,000 Monitoring Tourist Development Tax $0 $125,000 *LRBP $0 $125,000 *LRBP $0 $7,017,500 *LRBP $30,000 sand search $1,067,500 *LRBP $120,000 sand search $62,500 Sand Key Nourishment 2015 *Project could be delayed until 2019 Design, construction and monitoring of 2015 project FDEP $0 $125,000 *LRBP $0 $125,000 *LRBP $0 $7,017,500 Federal (62.8%) $0 $0 $0 $0 $22,348,726 TOTAL $0 $250,000 Prof. Svcs $250,000 Prof. Svcs $0 $36,383,726 *LRBP $30,000 sand search *LRBP $90,000 sand search Prof. Svcs, Construction $1,067,500 $0 $2,135,000 *LRBP $40,000 sand search *LRBP $40,000 sand search Prof. Svcs, Construction, Monitoring $62,500 $0 $125,000 Monitoring Madeira Beach Groin Replacement Johns Pass Treasure Island Nourishment 2010 Replace groin Research and modeling Monitoring of 2010 project Tourist Development Tax Tourist Development Tax $0 $50,000 Construction $0 $0 $0 $0 $0 $0 $0 $75,000 $0 $0 $0 $0 FDEP $0 $0 $75,000 *Potential funding if IMP update $0 $0 $0 $0 TOTAL $0 $0 $150,000 $0 $0 $0 $0 Tourist Development Tax $12,500 $12,500 $12,500 $0 $0 $0 $0 FDEP $12,500 $12,500 $12,500 $0 $0 $0 $0 Federal (58%) $0 $0 $0 $0 $0 $0 $0 TOTAL $25,000 $25,000 $25,000 $0 $0 $0 $0 Notes: The amounts listed in the left column of each year were included in the Pinellas Capital Improvement Plan, FY2011 through FY2016 Budget. The amounts and notes in the right column of each year pertain to the FY 2012/2013 FDEP Long Range Budget Plan (LRBP). Amounts bolded in green are estimates based on the federal cost share percentage and the amounts included in the Pinellas County 2011 CIP Budget. Amounts in purple denote a difference between the CIP and LRBP reports. 3 COASTAL PLANNING ENGINEERING, INC.
182 TABLE A 1 SUMMARY OF FUNDING NEEDS FOR PINELLAS COUNTY 2012 THROUGH 2017 Project Description Funding Source Treasure Island Nourishment 2013 Design, construction and monitoring of 2013 project Tourist Development Tax $0 $65,000 FDEP $0 $65,000 Federal (58%) $0 $224, *LRBP $35,000 County *LRBP $35,000 FDEP *Not requested yet $1,825,000 $1,825,000 *LRBP $30,000 County *LRBP $30,000 FDEP $82,500 $82,500 *LRBP $1,733,340 County *LRBP $1,733,340 FDEP $12,500 $12,500 *LRBP $35,000 County *LRBP $35,000 FDEP $12,500 $12,500 *LRBP $35,000 County *LRBP $35,000 FDEP $6,293,103 $0 $0 $0 $0 $0 $ TOTAL $0 $354,138 Prof. Svcs $9,943,103 Prof. Svcs, Construction $165,000 Prof. Svcs, Monitoring $25,000 Monitoring $25,000 Monitoring $0 Treasure Island Nourishment 2016 Design, construction and monitoring of 2016 project Tourist Development Tax $0 $0 $0 $0 $65,000 FDEP $0 $0 $0 $0 $65,000 Federal (58%) $0 $0 $0 $0 $224,138 *LRBP $35,000 County *LRBP $35,000 FDEP $1,825,000 $1,825,000 *LRBP $30,000 County *LRBP $30,000 FDEP $82,500 $82,500 *Not requested yet $6,293,103 $0 *LRBP $1,733,340 County *LRBP $1,733,340 FDEP TOTAL $0 $0 $0 $0 $354,138 Prof. Svcs $9,943,103 Prof. Svcs, Construction $165,000 Prof. Svcs, Monitoring Tourist Development Tax $0 $250,000 *Not in CIP 2012 budget $0 $0 $0 $0 $0 Treasure Island Federal Reauthorization Reauthorization investigation, current authorization expires in 2019 FDEP $0 $250,000 Federal (50%) $0 $500,000 *Not in 2012/2013 LRBP *Requested appropriation in 2011 $0 $0 $0 $0 $0 $0 $0 $0 $0 $0 TOTAL $0 $1,000,000 $0 $0 $0 $0 $0 Sunset Beach Hotspot Management Tourist Development Tax $0 $0 $40,000 *Coastal processes analysis $80,000 *Feasibility study with morphology modeling $0 $0 $0 Treasure Island Sand Sharing Permit Renewal *Expires 7/7/2016 Tourist Development Tax $0 $0 $0 $0 $50,000 $0 $0 Municipalities $0 $0 $0 $0 $50,000 $0 $0 TOTAL $0 $0 $0 $0 $100,000 $0 $0 Notes: The amounts listed in the left column of each year were included in the Pinellas Capital Improvement Plan, FY2011 through FY2016 Budget. The amounts and notes in the right column of each year pertain to the FY 2012/2013 FDEP Long Range Budget Plan (LRBP). Amounts bolded in green are estimates based on the federal cost share percentage and the amounts included in the Pinellas County 2011 CIP Budget. Amounts in purple denote a difference between the CIP and LRBP reports. 4 COASTAL PLANNING ENGINEERING, INC.
183 TABLE A 1 SUMMARY OF FUNDING NEEDS FOR PINELLAS COUNTY 2012 THROUGH 2017 Project Description Funding Source Long Key Upham Beach 2010 Monitoring of 2010 project Tourist Development Tax $10,000 $10,000 FDEP $10,000 $10,000 *LRBP $17,500 County *LRBP $17,500 FDEP $10,000 $10,000 *LRBP $17,500 County *LRBP $17,500 FDEP $0 $0 $0 $0 $0 $0 $0 $0 TOTAL $20,000 $20,000 $20,000 $0 $0 $0 $0 Tourist Development Tax $0 $65,000 Prof. Svcs $1,815,000 *LRBP $866,660 County $80,000 *LRBP $17,500 County $10,000 *LRBP $17,500 County $10,000 *LRBP $15,00 County $0 Long Key Upham Beach 2013 Design, construction and monitoring of 2013 project FDEP $0 $65,000 Prof. Svcs $1,815,000 *LRBP $866,660 FDEP $80,000 *LRBP $17,500 FDEP $10,000 *LRBP $17,500 FDEP $10,000 *LRBP $15,000 FDEP $0 Federal (60.8%) $0 $0 $5,970,395 TOTAL $0 $130,000 $9,600,395 *LRBP $2,600,000 Fed Prof. Svcs, $160,000 Construction $0 $0 $0 $0 Prof. Svcs, Monitoring $20,000 Monitoring $20,000 Monitoring $0 Upham Beach Stabilization Long Key Joint Coastal Permit Pass a Grille Nourishment Design, construction and maintenance of temporary and permanent structures at Upham Beach *Expires 5/17/2014 Construction of project from 1st St N to 20th St. in St. Pete Beach as needed, combined with other 2013 projects Tourist Development Tax $50,000 $20,000 $3,555,000 FDEP $50,000 $20,000 $3,555,000 TOTAL $100,000 Prof. Svcs $40,000 Prof. Svcs $7,110,000 Tourist Development Tax *LRBP $3,500,000 County *LRBP $3,500,000 FDEP $110,000 for Prof. Svcs, $7,000,000 for Construction $15,000 $15,000 *LRBP $13,000 County $15,000 *LRBP $13,000 FDEP $15,000 *LRBP $13,000 County $15,000 *LRBP $13,000 FDEP $15,000 *LRBP $13,000 County $0 *LRBP $13,000 FDEP $30,000 Monitoring $30,000 Monitoring $30,000 Monitoring $0 $0 $0 $100,000 $0 $30,000 $0 $0 Tourist Development Tax $0 $0 $1,000,000 $0 $0 $0 $0 FDEP $0 $0 $1,000,000 $0 $0 $0 $0 TOTAL $0 $0 $2,000,000 Construction $0 $0 $0 $0 $0 5 COASTAL PLANNING ENGINEERING, INC.
184 APPENDIX B BEACH NOURISHMENT, INLET DREDGING, AND SHORE PROTECTION PROJECTS PINELLAS COUNTY, FLORIDA
185 TABLE B-1 BEACH NOURISHMENT, INLET DREDGING, AND SHORE PROTECTION PROJECTS PINELLAS COUNTY, FL Project Fill, Dredge Spoil Dates Volume Fill Source References or Structure Location (c.y.) Gulf Intracoastal Waterway Not Available Not Avail. Gulf Intracoastal Waterway USACE (2010, 2011) Anclote River Channel (initial project) Not Available 1958 Not Avail. Anclote River Channel USACE (2010) HONEYMOON ISLAND: Honeymoon Island State Park Beach Restoration R8-R ,440,000 Nearshore borrow area Pinellas County (2010), Taylor (2005), FDEP (2008) Honeymoon Island State Park Beach Restoration R8-R ,000 Upland sand mines FDEP (2008), Taylor (2005) Hurricane Pass Maintenance Dredging R10-R ,500 Hurricane Pass FDEP (2008) Honeymoon Island Beach Restoration Phase I & T-head groin construction R8-R10.5 Aug. - Nov ,000 Hurricane Pass Pinellas County (2010), FDEP (2008) CLEARWATER BEACH ISLAND: Beach Fills: Clearwater Beach Fill R44-R47? ,000 Not Available USACE (1984) Clearwater Beach Nourishment R40-R47? ,000 Clearwater Pass Hillyer (1996), Taylor (2005), USACE (1984) Clearwater Beach Nourishment R40-R47? ,000 Not Available Taylor (2005) Structures: Clearwater Beach - 2 groins R46-R47? N/A- USACE (1984) Clearwater Beach Pier Groin R N/A- USACE (1984) Clearwater Beach Groin Field (7 groins) R36-R41? N/A- USACE (1984) Clearwater Beach Pier Groin & Fill R41.5 (groin) 1963 Not Avail. Not Available USACE (1984) Clearwater Beach Groins at Clearwater Pass R48-R N/A- FDEP (2008) CLEARWATER PASS: Dredging: Clearwater Pass Dredging (initial project) Not Available 1961 Not Avail. Clearwater Pass USACE (2010) Clearwater Pass Dredging R52-R61? ,000 Clearwater Pass EPA (1994) Clearwater Pass Dredging R52-R61? ,000 Clearwater Pass Taylor (2005) Clearwater Pass Dredging R52-R61? ,000 Clearwater Pass USACE/GEC (2011), EPA (1994) Clearwater Beach Nourishment R40-R47? ,000 Clearwater Pass Hillyer (1996), Taylor (2005), USACE (1984) Sand Key Nourishment R52-R61? ,000 Clearwater Pass USACE/GEC (2011), EPA (1994), Taylor (2005) Sand Key Nourishment R51-R66? ,000 Clearwater Pass Taylor (2005) Gulf Intracoastal Waterway Dredging R51-R ,000 Gulf Intracoastal Waterway Taylor (2005), FDEP (2008) Structures: Clearwater Pass Rubble Mound Placement (north side of pass) R N/A- USACE (1984) Clearwater Pass North Jetty R N/A- USACE (1984) Clearwater Pass South Jetty R N/A- Pinellas County (2010) 1 COASTAL PLANNING ENGINEERING, INC.
186 TABLE B-1 BEACH NOURISHMENT, INLET DREDGING, AND SHORE PROTECTION PROJECTS PINELLAS COUNTY, FL Project Fill, Dredge Spoil Dates Volume Fill Source References or Structure Location (c.y.) SAND KEY (Sand Key Park to Madeira Beach): Beach Fills: Indian Rocks Beach Storm Repair R93-R99 Post Hur. Gladys ,000 Gulf Intracoastal Waterway USACE/GEC (2011), Walton (1977) Clearwater Pass Dredge Spoil Placement R52-R56? ,000 Clearwater Pass EPA (1994) Indian Rocks Beach Storm Repair R74-R100 Post Hur. Agnes ,000 Not Available USACE/GEC (2011), Walton (1977) Clearwater Pass Dredge Spoil Placement R52-R56? ,000 Clearwater Pass Taylor (2005) Clearwater Pass Dredge Spoil Placement R52-R56? ,000 Clearwater Pass USACE/GEC (2011), EPA (1994) Redington to Madeira Beaches Nourishment R99-R125? ? 19,000 Not Available Taylor (2005) Sand Key Nourishment R52-R56? ,000 Clearwater Pass USACE/GEC (2011), EPA (1994), Taylor (2005) Sand Key Nourishment R52-R56? ,000 Clearwater Pass Taylor (2005) Redington Beach Nourishment & Breakwater Modification R99-R107 July , ,150 Johns Pass Ebb Shoal FDEP (2008) & Hillyer (1996) Sand Key Trucked Fill R52-R ,000 Upland sand mines EPA (1994) Indian Rocks Beach Nourishment R72-R85 December ,320,000 Egmont Channel Shoal FDEP (2008) Sand Key Nourishment R52-R56? ,000 Clearwater Pass Taylor (2005) North Reddington Beach Repair R106.5-R ,000 Not Available Hillyer (1996) Indian Shores Beach Nourishment R85-R107 December ,000-1,002,000 Egmont Channel Shoal FDEP (2008) Gulf Intracoastal Waterway Dredge Spoil Placement R51-R ,000 Gulf Intracoastal Waterway Taylor (2005), FDEP (2008) Sand Key Renourishment R56-R66 & R72-R107 October ,612,166 Egmont Channel Shoal FDEP (2008) Sand Key Post-Storm Renourishment R56-R66 & R71-R107 August ,700,000 Egmont Channel Shoal FDEP (2008) Structures: Privately constructed seawalls, bulkheads, groins and revetments R52-R125? Before N/A- Hillyer (1996) Post-storm seawall and groin construction R52-R125? 1950 Post-Hurricane 0 -N/A- Hillyer (1996) 37 Madeira Beach Groins R114-R N/A- USACE/GEC (2011) Reddington Shores Breakwater & Fill R ,000 Not Available USACE/GEC (2011), Taylor (2005) JOHNS PASS: Dredging: Johns Pass Federal Maintenance Dredging Not Avail ,650 Johns Pass Pinellas County (2010) Johns Pass Federal Maintenance Dredging Not Avail ,000 Johns Pass Pinellas County (2010) Johns Pass Federal Maintenance Dredging R127-R ,000 Johns Pass Pinellas County (2010) Johns Pass Federal Maintenance Dredging Not Avail ,000 Johns Pass Pinellas County (2010) Redington Beach Nourishment & Breakwater Modification R99-R107 July ,150 Johns Pass Ebb Shoal FDEP (2008) & Hillyer (1996) Johns Pass Federal Maintenance Dredging R127-R ,000 Johns Pass Pinellas County (2010) Johns Pass Federal Maintenance Dredging R127-R129 & R136-R ,000 Johns Pass Pinellas County (2010) Johns Pass Federal Maintenance Dredging R127-R129 Aug. - Oct ,683 Johns Pass Pinellas County (2010) Structures: Johns Pass North Terminal Groin R ,000 -N/A- Pinellas County (2010) Johns Pass Revetment on Treasure Island N/A- Pinellas County (2010) Johns Pass North Terminal Groin Modification R N/A- Pinellas County (2010) Johns Pass South Terminal Groin R N/A- Pinellas County (2010) 2 COASTAL PLANNING ENGINEERING, INC.
187 TABLE B-1 BEACH NOURISHMENT, INLET DREDGING, AND SHORE PROTECTION PROJECTS PINELLAS COUNTY, FL Project Fill, Dredge Spoil Dates Volume Fill Source References or Structure Location (c.y.) TREASURE ISLAND: Beach Fills: Sunset Beach Fill R ,000 Blind Pass USACE (1984) Treasure Island Segment, Pinellas County Shore Protection Project R132-R ,000 Shore-parallel borrow area Pinellas County (2010) Emergency Federal Fill Project after Hurricane Gladys R132-R ,000 Pinellas County (2010) Treasure Island Segment, Pinellas County Shore Protection Project R131-R ,000 O'Brien's Lagoon Pinellas County (2010) Treasure Island Segment, Pinellas County Shore Protection Project R140-R ,000 Blind Pass Pinellas County (2010) Treasure Island Segment, Pinellas County Shore Protection Project R135-R ,000 Offshore borrow area Pinellas County (2010) Treasure Island Segment, Pinellas County Shore Protection Project R137-R143? ,000 Blind Pass Pinellas County (2010) Treasure Island Segment, Pinellas County Shore Protection Project ,000 Treasure Island Segment, Pinellas County Shore Protection Project R127-R ,000 Johns Pass Pinellas County (2010) Treasure Island Segment, Pinellas County Shore Protection Project R138-R ,000 Blind Pass Pinellas County (2010) Treasure Island Segment, Pinellas County Shore Protection Project R129-R ,000 Blind Pass & Pass-a-Grille Channel Pinellas County (2010) Treasure Island Segment, Pinellas County Shore Protection Project R127-R ,000 Johns Pass Pinellas County (2010) Treasure Island Segment, Pinellas County Shore Protection Project R138-R ,300 Egmont Channel Shoal Pinellas County (2010) Treasure Island Segment, Pinellas County Shore Protection Project R127-R129 & R136-R ,000 Johns Pass Pinellas County (2010) Treasure Island Segment, Pinellas County Shore Protection Project R136-R ,000 Pass-a-Grille Channel, Ebb Shoal Pinellas County (2010) Treasure Island Segment, Pinellas County Shore Protection Project R127-R129 & R136-R , ,000 Egmont Channel Shoal Pinellas County (2010) Treasure Island Segment, Pinellas County Shore Protection Project R127-R129 & R136-R141 Aug. - Oct ,683 Johns Pass Pinellas County (2010) Structures: Treasure Island 56 Groins Not Avail N/A- Pinellas County (2010), USACE (1984) Sunset Beach Groin R N/A- Pinellas County (2010) Angled Erosion Control Structure at 126th Ave R N/A- Krock (2005) BLIND PASS: Dredging: Blind Pass Dredging Not Avail Unknown Blind Pass Pinellas County (2010) Blind Pass Dredging Sunset Beach ,000 USACE (1984) Blind Pass Dredging R144-R146? ,000 Blind Pass EPA (1994), USACE (1984) Blind Pass Dredging Not Avail ,000 Blind Pass Pinellas County (2010) Treasure Island Segment, Pinellas County Shore Protection Project R140-R , ,000 Blind Pass Pinellas County (2010) Blind Pass Dredging R144-R146? ,000 Blind Pass Pinellas County (2010) Treasure Island Segment, Pinellas County Shore Protection Project R137-R143? ,000 Blind Pass Pinellas County (2010) Blind Pass closed in 1978 due to shoaling. Pinellas County (2010) Upham Beach Segment, Pinellas County Shore Protection Project R144-R ,000 Blind Pass Pinellas County (2010) Treasure Island Segment, Pinellas County Shore Protection Project R138-R ,000 Blind Pass Pinellas County (2010) Treasure Island Segment, Pinellas County Shore Protection Project R129-R ,000 Blind Pass Pinellas County (2010) Long Key Segments, Pinellas County Shore Protection Project R144-R146 & R160-R ,000 Blind Pass Pinellas County (2010) Upham Beach Segment, Pinellas County Shore Protection Project R144-R , ,000 Blind Pass Pinellas County (2010) Upham Beach Segment, Pinellas County Shore Protection Project R144-R148 Aug. - Oct ,572 Blind Pass Pinellas County (2010) Structures: Blind Pass North Terminal Groin R N/A- Pinellas County (2010) Blind Pass North Terminal Groin Modification R N/A- Pinellas County (2010) Blind Pass North Terminal Groin Modification R N/A- Pinellas County (2010) Blind Pass North Terminal Groin Modification R N/A- Pinellas County (2010) Blind Pass South Terminal Groin R N/A- Pinellas County (2010) Blind Pass South Terminal Groin Modification R N/A- Pinellas County (2010) Blind Pass South Terminal Groin Modification R N/A- Pinellas County (2010) Blind Pass South Terminal Groin Modification R N/A- Pinellas County (2010) 3 COASTAL PLANNING ENGINEERING, INC.
188 TABLE B-1 BEACH NOURISHMENT, INLET DREDGING, AND SHORE PROTECTION PROJECTS PINELLAS COUNTY, FL Project Fill, Dredge Spoil Dates Volume Fill Source References or Structure Location (c.y.) LONG KEY (St. Pete Beach): Beach Fills: Blind Pass Dredge Spoil Placement R144-R146? ,000 Blind Pass EPA (1994), USACE (1984) Blind Pass Dredge Spoil Placement R144-R146? ,000 Blind Pass USACE (1984) Upham Beach Segment, Pinellas County Shore Protection Project R144-R ,000 Blind Pass Pinellas County (2010) Upham Beach Segment, Pinellas County Shore Protection Project R144-R ,000 Pass-a-Grille Channel Pinellas County (2010) Pass-a-Grille Beach Segment, Pinellas County Shore Protection Project R160-R ,000 Pass-a-Grille Channel Pinellas County (2010) Upham Beach Segment, Pinellas County Shore Protection Project R144-R ,700 Blind Pass Pinellas County (2010) Pass-a-Grille Beach Segment, Pinellas County Shore Protection Project R160-R ,000 Blind Pass Pinellas County (2010) Upham Beach Segment, Pinellas County Shore Protection Project R144-R ,000 Egmont Channel Shoal Pinellas County (2010) Upham Beach Segment, Pinellas County Shore Protection Project R144-R ,000 Blind Pass Pinellas County (2010) Upham Beach Segment, Pinellas County Shore Protection Project R144-R , ,000 Pass-a-Grille Channel Pinellas County (2010) Pass-a-Grille Beach Segment, Pinellas County Shore Protection Project R160-R , ,000 Pass-a-Grille Channel Pinellas County (2010) Upham Beach Segment, Pinellas County Shore Protection Project R144-R , ,000 Egmont Channel Shoal Pinellas County (2010) Upham Beach Segment, Pinellas County Shore Protection Project R144-R148 Aug. - Oct ,572 Blind Pass Pinellas County (2010) Structures: Groins & Seawall at Pass-A-Grille Beach 1950s 0 -N/A- USACE (1984) Upham Beach Bulkhead R144-R N/A- St. John (2004) Two King Pile and Panel Groins at Upham Beach N/A- USACE (1984) Upham Beach Geotextile T-Head Groins R144-R N/A- Pinellas County (2010) NORTH CHANNEL (PASS-A-GRILLE CHANNEL): Dredging: Pass-a-Grille Channel Dredging Not Available ,000 Pass-a-Grille Channel USACE (2010) Pass-a-Grille Channel Dredging (initial federal project) Not Available ,650 Pass-a-Grille Channel USACE (2010) TI & Long Key Segments, Pinellas County Shore Protection Project R129-R141 & R144-R146 & R160-R ,000 Pass-a-Grille Channel Pinellas County (2010) TI & Long Key Segments, Pinellas County Shore Protection Project R136-R141 & R144-R148 & R160-R , ,000 Pass-a-Grille Channel Pinellas County (2010) Structures: Pass-A-Grille Channel North Terminal Groin R N/A- Pinellas County (2010) Pass-A-Grille Channel North Terminal Groin Modification R N/A- Pinellas County (2010) Pass-A-Grille Channel North Terminal Groin Modification R N/A- Pinellas County (2010) MULLET KEY (Fort DeSoto): Fort DeSoto Revetment, Groin, & Beach Fill R173-R ,000 Back barrier bay Pinellas County (2010), EPA (1994) Fort DeSoto Beach Fill R173-R ,000 Shore-parallel borrow area Pinellas County (2010), FDEP (2008) Fort DeSoto Beach Fill R173-R179 & R181-R ,100,000 Tampa Harbor FDEP (2008), Taylor (2005), USACE (1984) 2006 Ft. DeSoto Park Beach Restoration & groin rehabilitation R181-R191 April - June , ,000 Tampa Shipping Channel Pinellas County (2010), FDEP (2008) Sources: Environmental Protection Agency (1994), Coastal and Shoreline Erosion Action Agenda for the Gulf of Mexico, First Generation-Management Committee Report. Florida Department of Environmental Protection (FDEP, 2008), Strategic Beach Management Plan for the Southwest Gulf Coast Region Hillyer, Theodore M. (1996), Shoreline Protection and Beach Erosion Control Study, Final Report, an Analysis of the U.S. Army Corps of Engineers Shore Protection Program Pinellas County (2010), St. John, Allysa L. (2004), Characteristics of a Chronically, Rapidly Eroding Beach: Long Key, Pinellas County, Florida, Master's Thesis, University of South Florida. Taylor Engineering, Inc. (2005), Regional Sediment Management, Southwest Gulf Coast Regional Sediment Budget U.S. Army Corps of Engineers (USACE, 1984), Beach Erosion Control Project Review Study and Environmental Impact Statement for Pinellas County, FL U.S. Army Corps of Engineers (USACE, 2010), U.S. Army Corps of Engineers (USACE, 2011), Environmental Assessment, Sunshine Skyway Cuts (SC-2 and SC-3), Maintenance Dredging with Nearshore Placement U.S. Army Corps of Engineers (USACE) / Gulf Engineers & Consultants (GEC) (2011), Final Supplemental Environmental Assessment, Supplemental Sand Source for Sand Key Beach Renourishment Walton, Todd L. (1977), Beach Nourishments in Florida and on the Lower Atlantic and Gulf Coasts. 4 COASTAL PLANNING ENGINEERING, INC.
189 APPENDIX C COMPARISONS OF HISTORIC PHOTOGRAPHS OF PINELLAS COUNTY COASTAL ELEMENTS
190 Honeymoon Island & Caladesi Island


")
191 Remains of limestone rubble from 1960s fill project on Honeymoon Island beach (Davis & Elko, 2003) 1989 Honeymoon Island Nourishment with iron stained sands from upland borrow area (Davis & Elko, 2003) Honeymoon Island (CPE, 2010)


192 Dunedin Pass in Channel was migrating north.(davis & Elko, 2003). Aerial photo of Dunedin Pass in 1990, two years after closure. Washover is visible in former inlet (Davis & Elko, 2003) Previous location of Dunedin Pass (PCPA, 2011)
193 Clearwater Beach Island


194 (USACE, 1966) (USACE, 1980b) (USACE, 1980b) 700 block Eldorado Ave., Clearwater Beach Island 2010 (CPE, 2010)


195 (USACE, 1966) R41.5, Clearwater Beach Island 2010 (CPE, 2010)

 R46, 2010)")
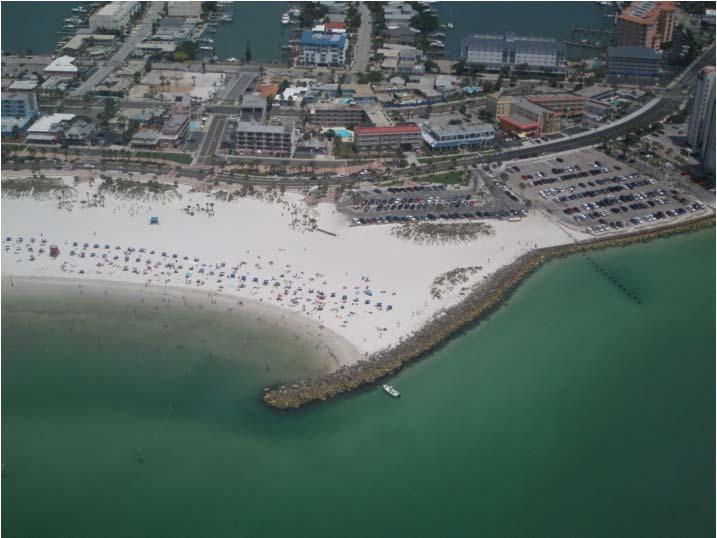
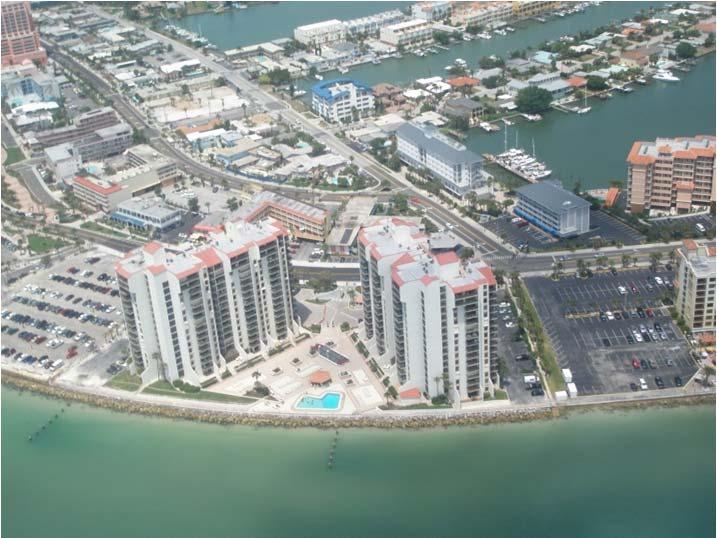
196 (USACE, 1966) R45, Clearwater Beach Island 2010 (CPE, 2010) R46, Clearwater Beach Island 2010 (CPE, 2010) R47, Clearwater Beach Island 2010 (CPE, 2010)
197 Sand Key

 2010)")
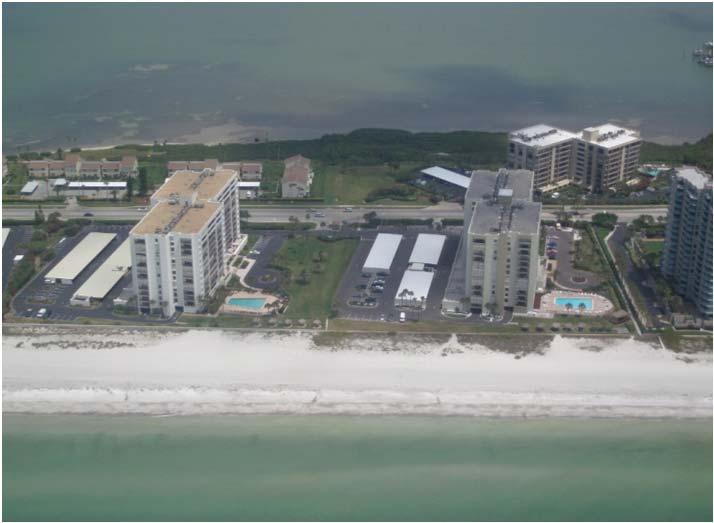
198 (USACE, 1980b) (USACE, 1980b) North End of Sand Key 2010 (CPE, 2010) North End of Sand Key 2010 (CPE, 2010)
")
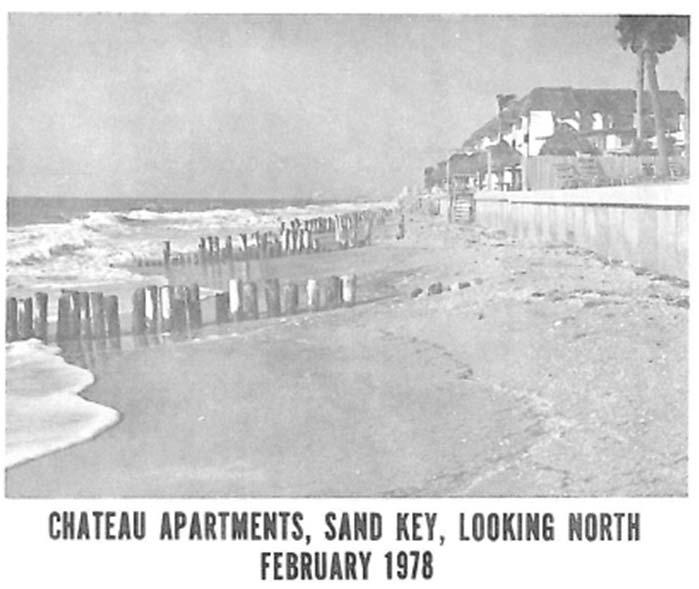
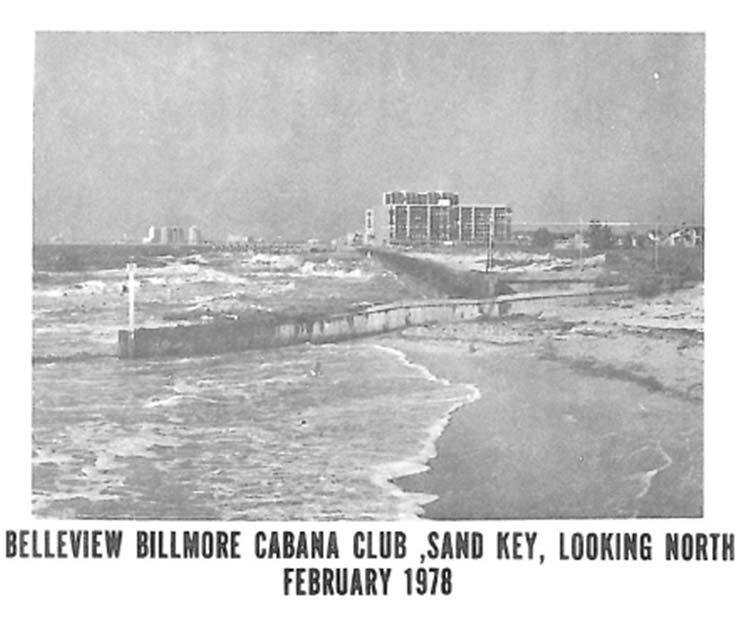
199 (USACE, 1980b) (USACE, 1980b) (USACE, 1980b)


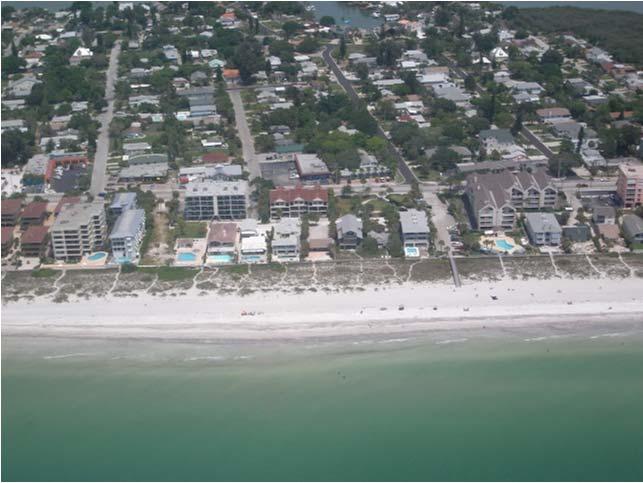
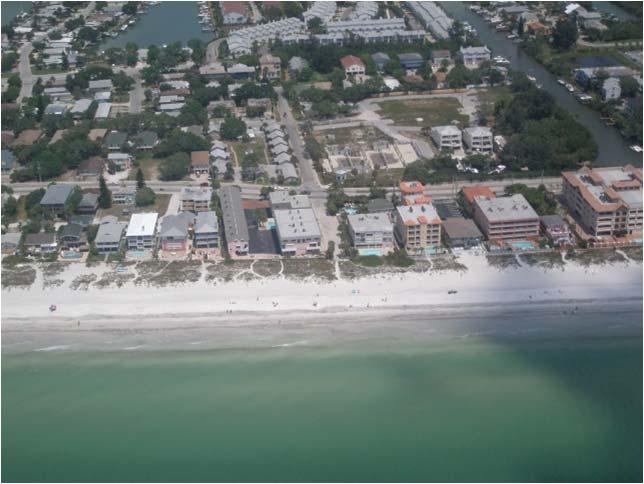
200 (USACE, 1966) (USACE, 1966) Indian Rocks Beach, Sand Key 2010 (CPE, 2010) Indian Rocks Beach, Sand Key 2010 (CPE, 2010)

")

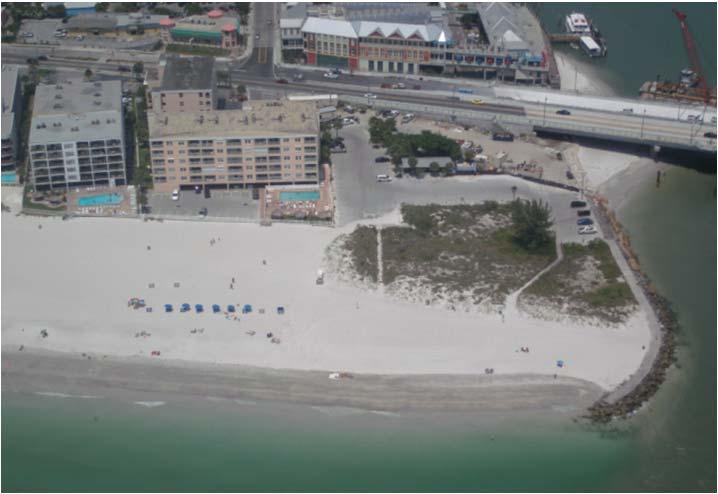
201 (USACE, 1966) South End of Sand Key 2010 (CPE, 2010) South End of Sand Key 2010 (CPE, 2010) (USACE, 1980b)
202 Johns Pass

")
")
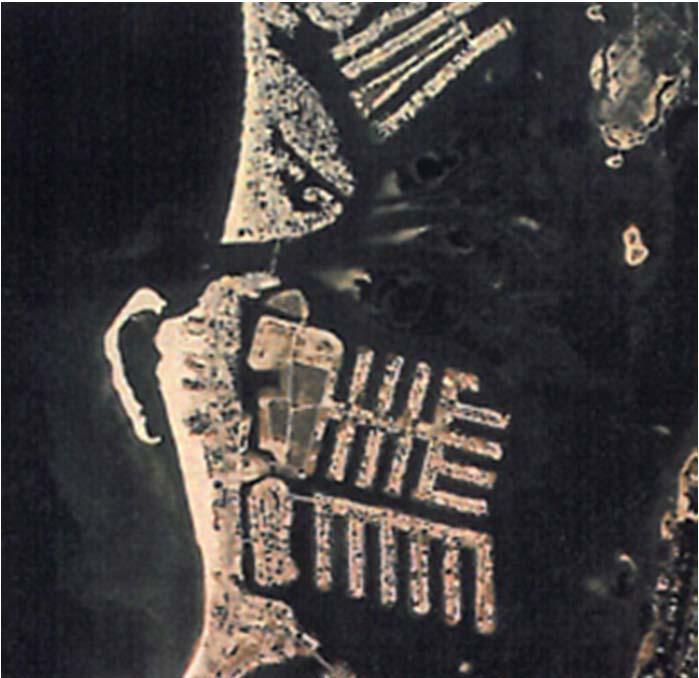
203 Johns Pass 1942 (Krock, 2005) Johns Pass 1951 (Krock, 2005) Johns Pass 1957 (Krock, 2005) Johns Pass 1969 (Krock, 2005)

")
")
204 Johns Pass 1989 (Krock, 2005) (USACE, 1980b) Johns Pass (PCPA, 2011)
205 Treasure Island

")
206 Treasure Island 1942 (Krock, 2005) Treasure Island 2011 (PCPA, 2011)

")
")
207 Treasure Island 2010 (CPE, 2010) (USACE, 1966)
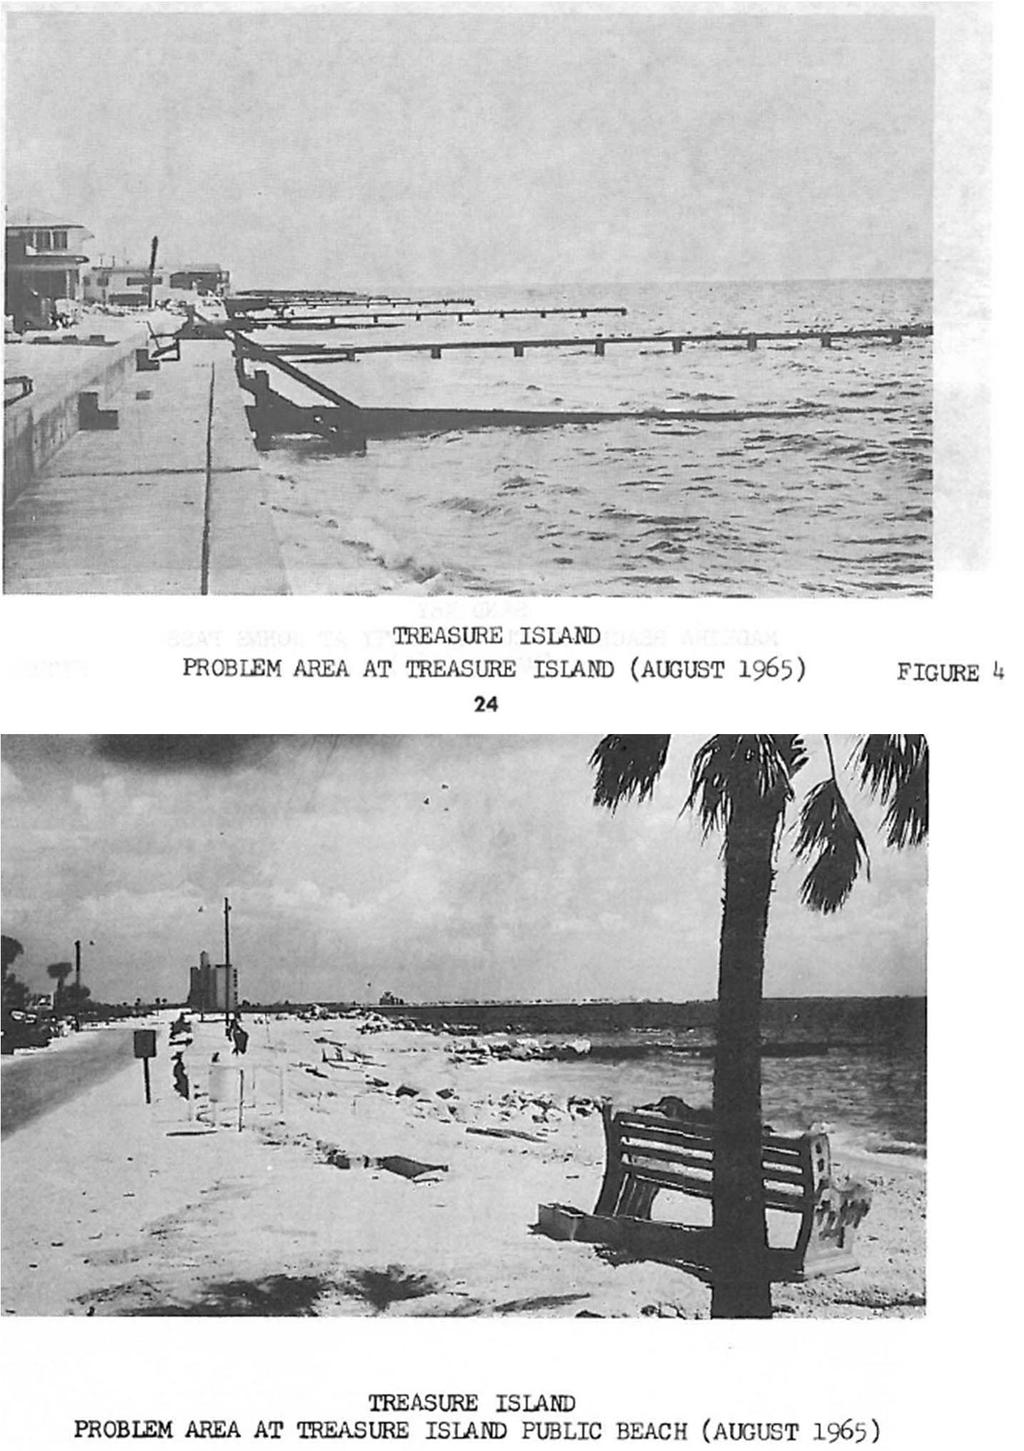
208 (USACE, 1966) (USACE, 1966)

")


209 Sunset Beach, R137 facing south (January 2, 2012) (USACE, 1980b) Sunset Beach, R141 to R138 (January 2, 2012) Sunset Beach, Blind Pass Jetty (January 2, 2012)
210 Blind Pass

")
")
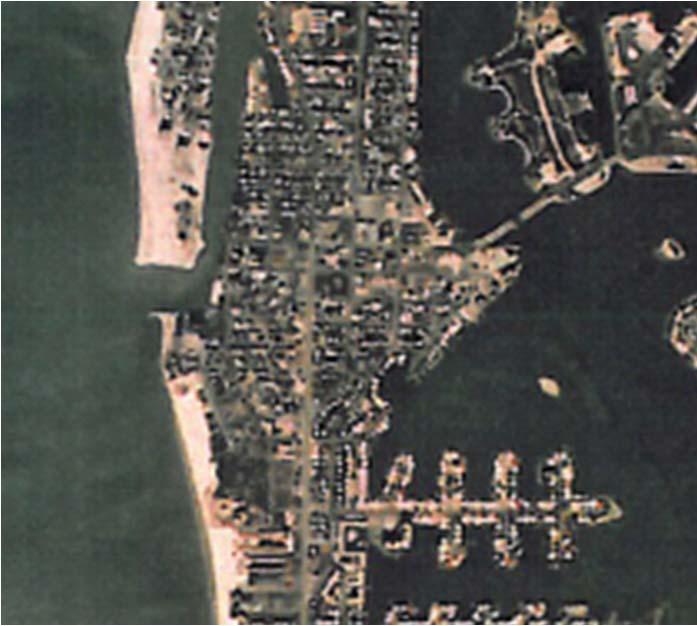
211 Blind Pass 1945 (Krock, 2005) Blind Pass 1960 (Krock, 2005) Blind Pass 1969 (Krock, 2005) Blind Pass 1976 (Krock, 2005)
")
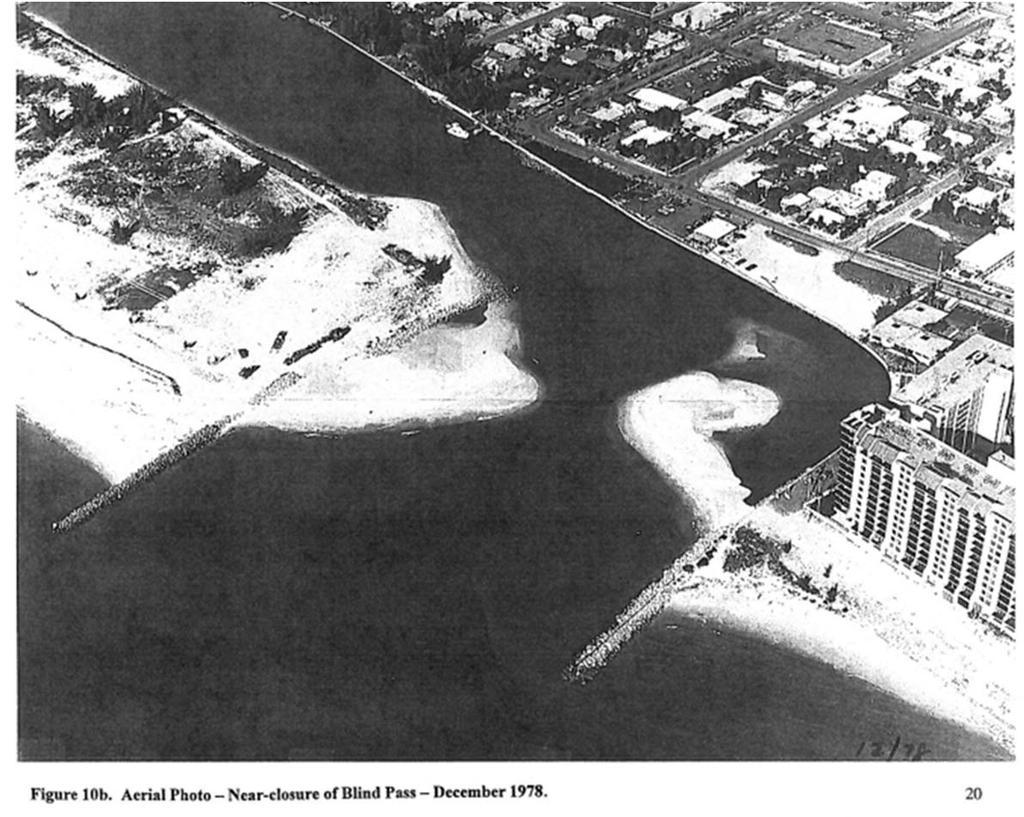
212 (USACE, 1999) (USACE, 1999)


213 Blind Pass 1978 (CPE, 1992) (USACE, 1978)
")

")

214 (USACE, 1980) (USACE, 1980) Blind Pass 1991 (CPE, 1992) Blind Pass (PCPA, 2011)
215 Long Key
")
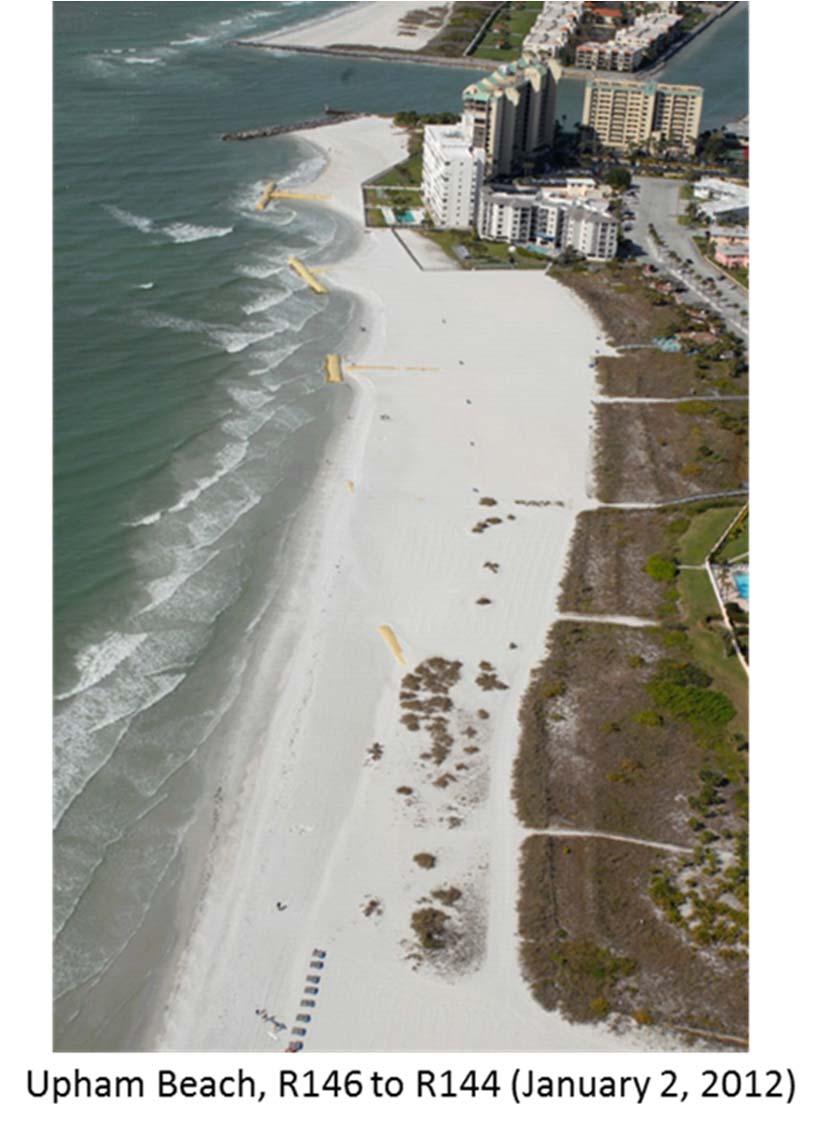
216 (USACE, 1999)

")


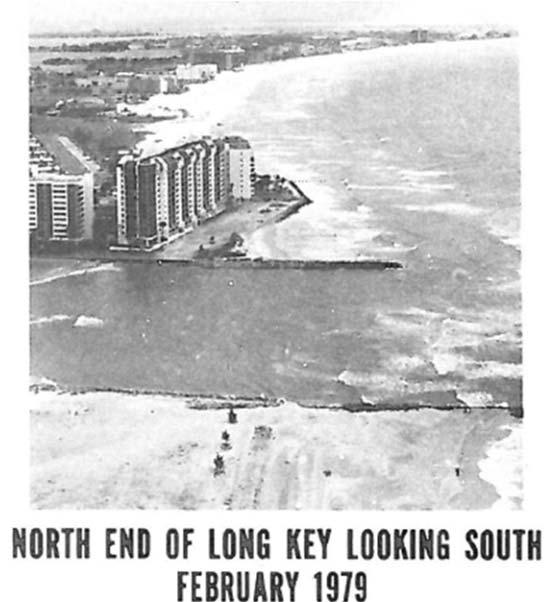
217 R145, Upham Beach, May 1994 (CPE, 1994) (USACE, 1980) Upham Beach, Johns Pass Jetty (January 2012) Upham Beach, R145 (January 2012) Upham Beach, Johns Pass Jetty (December 2011)
")
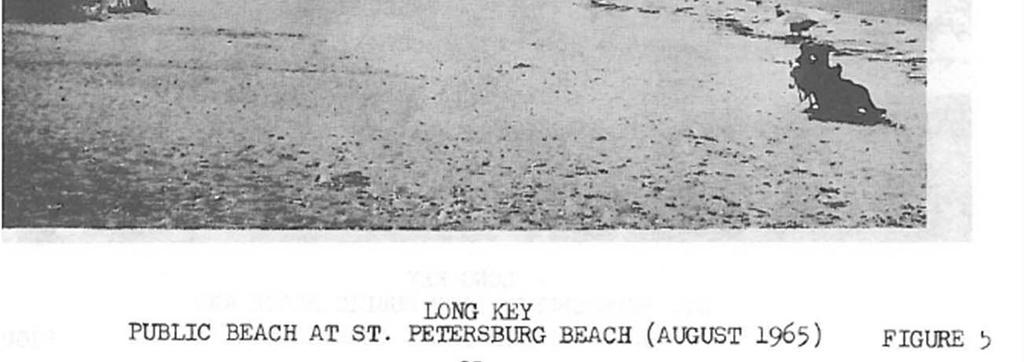
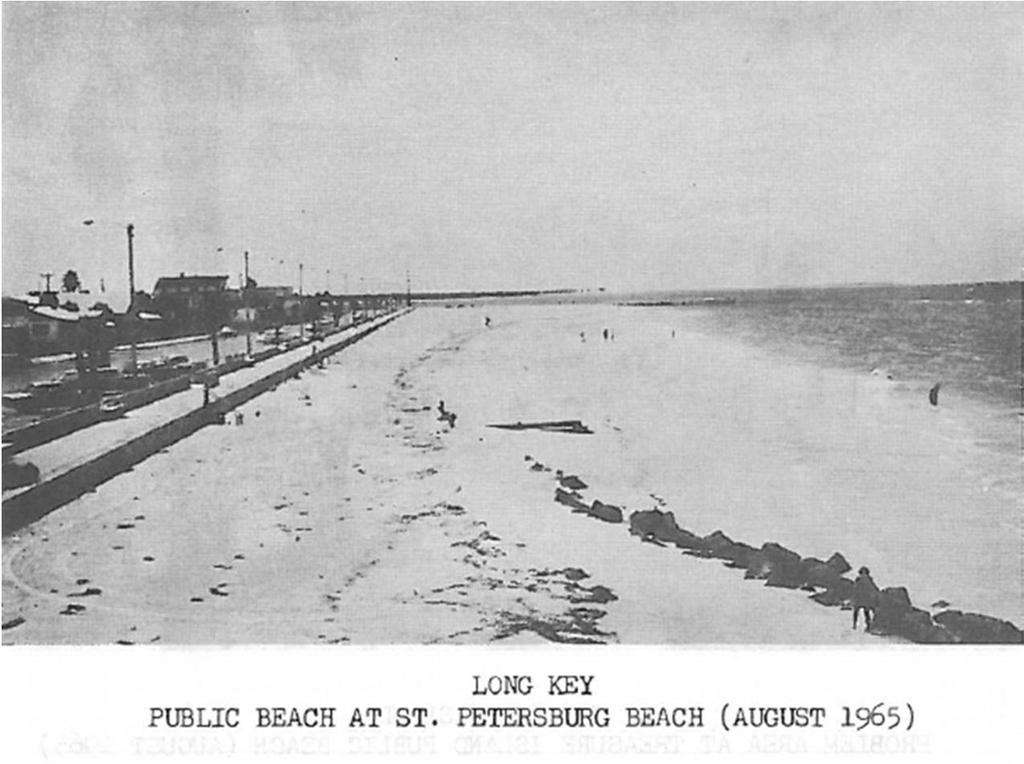
218 (USACE, 1966) (USACE, 1966)

")

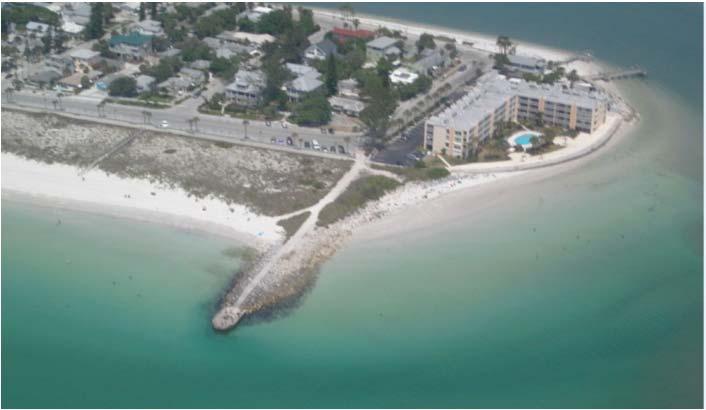
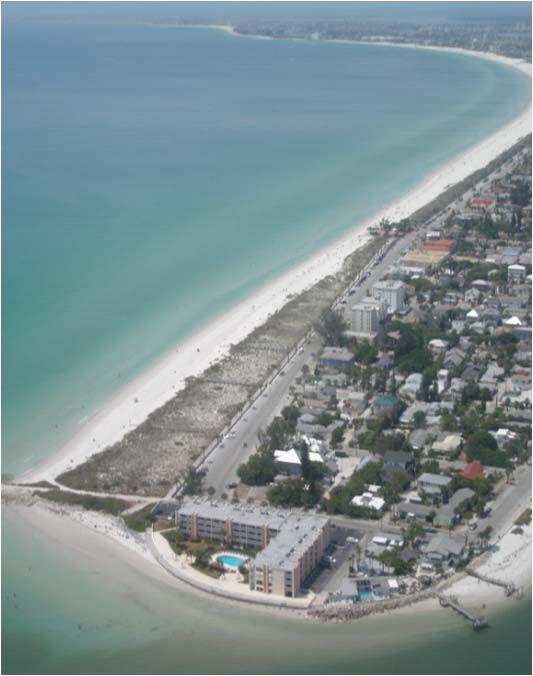
219 Pass-A-Grille 1978 (USACE, 1978) Pass-A-Grille 1978 (USACE, 1978) (USACE, 1966) Pass-A-Grille Pass Jetty on Long Key (CPE, 2010) Pass-A-Grille Pass Jetty on Long Key (CPE, 2010)
220 Pass-A-Grille Pass
")
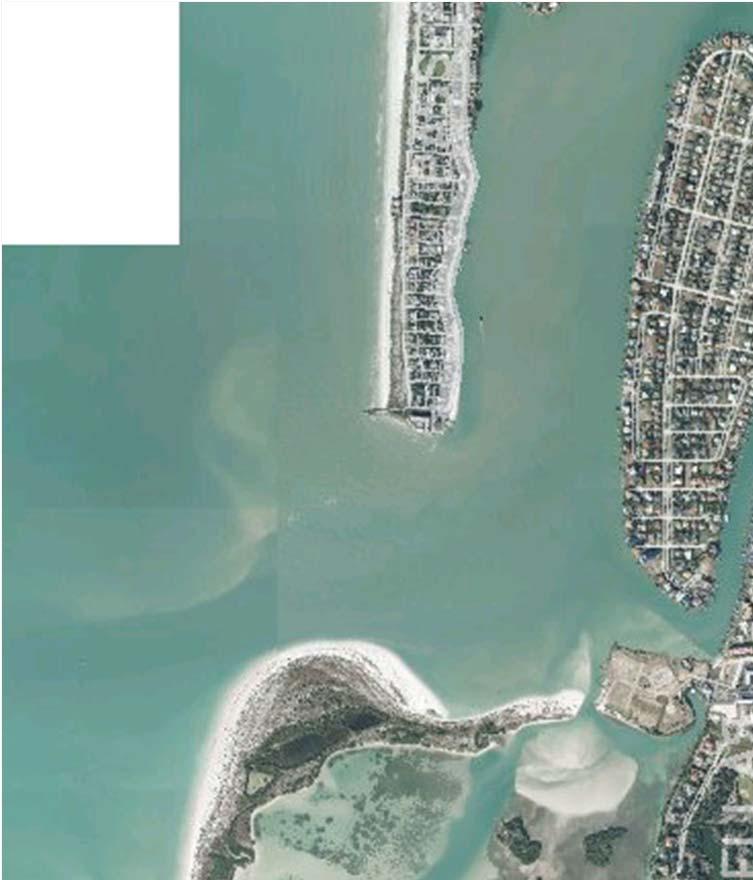
221 (USACE, 1980) Pass-a-Grille Pass (PCPA, 2011)
Volume and Shoreline Changes along Pinellas County Beaches during Tropical Storm Debby
 Volume and Shoreline Changes along Pinellas County Beaches during Tropical Storm Debby Ping Wang and Tiffany M. Roberts Coastal Research Laboratory University of South Florida July 24, 2012 Introduction
Long Term Success and Future Approach of the Captiva and Sanibel Islands Beach Renourishment Program
 2017 National Conference on Beach Preservation Technology February 8-10, 2017; Stuart, Florida Long Term Success and Future Approach of the Captiva and Sanibel Islands Beach Renourishment Program Thomas
Inlet Management Study for Pass-A-Grille and Bunces Pass, Pinellas County, Florida
 Inlet Management Study for Pass-A-Grille and Bunces Pass, Pinellas County, Florida Final Report Submitted By Ping Wang, Ph.D., Jun Cheng Ph.D., Zachary Westfall, and Mathieu Vallee Coastal Research Laboratory
EVALUATION OF BEACH EROSION UP-DRIFT OF TIDAL INLETS IN SOUTHWEST AND CENTRAL FLORIDA, USA. Mohamed A. Dabees 1 and Brett D.
 EVALUATION OF BEACH EROSION UP-DRIFT OF TIDAL INLETS IN SOUTHWEST AND CENTRAL FLORIDA, USA Mohamed A. Dabees 1 and Brett D. Moore 1 The paper discusses the analysis of up-drift beach erosion near selected
The 2017 Panama City Beaches Beach Interim Renourishment Project. Answers to Common Questions
 The 2017 Panama City Beaches Beach Interim Renourishment Project The fourth renourishment of the Panama City Beaches will be under construction during March and April 2017, with a planned completion by
Protecting our Beaches
 Protecting our Beaches South Amelia Island Shore Stabilization Project Nassau County, FL Mr. Drew Wallace President South Amelia Island Shore Stabilization Association (SAISSA) Mr. Bill Moore, AICP Project
RE: Hurricane Matthew Beach Damage Assessment and Recommendations [CSE 2416]
![RE: Hurricane Matthew Beach Damage Assessment and Recommendations [CSE 2416]](/thumbs/83/87675702.jpg "RE: Hurricane Matthew Beach Damage Assessment and Recommendations [CSE 2416]") October 25, 2016 Iris Hill Town Administrator Town of Edisto Beach 2414 Murray St Edisto Beach SC 29438 RE: Hurricane Matthew Beach Damage Assessment and Recommendations [CSE 2416] Dear Iris, Hurricane
October 25, 2016 Iris Hill Town Administrator Town of Edisto Beach 2414 Murray St Edisto Beach SC 29438 RE: Hurricane Matthew Beach Damage Assessment and Recommendations [CSE 2416] Dear Iris, Hurricane
North Shore of Long Island, Feasibility Study
 North Shore of Long Island, Asharoken New York Asharoken, Feasibility Study Asharoken, NY Public Meeting June 30, 2015 US Army Corps of Engineers US Army Corps of Engineers New York BUILDING STRONG BUILDING
Figure79. Location map for the 10 NJBPN profile sites in Atlantic County, NJ 155
 154 Figure79. Location map for the 10 NJBPN profile sites in Atlantic County, NJ 155 ATLANTIC COUNTY SPRING 2009 to FALL 2010 The Atlantic County coastline consists of three barrier islands. Between Little
New Jersey Coastal Zone Overview. The New Jersey Beach Profile Network (NJBPN) 3 Dimensional Assessments. Quantifying Shoreline Migration
 3 Dimensional Assessments. Quantifying Shoreline Migration") New Jersey Coastal Zone Overview The New Jersey Beach Profile Network (NJBPN) Objectives Profile Locations Data Collection Analyzing NJBPN Data Examples 3 Dimensional Assessments Methodology Examples Quantifying
New Jersey Coastal Zone Overview The New Jersey Beach Profile Network (NJBPN) Objectives Profile Locations Data Collection Analyzing NJBPN Data Examples 3 Dimensional Assessments Methodology Examples Quantifying
UPPER BEACH REPLENISHMENT PROJECT RELATED
 ASSESSMENT OF SAND VOLUME LOSS at the TOWNSHIP of UPPER BEACH REPLENISHMENT PROJECT RELATED to the LANDFALL OF HURRICANE SANDY - PURSUANT TO NJ-DR 4086 This assessment is in response to Hurricane Sandy
FINAL ENVIRONMENTAL IMPACT STATEMENT ON BROWARD COUNTY SHORE PROTECTION PROJECT SEGMENTS II AND III BROWARD COUNTY, FLORIDA
 FINAL ENVIRONMENTAL IMPACT STATEMENT ON BROWARD COUNTY SHORE PROTECTION PROJECT SEGMENTS II AND III BROWARD COUNTY, FLORIDA 1. PROJECT PURPOSE AND NEED 1.1. PROJECT AUTHORITY. 1.1.1. INITIAL AUTHORIZATION.
Regular Workshop October 20, 2014 Agenda Item: Dr. Albert E. Browder, PE; Olsen Associates, Inc.
 Regular Workshop October 20, 2014 Agenda Item 8 Agenda Item: Presenter: Summary: Beach Update Town Manager; Dr. Albert E. Browder, PE; Olsen Associates, Inc. At the January 21, 2014 Regular Workshop Meeting,
Building Coastal Resiliency at Plymouth Long Beach
 Building Coastal Resiliency at Plymouth Long Beach Department of Marine and Environmental Affairs March 30, 2017 Introducing Green Infrastructure for Coastal Resiliency Plymouth Long Beach & Warren s Cove
ST. LUCIE COUNTY, FLORIDA
 ST. LUCIE COUNTY, FLORIDA COASTAL STORM RISK MANAGEMENT STUDY Draft Feasibility Study & Integrated Environmental Assessment Public Meeting Presented by U.S. Army Corps of Engineers Jacksonville District
KEYNOTE PRESENTATION FSBPA olsen
 AMELIA ISAND, FLORIDA BEACH MANAGEMENT PARTNERING AND PERSERVERENCE Erik Olsen, PE associates, inc. KEYNOTE PRESENTATION FSBPA 2009 IN ORDER TO ADDRESS SHORE PROTECTION TODAY LOCAL INTERESTS PARTNER WITH:
NOTICE and AGENDA. 1. Meeting Called to Order 2. Roll Call
 NOTICE and AGENDA CITY OF TREASURE ISLAND, FLORIDA BEACH STEWARSHIP COMMITTEE CITY HALL AUDITORIUM, 120 108th AVENUE, TREASURE ISLAND, FLORIDA 33706 WEDNESDAY, April 12, 2017 AT 1:30 PM Welcome to the
A REVIEW OF THE CONDITION OF THE MUNICIPAL BEACHES AS A RESULT OF HURRICANE SANDY IN THE BOROUGH OF STONE HARBOR, CAPE MAY COUNTY, NEW JERSEY
 A REVIEW OF THE CONDITION OF THE MUNICIPAL BEACHES AS A RESULT OF HURRICANE SANDY IN THE BOROUGH OF STONE HARBOR, CAPE MAY COUNTY, NEW JERSEY View along the dune scarp from 103 rd Street on October 31,
FINDING OF NO SIGNIFICANT IMPACT
 DEPARTMENT OF THE ARMY CHARLESTON DISTRICT, CORPS OF ENGINEERS 69A HAGOOD AVENUE CHARLESTON, SOUTH CAROLINA 29403-5107 FINDING OF NO SIGNIFICANT IMPACT EDISTO BEACH COASTAL STORM DAMAGE REDUCTION GENERAL
Delaware Chapter Surfrider Foundation - Indian River Inlet Monitoring
 Delaware Chapter Surfrider Foundation - Indian River Inlet Monitoring In 2012, the Delaware Surfrider Foundation Chapter formed the Surf Quality and Access Committee to focus on issues such as surf spot
SPECIAL SPRING 2018 STORM REPORT ON THE CONDITION OF THE MUNICIPAL BEACHES FOR THE BOROUGH OF STONE HARBOR, CAPE MAY COUNTY, NEW JERSEY
 SPECIAL SPRING 2018 STORM REPORT ON THE CONDITION OF THE MUNICIPAL BEACHES FOR THE BOROUGH OF STONE HARBOR, CAPE MAY COUNTY, NEW JERSEY Aerial photograph taken April 21, 2018 showing the view up the beach
Assateague Island National Seashore North End Restoration Project Timeline
 Assateague Island National Seashore North End Restoration Project Timeline Date Event Some information provided in the Project Introduction document. Detailed events are available in a timeline compiled
ATLANTIC COUNTY 2006 to 2008
 ATLANTIC COUNTY 2006 to 2008 The Atlantic County oceanfront shoreline consists of three barrier islands where the northern one, Little Beach Island and a third of the second, Brigantine Island, are undeveloped
2018 Beach Preservation Project Information
 QUICK FACTS Beach Renourishment to begin late April 2018 o U.S. Army Corps of Engineers project o Project Area: 8 th St. E. to end of E. Ashley Ave. o Project Length: 2 miles o Cost: $10,900,000 o Funding:
Long Beach Island Holgate Spit Little Egg Inlet Historical Evolution Introduction Longshore Transport Map, Survey and Photo Historic Sequence
 Appendix B Long Beach Island Holgate Spit Little Egg Inlet Historical Evolution Introduction The undeveloped southern end of Long Beach Island (LBI) is referred to as the Holgate spit as it adjoins the
OECS Regional Engineering Workshop September 29 October 3, 2014
 B E A C H E S. M A R I N A S. D E S I G N. C O N S T R U C T I O N. OECS Regional Engineering Workshop September 29 October 3, 2014 Coastal Erosion and Sea Defense: Introduction to Coastal/Marine Structures
PLAQUEMINES PARISH BARRIER ISLAND RESTORATION & SUSTAINABILITY. MVD/Gulf Coast Regional Dredging Meeting November 5, 2013
 PLAQUEMINES PARISH BARRIER ISLAND RESTORATION & SUSTAINABILITY MVD/Gulf Coast Regional Dredging Meeting November 5, 2013 OVERVIEW 1. Barrier Island Restoration Projects in Plaquemines Parish 2. Plaquemines
Navarre Beach & Dune Restoration Project Status Report to be regularly updated June 17, 2016 Report
 Navarre Beach & Dune Restoration Project Status Report to be regularly updated June 17, 2016 Report Work Completed (June 11 to June 17) Weeks Marine Inc. (Contractor): o continued filling Segment 4 including
Follets Island Nearshore Beach Nourishment Project
 Coast & Harbor Engineering A division of Hatch Mott MacDonald Follets Island Nearshore Beach Nourishment Project Arpit Agarwal, P.E. April 1, 2016 Project Site!"#$% &'(% &)*+% )#,'-+% Shoreline Erosion
ST. JOSEPH PENINSULA, GULF COUNTY, FLORIDA Beach Re-Nourishment and Environmental Enhancement Project RECOMMENDATIONS
 ST. JOSEPH PENINSULA, GULF COUNTY, FLORIDA Beach Re-Nourishment and Environmental Enhancement Project RECOMMENDATIONS January 23, 2018 543 Harbor Boulevard, Suite 204 Destin, Florida 32541 850.654.1555
ALTERNATIVES FOR COASTAL STORM DAMAGE MITIGATION
 ALTERNATIVES FOR COASTAL STORM DAMAGE MITIGATION Dave Basco Old Dominion University, Norfolk, Virginia, USA National Park Service Photo STRUCTURAL (changes to natural, physical system) hardening (seawalls,
Performance of Upham Beach T-Groin Project and Its Impact to the Downdrift Beach
 Performance of Upham Beach T-Groin Project and Its Impact to the Downdrift Beach Progress Report for the Period of October 2008 to April 2009 Submitted by Ping Wang, Ph.D., and Tiffany M. Roberts Department
Shoreline. Page. About Shoreline
 Page About Page 2 Pinellas County is the local sponsor for three Federal Shore Protection Projects on the barrier islands (Figure 1) of Sand Key, Treasure Island, and Long Key. The Army Corp is also authorized
Dauphin Island East End Beach and Barrier Island Restoration Project. Beau Buhring South Coast Engineers
 Dauphin Island East End Beach and Barrier Island Restoration Project Beau Buhring South Coast Engineers Funding Funded with qualified outer continental shelf oil and gas revenues by the Coastal Impact
Figure 262. Location map for the 10 NJBPN profile sites in Atlantic County, NJ 279
 278 Figure 262. Location map for the 10 NJBPN profile sites in Atlantic County, NJ 279 ATLANTIC COUNTY SUMMARY The Atlantic County coastline consists of three barrier islands. The island of Little Beach
DELAWARE S VULNERABLE COASTAL AREAS. DELAWARE INLAND BAYS and DELAWARE BAY RECONNAISSANCE STUDY
 DELAWARE S VULNERABLE COASTAL AREAS and the DELAWARE INLAND BAYS and DELAWARE BAY RECONNAISSANCE STUDY Kimberly K. McKenna, PG Delaware Dept. of Natural Resources & Environmental Control Division of Watershed
USE OF SEGMENTED OFFSHORE BREAKWATERS FOR BEACH EROSION CONTROL
 .. CETN-III-22 4/84 PURPOSE: USE OF SEGMENTED OFFSHORE BREAKWATERS FOR BEACH EROSION CONTROL To provide information on the functional application of and general design considerations for using offshore
LAB: WHERE S THE BEACH
 Name: LAB: WHERE S THE BEACH Introduction When you build a sandcastle on the beach, you don't expect it to last forever. You spread out your towel to sunbathe, but you know you can't stay in the same spot
Tanya M. Beck. Kelly Legault. Research Physical Scientist Coastal & Hydraulics Lab, ERDC Vicksburg, MS
 Inlet And Adjacent Shoreline Processes at Cascading Time Scales Using the Coastal Modeling System and GenCade Tanya M. Beck Research Physical Scientist Coastal & Hydraulics Lab, ERDC Vicksburg, MS Kelly
US Beach Nourishment Experience:
 Beach Nourishment: Introduction of new sand to the beach by truck or dredge Large beach >1 million cubic yards (100,000 dump truck loads) Funding is a combination of federal, state, local & private Also
County of Santa Barbara Permit Option Analysis Goleta Beach JULY 13, 2017
 County of Santa Barbara Permit Option Analysis Goleta Beach JULY 13, 2017 Introduction 2 Goleta Beach Park welcomes 1.5 million visitors annually Amenities include: Picnic Areas and Group Areas w/bbqs
SACO RIVER AND CAMP ELLIS BEACH SACO, MAINE SECTION 111 SHORE DAMAGE MITIGATION PROJECT APPENDIX F ECONOMIC ASSESSMENT
 SACO RIVER AND CAMP ELLIS BEACH SACO, MAINE SECTION 111 SHORE DAMAGE MITIGATION PROJECT APPENDIX F ECONOMIC ASSESSMENT Department of the Army New England District, Corps of Engineers 696 Virginia Road
CHAPTER 281 INFLUENCE OF NEARSHORE HARDBOTTOM ON REGIONAL SEDIMENT TRANSPORT
 CHAPTER 281 INFLUENCE OF NEARSHORE HARDBOTTOM ON REGIONAL SEDIMENT TRANSPORT Paul C.-P. Lin, Ph.D., P.E. 1 and R. Harvey Sasso, P.E. 2 ABSTRACT The influence of nearshore hardbottom on longshore and cross-shore
CLAM PASS RESTORATION AND MANAGEMENT PLAN BATHYMETRIC MONITORING REPORT NO. 7 Including Interior Bay Dredge Cuts and Tidal Data
 CLAM PASS RESTORATION AND MANAGEMENT PLAN BATHYMETRIC MONITORING REPORT NO. 7 Including Interior Bay Dredge Cuts and Tidal Data Submitted to: Florida Department of Environmental Protection DEP File No.
The Sand Beaches of New Hampshire and Maine
 The Sand Beaches of New Hampshire and Maine Beach Preservation and Erosion Control Photographs provided by Joe Kelly and Steve Adams Cover photo: Reid State Park, ME Introduction The sand beaches of New
Passage Key Inlet, Florida; CMS Modeling and Borrow Site Impact Analysis
 Passage Key Inlet, Florida; CMS Modeling and Borrow Site Impact Analysis by Kelly R. Legault and Sirisha Rayaprolu PURPOSE: This Coastal and Hydraulics Engineering Technical Note (CHETN) describes the
ALTERNATIVES FOR COASTAL STORM DAMAGE MITIGATION AND FUNCTIONAL DESIGN OF COASTAL STRUCTURES
 The University of the West Indies Organization of American States PROFESSIONAL DEVELOPMENT PROGRAMME: COASTAL INFRASTRUCTURE DESIGN, CONSTRUCTION AND MAINTENANCE A COURSE IN COASTAL DEFENSE SYSTEMS I CHAPTER
Absecon Island Shore Protection The planning behind the project
 Absecon Island Shore Protection The planning behind the project Most residents of Atlantic City, Ventnor, Margate and Longport are now aware of upcoming plans to protect their common coastline with a beachfill
FINAL REPORT FOR 2013 ON THE CONDITION OF THE MUNICIPAL BEACHES IN THE TOWNSHIP OF UPPER, CAPE MAY COUNTY, NEW JERSEY
 FINAL REPORT FOR 2013 ON THE CONDITION OF THE MUNICIPAL BEACHES IN THE TOWNSHIP OF UPPER, CAPE MAY COUNTY, NEW JERSEY Aerial photograph at Corson s Inlet showing conditions on December 1, 2013 of the north
Nome Harbor Page 2 of 12
 Nome Harbor Nome Harbor Page 2 of 12 Condition of Improvements 30 December 2015 Nome Harbor, Alaska (CWIS No. 010422, 012270, 072742, 087755) Authorization (1) Rivers and Harbors Act, 8 August 1917 (House
2013 FEDERAL STORM RESPONSE
 2013 FEDERAL STORM Presented to the Florida Shore & Beach Association Sep 26, 2013 Presented by: COL Alan Dodd Commander, Jacksonville District September 2013 THE COLLABORATION 2 THE PROGRAM 3 THE STORMS
1-32 NOME HARBOR, ALASKA (CWIS NOS , 87755, 12270, & 10422) Condition of Improvement 30 September 2012
 Condition of Improvement 30 September 2012") NOME HARBOR 1-32 NOME HARBOR, ALASKA (CWIS NOS. 72742, 87755, 12270, & 10422) Condition of Improvement 30 September 2012 AUTHORIZATION: (1) Rivers and Harbors Act, 8 August 1917 (House Doc. 1932, 64th
NOME HARBOR 1-32 NOME HARBOR, ALASKA (CWIS NOS. 72742, 87755, 12270, & 10422) Condition of Improvement 30 September 2012 AUTHORIZATION: (1) Rivers and Harbors Act, 8 August 1917 (House Doc. 1932, 64th
La Quinta Channel Extension Port of Corpus Christi Ingleside, Texas. Mark Coyle
 La Quinta Channel Extension Port of Corpus Christi Ingleside, Texas Mark Coyle Corpus Christi Navigation Channel PCCA La Quinta Expansion Project History Corpus Christi Ship Channel Improvement Projects
2014 ANNUAL REPORT - TO THE CITY OF NORTH WILDWOOD ON THE CONDITION OF THE CITY BEACHES
 2014 ANNUAL REPORT - TO THE CITY OF NORTH WILDWOOD ON THE CONDITION OF THE CITY BEACHES View on September 25, 2014 looking northwest into Hereford Inlet. Considerable southerly expansion of the tip of
Atlantic Coast of Long Island, Jones Inlet to East Rockaway Inlet, Long Beach Island, NY Construction Update
 Atlantic Coast of Long Island, Jones Inlet to East Rockaway Inlet, Long Beach Island, NY Construction Update June 2016 US Army Corps of Engineers Project Purpose Three specific damage mechanisms of coastal
Beach Nourishment Impact on Beach Safety and Surfing in the North Reach of Brevard County, Florida
 Beach Nourishment Impact on Beach Safety and Surfing in the North Reach of Brevard County, Florida Prepared by John Hearin, Ph.D. Coastal Engineering Vice Chairman Cocoa Beach Chapter Port Canaveral Patrick
Estimated on-the-ground start and end dates: 1 June October 2018
 A. Applicant Information Name of Organization: U.S. Army Corps of Engineers, Carlyle Lake 801 Lake Road, Carlyle, IL 62231 Contact Information: Robert Wilkins, Operations Manager, (618) 594-2484, Robert.Wilkins@usace.army.mil
MOREHEAD CITY HARBOR, NC. Dredged Material Management Plan (DMMP)
") MOREHEAD CITY HARBOR, NC Dredged Material Management Plan (DMMP) Public Meeting/Info Session 15 January 2014 US Army Corps of Engineers Morehead City Harbor DMMP Presentation Topics Morehead City Harbor
MOREHEAD CITY HARBOR, NC Dredged Material Management Plan (DMMP) Public Meeting/Info Session 15 January 2014 US Army Corps of Engineers Morehead City Harbor DMMP Presentation Topics Morehead City Harbor
2013 ANNUAL REPORT - TO THE CITY OF NORTH WILDWOOD ON THE CONDITION OF THE CITY BEACHES
 2013 ANNUAL REPORT - TO THE CITY OF NORTH WILDWOOD ON THE CONDITION OF THE CITY BEACHES View on June 18, 2013 from the 2 nd Avenue jetty looking south while the 2013 beach nourishment project was under
New Jersey Beach Profile Network Atlantic County Profile Site Locations
 215 RICHARD STOCKTON COLLEGE OF NEW JERSEY New Jersey Beach Profile Network Atlantic County Profile Site Locations COASTAL RESEARCH CENTER Figure 128 There are nine NJBPN survey sites on the Atlantic County
Climate Change Impacts to KSC Launch Complex
 Climate Change Impacts to KSC Launch Complex Presented to: 2010 International Workshop on Environment and Energy By: John Shaffer NASA Environmental Management Branch Kennedy Space Center Hurricane Season
APPENDIX M DREDGED MATERIAL MANAGEMENT PLAN (DMMP) FINAL INTEGRATED FEASIBILITY REPORT AND ENVIRONMENTAL ASSESSMENT
 FINAL INTEGRATED FEASIBILITY REPORT AND ENVIRONMENTAL ASSESSMENT") APPENDIX M DREDGED MATERIAL MANAGEMENT PLAN (DMMP) Brazos Island Harbor, Texas Channel Improvement Study FINAL INTEGRATED FEASIBILITY REPORT AND ENVIRONMENTAL ASSESSMENT This page is intentionally left
APPENDIX M DREDGED MATERIAL MANAGEMENT PLAN (DMMP) Brazos Island Harbor, Texas Channel Improvement Study FINAL INTEGRATED FEASIBILITY REPORT AND ENVIRONMENTAL ASSESSMENT This page is intentionally left
ATLANTIC COAST OF LONG ISLAND, JONES INLET TO EAST ROCKAWAY INLET, LONG BEACH ISLAND, NY. Contract #2 Construction Scope. April 18th-19th 2018
 ATLANTIC COAST OF LONG ISLAND, JONES INLET TO EAST ROCKAWAY INLET, LONG BEACH ISLAND, NY Contract #2 Construction Scope April 18th-19th 2018 New York District PLAN COMPONENTS Length of Beachfill 35,000
Overview. Beach Features. Coastal Regions. Other Beach Profile Features. CHAPTER 10 The Coast: Beaches and Shoreline Processes.
 Overview CHAPTER 10 The Coast: Beaches and Shoreline Processes Coastal regions constantly change. The beach is a dominant coastal feature. Wave activity continually modifies the beach and coastal areas.
2015 ANNUAL REPORT - TO THE CITY OF NORTH WILDWOOD ON THE CONDITION OF THE CITY BEACHES
 2015 ANNUAL REPORT - TO THE CITY OF NORTH WILDWOOD ON THE CONDITION OF THE CITY BEACHES Ariel view of North Wildwood looking south from the Hereford Inlet perspective on June 24, 2015. The main channel
CLAM PASS ANNUAL RESTORATION & MANAGEMENT PLAN TIDAL ANALYSIS ELEMENT REPORT NO. 13
 CLAM PASS ANNUAL RESTORATION & MANAGEMENT PLAN TIDAL ANALYSIS ELEMENT REPORT NO. 13 Submitted to: Pelican Bay Services Division Prepared by: Humiston & Moore Engineers H&M File No. 13-078 November 2012
SELECTION OF THE PREFERRED MANAGEMENT OPTION FOR STOCKTON BEACH APPLICATION OF 2D COASTAL PROCESSES MODELLING
 SELECTION OF THE PREFERRED MANAGEMENT OPTION FOR STOCKTON BEACH APPLICATION OF 2D COASTAL PROCESSES MODELLING C Allery 1 1 DHI Water and Environment, Sydney, NSW Abstract This paper presents an approach
INTRODUCTION TO COASTAL ENGINEERING AND MANAGEMENT
 Advanced Series on Ocean Engineering Volume 16 INTRODUCTION TO COASTAL ENGINEERING AND MANAGEMENT J. William Kamphuis Queen's University, Canada World Scientific Singapore New Jersey London Hong Kong Contents
23- Year Sand Volume Changes at Site 132, 15th Street, Brigantine
 149 Figure75. Location map for the 9 NJBPN profile sites in Atlantic County, NJ ATLANTIC COUNTY SPRING 2008 to FALL 2009 150 The Atlantic County oceanfront shoreline consists of three barrier islands.
Australian Coastal Councils Conference
 Australian Coastal Councils Conference Kiama March 2019 Where Has My Beach Gone? (and what can I do about it?) Dr Andrew McCowan Water Technology Where Has My Beach Gone? Where Has My Beach Gone? Where
PUBLIC EXHIBITION OF COASTAL ZONE MANAGEMENT PLAN FOR COLLAROY-NARRABEEN BEACH AND FISHERMANS BEACH
 ITEM 8.3 REPORTING MANAGER TRIM FILE REF 2014/110936 ATTACHMENTS PUBLIC EXHIBITION OF COASTAL ZONE MANAGEMENT PLAN FOR COLLAROY-NARRABEEN BEACH AND FISHERMANS BEACH GROUP MANAGER NATURAL ENVIRONMENT 1
Chapter 10 Lecture Outline. The Restless Oceans
 Chapter 10 Lecture Outline The Restless Oceans Focus Question 10.1 How does the Coriolis effect influence ocean currents? The Ocean s Surface Circulation Ocean currents Masses of water that flow from one
Figure 106. Locations of the 28 NJBPN profile stations in Ocean County, NJ.
 130 Figure 106. Locations of the 28 NJBPN profile stations in Ocean County, NJ. 131 2016-2017 Beach Fills in Ocean County: The federal/state/local storm damage reduction project (beachfill) between Manasquan
Poorly located construction seaward
 Implementation of Geotextile T-Groins in Pinellas County, Florida By Nicole A. Elko, Ph.D. Pinellas County Department of Environmental Management 512 S. Fort Harrison Avenue, Clearwater, FL 33756 nelko@pinellascounty.org
Advanced Series on Ocean Engineering - Volume 14 COASTAL STABILIZATION. Richard Silvester John R C Hsu. \v? World Scientific
 Advanced Series on Ocean Engineering - Volume 14 COASTAL STABILIZATION Richard Silvester John R C Hsu \v? World Scientific Contents PREFACE xv 1 INTRODUCTION 1 /. / Coastal Environment 2 J.2 State of Beach
FINAL REPORT FOR 2013 ON THE CONDITION OF THE MUNICIPAL OCEANFRONT BEACHES THE BOROUGH OF AVALON, CAPE MAY COUNTY, NEW JERSEY
 FINAL REPORT FOR 2013 ON THE CONDITION OF THE MUNICIPAL OCEANFRONT BEACHES THE BOROUGH OF AVALON, CAPE MAY COUNTY, NEW JERSEY View from 12 th Street to the south taken February 28, 2013, following completion
STATUS REPORT FOR THE SUBMERGED REEF BALL TM ARTIFICIAL REEF SUBMERGED BREAKWATER BEACH STABILIZATION PROJECT FOR THE GRAND CAYMAN MARRIOTT HOTEL
 August 23 STATUS REPORT FOR THE SUBMERGED REEF BALL TM ARTIFICIAL REEF SUBMERGED BREAKWATER BEACH STABILIZATION PROJECT FOR THE GRAND CAYMAN MARRIOTT HOTEL performed by Lee E. Harris, Ph.D., P.E. Consulting
The purpose and needs of the Figure Eight Island Inlet and Shoreline Management Project are as follows:
 Chapter 2 PURPOSE AND NEEDS 1. What are the purpose and needs of this project? The main concern of residents and owners at Figure Eight Island are economic losses resulting from damages to structures and
CHAPTER 8 ASSESSMENT OF COASTAL VULNERABILITY INDEX
 124 CHAPTER 8 ASSESSMENT OF COASTAL VULNERABILITY INDEX 8.1 INTRODUCTION In order to assess the vulnerability of the shoreline considered under this study against the changing environmental conditions,
Oceans and Coasts. Chapter 18
 Oceans and Coasts Chapter 18 Exploring the oceans The ocean floor Sediments thicken and the age of the seafloor increases from ridge to shore The continental shelf off the northeast United States Constituent
Dare County Nourishment Project Town of Duck
 Dare County Nourishment Project Town of Duck Julien Devisse, P.E. and Ken Willson CB&I / Coastal Planning & Engineering of North Carolina, Inc. February 15, 2017 A World of Solutions Outline Background
Q1. What are the primary causes/contributors to coastal erosion at Westshore and the concept of longshore / littoral drift.
 Q1. What are the primary causes/contributors to coastal erosion at Westshore and the concept of longshore / littoral drift. In order of (timing related) contribution to present problem 1. Beach is too
AN OVERVIEW OF RECENT PROJECTS RELATED TO SAND BUDGETS, SOUTHERN CALIFORNIA BEACHES
 AN OVERVIEW OF RECENT PROJECTS RELATED TO SAND BUDGETS, SAND SUPPLY, COASTAL ARMORING, MANAGEMENT, AND VALUING SOUTHERN CALIFORNIA BEACHES Dr. Kiki Patsch California State University Channel Islands Environmental
MEMORANDUM. Existing Operations. City of Clearwater. Michael Herrman. Date: January 26, Seminole Boat Launch Overview. M&N Job No.
 1509 W. Swann Avenue, Suite 225 Tampa, FL 33606 (813) 258-8818 Fax (813) 258-8525 www.moffattnichol.com MEMORANDUM To: From: City of Clearwater Michael Herrman Date: Subject: Seminole Boat Launch Overview
CITY OF COCOA BEACH 2025 COMPREHENSIVE PLAN. Section VIII Mobility Element Goals, Objectives, and Policies
 CITY OF COCOA BEACH 2025 COMPREHENSIVE PLAN Section VIII Mobility Element Goals, Objectives, and Policies Adopted August 6, 2015 by Ordinance No. 1591 VIII MOBILITY ELEMENT Table of Contents Page Number
Impact of Hurricane Matthew on the Atlantic Coast of Florida
 Impact of Hurricane Matthew on the Atlantic Coast of Florida A coastal engineer was driving across country and his jeep broke down in front of a monastery. It was late in the day and the monks invited
1-32 NOME HARBOR, ALASKA (CWIS NOS , 87755, & 10422) Condition of Improvement 30 September 2009
 Condition of Improvement 30 September 2009") NOME HARBOR 1-32 NOME HARBOR, ALASKA (CWIS NOS. 72742, 87755, & 10422) Condition of Improvement 30 September 2009 AUTHORIZATION: (1) Rivers and Harbors Act, 8 August 1917 (House Doc. 1932, 64th Congress,
NOME HARBOR 1-32 NOME HARBOR, ALASKA (CWIS NOS. 72742, 87755, & 10422) Condition of Improvement 30 September 2009 AUTHORIZATION: (1) Rivers and Harbors Act, 8 August 1917 (House Doc. 1932, 64th Congress,
United States Department of the Interior
 United States Department of the Interior John Kennelly, Chief Planning Branch Department of the Army New England District U.S. Army Corps of Engineers 696 Virginia Rd Concord, Massachusetts 01742 FISH
GONE! Coastal Erosion Happens During Storms! Why Worry About Coastal Setbacks? Goals for Today
 RI Regulatory Setbacks & Buffers: Coastal Zone Management Issues New England Onsite Wastewater Training Program @ URI OWT 155 November 21, 2013 Goals for Today Understand the impacts of storms, coastal
Feasibility Report and Environmental Impact Statement. Coastal Storm Damage Reduction SURF CITY AND NORTH TOPSAIL BEACH, NORTH CAROLINA.
 Feasibility Report and Environmental Impact Statement on Coastal Storm Damage Reduction SURF CITY AND NORTH TOPSAIL BEACH, NORTH CAROLINA Appendix H Correspondence Appendix H Correspondence This appendix
Planning Considerations for Nearshore Placement of Mixed Dredged Sediments
 Planning Considerations for Nearshore Placement of Mixed Dredged Sediments PURPOSE: Dredging planning and management decisions are based on a combination of engineering and economic factors tempered by
Impacts of breakwaters and training walls
 Across the eastern seaboard of Australia, breakwaters and training walls have instigated fundamental perturbations to coastal and estuary processes. This has induced long-term changes to foreshore alignments,
Nearshore Sediment Transport What influences the loss of sediment on Beaches? - Waves - Winds - Tidal Currents - River discharge - Runoff
 Tides & Beaches Nearshore Sediment Transport What influences the loss of sediment on Beaches? - Waves - Winds - Tidal Currents - River discharge - Runoff Oceans Ocean Topography Physical Structure of the
Lecture Outlines PowerPoint. Chapter 15 Earth Science, 12e Tarbuck/Lutgens
 Lecture Outlines PowerPoint Chapter 15 Earth Science, 12e Tarbuck/Lutgens 2009 Pearson Prentice Hall This work is protected by United States copyright laws and is provided solely for the use of instructors
Coastal Hazards and Management in North Carolina. Braxton Davis April 14, 2015
 Coastal Hazards and Management in North Carolina Braxton Davis April 14, 2015 Coastal Facts and Figures 320 miles of ocean beaches 12,000+ miles of estuarine shoreline 2 million + acres of sounds, creeks,
ST. JOHNS GOLF CLUB PHASE II FINDINGS, PHASE III RECOMMENDATION, AND POTENTIAL PARTNERSHIP OPPORTUNITY
 ST. JOHNS GOLF CLUB PHASE II FINDINGS, PHASE III RECOMMENDATION, AND POTENTIAL PARTNERSHIP OPPORTUNITY Board of County Commissioners January 16, 2018 Introduction St. Johns Golf Club: Opened in 1989.
Figure 38. Locations of the 28 NJBPN profile stations in Ocean County, NJ.
 55 Figure 38. Locations of the 28 NJBPN profile stations in Ocean County, NJ. 56 Individual Site Descriptions: Northern Ocean County recovered its beaches approaching pre-hurricane Sandy elevation or width,
Table 4. Volumetric Change Rates Pre-Project and Post-Project for the Town of Duck
 V. VOLUMETRIC CHANGES General Volumetric changes measured over the entire monitoring area for various time periods are provided in Table 4. The volume changes are given in terms of cubic yards/foot of
Shorelines Earth - Chapter 20 Stan Hatfield Southwestern Illinois College
 Shorelines Earth - Chapter 20 Stan Hatfield Southwestern Illinois College The Shoreline A Dynamic Interface The shoreline is a dynamic interface (common boundary) among air, land, and the ocean. The shoreline
GENERAL METHODOLOGY FOR INLET RESERVOIR MODEL ANALYSIS OF SAND MANAGEMENT NEAR TIDAL INLETS. Mohamed A. Dabees 1, Nicholas C.
 GENERAL METHODOLOGY FOR INLET RESERVOIR MODEL ANALYSIS OF SAND MANAGEMENT NEAR TIDAL INLETS Mohamed A. Dabees 1, Nicholas C. Kraus 2 1 Humiston& Moore Engineers, 5679 Strand Court, Naples, FL 34109, USA.