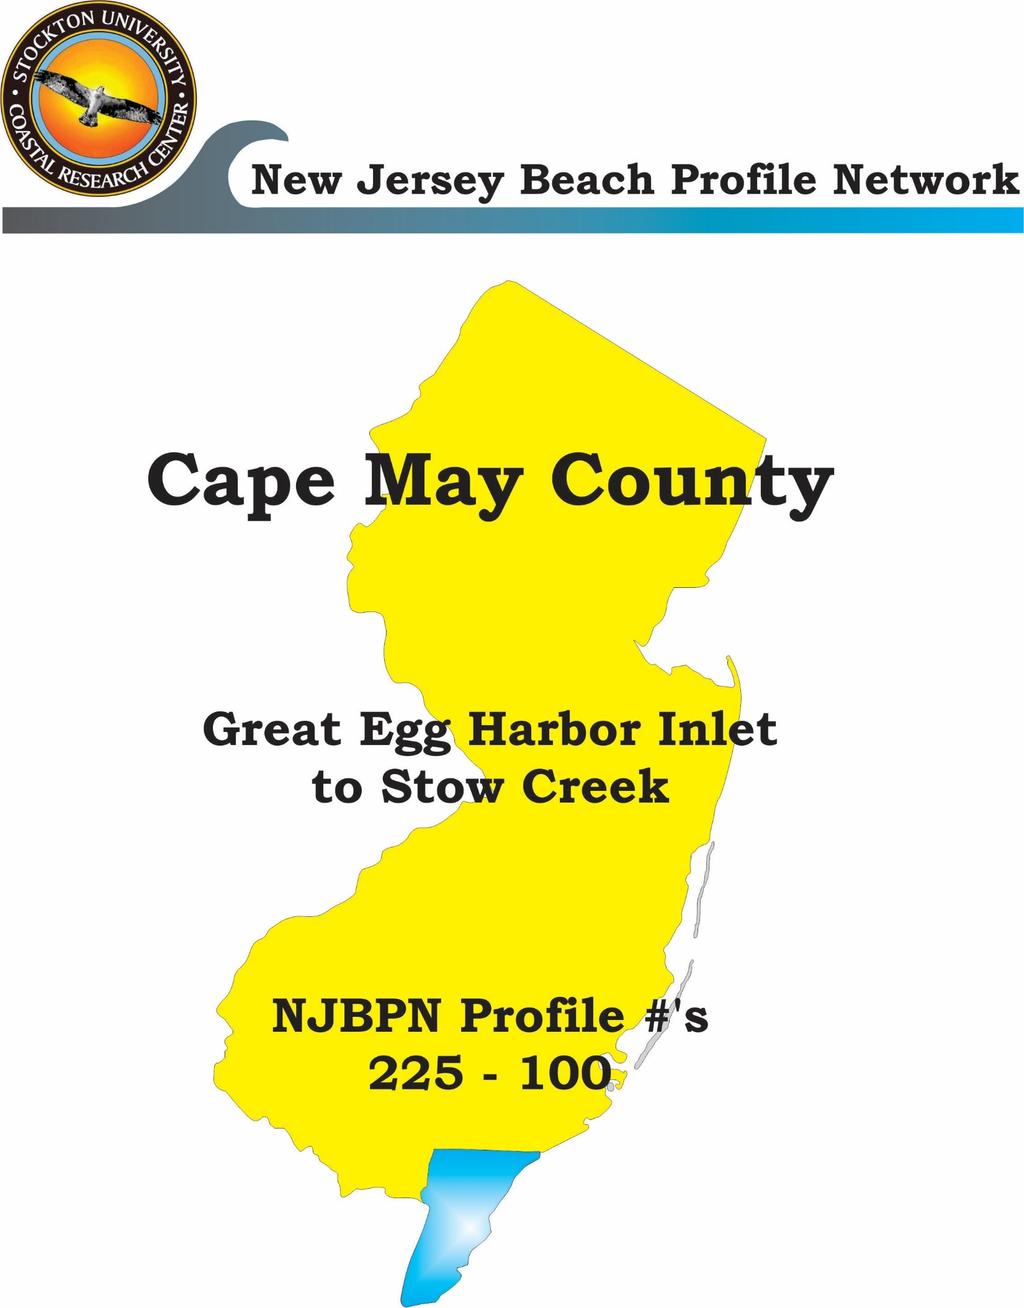
Figure 78. Map of Cape May County showing the locations of the 31 profile sites in the county.
|
|
|
- Phillip Malone
- 5 years ago
- Views:
Transcription
1 103

2 Figure 78. Map of Cape May County showing the locations of the 31 profile sites in the county. 104
3 Cape May County in 2015: Cape May County has 31 survey stations between Reeds Beach on the Western Cape May County shoreline, around Cape May Point and up the ocean coastline to Great Egg Inlet in Ocean City. This county has five tidal inlets separating four barrier islands and a complex coastal geomorphic compartment that is the site of Cape May City, a US Coast Guard base and Cape May Point. Each inlet has near identical geomorphic conditions with a narrow, rapidly changing southern spit that curves deep into the inlet, a large ebb-tidal delta offshore and a distinct offset in the seaward position of the southern inlet shoreline due to wave refraction around the ebbtidal delta. This makes the northeast corner of each island vulnerable to northeast wave conditions especially when the main tidal channel lies close to the southern shoreline of the inlet. Each island has at least one profile location where the 29-year surveying history is one of repetitive erosion cycles following each restoration attempt going back to 1983 in Ocean City and 1984 at Strathmere (NJ State/local projects followed later by Federal work). Avalon conducted a State/local project in 1987, followed 22 years later by the State and North Wildwood in Episodic deposition has occurred in the mid-section of the four barrier islands yielding generous dunes and wide beaches (20 th Street in Ocean City, Williams Road in Strathmere, 35 th Street in Avalon, and Cresse Avenue in Wildwood Crest). Sand moves eventually to the southern tip of each island creating a rapidly changing environment at the northern side of each tidal inlet (Corson s Inlet state park, Townsend s Inlet, South Point in Stone Harbor, and the Cape May Nature Conservancy). The large scale federal shore protection projects are guaranteed to accelerate these two processes with evidence well in hand that the spectacular growth in South Point on Seven-Mile Island since 1995 is entirely due to beach nourishment in Stone Harbor derived from the sand in the ebb-tidal shoals of Hereford Inlet. The expansion of the Nature Conservancy beach south of Cape May City since 1989 beach nourishment commencement in Cape May City is due to sand migration via longshore transport. Western Delaware Bay Shoreline of Cape May County; During 2014 habitat restoration work commenced under an umbrella of wildlife oriented groups funded with National Fish & Wildlife Sandy recovery money. Attention has been focused on the western shoreline of Cape May County over the past two and a half years largely due to the loss of horseshoe crab egg laying habitat at the marsh edge beaches. These thin veneers of coarse sand have been the choice area for millions of the crabs to lay eggs each May. The result was their separate use by the Red Knot shorebird as fuel for their long breeding flight from south to north each spring. Sand was supplied from Cape May County quarries and engineered to have a sloping berm and an elevation just above normal mean higher high water. Work expanded during 2015 westward along the Delaware Bay shoreline into Cumberland County (Fortescue and Money Island) providing additional locations where the marshes at the water s edge received quantities of suitable sand to replace horseshoe crab egg-laying sites wiped out by Hurricane Sandy. Other efforts focused on sediment distribution budgets and documentation of wave energy flux (heights, periods and direction of travel) along the lower Delaware Bay NJ shoreline. Sandy ripped up the sand veneer and washed it inland among the marsh grasses leaving bare sod and mud in place of sand. Work included habitat restoration using quarry sand and building oyster reef sites along the bayshore in relatively shallow water. Marsh restoration is being incorporated into the Maurice River delta area to convert extensive mud flats back into viable marsh habitat. In addition, a federal project long on the sidelines, is being re-examined for implementation on the western Cape May County bayshore using Delaware Bay dredge sand that has been discharged at what is called buoy 10 at the mouth of the bay. Cape May City; Cape May City beaches all added sand to the berm as a wedge during the summer of This material was stable until a series of days in early October 2015 that transported about 35,000 cubic yards of sand around the 105
4 3 rd Avenue groin into The Cove on the conservancy beach. This was repeated by a factor of two January 23, 2016 (NE Storm Jonas). Added studies were approved by the City to better understand the beach configuration and seaward slope data following a number of injury complaints alleged to be the result of a too steep a beach and enhanced wave breaking at the beach. The Wildwoods; The North Wildwood profile appears to have lost a substantial sand volume as the shoreline retreated 195 feet and shed yds 3 /ft. in sand volume, but sand continued to accumulate at the southern three sites. Cresse Avenue advanced seaward another 43 feet as the berm grew ever wider. The other two advanced between 40 and 13 feet further seaward. Work by the Philadelphia District ACOE continues toward an approved design document for the Wildwoods that includes sand harvesting from Wildwood and Wildwood Crest and passing it back north to the erosion zone in North Wildwood as opposed to pumping in new sand from offshore or Hereford Inlet tidal shoals. The City of North Wildwood is conducting mirrored sand harvesting work as well transferring 37,000 cy of Wildwood sand north in early 2015 and receiving 38,000 cy in dredged sand from Beach Creek in the fall of 2015 all placed between 2 nd and 5 th Avenues on the oceanfront. Sand backpassing from Wildwood continues in early Avalon & Stone Harbor; These two communities have been leaders in shore protection by having successfully managed to have Federal shore protection projects constructed and have for years, promoted wider, higher dunes with coordinated development of pedestrian access pathways that do not make a breach easier at street end access points. The US Army Corps of Engineers completed a project restoration from the 8 th Street jetty to 31 st Street in Avalon and from 70 th Street in Avalon south to the terminal groin south of 123 rd Street in Stone Harbor. This work was completed under PL Emergency Restoration funds for Hurricane Sandy damage to ACOE project. Since that was completed in early 2013, erosion claimed the sand to the revetment rocks at 12 th Street in Avalon. The Borough conducted its individual beach project in 2015 adding 740,000 cy between 9 th and 25 th Streets. Currently a sand backpassing operation is underway to move sand from the mid-island borrow zone beaches to the erosional part of the island. Stone Harbor s southern oceanfront has suffered severe loss rates culminating in NE storm damage in early 2016 leading to substantial dune erosion. An effort to utilize sand extracted from lagoon dredging along the bayshore as beach augmentation has run into difficulties with fine sediment storage failure of geo-textile bags bursting in the municipal marina parking lot. Sea Isle City & Strathmere; A 2009 NJ State and locally sponsored shore protection project saved these two communities substantial damage from Hurricane Sandy with about 230,000 cubic yards of sand lost that is proposed to be replaced starting April 17, 2015 in Ocean City under ACOE responsibility for Ludlam Island. This project covers from 42 nd Street to 59 th Street in Ocean City then will extend from Seaspray Avenue south to 93 rd Street in Stone Harbor and will be accomplished using sand from offshore borrow sites previously defined. Sand was added first in Ocean City, then starting in Strathmere and working south finishing at 93 rd Street in Sea Isle City. Over 3.4 million cubic yards of new sand was pumped onto this island from offshore borrow sites in The Corson s Inlet State Park shoreline south of development in Ocean City suffered dune loss of considerable magnitude during Hurricane Sandy. Since sand moves south naturally under wave dominance from the northeast, this shoreline should benefit from any sand losses in Ocean City s part of the new project. The dune will need fencing to encourage reconstruction as the beach widens. The position of the main tidal channel in 106
5 Corson s Inlet has been monitored because it s position vis-à-vis the Strathmere inlet shoreline is critical to the rates of erosion seen on the southern shoreline. Ocean City; The Ludlam island project also includes 1.5 million cubic yards of sand for the southern shoreline of Ocean City that was damaged by Hurricane Sandy due to low, narrow dunes. This places the shoreline between Great Egg Inlet in Ocean City and Hereford Inlet in Stone Harbor under ACOE project jurisdiction with a 3 to 5 year expectancy of maintenance work on restoring these beaches to the design specifications. 107
. The dune and some of the berm that was created by the 2013 Federal emergency beach fill remained throughout 2014 and 2015. Seasonal volume losses (-59.")

6 NJBPN Gardens Road, Ocean City The Gardens Road site is the northernmost profile in Ocean City and located near Great Egg Inlet. (Left photo is from September 8, Right photo is from September 1, 2015). The dune and some of the berm that was created by the 2013 Federal emergency beach fill remained throughout 2014 and Seasonal volume losses ( yds 3 /ft.) occurred between surveys 49 and 50. The summer 2015 gains did not sufficiently rebuild the dry beach to its design width but the dunes remained in good condition. INSTRUMENT STATION Figure 79. The profiles above show the dynamic cross shore movement of nearshore sandbars onto the dry beach. Volume losses occurred across the entire profile between fall 2014 and fall 2015 (-52.9 yds 3 /ft.) and the shoreline moved landward (-52.6 ft.). 108
 shows a narrowed berm. Some dune scarping occurred over the course of the year, but vegetation was healthy.")
.")
7 NJBPN th Street, Ocean City The left photo (taken September 8, 2014) shows a wide berm still present from the USACE (2013) beach fill. The right photo (taken September 1, 2015) shows a narrowed berm. Some dune scarping occurred over the course of the year, but vegetation was healthy. BULKHEAD BOARDWALK Figure 80. This site continued its erosional trend for Between fall 2014 and fall 2015, volume losses were yds 3 /ft. and the shoreline moved landward (-38.1 ft.). Sand volume losses were seen for each season, though the shoreline location fluctuated landward, then seaward by September


8 NJBPN th Street, Ocean City The 20 th Street profile is located near the center of the island and hosts an extensive dune and wide berm. The area now appears stable since the initial beach restoration in Photo on left taken September 8, Right photo taken September 1, The dune continued to move slightly seaward and there were volumetric gains over the course of BOARDWALK Instrument Station BULKHEAD Figure 81. From fall 2014 to fall 2015, the site gained yds 3 /ft. and the shoreline moved seaward 55.1 ft. most likely from the movement of the nearshore bar onto the beach. As expected, most of the sediment gains occurred between the spring to fall time frame for both 2014 and The landward dune ridge remains constant at elevation 16.5 feet and benefits the storm protection capabilities of the dune system at this location. This site is a great example of mid-island accretion due to beach work. 110


9 NJBPN th Street, Ocean City The comparison photos to the south (left taken September 5, 2014 and right photo taken August 31, 2015) show minimal changes to the dune vegetation with respect to the location of the dune fencing. This profile is located nearly in the center of the island and continued modest volumetric gains for both 2014 and Figure 82. Over the course of 14 months (spring 2014 to fall 2015) the profile gained yds 3 /ft. and the shoreline moved seaward 34.0 ft. The dune remained stable as was the berm elevation. Nearshore bars are present in all surveys and are the catalysts for sediment deposition above the 0.0 ft. datum. Some volume losses and landward shoreline movement were recorded between the fall 2014 and spring 2015 surveys but gains returned in the following seasons (Tables 17 and 18). 111

 the dune was constructed and planted with vegetation and fenced at the dune s seaward toe. Figure 83.")
10 NJBPN th Street, Ocean City In 2015, the 56 th Street site received its first sand replenishment since the 1995 state beach fill. In the past few years, the profile experienced seasonal gains and losses. The site is now included in the federally authorized project. The September 3, 2014 (left) photo shows the pre-project dune and berm. On the right (photo taken November 24, 2015 after completion of the federal project) the dune was constructed and planted with vegetation and fenced at the dune s seaward toe. Figure 83. The November 2015 survey shows the design profile of the federal dune and berm. Shoreline and volume gains were recorded prior to the beach fill (spring 2014 spring 2015). The fall 2014 to fall 2015 comparison includes the federal beach fill with volume gains of yds 3 /ft. and shoreline advance of ft. 112
.")
.")
11 NJBPN th Street, Ocean City The 59 th Street site is located at the southern end of the developed section of Ocean City within the Corson s Inlet State Park. This site is also within the 2015 federal beach fill project area. Since 2013, the profile has experienced natural dune growth (left photo taken September 5, 2014). The right photo (taken October 19, 2015) shows the federal contractor s construction equipment and a wide berm. Figure 84. The federal beach fill project generated volume and shoreline gains between the spring 2015 and fall 2015 surveys ( yds 3 /ft. sand volume and ft. shoreline advance). Sand was added to the top of the existing dune and the berm elevation was raised between 2 and 7 ft. This site experiences fluctuating erosional and depositional trends. The spring 2014 to spring 2015 comparison shows minor volume losses (-4.59 yds 3 /ft.) but shoreline retreat (-50.7 ft.) as nearshore sand bars slowly added sand to the beach berm (surveys #49 and #50). 113


12 NJBPN Corson s Inlet State Park, Ocean City Natural dune recovery has occurred following Hurricane Sandy which destroyed the foredune. Photo on left taken September 5, 2014 shows the berm and a narrow dry beach. The right photo taken October 19, 2015 followed the federal project with erosion on the beach, but a vast deposit offshore. Figure 85. The loss of beach width between surveys #48 and #51 was combined with dune erosion, but by October 2015, the sand placement in Ocean City has begun to appear as the massive bar offshore. This bar will migrate onto the beach and improve its width and allow for an improved the dune. 114
, but the beach width decreased and eventually the dune eroded dramatically.")

13 NJBPN Williams Road, Strathmere The Williams Road site is strongly influenced by the ebb-tidal delta at Corson s Inlet. In 2013, there was a wide dune that continued into September 3, 2014 (left photo), but the beach width decreased and eventually the dune eroded dramatically. Right photo was taken August 31, 2015 and shows the impact of the federal project. The dune was rebuilt and combined with a 500 foot wider dry beach. Figure 86. Beach retreat into the dunes commenced after the early 2014 survey and accelerated during the winter of 2014 to The federal project pumped sand from offshore rebuilding the dune and a wide beach ( yds 3 /ft. added sand and a 321-foot shoreline advance). 115
14 NJBPN st Street, Sea Isle City The dune here at the 1 st Street location consists of a geotextile core covered by sand. Storm damage was minimal and natural recovery has blended in well with the surviving vegetation. Photo on left taken September 3, 2014 at the toe of the original dune finished in Right photo taken August 31, 2015 following the federal project building an addition to the dune plus the new beach template. Figure 87. Change prior to the federal beach fill in 2015 saw a decent sized berm deposited on the beach. The fill project added yds 3.ft. in new sand from sources well offshore with the resulting 338-foot wider beach. The offshore sand source has provided over 3.4 million cubic yards of new sand never previously on the NJ coastline for Ludlam Island. 116


15 NJBPN th Street, Sea Isle City The 25 th Street site is positioned near the northern limit of development east of Commonwealth Avenue. The site is reasonably stable and was enhanced in 2009 under the NJ State project. The left photo taken on September 2, 2014 and shows the foredune development with growing vegetation. The right photo taken on November 24, 2015, shows the fenced off dune zone located seaward of the original feature with new pedestrian access path fencing installed. Figure 88. Beach berm growth was seen at this site as well following summer accretion in The federal project was in progress by November 2015 with modest impact as of that date. Just yds 3 /ft. in new sand was present with a 58-foot shoreline advance. The massive offshore bar is evidence for sand supplies infiltrating from the north. 117


16 NJBPN th Street, Sea Isle City The left photo (taken September 2, 2014 shows sand accumulating around the fencing at this site. The right photo taken on November 24, 2015 shows work in progress for the federal project as it worked its way south toward Townsend s Inlet. PROMENADE Instrument Station Figure 89. Beach changes prior to the federal project arriving amounted to typical summer beach accretion with few other impacts. The federal sand added yds 3 /ft. in new sand both on the beach and as a huge bar offshore. The shoreline advanced 130 feet. This offshore feature probably was not counted toward project payment since it was well outside the normal pay zone for the project. Earlier sand losses in the completed sections accrued to the south as progress was made providing a hidden sand source going forward. 118
17 NJBPN th Street, Sea Isle City The left photo was taken September 2, 2014 and shows the southern beach and dunes prior to the federal work. The right photo, taken on November 24, 2015, shows the new fencing line on the added dune feature along with the wider beach in Sea Isle City. Figure 90. Little changed during the first 12 months of the study interval, but the federal project had a dramatic impact. A total of yds 3 /ft. in new sand was deposited both on the beach and as this progressively enhanced offshore bar feature that followed sand placement south yds 3 /ft. resides in this bar, a common beach change sand volume across the entire profile normally. The shoreline advanced 296 feet seaward. 119

18 NJBPN th Street, Avalon The 9 th Street site is located near the Townsend s Inlet south jetty. There was no wave attack on the properties due to Sandy and the beach was restored during The dune fence shows a considerable accumulation at the fence with a narrow beach beginning to emerge to the south by September 15, The right photo taken, on October 7, 2015, followed an Avalonfunded beach restoration in 2015 augmenting the post-sandy federal work in BULKHEAD Figure 91. The sand volume present as of June 2014 shows that the federal work a year earlier had been depleted. Further loss occurred over the winter of 2014 to The increase by October 2015 was due to the Borough project. The comparison for surveys #50 and #51 shows a sand volume increase of yds 3 /ft. and a shoreline advance of 133 feet. 120

19 NJBPN rd Street, Avalon The left photo (taken September 15, 2014) shows a narrow dry beach following the loss of the majority of the federal post- Sandy fill effort. The right photo taken on October 7, 2015 following the local response in placing 740,000 cy of added sand. BOARDWALK Figure 92. The beach did not show a dramatic sand volume increase other than the formation of an extensive offshore bar following sand placement in The summer accumulation between June and October 2015 was a gain of yds 3 /ft. and a shoreline advance of 44 feet. This bar contains sand moved south into the site. 121


20 NJBPN th Street, Avalon This site lies south of the beach nourishment areas and is located in an accreting area of the municipality. The left photo, taken September 16, 2014, shows the wide dry beach and dunes looking north toward the fishing pier. The right photo, taken on October 9, 2015, shows yet more sand added near the fencing with work in progress extending the pier seaward to put its seaward end back over water. Instrument Station Figure 93. Sand added to the dune during the summer of 2014 and sand came and went from the beachface over time. The offshore bar reflects the addition of 740,000 cy in new sand volume injected to the north in

21 NJBPN th Street, Avalon The 70 th Street location has been a stable area for decades and lies at the very north limit of the Stone Harbor segment of the ACOE shore protection project that has a break between 31 st Street and 70 th Street due to the segment having long term shoreline stability not requiring maintenance. The left photo was taken September 16, 2014 and shows the wide seaward dune slope with grass advancing onto the beach. The right photo, taken October 8, 2015, shows fencing added since 2014, yet partially buried by constant wind transport of sand into the dune area. Instrument Station Figure 94. Dune enhancement similar to that seen at 35 th Street added to the protective value of the feature The spring 2014 to fall 2015 comparison shows that the beach sustained minor changes with a pair of October 2015 offshore bars comprising (24.58 yds 3 /ft.) the majority of the 5.73 yds 3 /ft. sand volume change for the period. The shoreline retreated 11.2 feet. 123


22 NJBPN th Street, Stone Harbor The 90 th Street location is about a third the length of the Borough and has been quite stable not needing maintenance as frequently as sites further south. The left photo, taken September 12, 2014, shows the sand added at the fence producing a foredune feature. The right photo, taken on October 12, 2015, shows a narrower beach with more sand around the fencing. Instrument Station BULKHEAD Figure 95. Changes were dominated by offshore bar development. The volume of sand in the feature was yds 3 /ft. The trough was deep enough to generate a loss of yds 3 /ft. for the entire profile length. 124


23 NJBPN st Street, Stone Harbor The south end Stone Harbor site has shown a long-term erosional trend that may be influenced by changes surrounding Hereford Inlet. The site has been the recipient of numerous beach nourishment projects including municipal and Federal efforts. Most recent was spring 2013 as a post-sandy restoration. September 12, 2014 (left photo) shows the southern beach flat to the dune toe. The right photo, taken on October 13, 2015, shows near identical conditions. Figure 96. The site remains an erosional shoreline with excursions by waves into the dune toe. Survey #51 followed a multi-day northeast event in early October where waves built under modest wind conditions to the point of dune erosion. NE Storm Jonas was much worse cutting into the dune by 45% in late January


24 NJBPN th Avenue, North Wildwood The 15 th Avenue site is influenced by the dynamics at Hereford Inlet. A NJ State sponsored 2009 beach fill reversed a decade of erosion here. Photo on left was taken October 6, The right photo, taken on December 9, 2015 shows a somewhat narrower beach as a result of the early October 2015 NE storm event. Figure 97. Conditions present as of October 2014 deteriorated over the following winter and into the rest of The net change was a loss of yds 3 /ft. and a 195-foot shoreline retreat. About 38,000 cy of dredged sand was placed north of this site in the fall of 2015 along with about 34,000 cy of sand transferred north to the same location from the City of Wildwood prior to Memorial Day


25 NJBPN Cresse Avenue, Wildwood The Cresse Avenue site has been accumulating sand volume since Sand lost from North Wildwood migrates south adding to the beach width each year. The left photo, taken October 6, 2014, shows the vast beach width. The right photo, taken on December 9, 2015, repeats the expansive view but wider by 43 feet. Figure 98. A dune developed in 2014 remained in place with minor changes to the landward section of the dry beach. At the water s edge the berm grew higher and wider by 43 feet as yet more sand moved into the zone. The sand volume increased by yds 3 /ft. as the shoreline moved 43 feet seaward. 127


26 NJBPN Raleigh Avenue, Lower Township Left photo was taken on October 6, 2014 showing bar formation and the wide beach. The right photo, taken on December 9, 2015, shows the central zone of the beach and gives a good view of the width. Figure 99. The beach became a more uniform gradient by the end of 2015 with one large offshore bar. The total volume change was yds 3 /ft. with a 40-foot shoreline advance seaward. 128


27 NJBPN 208 Cape May National Wildlife Refuge, Lower Township The left photo was taken October 3, 2014 and is a view across the dunes and gentle shoreward gradient developed on the wide beach. The right photo was taken on December 9, 2015 and shows little change. Figure 100. Sand was added to the foredune area making the beach zone a little narrower as the dunes expanded. The change over 18 months was a 13-foot shoreline advance with a minor 0.27 yds 3 /ft. sand volume loss. NJBPN Cape May Beach Club, Cape May City 129


28 The left photo was taken August 27, The right photo was taken on September 17, 2015 and in comparison shows relative consistency in configuration and beach elevation. Figure 101. Little change occurred on the beach with one instance of bar formation offshore. The net study interval change was a gain of 2.41 yds 3 /ft. and a 12-foot shoreline advance. 130

29 NJBPN Baltimore Avenue, Cape May City The left photo was taken on August 27, The right photo was taken on September 17, Prior to 1989 the spot the photographer was standing at would have been 300 feet from the shoreline. OLD BULKHEAD SEA WALL Instrument Station Figure 102. Minimal change occurred on the beach with the offshore zone at its widest in March The net change was a sand volume increase of yds 3 /ft. and a 2-foot shoreline advance. 131


30 NJBPN Broadway Avenue, Cape May City The left photo was taken on August 27, The right photo was taken on September 17, 2015 and does show a wider beach relative to the rock groin in the distance. PROMENADE Figure 103. Sand moved into the area from the north and built a wider berm by September Early October storm events moved some of this material past the terminal groin and into the Nature Conservancy area yds 3 /ft. in sand volume were added with a 92-foot shoreline advance. 132

31 NJBPN Nature Conservancy, Cape May The left photo was taken August 28, The right photo taken on November 18, 2015, shows a flatter beachface and the deposition of new sand at the base of the groin bordering the development in the distance. Old Instrument Station New Instrument Station Figure 104. The original dune well landward was created in 1985 with an I-5 gravel core. The commencement of beach restoration in 1989 provided a periodic supply of sand leaving the Cape May City project so that the 600-foot advance in the shoreline is the result summer retreat was extensive, but new material has moved into the area as a result of recent storms (October 2015 and Jonas in January 2016). The net change was a yds 3 /ft. sand volume loss and a 121-foot shoreline retreat landward. 133


32 NJBPN Lake Drive, Cape May Point The left photo was taken on August 28, The right photo was taken on November 18, 2015 after the visitors departed. Figure 105. Sand at the beach retreated, but raised the dune toe elevation by over a foot. The net change was a sand volume loss of yds3/ft. with a 32-foot shoreline retreat. 134


33 NJBPN Higbee Beach State Park, Lower Township The left photo was taken August 28, The right photo taken November 18, 2015, shows some sand cut from the midbeach area, but few other changes. Figure 106. No further bluff losses occurred over the past 18 months with few other changes as well. The net was a shoreline retreat of just 7 feet and a sand volume loss of 7.73 yds 3 /ft. 135


34 NJBPN Whittier Avenue, North Cape May The left photo was taken on September 24, The right photo, taken on November 17, 2015, shows a narrower beach. Figure 107. The beach was narrower than in survey #49, but wider than it was in May The net change was a sand volume gain of 0.64 yds 3 /ft. and a 0.4-foot shoreline retreat. 136


35 NJBPN Pacific Avenue, Villas The left view was taken September 24, Right photo was taken on November 17, Minimal change occurred at Pacific Avenue with some dune grass growth toward the bay. Figure 108. Stability is the word at this location with an 11-foot shoreline retreat, but a 1.41 yds 3 /ft. sand volume increase. 137


36 NJBPN Reeds Beach, Middle Township The left photograph was taken on September 24, The right photo was taken on November 17, The two views show the road and dune landward of the road and the new ridge of sand placed on the upper beach to hold back minor wave/storm events. Street Figure 109. This beach is influenced by northwest winds and waves. The changes during this interval were very small unlike during Sandy. The sand volume decreased 2.46 yds 3 /ft. as the shoreline retreated 4 feet. 138
37 Summary and Conclusions for Cape May County: The restoration of the ACOE constructed projects removed any significant Sandy storm losses and provided a source of sand to spread along the various shorelines. There were few storm events following Sandy with the worst being NE Storm Jonas on January 23, 2016 that produced beach erosion and significant tidal flooding equal in southern Cape May County to that from Sandy. A limited disaster declaration resulted in DR-NJ-4264 for the snow removal and coastal damage by the federal government, March 14, Erosion continued to plague the northeast segment of Ocean City, Strathmere, Avalon and North Wildwood. Each site required additional maintenance in 2014 and into Ocean City appears in satisfactory condition, with the 2015 Army Corps project covering its southern shoreline to Corson s Inlet State Park, south along all of Ludlam Island Avalon continues to shed sand from the 10 th to 21 st Street segment and accumulate it between 35 th and 70 th Street beaches. The Borough executed a 740,000 cubic yard restoration by May In North Wildwood, back-passing was being used to provide minor sand volumes (38,000 cy) to enhance the northern 5 city oceanfront beach blocks. An additional 37,000 cy was made available in the fall of 2015 from sand dredged by the NJDOT from the Beach Creek NJ State navigation channel entrance from Hereford Inlet. Since Sandy, work by the Philadelphia District ACOE has restored all authorized and constructed projects back to individual project design specifications (the Table below courtesy of Jeffery Gebert, USACE). SITE LOCATION Table 2. Cape May County ACOE Project Sand Volumes due to Sandy CONTRACTOR SAND VOLUME (cy) Ocean City (berm) Great Lakes Dredge and Dock 1,746,206 Ocean City (dune betterment) Great Lakes Dredge and Dock 56,110 TCM - Avalon Norfolk Dredging Company 336,359 TCM - Stone Harbor Norfolk Dredging Company 674,224 CM Inlet to Lower Township Weeks Marine Inc 585,328 Lower Cape May Meadows - CM Pt Weeks Marine Inc 345,000 Scheduled periodic nourishment (not post- Sandy FCCE work) The 2015 Ludlam Island and Ocean City project resulted in placing 3.4 million cubic yards of sand at a cost of $82.3 million between 34 th Street to 59 th Street in Ocean City, then between Seaspray Road in Strathmere and 93 rd Street on Ludlam Island. Completed under PL passed by Congress in early 2013, this project required NJ as the non-federal sponsor for initial construction, but was done at 100% federal expense. The Ocean City portion planned for million cubic yards of which 403,000 cy represented advance fill. Strathmere to Sea Isle City was planned to require million cu. yds. of which 1.82 million cu. yds. would be advanced nourishment (ACOE, 2001). The 2001 feasibility report also discussed the usual 65% federal share supported by the 35% non-federal sponsor share, a fact altered by PL to 100% federal cost for this project s initial construction. Work continues on the final design for the project for North Wildwood to Wildwood Crest utilizing some form of sand harvesting from the excesses seen in Wildwood and Wildwood Crest beaches to produce a sand recycling program, termed Back Passing. 139
38 The final element in the future is the revitalization of a one-time effort project to provide environmental enhancement to the Delaware Bay shoreline of western Cape May County. This project is not part of the Hurricane Sandy PL work, so must be funded separately. Back in the 1990 s it was proposed as an environmental restoration for the western county coast, but never received Congressional appropriations to proceed to construction. Recently the Philadelphia District is re-assessing this project. Other ACOE projects have been completed along Delaware Bay in Oakwood Beach, Salem County (354,000 cu. yds. of sand, costing $12 million. A Delaware Bayshore, Downe Township, NJ feasibility study under Section 103 of the River and Harbor Act of 1962 (PL ), to design and construct small beach erosion and flood damage reduction projects is in progress. Signed in May 2015, the project s estimated cost is $740,000 at a percent federal, non-federal sponsor share. The objective is to design projects to mitigate against future damages similar to Hurricane Sandy s damages seen to impact the region (Fortescue and Gandys Beach within Downe Township. 140
39 APPENDIX COUNTY ANNUAL BEACH VOLUME AND SHORELINE CHANGES TABLE 3 M ONM OUTH COUNTY ANNUAL BEACH VOLUM E CHANGES SPRING SPRING 2015 & FALL FALL 2015 Survey PROFILE SITE S2014-S2015 F F2015 LOCATION (volume expressed as cubic yards per foot) 187: Cliffwood Beach Park : Union Beach : Port Monmouth, Spy House Museum : Gateway National R. A., Gunnison Beach : Gateway National R. A., Parking Lot E : Highland Beach, Gateway Entrance : Highland Beach, Via Ripa St : Sea Bright, Shrewsbury Way : Sea Bright, North of Route : Sea Bright, Municipal Beach : Sea Bright, Sunset Court : Monmouth Beach, Cottage Rd : Monmouth Beach, Beach Club : Long Branch, 404 Ocean Ave : Long Branch, Seven Presidents Park : Long Branch, North Broadway Ave : Long Branch, Morris Ave : Long Branch, West End Ave : Long Branch 805 Ocean Ave : Elberon, Pullman Ave : Deal, Roosevelt Ave : Deal, Darlington Ave : Allenhurst, Corlies Ave : Asbury Park, 7th Ave : Asbury Park, 3rd Ave : Ocean grove, Ocean Pathway : Bradley Beach, McCabe Ave : Avon-By-The-Sea, Sylvania Ave : Belmar, 5th Ave : Belmar, 18th Ave : Spring Lake, Brighton Ave : Spring Lake, Salem Ave : Sea Girt, New York Ave : Sea Girt, Trenton Ave : Manasquan, Riddle Way : Manasquan, Pompano Ave M ONM OUTH VOLUM E CHANGE STATISTICS GROSS SAND VOLUM E CHANGE (cy/ft) AVERAGE PROFILE SAND VOLUM E CHANGE (cy/ft) Sea Bright Profiles Gross Change Average (cy/ft) Sites Asbury to M anasquan Average (cy/ft) Long Branch Sites Average (cy/ft) Oceanfront Sites Average (cy/ft) STATE W IDE AVERAGE VOLUM E CHG (CY/FT) STATE W IDE AVERAGE SHORELINE CHG FT 141
40 TABLE 4 M ONM OUTH COUNTY ANNUAL SHORELINE CHANGES SPRING SPRING 2015 & FALL FALL 2015 Survey PROFILE SITE S2014-S2015 F F2015 LOCATION (shoreline change expressed in feet) 187: Cliffwood Beach Park : Union Beach : Port Monmouth, Spy House Museum : Gateway National R. A., Gunnison Beach : Gateway National R. A., Parking Lot E : Highland Beach, Gateway Entrance : Highland Beach, Via Ripa St : Sea Bright, Shrewsbury Way : Sea Bright, North of Route : Sea Bright, Municipal Beach : Sea Bright, Sunset Court : Monmouth Beach, Cottage Rd : Monmouth Beach, Beach Club : Long Branch, 404 Ocean Ave : Long Branch, Seven Presidents Park : Long Branch, North Broadway Ave : Long Branch, Morris Ave : Long Branch, West End Ave : Long Branch 805 Ocean Ave : Elberon, Pullman Ave : Deal, Roosevelt Ave : Deal, Darlington Ave : Allenhurst, Corlies Ave : Asbury Park, 7th Ave : Asbury Park, 3rd Ave : Ocean grove, Ocean Pathway : Bradley Beach, McCabe Ave : Avon-By-The-Sea, Sylvania Ave : Belmar, 5th Ave : Belmar, 18th Ave : Spring Lake, Brighton Ave : Spring Lake, Salem Ave : Sea Girt, New York Ave : Sea Girt, Trenton Ave : Manasquan, Riddle Way : Manasquan, Pompano Ave M ONM OUTH SHORLINE CHANGE STATISTICS GROSS SHORELINE POSITION CHANGE AVERAGE PROFILE SHORELINE CHANGE (ft) Sea Bright Profiles Gross Change Average (ft) Sites Asbury to M anasquan Average (ft) Long Branch Sites Average (ft) Oceanfront Sites Average (ft)
41 TABLE 5 M ONM OUTH COUNTY SEASONAL BEACH VOLUM E CHANGES Survey PROFILE SITE S14-F14 F14-S15 S15-F15 S14-F15 LOCATION (volume expressed as cubic yards per foot of beachfront) 187: Cliffwood Beach Park : Union Beach : Port Monmouth, Spy House Museum : Gateway National R. A., Gunnison Beach : Gateway National R. A., Parking Lot E : Highland Beach, Gateway Entrance : Highland Beach, Via Ripa St : Sea Bright, Shrewsbury Way : Sea Bright, North of Route : Sea Bright, Municipal Beach : Sea Bright, Sunset Court : Monmouth Beach, Cottage Rd : Monmouth Beach, Beach Club : Long Branch, 404 Ocean Ave : Long Branch, Seven Presidents Park : Long Branch, North Broadway Ave : Long Branch, Morris Ave : Long Branch, West End Ave : Long Branch 805 Ocean Ave : Elberon, Pullman Ave : Deal, Roosevelt Ave : Deal, Darlington Ave : Allenhurst, Corlies Ave : Asbury Park, 7th Ave : Asbury Park, 3rd Ave : Ocean grove, Ocean Pathway : Bradley Beach, McCabe Ave : Avon-By-The-Sea, Sylvania Ave : Belmar, 5th Ave : Belmar, 18th Ave : Spring Lake, Brighton Ave : Spring Lake, Salem Ave : Sea Girt, New York Ave : Sea Girt, Trenton Ave : Manasquan, Riddle Way : Manasquan, Pompano Ave SEASONAL SITE VOLUM E CHANGES GROSS SAND VOLUM E CHANGE AVERAGE SAND VOLUM E CHANGE (cy/ft) Sea Bright Profiles Average (cy/ft) Sites Asbury to M anasquan Average (cy/ft) Long Branch Sites Average (cy/ft) Oceanfront Sites Average (cy/ft)
42 TABLE 6 M ONM OUTH COUNTY SEASONAL SHORELINE CHANGES Survey PROFILE SITE S14-F14 F14-S15 S15-F15 S14-F15 LOCATION (shoreline change expressed in feet) 187: Cliffwood Beach Park : Union Beach : Port Monmouth, Spy House Museum : Gateway National R. A., Gunnison Beach : Gateway National R. A., Parking Lot E : Highland Beach, Gateway Entrance : Highland Beach, Via Ripa St : Sea Bright, Shrewsbury Way : Sea Bright, North of Route : Sea Bright, Municipal Beach : Sea Bright, Sunset Court : Monmouth Beach, Cottage Rd : Monmouth Beach, Beach Club : Long Branch, 404 Ocean Ave : Long Branch, Seven Presidents Park : Long Branch, North Broadway Ave : Long Branch, Morris Ave : Long Branch, West End Ave : Long Branch 805 Ocean Ave : Elberon, Pullman Ave : Deal, Roosevelt Ave : Deal, Darlington Ave : Allenhurst, Corlies Ave : Asbury Park, 7th Ave : Asbury Park, 3rd Ave : Ocean grove, Ocean Pathway : Bradley Beach, McCabe Ave : Avon-By-The-Sea, Sylvania Ave : Belmar, 5th Ave : Belmar, 18th Ave : Spring Lake, Brighton Ave : Spring Lake, Salem Ave : Sea Girt, New York Ave : Sea Girt, Trenton Ave : Manasquan, Riddle Way : Manasquan, Pompano Ave SEASONAL SHORELINE CHANGES Survey GROSS SHORELINE CHANGES AVERAGE SHORELINE CHANGE (ft) Sea Bright Profiles Average (ft) Sites Asbury to M anasquan Average (ft) Long Branch Sites Average (ft) Oceanfront Sites Average (ft)
43 TABLE 7 OCEAN COUNTY ANNUAL BEACH VOLUM E CHANGES SPRING SPRING 2015 & FALL FALL 2015 Survey PROFILE SITE S2014-S2015 F F2015 LOCATION (volume expressed as cubic yards per foot) 156: Point Pleasant, Water St : Point Pleasant, Maryland Ave : Bay Head, Johnson Ave : Mantoloking, 1117 Ocean Ave : Brick Township, Public Beach : Normandy Beach, 1st Ave : Lavallette, White Ave : Ortley Beach, 8th Ave : Seaside, Franklin Ave : Seaside Park, 4th Ave : Berkeley Township, 6th Ave : Island Beach State Park, North : Island Beach State Park, Middle : Island Beach State Park, South : Barnegat Light, 10th St : Barnegat Light, 26th St : Loveladies, La Baia St : Harvey Cedars, 73rd St : Harvey Cedars, Tranquility Drive : Surf City, 20th St : Ship Bottom, 8th St : Long BeachTownship, 32nd St : Long Beach Township, 81st St : Long Beach Township, Old Whaling Rd : Beach Haven, Taylor Ave : Beach Haven, Dolphin Ave : Long Beach Township, Webster Ave : Long Beach Township, Border w/ Refuge OCEAN SAND VOLUM E STATISTICS GROSS SAND VOLUM E CHANGE AVERAGE SAND VOLUM E CHANGE (cy/ft)
44 TABLE 8 OCEAN COUNTY ANNUAL SHORELINE CHANGES SPRING SPRING 2015 & FALL FALL 2015 Survey PROFILE SITE S2014-S2015 F F2015 LOCATION (shoreline change expressed in feet) 156: Point Pleasant, Water St : Point Pleasant, Maryland Ave : Bay Head, Johnson Ave : Mantoloking, 1117 Ocean Ave : Brick Township, Public Beach : Normandy Beach, 1st Ave : Lavallette, White Ave : Ortley Beach, 8th Ave : Seaside, Franklin Ave : Seaside Park, 4th Ave : Berkeley Township, 6th Ave : Island Beach State Park, North : Island Beach State Park, Middle : Island Beach State Park, South : Barnegat Light, 10th St : Barnegat Light, 26th St : Loveladies, La Baia St : Harvey Cedars, 73rd St : Harvey Cedars, Tranquility Drive : Surf City, 20th St : Ship Bottom, 8th St : Long Beach Township, 32nd St : Long Beach Township, 81st St : Long Beach Township, Old Whaling Rd : Beach Haven, Taylor Ave : Beach Haven, Dolphin Ave : Long Beach Township, Webster Ave : Long Beach Township, Border w/ Refuge OCEAN SHORELINE STATISTICS GROSS SHORELINE CHANGE AVERAGE SHORELINE POSITION CHANGE
45 TABLE 9 OCEAN COUNTY SEASONAL BEACH VOLUM E CHANGES Survey PROFILE SITE S14-F14 F14-S15 S15-F15 S14-F15 LOCATION (volume expressed as cubic yards per foot of beachfront) 156: Point Pleasant, Water St : Point Pleasant, Maryland Ave : Bay Head, Johnson Ave : Mantoloking, 1117 Ocean Ave : Brick Township, Public Beach : Normandy Beach, 1st Ave : Lavallette, White Ave : Ortley Beach, 8th Ave : Seaside, Franklin Ave : Seaside Park, 4th Ave : Berkeley Township, 6th Ave : Island Beach State Park, North : Island Beach State Park, Middle : Island Beach State Park, South : Barnegat Light, 10th St : Barnegat Light, 26th St : Loveladies, La Baia St : Harvey Cedars, 73rd St : Harvey Cedars, Tranquility Drive : Surf City, 20th St : Ship Bottom, 8th St : Long BeachTownship, 32nd St : Long Beach Township, 81st St : Long Beach Township, Old Whaling Rd : Beach Haven, Taylor Ave : Beach Haven, Dolphin Ave : Long Beach Township, Webster Ave : Long Beach Township, Border w/ Refuge SEASONAL STATISTICS VOLUM E CHANGES for OCEAN CO. Survey (cy/ft) (cy/ft) (cy/ft) (cy/ft) SUM of SAND VOLUM ES for 28 SITES AVERAGE SAND VOLUM E per SITE Northern Ocean Co. Sand Volume Change Average Northern Ocean Co. Volume Change Long Beach Island Sand Volume Change Averge Long Beach Island Volume Change
46 TABLE 10 OCEAN COUNTY SEASONAL SHORELINE CHANGES Survey PROFILE SITE S14-F14 F14-S15 S15-F15 S14-F15 LOCATION (shoreline change expressed in feet) 156: Point Pleasant, Water St : Point Pleasant, Maryland Ave : Bay Head, Johnson Ave : Mantoloking, 1117 Ocean Ave : Brick Township, Public Beach : Normandy Beach, 1st Ave : Lavallette, White Ave : Ortley Beach, 8th Ave : Seaside, Franklin Ave : Seaside Park, 4th Ave : Berkeley Township, 6th Ave : Island Beach State Park, North : Island Beach State Park, Middle : Island Beach State Park, South : Barnegat Light, 10th St : Barnegat Light, 26th St : Loveladies, La Baia St : Harvey Cedars, 73rd St : Harvey Cedars, Tranquility Drive : Surf City, 20th St : Ship Bottom, 8th St : Long BeachTownship, 32nd St : Long Beach Township, 81st St : Long Beach Township, Old Whaling Rd : Beach Haven, Taylor Ave : Beach Haven, Dolphin Ave : Long Beach Township, Webster Ave : Long Beach Township, Border w/refuge SEASONAL STATISTICS SHORELINE CHANGES for OCEAN CO.Survey (feet) (feet) (feet) (feet) SUM of SHORELINE CHANGES for 28 SITES AVERAGE SHORELINE CHANGE per SITE Northern Ocean Co. Shoreline Change Average Northern Ocean Co. Shoreline Change Long Beach Island Shoreline Change Average Long Beach Island Shoreline Change
47 TABLE 11 ATLANTIC COUNTY ANNUAL BEACH VOLUM E CHANGES SPRING SPRING 2015 & FALL FALL 2015 Survey PROFILE SITE S2014-S2015 F F2015 LOCATION (volume expressed as cubic yards per foot) 134: Brigantine, Green Acres : Brigantine, 4th Street North : Brigantine, 15th Street South : Brigantine, 43rd Street South : Atlantic City, Rhode Island Ave : Atlantic City, North Carolina Ave : Atlantic City, Raleigh Ave : Ventnor City, Dorset Ave : Margate City, Benson Ave : Longport, 17th St TABLE 12 ATLANTIC COUNTY ANNUAL SHORELINE CHANGES SPRING SPRING 2015 & FALL FALL 2015 Survey PROFILE SITE S2014-S2015 F F2015 LOCATION (shoreline change expressed in feet) 134: Brigantine, Green Acres : Brigantine, 4th Street North : Brigantine, 15th Street South : Brigantine, 43rd Street South : Atlantic City, Rhode Island Ave : Atlantic City, North Carolina Ave : Atlantic City, Raleigh Ave : Ventnor City, Dorset Ave : Margate City, Benson Ave : Longport, 17th St ATLANTIC COUNTY STATISTICS SAND VOLUM E CHANGE GROSS VOLUM E CHANGE AVERAGE VOLUM E CHANGE SHORELINE CHANGE STATS GROSS SHORELINE CHANGE AVERAGE SHORELINE CHANGE ATLANTIC CITY SHORELINE CHANGES GROSS SHORELINE CHANGE AVERAGE SHORELINE CHANGE
48 TABLE 13 ATLANTIC COUNTY SEASONAL BEACH VOLUM E CHANGES Survey PROFILE SITE S14-F14 F14-F15 S15-F15 S14-F15 LOCATION (volume expressed as cubic yards per foot of beachfront) 134: Brigantine, Green Acres : Brigantine, 4th Street North : Brigantine, 15th Street South : Brigantine, 43rd Street South : Atlantic City, Rhode Island Ave : Atlantic City, North Carolina Ave : Atlantic City, Raleigh Ave : Ventnor City, Dorset Ave : Margate City, Benson Ave : Longport, 17th St TABLE 14 ATLANTIC COUNTY SEASONAL SHORELINE CHANGES Survey PROFILE SITE S14-F14 F14-F15 S15-F15 S14-F15 LOCATION (shoreline change expressed in feet) 134: Brigantine, Green Acres : Brigantine, 4th Street North : Brigantine, 15th Street South : Brigantine, 43rd Street South : Atlantic City, Rhode Island Ave : Atlantic City, North Carolina Ave : Atlantic City, Raleigh Ave : Ventnor City, Dorset Ave : Margate City, Benson Ave : Longport, 17th St ATLANTIC COUNTY STATISTICS ATLANTIC CO VOLUM E CHANGE NET AVERAGE SHORELINE CHANGES Survey NET AVERAGE ABSECON ISLAND VOLUM E CHANGES NET AVERAGE ABSECON ISLAND SHORELINE CHANGES NET AVERAGE
49 TABLE 15 CAPE M AY COUNTY ANNUAL BEACH VOLUM E CHANGES SPRING SPRING 2015 & FALL FALL 2015 Survey PROFILE SITE S2014-S2015 F F2015 LOCATION (volume expressed as cubic yards per foot) 225: Ocean City, Gardens Rd : Ocean City, 6th St : Ocean City, 20th St : Ocean City, 34th St : Ocean City, 56th St : Ocean City, 59th St : Corson's Inlet Park, Ocean City : Strathmere, Williams Rd : Sea Isle City, 1st St : Sea Isle City, 25th St : Sea Isle City, 57th St : Sea Isle City, 80th St : Avalon, 9th St : Avalon, 23rd St : Avalon, 35th St : Avalon, 70th St : Stone Harbor, 90th St : Stone Harbor, 121st St : Stone Harbor, South Pointe ** NO LONGER ACTIVE ** 111: North Wildwood, 15th Ave : Wildwood, Cresse Ave : Lower Township, Raleigh Ave : Lower Township, U.S.C.G. Base : Cape May, Beach Club : Cape May, Baltimore Ave : Cape May, Broadway Ave : Cape May, Nature Conservancy : Cape May Point, Lake Dr : Higbee Beach State Park : North Cape May, Whittier : Villas, Pacific Ave : Reeds Beach, Beach Ave CAPE M AY COUNTY STATISTICS CAPE M AY SAND VOLUM E STATISTICS GROSS SAND VOLUM E CHANGE AVERAGE SITE SAND VOLUM E CHANGE Oceanfront Only Volume Changes GROSS SAND VOLUM E CHANGE AVERAGE OCEANFRONT SITE CHANGE
50 TABLE 16 CAPE M AY COUNTY ANNUAL SHORELINE CHANGES SPRING SPRING 2015 & FALL FALL 2015 Survey PROFILE SITE S2014-S2015 F F2015 LOCATION (shoreline change expressed in feet) 225: Ocean City, Gardens Rd : Ocean City, 6th St : Ocean City, 20th St : Ocean City, 34th St : Ocean City, 56th St : Ocean City, 59th St : Corson's Inlet Park, Ocean City : Strathmere, Williams Rd : Sea Isle City, 1st St : Sea Isle City, 25th St : Sea Isle City, 57th St : Sea Isle City, 80th St : Avalon, 9th St : Avalon, 23rd St : Avalon, 35th St : Avalon, 70th St : Stone Harbor, 90th St : Stone Harbor, 121st St : Stone Harbor, South Pointe ** NO LONGER ACTIVE ** 111: North Wildwood, 15th Ave : Wildwood, Cresse Ave : Lower Township, Raleigh Ave : Lower Township, U.S.C.G. Base : Cape May, Beach Club : Cape May, Baltimore Ave : Cape May, Broadway Ave : Cape May, Nature Conservancy : Cape May Point, Lake Dr : Higbee Beach State Park : North Cape May, Whittier : Villas, Pacific Ave : Reeds Beach, Beach Ave CAPE M AY COUNTY STATISTICS CAPE M AY SHORELINE CHANGES survey GROSS SHORELINE CHANGE AVERAGE SHORELINE CHANGE Oceanfront Only Shoreline Change GROSS SHORELINE CHANGE AVERAGE OCEANFRONT SHORELINE CHANGE
51 TABLE 17 CAPE M AY COUNTY SEASONAL BEACH VOLUM E CHANGES Survey PROFILE SITE S14-F14 F14-S15 S15-F15 S14-F15 LOCATION (volume expressed as cubic yards per foot of beachfront) 225: Ocean City, Gardens Rd : Ocean City, 6th St : Ocean City, 20th St : Ocean City, 34th St : Ocean City, 56th St : Ocean City, 59th St : Corson's Inlet Park, Ocean City : Strathmere, Williams Rd : Sea Isle City, 1st St : Sea Isle City, 25th St : Sea Isle City, 57th St : Sea Isle City, 80th St : Avalon, 9th St : Avalon, 23rd St : Avalon, 35th St : Avalon, 70th St : Stone Harbor, 90th St : Stone Harbor, 121st St : Stone Harbor, South Pointe ** NO LONGER ACTIVE ** 111: North Wildwood, 15th Ave : Wildwood, Cresse Ave : Lower Township, Raleigh Ave : Lower Township, U.S.C.G. Base : Cape May, Beach Club : Cape May, Baltimore Ave : Cape May, Broadway Ave : Cape May, Nature Conservancy : Cape May Point, Lake Dr : Higbee Beach State Park : North Cape May, Whittier Ave : Villas, Pacific Ave : Reeds Beach, Beach Ave CAPE M AY COUNTY STATISTICS SEASONAL CAPE M AY VOL. CHANGES Survey GROSS SAND VOLUM E CHANGE AVERAGE SITE SAND VOLUM E CHANGE
52 TABLE 18 CAPE M AY COUNTY SEASONAL SHORELINE CHANGES Survey PROFILE SITE S14-F14 F14-S15 S15-F15 S14-F15 LOCATION (shoreline change expressed in feet) 225: Ocean City, Gardens Rd : Ocean City, 6th St : Ocean City, 20th St : Ocean City, 34th St : Ocean City, 56th St : Ocean City, 59th St : Corson's Inlet Park, Ocean City : Strathmere, Williams Rd : Sea Isle City, 1st St : Sea Isle City, 25th St : Sea Isle City, 57th St : Sea Isle City, 80th St : Avalon, 9th St : Avalon, 23rd St : Avalon, 35th St : Avalon, 70th St : Stone Harbor, 90th St : Stone Harbor, 121st St : Stone Harbor, South Pointe ** NO LONGER ACTIVE ** 111: North Wildwood, 15th Ave : Wildwood, Cresse Ave : Lower Township, Raleigh Ave : Lower Township, U.S.C.G. Base : Cape May, Beach Club : Cape May, Baltimore Ave : Cape May, Broadway Ave : Cape May, Nature Conservancy : Cape May Point, Lake Dr : Higbee Beach State Park : North Cape May, Whittier Ave : Villas, Pacific Ave : Reeds Beach, Beach Ave CAPE M AY COUNTY STATISTICS SEASONAL SHORELINE CHANGES Survey GROSS CAPE M AY SHORELINE CHANGE AVERAGE SITE SHORELINE CHANGE
53 155
54 156
55 157
Figure 38. Locations of the 28 NJBPN profile stations in Ocean County, NJ.
 55 Figure 38. Locations of the 28 NJBPN profile stations in Ocean County, NJ. 56 Individual Site Descriptions: Northern Ocean County recovered its beaches approaching pre-hurricane Sandy elevation or width,
Figure 106. Locations of the 28 NJBPN profile stations in Ocean County, NJ.
 130 Figure 106. Locations of the 28 NJBPN profile stations in Ocean County, NJ. 131 2016-2017 Beach Fills in Ocean County: The federal/state/local storm damage reduction project (beachfill) between Manasquan
Figure 46. Locations of the 28 NJBPN profile stations in Ocean County, NJ. A new site was added in the Borough of Seaside Heights (#248).
.") 90 Figure 46. Locations of the 28 NJBPN profile stations in Ocean County, NJ. A new site was added in the Borough of Seaside Heights (#248). 91 OCEAN COUNTY SPRING 2008 to FALL 2009 The Ocean County shoreline
90 Figure 46. Locations of the 28 NJBPN profile stations in Ocean County, NJ. A new site was added in the Borough of Seaside Heights (#248). 91 OCEAN COUNTY SPRING 2008 to FALL 2009 The Ocean County shoreline
Figure79. Location map for the 10 NJBPN profile sites in Atlantic County, NJ 155
 154 Figure79. Location map for the 10 NJBPN profile sites in Atlantic County, NJ 155 ATLANTIC COUNTY SPRING 2009 to FALL 2010 The Atlantic County coastline consists of three barrier islands. Between Little
Figure 38. Locations of the 28 NJBPN profile stations in Ocean County, NJ.
 52 Figure 38. Locations of the 28 NJBPN profile stations in Ocean County, NJ. 53 Individual Site Descriptions: Beaches in Northern Ocean County continued to recover slowly as sand transported offshore
SPECIAL SPRING 2018 STORM REPORT ON THE CONDITION OF THE MUNICIPAL BEACHES FOR THE BOROUGH OF STONE HARBOR, CAPE MAY COUNTY, NEW JERSEY
 SPECIAL SPRING 2018 STORM REPORT ON THE CONDITION OF THE MUNICIPAL BEACHES FOR THE BOROUGH OF STONE HARBOR, CAPE MAY COUNTY, NEW JERSEY Aerial photograph taken April 21, 2018 showing the view up the beach
UPPER BEACH REPLENISHMENT PROJECT RELATED
 ASSESSMENT OF SAND VOLUME LOSS at the TOWNSHIP of UPPER BEACH REPLENISHMENT PROJECT RELATED to the LANDFALL OF HURRICANE SANDY - PURSUANT TO NJ-DR 4086 This assessment is in response to Hurricane Sandy
ATLANTIC COUNTY 2006 to 2008
 ATLANTIC COUNTY 2006 to 2008 The Atlantic County oceanfront shoreline consists of three barrier islands where the northern one, Little Beach Island and a third of the second, Brigantine Island, are undeveloped
OCEAN COUNTY 2006 to 2008
 OCEAN COUNTY 2006 to 2008 Ocean County finally started to benefit from long-awaited startup of Federal beach nourishment projects when sand was pumped onto Surf City, Long Beach Island in late 2006. This
TABLE OF CONTENTS APPENDIX & BIBLIOGRAPHY
 TABLE OF CONTENTS Executive Summary 1 Acknowledgements 3 Introduction 3 The New Jersey Coastal Zone 3 Storm Recovery and Beach Project Effectiveness 3 Monmouth County 4 Figure 1. Monmouth County Station
A REVIEW OF THE CONDITION OF THE MUNICIPAL BEACHES AS A RESULT OF HURRICANE SANDY IN THE BOROUGH OF STONE HARBOR, CAPE MAY COUNTY, NEW JERSEY
 A REVIEW OF THE CONDITION OF THE MUNICIPAL BEACHES AS A RESULT OF HURRICANE SANDY IN THE BOROUGH OF STONE HARBOR, CAPE MAY COUNTY, NEW JERSEY View along the dune scarp from 103 rd Street on October 31,
New Jersey Beach Profile Network Ocean County Profile Site Locations
 125 RICHARD STOCKTON COLLEGE OF NEW JERSEY COASTAL RESEARCH CENTER New Jersey Beach Profile Network Ocean County Profile Site Locations Figure 73 156 155 154 153 152 151 15 149 The Ocean County shoreline
New Jersey Coastal Zone Overview. The New Jersey Beach Profile Network (NJBPN) 3 Dimensional Assessments. Quantifying Shoreline Migration
 3 Dimensional Assessments. Quantifying Shoreline Migration") New Jersey Coastal Zone Overview The New Jersey Beach Profile Network (NJBPN) Objectives Profile Locations Data Collection Analyzing NJBPN Data Examples 3 Dimensional Assessments Methodology Examples Quantifying
New Jersey Coastal Zone Overview The New Jersey Beach Profile Network (NJBPN) Objectives Profile Locations Data Collection Analyzing NJBPN Data Examples 3 Dimensional Assessments Methodology Examples Quantifying
New Jersey Beach Profile Network Atlantic County Profile Site Locations
 215 RICHARD STOCKTON COLLEGE OF NEW JERSEY New Jersey Beach Profile Network Atlantic County Profile Site Locations COASTAL RESEARCH CENTER Figure 128 There are nine NJBPN survey sites on the Atlantic County
23- Year Sand Volume Changes at Site 132, 15th Street, Brigantine
 149 Figure75. Location map for the 9 NJBPN profile sites in Atlantic County, NJ ATLANTIC COUNTY SPRING 2008 to FALL 2009 150 The Atlantic County oceanfront shoreline consists of three barrier islands.
FINAL REPORT FOR 2013 ON THE CONDITION OF THE MUNICIPAL OCEANFRONT BEACHES THE BOROUGH OF AVALON, CAPE MAY COUNTY, NEW JERSEY
 FINAL REPORT FOR 2013 ON THE CONDITION OF THE MUNICIPAL OCEANFRONT BEACHES THE BOROUGH OF AVALON, CAPE MAY COUNTY, NEW JERSEY View from 12 th Street to the south taken February 28, 2013, following completion
Figure 262. Location map for the 10 NJBPN profile sites in Atlantic County, NJ 279
 278 Figure 262. Location map for the 10 NJBPN profile sites in Atlantic County, NJ 279 ATLANTIC COUNTY SUMMARY The Atlantic County coastline consists of three barrier islands. The island of Little Beach
Beach Dune Performance Assessment of. New Jersey Beach Profile Network (NJBPN) Sites at. Long Beach Island, New Jersey. After Hurricane Sandy
 Sites at. Long Beach Island, New Jersey. After Hurricane Sandy") Beach Dune Performance Assessment of New Jersey Beach Profile Network (NJBPN) Sites at Long Beach Island, New Jersey After Hurricane Sandy November 13, 2012 The Richard Stockton College of NJ Coastal Research
Beach Dune Performance Assessment of New Jersey Beach Profile Network (NJBPN) Sites at Long Beach Island, New Jersey After Hurricane Sandy November 13, 2012 The Richard Stockton College of NJ Coastal Research
Figure 41. Locations of the 28 NJBPN profile stations in Ocean County, NJ.
 57 Figure 41. Locations of the 28 NJBPN profile stations in Ocean County, NJ. 58 Hurricane Sandy s Impact on the Ocean County Shoreline; In general terms, all forms of damage to beaches, dunes and public
PREPARED FOR: THE BOROUGH OF AVALON 3100 DUNE DRIVE AVALON, NJ 08202
 FINAL REPORT FOR 2012 ON THE CONDITION OF THE MUNICIPAL OCEANFRONT BEACHES FOLLOWING HURRICANE SANDY IN THE BOROUGH OF AVALON, CAPE MAY COUNTY, NEW JERSEY View from 78 th Street to the north immediately
Figure 1. Survey site locations in Monmouth County.
 6 Figure 1. Survey site locations in Monmouth County. 7 Individual Site Descriptions: The restoration of the Sea Bright shoreline was essentially complete by the fall 2013 survey. The NY Corps District
2014 ANNUAL REPORT - TO THE CITY OF NORTH WILDWOOD ON THE CONDITION OF THE CITY BEACHES
 2014 ANNUAL REPORT - TO THE CITY OF NORTH WILDWOOD ON THE CONDITION OF THE CITY BEACHES View on September 25, 2014 looking northwest into Hereford Inlet. Considerable southerly expansion of the tip of
Beach, dune and development in the Borough of Mantoloking as of January Prepared for The Borough of Mantoloking: April 2, 2008
 Summary of 20-years of Shoreline Monitoring Between Maryland Avenue, Point Pleasant Beach, Bay Head, Mantoloking, Brick Township, to 1 st Avenue in Normandy Beach, Ocean County, New Jersey & an Evaluation
2013 ANNUAL REPORT - TO THE CITY OF NORTH WILDWOOD ON THE CONDITION OF THE CITY BEACHES
 2013 ANNUAL REPORT - TO THE CITY OF NORTH WILDWOOD ON THE CONDITION OF THE CITY BEACHES View on June 18, 2013 from the 2 nd Avenue jetty looking south while the 2013 beach nourishment project was under
2015 ANNUAL REPORT - TO THE CITY OF NORTH WILDWOOD ON THE CONDITION OF THE CITY BEACHES
 2015 ANNUAL REPORT - TO THE CITY OF NORTH WILDWOOD ON THE CONDITION OF THE CITY BEACHES Ariel view of North Wildwood looking south from the Hereford Inlet perspective on June 24, 2015. The main channel
FINAL REPORT FOR 2009 ON THE CONDITION OF THE MUNICIPAL OCEANFRONT BEACHES IN THE BOROUGH OF AVALON, CAPE MAY COUNTY, NEW JERSEY
 FINAL REPORT FOR 2009 ON THE CONDITION OF THE MUNICIPAL OCEANFRONT BEACHES IN THE BOROUGH OF AVALON, CAPE MAY COUNTY, NEW JERSEY Storm waves pound the inlet revetment September 10, 2009 as the series of
Beach Dune Performance Assessment of. New Jersey Beach Profile Network (NJBPN) Sites at. Between Manasquan Inlet and Allenhurst, New Jersey
 Sites at. Between Manasquan Inlet and Allenhurst, New Jersey") Beach Dune Performance Assessment of New Jersey Beach Profile Network (NJBPN) Sites at Between Manasquan Inlet and Allenhurst, New Jersey Related to FEMA DR JI 4086 Declared for Hurricane Sandy December
Beach Dune Performance Assessment of New Jersey Beach Profile Network (NJBPN) Sites at Between Manasquan Inlet and Allenhurst, New Jersey Related to FEMA DR JI 4086 Declared for Hurricane Sandy December
The Stockton University Coastal
 Hurricane Sandy: Beach-dune recovery at New Jersey Beach Profile Network (NJBPN) sites By Kimberly K. McKenna 1, Stewart C. Farrell 1, and Jeffrey A. Gebert 2 1 Stockton University Coastal Research Center
FINAL REPORT FOR 2013 ON THE CONDITION OF THE MUNICIPAL BEACHES IN THE TOWNSHIP OF UPPER, CAPE MAY COUNTY, NEW JERSEY
 FINAL REPORT FOR 2013 ON THE CONDITION OF THE MUNICIPAL BEACHES IN THE TOWNSHIP OF UPPER, CAPE MAY COUNTY, NEW JERSEY Aerial photograph at Corson s Inlet showing conditions on December 1, 2013 of the north
FINAL REPORT FOR 2012 ON THE CHANGES SEEN ON THE OCEANFRONT BEACHES
 FINAL REPORT FOR 2012 ON THE CHANGES SEEN ON THE OCEANFRONT BEACHES IN THE BOROUGH OF MANTOLOKING, OCEAN COUNTY, NEW JERSEY FOCUSED ON THE IMPACTS OF HURRICANE SANDY View looking north on Route 5 on October
Volume and Shoreline Changes along Pinellas County Beaches during Tropical Storm Debby
 Volume and Shoreline Changes along Pinellas County Beaches during Tropical Storm Debby Ping Wang and Tiffany M. Roberts Coastal Research Laboratory University of South Florida July 24, 2012 Introduction
Long Beach Island Holgate Spit Little Egg Inlet Historical Evolution Introduction Longshore Transport Map, Survey and Photo Historic Sequence
 Appendix B Long Beach Island Holgate Spit Little Egg Inlet Historical Evolution Introduction The undeveloped southern end of Long Beach Island (LBI) is referred to as the Holgate spit as it adjoins the
FINAL REPORT FOR 2011 ON THE CONDITION OF THE MUNICIPAL BEACHES IN THE CITY OF BRIGANTINE BEACH, ATLANTIC COUNTY, NEW JERSEY
 FINAL REPORT FOR 2011 ON THE CONDITION OF THE MUNICIPAL BEACHES IN THE CITY OF BRIGANTINE BEACH, ATLANTIC COUNTY, NEW JERSEY Photograph was taken October 10, 2011 from 10 th Street North looking south
Atlantic Coast of Long Island, Jones Inlet to East Rockaway Inlet, Long Beach Island, NY Construction Update
 Atlantic Coast of Long Island, Jones Inlet to East Rockaway Inlet, Long Beach Island, NY Construction Update June 2016 US Army Corps of Engineers Project Purpose Three specific damage mechanisms of coastal
Recycling of Surplus Sand to Extend the Time Between Beach Fill Episodes
 Recycling of Surplus Sand to Extend the Time Between Beach Fill Episodes Cape May County, New Jersey Dr. Stewart Farrell Coastal Research Center 1795 Franklin Map Shows Inlets Inlet Morphology has Remained
RE: Hurricane Matthew Beach Damage Assessment and Recommendations [CSE 2416]
![RE: Hurricane Matthew Beach Damage Assessment and Recommendations [CSE 2416]](/thumbs/83/87675702.jpg "RE: Hurricane Matthew Beach Damage Assessment and Recommendations [CSE 2416]") October 25, 2016 Iris Hill Town Administrator Town of Edisto Beach 2414 Murray St Edisto Beach SC 29438 RE: Hurricane Matthew Beach Damage Assessment and Recommendations [CSE 2416] Dear Iris, Hurricane
October 25, 2016 Iris Hill Town Administrator Town of Edisto Beach 2414 Murray St Edisto Beach SC 29438 RE: Hurricane Matthew Beach Damage Assessment and Recommendations [CSE 2416] Dear Iris, Hurricane
Reading Material. Inshore oceanography, Anikouchine and Sternberg The World Ocean, Prentice-Hall
 Reading Material Inshore oceanography, Anikouchine and Sternberg The World Ocean, Prentice-Hall BEACH PROCESSES AND COASTAL ENVIRONMENTS COASTAL FEATURES Cross section Map view Terminology for Coastal
Inlet Management Study for Pass-A-Grille and Bunces Pass, Pinellas County, Florida
 Inlet Management Study for Pass-A-Grille and Bunces Pass, Pinellas County, Florida Final Report Submitted By Ping Wang, Ph.D., Jun Cheng Ph.D., Zachary Westfall, and Mathieu Vallee Coastal Research Laboratory
Absecon Island Shore Protection The planning behind the project
 Absecon Island Shore Protection The planning behind the project Most residents of Atlantic City, Ventnor, Margate and Longport are now aware of upcoming plans to protect their common coastline with a beachfill
The Richard Stockton College of New Jersey Coastal Research Center
 The Richard Stockton College of New Jersey Coastal Research Center New Jersey Beach Profile Network 20-Year Report On Shoreline Changes In New Jersey Raritan Bay to Delaware Bay Prepared for: New Jersey
2018 Beach Preservation Project Information
 QUICK FACTS Beach Renourishment to begin late April 2018 o U.S. Army Corps of Engineers project o Project Area: 8 th St. E. to end of E. Ashley Ave. o Project Length: 2 miles o Cost: $10,900,000 o Funding:
Beach profile surveys and morphological change, Otago Harbour entrance to Karitane May 2014 to June 2015
 Beach profile surveys and morphological change, Otago Harbour entrance to Karitane May 2014 to June 2015 Prepared for Port Otago Ltd Martin Single September 2015 Shore Processes and Management Ltd Contact
Delaware Chapter Surfrider Foundation - Indian River Inlet Monitoring
 Delaware Chapter Surfrider Foundation - Indian River Inlet Monitoring In 2012, the Delaware Surfrider Foundation Chapter formed the Surf Quality and Access Committee to focus on issues such as surf spot
Overview. Beach Features. Coastal Regions. Other Beach Profile Features. CHAPTER 10 The Coast: Beaches and Shoreline Processes.
 Overview CHAPTER 10 The Coast: Beaches and Shoreline Processes Coastal regions constantly change. The beach is a dominant coastal feature. Wave activity continually modifies the beach and coastal areas.
ATLANTIC COAST OF LONG ISLAND, JONES INLET TO EAST ROCKAWAY INLET, LONG BEACH ISLAND, NY. Contract #2 Construction Scope. April 18th-19th 2018
 ATLANTIC COAST OF LONG ISLAND, JONES INLET TO EAST ROCKAWAY INLET, LONG BEACH ISLAND, NY Contract #2 Construction Scope April 18th-19th 2018 New York District PLAN COMPONENTS Length of Beachfill 35,000
North Shore of Long Island, Feasibility Study
 North Shore of Long Island, Asharoken New York Asharoken, Feasibility Study Asharoken, NY Public Meeting June 30, 2015 US Army Corps of Engineers US Army Corps of Engineers New York BUILDING STRONG BUILDING
An Update of Coastal Erosion in Puerto Rico
 Jack Morelock and Maritza Barreto An Update of Coastal Erosion in Puerto Rico Department of Marine Sciences, University of Puerto Rico at Mayagüez and Geography Department, University of Puerto Rico at
LAB: WHERE S THE BEACH
 Name: LAB: WHERE S THE BEACH Introduction When you build a sandcastle on the beach, you don't expect it to last forever. You spread out your towel to sunbathe, but you know you can't stay in the same spot
Assateague Island National Seashore North End Restoration Project Timeline
 Assateague Island National Seashore North End Restoration Project Timeline Date Event Some information provided in the Project Introduction document. Detailed events are available in a timeline compiled
DUNE STABILIZATION AND BEACH EROSION
 DUNE STABILIZATION AND BEACH EROSION CAPE HATTERAS NATIONAL SEASHORE NORTH CAROLINA ROBERT DOLAN PAUL GODFREY U. S. DEPARTMENT OF INTERIOR NATIONAL PARK SERVICE OFFICE OF NATURAL SCIENCE WASHINGTON, D.
ST. JOSEPH PENINSULA, GULF COUNTY, FLORIDA Beach Re-Nourishment and Environmental Enhancement Project RECOMMENDATIONS
 ST. JOSEPH PENINSULA, GULF COUNTY, FLORIDA Beach Re-Nourishment and Environmental Enhancement Project RECOMMENDATIONS January 23, 2018 543 Harbor Boulevard, Suite 204 Destin, Florida 32541 850.654.1555
Protecting our Beaches
 Protecting our Beaches South Amelia Island Shore Stabilization Project Nassau County, FL Mr. Drew Wallace President South Amelia Island Shore Stabilization Association (SAISSA) Mr. Bill Moore, AICP Project
Q1. What are the primary causes/contributors to coastal erosion at Westshore and the concept of longshore / littoral drift.
 Q1. What are the primary causes/contributors to coastal erosion at Westshore and the concept of longshore / littoral drift. In order of (timing related) contribution to present problem 1. Beach is too
Oceans and Coasts. Chapter 18
 Oceans and Coasts Chapter 18 Exploring the oceans The ocean floor Sediments thicken and the age of the seafloor increases from ridge to shore The continental shelf off the northeast United States Constituent
EVALUATION OF BEACH EROSION UP-DRIFT OF TIDAL INLETS IN SOUTHWEST AND CENTRAL FLORIDA, USA. Mohamed A. Dabees 1 and Brett D.
 EVALUATION OF BEACH EROSION UP-DRIFT OF TIDAL INLETS IN SOUTHWEST AND CENTRAL FLORIDA, USA Mohamed A. Dabees 1 and Brett D. Moore 1 The paper discusses the analysis of up-drift beach erosion near selected
Dear Mr. Howard Ruben,
 Mr. Howard Ruben ( Howard.Ruben@usace.army.mil) The U.S. Army Corps of Engineers New York District Planning Division-Environmental Branch 26 Federal Plaza New York, New York 10278-0090 Dear Mr. Howard
FINDING OF NO SIGNIFICANT IMPACT
 DEPARTMENT OF THE ARMY CHARLESTON DISTRICT, CORPS OF ENGINEERS 69A HAGOOD AVENUE CHARLESTON, SOUTH CAROLINA 29403-5107 FINDING OF NO SIGNIFICANT IMPACT EDISTO BEACH COASTAL STORM DAMAGE REDUCTION GENERAL
Aspects of New Jersey Geology 2009 The Jersey Shore
 Aspects of New Jersey Geology 2009 The Jersey Shore Looking towards Belmar at sunset. Photo from VisitUSA.com. This calendar is available for free download from www.ganj.org, the website of the Geological
Executive Director and Director of Education New Jersey Sea Grant Consortium
 Welcome to the 12 th Annual State of the Shore Media Event Claire antonucci Executive Director and Director of Education New Jersey Sea Grant Consortium CLAIRE ANTONUCCI Characterized by endless snowfall,
Building Coastal Resiliency at Plymouth Long Beach
 Building Coastal Resiliency at Plymouth Long Beach Department of Marine and Environmental Affairs March 30, 2017 Introducing Green Infrastructure for Coastal Resiliency Plymouth Long Beach & Warren s Cove
FINAL ENVIRONMENTAL IMPACT STATEMENT ON BROWARD COUNTY SHORE PROTECTION PROJECT SEGMENTS II AND III BROWARD COUNTY, FLORIDA
 FINAL ENVIRONMENTAL IMPACT STATEMENT ON BROWARD COUNTY SHORE PROTECTION PROJECT SEGMENTS II AND III BROWARD COUNTY, FLORIDA 1. PROJECT PURPOSE AND NEED 1.1. PROJECT AUTHORITY. 1.1.1. INITIAL AUTHORIZATION.
4/20/17. #32 - Coastal Erosion Case Histories - Lake Michigan
 Writing Assignment Due Monday by 11:59 pm #32 - Coastal Erosion Case Histories - Lake Michigan See main class web pages for detailed instructions Submit papers Illinois Compass No copying: Compass will
New Jersey Saltwater Fishing Beach Access compliments of New Jersey Beach Buggy Association
 New Jersey Saltwater Fishing Beach Access compliments of New Jersey Beach Buggy Association GATEWAY SANDY HOOK: Dates of operation: The season runs from Memorial Day to Labor Day, and the times are from
ALTERNATIVES FOR COASTAL STORM DAMAGE MITIGATION
 ALTERNATIVES FOR COASTAL STORM DAMAGE MITIGATION Dave Basco Old Dominion University, Norfolk, Virginia, USA National Park Service Photo STRUCTURAL (changes to natural, physical system) hardening (seawalls,
Shorelines Earth - Chapter 20 Stan Hatfield Southwestern Illinois College
 Shorelines Earth - Chapter 20 Stan Hatfield Southwestern Illinois College The Shoreline A Dynamic Interface The shoreline is a dynamic interface (common boundary) among air, land, and the ocean. The shoreline
Chapter 15 SEASONAL CHANGES IN BEACHES OP THE NORTH ATLANTIC COAST OF THE UNITED STATES
 Chapter 15 SEASONAL CHANGES IN BEACHES OP THE NORTH ATLANTIC COAST OF THE UNITED STATES By John M. Darling Hydraulic Engineer, Research Division U. S. Army Coastal Engineering Research Center Corps of
MOREHEAD CITY HARBOR, NC. Dredged Material Management Plan (DMMP)
") MOREHEAD CITY HARBOR, NC Dredged Material Management Plan (DMMP) Public Meeting/Info Session 15 January 2014 US Army Corps of Engineers Morehead City Harbor DMMP Presentation Topics Morehead City Harbor
MOREHEAD CITY HARBOR, NC Dredged Material Management Plan (DMMP) Public Meeting/Info Session 15 January 2014 US Army Corps of Engineers Morehead City Harbor DMMP Presentation Topics Morehead City Harbor
Figure 4, Photo mosaic taken on February 14 about an hour before sunset near low tide.
 The Impact on Great South Bay of the Breach at Old Inlet Charles N. Flagg and Roger Flood School of Marine and Atmospheric Sciences, Stony Brook University Since the last report was issued on January 31
HURRICANE SANDY LIMITED REEVALUATION REPORT UNION BEACH, NEW JERSEY DRAFT ENGINEERING APPENDIX SUB APPENDIX D SBEACH MODELING
 HURRICANE SANDY LIMITED REEVALUATION REPORT UNION BEACH, NEW JERSEY DRAFT ENGINEERING APPENDIX SUB APPENDIX D SBEACH MODELING Rev. 18 Feb 2015 1 SBEACH Modeling 1.0 Introduction Following the methodology
Coastal management has lagged behind the growth in population leading to problems with pollution
 Fifty percent of the population of the industrialized world lives within 100 km of a coast. Coastal management has lagged behind the growth in population leading to problems with pollution and natural
SACO RIVER AND CAMP ELLIS BEACH SACO, MAINE SECTION 111 SHORE DAMAGE MITIGATION PROJECT APPENDIX F ECONOMIC ASSESSMENT
 SACO RIVER AND CAMP ELLIS BEACH SACO, MAINE SECTION 111 SHORE DAMAGE MITIGATION PROJECT APPENDIX F ECONOMIC ASSESSMENT Department of the Army New England District, Corps of Engineers 696 Virginia Road
BEACH PROCESSES AND COASTAL ENVIRONMENTS
 BEACH PROCESSES AND COASTAL ENVIRONMENTS COASTAL FEATURES Cross section Map view TOPICS: Terminology Waves Beach Morphology Barriers Coastal Migration Tides Tidal Flats and Marshes Sediment Budgets Human
Dune Monitoring Data Update Summary: 2013
 Dune Monitoring Data Update Summary: 13 Shoreline Studies Program Virginia Institute of Marine Science College of William & Mary Gloucester Point, Virginia September 13 Dune Monitoring Data Update Summary:
Performance of Upham Beach T-Groin Project and Its Impact to the Downdrift Beach
 Performance of Upham Beach T-Groin Project and Its Impact to the Downdrift Beach Progress Report for the Period of October 2008 to April 2009 Submitted by Ping Wang, Ph.D., and Tiffany M. Roberts Department
Essentials of Oceanography Eleventh Edition
 Chapter Chapter 1 10 Clickers Lecture Essentials of Oceanography Eleventh Edition The Coast: Beaches and Shoreline Processes Alan P. Trujillo Harold V. Thurman Chapter Overview Coastal regions have distinct
ALTERNATIVES FOR COASTAL STORM DAMAGE MITIGATION AND FUNCTIONAL DESIGN OF COASTAL STRUCTURES
 The University of the West Indies Organization of American States PROFESSIONAL DEVELOPMENT PROGRAMME: COASTAL INFRASTRUCTURE DESIGN, CONSTRUCTION AND MAINTENANCE A COURSE IN COASTAL DEFENSE SYSTEMS I CHAPTER
County of Santa Barbara Permit Option Analysis Goleta Beach JULY 13, 2017
 County of Santa Barbara Permit Option Analysis Goleta Beach JULY 13, 2017 Introduction 2 Goleta Beach Park welcomes 1.5 million visitors annually Amenities include: Picnic Areas and Group Areas w/bbqs
Soft Designs for a Harsh Climate: Trends in Coastal Engineering
 Alaska Department of Transportation & Public Facilities Ruth Carter, PE, and Harvey Smith, PE Coastal Engineering Section 20 October 2014 Soft Designs for a Harsh Climate: Trends in Coastal Engineering
Figure 1. Schematic illustration of the major environments on Mustang Island.
 STOP #1: PACKERY CHANNEL BEACH TO BAY We will start this field guide near the north jetty of Packery Channel and hike across the island to Corpus Christi Bay (fig. 1). The island emerges from the Gulf
Blakely Island, N Thatcher Bay. Restoration Recommendation: Rank Score (total score)
") Soft Shore Protection/Structure Removal Blueprint for San Juan County Forage Fish Beaches Appendix 2: Recommendations for sites scoring below the top ten, sorted by island (east to west) Blakely Island,
Soft Shore Protection/Structure Removal Blueprint for San Juan County Forage Fish Beaches Appendix 2: Recommendations for sites scoring below the top ten, sorted by island (east to west) Blakely Island,
Table 4. Volumetric Change Rates Pre-Project and Post-Project for the Town of Duck
 V. VOLUMETRIC CHANGES General Volumetric changes measured over the entire monitoring area for various time periods are provided in Table 4. The volume changes are given in terms of cubic yards/foot of
CHAPTER 281 INFLUENCE OF NEARSHORE HARDBOTTOM ON REGIONAL SEDIMENT TRANSPORT
 CHAPTER 281 INFLUENCE OF NEARSHORE HARDBOTTOM ON REGIONAL SEDIMENT TRANSPORT Paul C.-P. Lin, Ph.D., P.E. 1 and R. Harvey Sasso, P.E. 2 ABSTRACT The influence of nearshore hardbottom on longshore and cross-shore
Impact of Hurricane Matthew on the Atlantic Coast of Florida
 Impact of Hurricane Matthew on the Atlantic Coast of Florida A coastal engineer was driving across country and his jeep broke down in front of a monastery. It was late in the day and the monks invited
Nearshore Sediment Transport What influences the loss of sediment on Beaches? - Waves - Winds - Tidal Currents - River discharge - Runoff
 Tides & Beaches Nearshore Sediment Transport What influences the loss of sediment on Beaches? - Waves - Winds - Tidal Currents - River discharge - Runoff Oceans Ocean Topography Physical Structure of the
US Beach Nourishment Experience:
 Beach Nourishment: Introduction of new sand to the beach by truck or dredge Large beach >1 million cubic yards (100,000 dump truck loads) Funding is a combination of federal, state, local & private Also
Town of Duck, North Carolina
 Tracking No. 00.00.2010 Erosion Mitigation And Shoreline Management Feasibility Study Town of Duck, North Carolina Coastal Planning & Engineering of North Carolina February 28, 2013 Ken Willson 1 Tracking
Julebæk Strand. Effect full beach nourishment
 Julebæk Strand Effect full beach nourishment Aim of Study This study is a part of the COADAPT funding and the aim of the study is to analyze the effect of beach nourishment. In order to investigate the
The Sand Beaches of New Hampshire and Maine
 The Sand Beaches of New Hampshire and Maine Beach Preservation and Erosion Control Photographs provided by Joe Kelly and Steve Adams Cover photo: Reid State Park, ME Introduction The sand beaches of New
The purpose and needs of the Figure Eight Island Inlet and Shoreline Management Project are as follows:
 Chapter 2 PURPOSE AND NEEDS 1. What are the purpose and needs of this project? The main concern of residents and owners at Figure Eight Island are economic losses resulting from damages to structures and
Earth Science Chapter 16 Section 3 Review
 Name: Class: Date: Earth Science Chapter 16 Section 3 Review Multiple Choice Identify the choice that best completes the statement or answers the question. 1. The movement of water that parallels the shore
Texas passes, longshore transport, hurricanes, beach erosion and sea level
 Texas passes, longshore transport, hurricanes, beach erosion and sea level Richard L. Watson, Ph.D. (361) 749-4152 Field work can be strange! 120,000 years of sea level Years each zone exposed above S/L
Lecture Outlines PowerPoint. Chapter 15 Earth Science, 12e Tarbuck/Lutgens
 Lecture Outlines PowerPoint Chapter 15 Earth Science, 12e Tarbuck/Lutgens 2009 Pearson Prentice Hall This work is protected by United States copyright laws and is provided solely for the use of instructors
Follets Island Nearshore Beach Nourishment Project
 Coast & Harbor Engineering A division of Hatch Mott MacDonald Follets Island Nearshore Beach Nourishment Project Arpit Agarwal, P.E. April 1, 2016 Project Site!"#$% &'(% &)*+% )#,'-+% Shoreline Erosion
4/20/17. #31 - Coastal Erosion. Coastal Erosion - Overview
 Writing Assignment Due Monday by 11:59 pm #31 - Coastal Erosion Beach front property! Great View! Buy now at a great price! See main class web pages for detailed instructions Essays will be submitted in
Basic Dune Physical Characteristics
 Basic Dune Physical Characteristics New Jersey s Beach and Dune Characteristics Dunes in New Jersey are mainly confined to a narrow strip of land between the beach berm and upland development. While there
OECS Regional Engineering Workshop September 29 October 3, 2014
 B E A C H E S. M A R I N A S. D E S I G N. C O N S T R U C T I O N. OECS Regional Engineering Workshop September 29 October 3, 2014 Coastal Erosion and Sea Defense: Introduction to Coastal/Marine Structures
CROSS-SHORE SEDIMENT PROCESSES
 The University of the West Indies Organization of American States PROFESSIONAL DEVELOPMENT PROGRAMME: COASTAL INFRASTRUCTURE DESIGN, CONSTRUCTION AND MAINTENANCE A COURSE IN COASTAL DEFENSE SYSTEMS I CHAPTER
Effectiveness of Beach Nourishment in Response to Sea Level Rise
 2014 FSBPA Annual Conference Effectiveness of Beach Nourishment in Response to Sea Level Rise Navarre Beach Santa Rosa County July 18, 2005 Lovers Key Lee County April 23, 2012 South County St. Lucie County
Beach Nourishment Impact on Beach Safety and Surfing in the North Reach of Brevard County, Florida
 Beach Nourishment Impact on Beach Safety and Surfing in the North Reach of Brevard County, Florida Prepared by John Hearin, Ph.D. Coastal Engineering Vice Chairman Cocoa Beach Chapter Port Canaveral Patrick
DELAWARE S VULNERABLE COASTAL AREAS. DELAWARE INLAND BAYS and DELAWARE BAY RECONNAISSANCE STUDY
 DELAWARE S VULNERABLE COASTAL AREAS and the DELAWARE INLAND BAYS and DELAWARE BAY RECONNAISSANCE STUDY Kimberly K. McKenna, PG Delaware Dept. of Natural Resources & Environmental Control Division of Watershed