Feasibility Study to Assess the Viability of Developing Shared Indoor Pool/Aquatic Facility
|
|
|
- Godwin McKinney
- 6 years ago
- Views:
Transcription


1 City of University Park, Texas Feasibility Study to Assess the Viability of Developing Shared Indoor Pool/Aquatic Facility Draft Report December 10, Ravenhill Circle, Highlands Ranch, CO * * * bka@ballardking.com
2 Table of Contents Section I Market Analysis...1 Section II Community Input...47 Section III Building Program...52 Section IV Capital Cost Estimate...61 Section V Business Plan...63
3 MARKET ANALYSIS Introduction The Ballard*King & Associates project team has been tasked by the City of University Park to complete a feasibility study for the possible development of a joint indoor aquatic center for the City and Highland Park Independent School District. University Park City Council requested a non-site specific study with the idea that an aquatic center could ultimately be placed in any a number of locations in University Park. Section I Market Analysis One of the first steps in the study is to finish a market analysis for the project that examines the demographic characteristics of the market, possible rates of participation in swimming and the presence of other aquatic providers. Demographic Analysis The following is a summary of the basic demographic characteristics of the identified service areas along with recreation and leisure participation standards as produced by the National Sporting Goods. Service Areas: The goal of a new joint indoor aquatic facility from the City s perspective will be to serve the needs of its residents. However, it is recognized that a partnership with the Highland Park Independent School District, the aquatic center will need to serve the School District boundaries as well. As a result two service areas have been identified, the City of University Park and the Highland Park Independent School District. Page 1
4 MARKET ANALYSIS Service Area Comparison Chart: City of University Park Highland Park School District Population: 2010 Census 23,068 32, Estimate 24,146 34, Estimate 25,782 36,818 Households: 2010 Census 7,315 11, Estimate 7,598 11, Estimate 8,117 12,410 Families: 2010 Census 5,392 7, Estimate 5,601 8, Estimate 5,987 8,799 Average Household Size: 2010 Census Estimate Estimate Ethnicity: Hispanic 4.8% 4.7% White 93.3% 93.4% Black 1.0% 0.9% American Indian 0.3% 0.3% Asian 3.1% 3.1% Pacific Islander 0.008% 0.008% Other 0.7% 0.8% Multiple 1.7% 1.6% Median Age: 2010 Census Estimate Estimate Median Income: 2014 Estimate $148,031 $149, Estimate $194,768 $200,000 Household Budget Expenditures 1 : Housing Entertainment & Recreation This information is placed on an index with a reference point being the national average of 100. Page 2

5 Age MARKET ANALYSIS Age and Income: The median age and household income levels when compared with the national number are primary determiners of participation in aquatic and recreation activities. The lower the median age, the higher the participation rates are for most activities. The level of participation also increases as the median income level goes up. Table A Median Age: 2010 Census 2014 Projection 2019 Projection City of University Park Highland Park School District State of Texas Nationally Chart A Median Age: City of University Park Highland Park School District Texas National The median age of the City of University Park is significantly lower than the Highland Park School District and the State of Texas. The median age in the Highland Park School District is comparable to the national number while being higher than the State of Texas. The median age for the State of Texas is slightly less than the national number. The median age in both University Park and Highland Park School District points to younger families with children, along with the presence of older adults and retirees. Page 3

6 MARKET ANALYSIS Map A Median Age by Census Block Group: Page 4

7 Median HH Income MARKET ANALYSIS Table B Median Household Income: 2014 Estimate 2019 Projection City of University Park $148,031 $194,768 Highland Park School District $149,385 $200,000 State of Texas $51,979 $61,454 Nationally $52,076 $59,599 Chart B Median Household Income: $200,000 $180,000 $160,000 $140,000 $120,000 $100,000 $80,000 $60,000 $40,000 $20,000 $ City of University Park Highland Park School District Texas National Page 5
8 MARKET ANALYSIS Based upon 2014 median income projections the following comparison is possible: In the City of University Park, the percentage of households with a median income over $50,000 per year is 79.9% compared to 52.2% on a national level. Furthermore, the percentage of the households in the service area with a median income less than $25,000 per year is 10.3% compared to the level of 23.8% nationally. In the Highland Park School District, the percentage of households with a median income over $50,000 per year is 79.6% compared to 52.2% on a national level. Furthermore, the percentage of the households in the service area with a median income less than $25,000 per year is 9.9%% compared to the level of 23.8% nationally. While the median age in the State of Texas is slightly lower than the national number, the median household income in both service areas is 2-3 times higher than those numbers. Page 6

9 MARKET ANALYSIS Map B Median Household Income by Census Block Group: Page 7
10 MARKET ANALYSIS Household Budget Expenditures: In addition to taking a look at Median Age and Median Income, it is important to examine Household Budget Expenditures. In particular looking at housing information; shelter, utilities, fuel and public services along with entertainment & recreation can provide a snap shot into the cost of living and spending patterns in the services areas. The table below looks at that information and compares the service areas. Table C Household Budget Expenditures 2 : City of University Park SPI Average Spent per Percent Household Housing 252 $52, % Shelter 260 $41, % Utilities, Fuel, Public Service 227 $11, % Entertainment & Recreation 260 $8, % Highland Park School District SPI Average Spent per Percent Household Housing 252 $53, % Shelter 262 $42, % Utilities, Fuel, Public Service 230 $11, % Entertainment & Recreation 262 $8, % State of Texas SPI Average Spent per Percent Household Housing 101 $21, % Shelter 101 $16, % Utilities, Fuel, Public Service 103 $5, % Entertainment & Recreation 102 $3, % SPI: Spending Potential Index as compared to the national number of 100. Average Amount Spent: The average amount spent per household. Percent: Percent of the total 100% of household expenditures. Note: Shelter along with Utilities, Fuel, Public Service are a portion of the Housing percentage. 2 Consumer Spending data are derived from the 2004 and 2005 Consumer Expenditure Surveys, Bureau of Labor Statistics. ESRI forecasts for 2014 and Page 8

11 SPI Number MARKET ANALYSIS Chart C Household Budget Expenditures Spending Potential Index: Housing Shelter Utilities, Fuel, Public Service Entertainment & Recreation City of University Park Highland Park School District Texas National Chart C illustrates the Household Budget Expenditures Spending Potential Index in the service areas. The SPI for Household Budget Expenditures is consistent with the median household income. The rate of spending in both service areas is more than double the State and national number. In terms of Entertainment and Recreation Spending, it represents approximately 5% of total spending. It will be important to keep this information in mind when developing a fee structure and looking at an appropriate cost recovery philosophy for the facility. Page 9
12 MARKET ANALYSIS Recreation Expenditures Spending Potential Index: Through the demographic provider that B*K utilizes for the market analysis portion of the report, we can examine the overall propensity for households to spend dollars on recreation activities. The following comparisons are possible. Table D Recreation Expenditures Spending Potential Index 3 : City of University Park SPI Average Spent per Household Fees for Participant Sports 293 $ Fees for Recreational Lessons 340 $ Social, Recreation, Club Membership 325 $ Exercise Equipment/Game Tables 236 $ Other Sports Equipment 229 $17.85 Highland Park School District SPI Average Spent per Household Fees for Participant Sports 293 $ Fees for Recreational Lessons 341 $ Social, Recreation, Club Membership 328 $ Exercise Equipment/Game Tables 237 $ Other Sports Equipment 231 $17.97 State of Texas SPI Average Spent per Household Fees for Participant Sports 100 $ Fees for Recreational Lessons 94 $ Social, Recreation, Club Membership 98 $ Exercise Equipment/Game Tables 84 $63.16 Other Sports Equipment 99 $7.70 Average Amount Spent: The average amount spent for the service or item in a year. SPI: Spending potential index as compared to the national number of Consumer Spending data are derived from the 2006 and 2007 Consumer Expenditure Surveys, Bureau of Labor Statistics. Page 10

13 Recreation SPI Number MARKET ANALYSIS Chart D Recreation Spending Potential Index: Fees for Participant Sports Fees for Recreational Lessons Social, Recreaiton, Club Membership Exercise Equipment/Game Tables Other Sports Equipment City of University Park Highland Park School District Texas National The Spending Potential Index for Recreation is very comparable to the numbers in the Household Budget Index in that they follow the same pattern. The spending in all areas is double and in some cases triple the state and national number. It is also important to note that these dollars are currently being spent, so the identification of alternative service providers and the ability of another facility to capture a portion of these dollars will be essential information to use in the decision making process. Page 11

14 MARKET ANALYSIS Map C Entertainment & Recreation Spending Potential Index by Census Block Group: Page 12
15 MARKET ANALYSIS Service Area Analysis Each of the identified service area s demographic characteristics are now analyzed. Immediate Service Area City of University Park. Primary Service Area Highland Park Independent School District. Page 13

16 MARKET ANALYSIS Map D Immediate Service Area Map: Page 14
 Population: Ages Population % of Total Nat. Population Difference -5 1,238 5.2% 6.5% -1.3% 5-17 5,503 22.7% 17.2% +5.")
17 Percentage of Population MARKET ANALYSIS Population Distribution by Age: Utilizing census information for the Immediate Service Area, the following comparisons are possible. Table E 2014 Immediate Service Area Age Distribution (ESRI estimates) Population: Ages Population % of Total Nat. Population Difference -5 1, % 6.5% -1.3% , % 17.2% +5.0% , % 9.8% +9.4% , % 26.5% -10.1% , % 14.1% +1.2% , % 12.3% -0.5% , % 7.5% -2.2% % 6.1% -2.3% 2014 census estimates in the different age groups in the Immediate Service Area. % of Total: Percentage of the Immediate Service Area population in the age group. National Population: Difference: Percentage of the national population in the age group. Percentage difference between the Immediate Service Area population and the national population. Chart E 2014 Immediate Service Area Age Group Distribution yrs Immediate Service Area National Page 15
18 MARKET ANALYSIS The Immediate Service Area, when compared to the characteristics of the national population, indicates that there are some differences. The population is equal or larger in the 5-17, and age groups and a smaller population in the -5, 25-44, 55-64, and 75+ age groups. The largest positive variance is in the age group with +9.4% while the greatest negative variance is in the age group with -10.1%. Page 16
19 Population MARKET ANALYSIS Population Distribution Comparison by Age: Utilizing census information from the Immediate Service Area, the following comparisons are possible. Table F 2014 Immediate Service Area Population Estimates (U.S. Census Information and ESRI) Ages 2010 Census 2014 Projection 2019 Projection Percent Change Percent Change Nat l -5 1,259 1,238 1, % +4.7% ,515 5,503 5, % +1.8% ,223 4,629 4, % -2.4% ,205 4,023 4, % +10.4% ,755 3,694 3, % -6.2% ,338 2,862 3, % +13.7% ,277 1, % +32.9% , % +9.5% Chart F Immediate Service Area Population Growth 6,000 5,000 4,000 3,000 2,000 1, yr Table-F illustrates the growth or decline in age group numbers from the 2010 census until the year All of the age categories will see an increase or static growth in population, except and It must be remembered that the population of the United States as a whole is aging. It is not unusual to find negative growth numbers in the younger age groups and significant net gains in the 45 plus age groupings in communities which are relatively stable in their population numbers. Page 17
20 MARKET ANALYSIS Ethnicity and Race: Below is listed the distribution of the population by ethnicity and race for the Immediate Service Area for 2014 population projections. Those numbers were developed from 2010 Census Data. Table G Immediate Service Area Ethnic Population and Median Age (Source U.S. Census Bureau and ESRI) Ethnicity Total Median Age % of % of TX Population Population Population Hispanic 1, % 39.1% Table H Immediate Service Area Population by Race and Median Age (Source U.S. Census Bureau and ESRI) Race Total Population Median Age % of Population % of TX Population White 22, % 69.1% Black % 12.0% American Indian % 0.7% Asian % 4.2% Pacific Islander % 0.1% Other % 11.0% Multiple % 2.9% 2014 Immediate Service Area Total Population: 24,146 Residents Chart G Immediate Service Area Non-White Population by Race 0.3% 1.0% 3.1% 1.7% 0.7% 0.01% Black American Indian Asian Pacific Islander Other Multiple Page 18

21 MARKET ANALYSIS Map E Primary Service Area Map: Page 19
22 Percentage of Population MARKET ANALYSIS Population Distribution by Age: Utilizing census information for the Primary Service Area, the following comparisons are possible. Table I 2014 Primary Service Area Age Distribution (ESRI estimates) Population: Ages Population % of Total Nat. Population Difference -5 1, % 6.5% -1.5% , % 17.2% +4.9% , % 9.8% +5.4% , % 26.5% -9.7% , % 14.1% +1.4% , % 12.3% +0.5% , % 7.5% -0.5% 75+ 1, % 6.1% -0.5% 2014 census estimates in the different age groups in the Primary Service Area. % of Total: Percentage of the Primary Service Area population in the age group. National Population: Difference: Percentage of the national population in the age group. Percentage difference between the Primary Service Area population and the national population. Chart H 2014 Primary Service Area Age Group Distribution yrs Primary Service Area National Page 20
23 MARKET ANALYSIS The Primary Service Area, when compared to the characteristics of the national population, indicates that there are some differences. The population in the 5-17, 18-24, and age groups and a smaller population in the -5, 25-44, and 75+ age groups. The largest positive variance is in the age group with +5.4% while the greatest negative variance is in the age group with -9.7%. Page 21
 Ages 2010 Census 2014 Projection 2019 Projection Percent Change Percent Change Nat l -5 1,796 1,747 1,890 +5.")
24 Population MARKET ANALYSIS Population Distribution Comparison by Age: Utilizing census information from the Primary Service Area, the following comparisons are possible. Table J 2014 Primary Service Area Population Estimates (U.S. Census Information and ESRI) Ages 2010 Census 2014 Projection 2019 Projection Percent Change Percent Change Nat l -5 1,796 1,747 1, % +4.7% ,493 7,562 8, % +1.8% ,621 5,242 5, % -2.4% ,151 5,776 6, % +10.4% ,407 5,318 5, % -6.2% ,779 4,416 4, % +13.7% ,938 2,403 3, % +32.9% 75+ 1,729 1,952 2, % +9.5% Chart I Primary Service Area Population Growth 6,000 5,000 4,000 3,000 2,000 1, yr Table-J illustrates the growth or decline in age group numbers from the 2010 census until the year All of the age categories will see an increase or static growth in population, except and It must be remembered that the population of the United States as a whole is aging. It is not unusual to find negative growth numbers in the younger age groups and significant net gains in the 45 plus age groupings in communities which are relatively stable in their population numbers. Page 22
 Ethnicity Total Median Age % of % of TX Population Population Population Hispanic 1,633 22.")

25 MARKET ANALYSIS Ethnicity and Race: Below is listed the distribution of the population by ethnicity and race for the Primary Service Area for 2014 population projections. Those numbers were developed from 2010 Census Data. Table K Primary Service Area Ethnic Population and Median Age (Source U.S. Census Bureau and ESRI) Ethnicity Total Median Age % of % of TX Population Population Population Hispanic 1, % 39.1% Table L Primary Service Area Population by Race and Median Age (Source U.S. Census Bureau and ESRI) Race Total Population Median Age % of Population % of TX Population White 32, % 69.1% Black % 12.0% American Indian % 0.7% Asian 1, % 4.2% Pacific Islander % 0.1% Other % 11.0% Multiple % 2.9% 2014 Primary Service Area Total Population: 34,416 Residents Chart J Primary Service Area Non-White Population by Race 0.3% 0.9% 3.1% 1.6% 0.8% 0.01% Black American Indian Asian Pacific Islander Other Multiple Page 23
26 MARKET ANALYSIS Tapestry Segmentation: Tapestry segmentation represents the 4 th generation of market segmentation systems that began 30 years ago. The 65-segment Tapestry Segmentation system classifies U.S. neighborhoods based on their socioeconomic and demographic compositions. While the demographic landscape of the U.S. has changed significantly since the 2010 Census, the tapestry segmentation has remained stable as neighborhoods have evolved. The value of including this information for the City of University Park is that it allows the organization to better understand the consumers/constituents in their service areas and supply them with the right products and services. The tapestry segmentation system classifies U.S. neighborhoods into 65 distinctive market segments. Neighborhoods are sorted by more than 60 attributes including; income, employment, home value, housing types, education, household composition, age and other key determinates of consumer behavior. The following pages and tables outline the top 5 tapestry segments in each of the service areas and provides a brief description of each. This information combined with the key indicators and demographic analysis of each service area help further describe the markets that the City of University Park looks to serve with programs, services and special events. Page 24
27 MARKET ANALYSIS Table M Immediate Service Area Tapestry Segment Comparison (ESRI estimates) City of University Park U.S. Households Cumulative Cumulative Percent Percent Percent Percent Top Rung (01) 55.0% 55.0% 0.9% 0.9% Trendsetters (23) 20.5% 75.5% 1.2% 2.1% Urban Chic (09) 11.8% 87.3% 1.4% 3.5% Suburban Splendor (02) 4.0% 91.3% 1.7% 5.2% Connoisseurs (03) 3.9% 95.2% 1.3% 6.5% Top Rung (01) Residents of these neighborhoods are mature, married, highly educated and wealthy. Of the residents 1/3 are in their peak earning years of and more than 77% of households are composed of married couples; ½ of them have children and ½ do not. Except for children, this is a low-diversity, monochromatic market. Health conscious residents in this market practice yoga do aerobics, play golf and tennis. Trendsetters (23) On the cutting edge of urban style these residents are young, diverse and mobile. More than ½ of the households are singles who live alone or share the rent with a roommate, families comprise the remainder. Ethnically diverse, more than 10% of the residents are Asian, and 25% are Hispanic. These residents regularly exercise. Urban Chic (09) These residents are professionals who live a sophisticated, exclusive lifestyle. More than ½ of these households are married-couple families, similar to the U.S., and less than ½ of them have children. There is a smaller proportion of single parents and a higher proportion of singles and shared households in comparison to the U.S. To stay fit these residents hike, go biking, practice yoga, do aerobics, play tennis and lift weights. Suburban Splendor (02) These residents are families who live in growing suburban neighborhoods. These neighborhoods are comprised of married couple families with and without children. The median age is 41.4 years, and ½ of the population aged years. This is a lowdiversity, predominately white market. These residents keep fit by working out weekly at a club or exercising on a treadmill or stationary bike at home. Connoisseurs (03) Residents of these neighborhoods are somewhat older with a median age of 46.8 years. Approximately 70% of the population is married, although residents appear closer to retirement than child-rearing age, 30% of the households are married couples with children living at home. Exercise is a priority; they workout weekly at a club or other facility, play golf and tennis, practice yoga and jog. Page 25
28 MARKET ANALYSIS Table N Primary Service Area Tapestry Segment Comparison (ESRI estimates) City of University Park U.S. Households Cumulative Cumulative Percent Percent Percent Percent Top Rung (01) 54.0% 54.0% 0.9% 0.9% Trendsetters (23) 15.2% 69.2% 1.2% 2.1% Urban Chic (09) 12.3% 81.5% 1.4% 3.5% Laptops & Lattes (08) 4.0% 85.5% 1.0% 4.5% Retirement Communities (30) 3.8% 89.3% 1.6% 6.1% Top Rung (01) Residents of these neighborhoods are mature, married, highly educated and wealthy. Of the residents 1/3 are in their peak earning years of and more than 77% of households are composed of married couples; ½ of them have children and ½ do not. Except for children, this is a low-diversity, monochromatic market. Health conscious residents in this market practice yoga do aerobics, play golf and tennis. Trendsetters (23) On the cutting edge of urban style these residents are young, diverse and mobile. More than ½ of the households are singles who live alone or share the rent with a roommate, families comprise the remainder. Ethnically diverse, more than 10% of the residents are Asian, and 25% are Hispanic. These residents regularly exercise. Urban Chic (09) These residents are professionals who live a sophisticated, exclusive lifestyle. More than ½ of these households are married-couple families, similar to the U.S., and less than ½ of them have children. There is a smaller proportion of single parents and a higher proportion of singles and shared households in comparison to the U.S. To stay fit these residents hike, go biking, practice yoga, do aerobics, play tennis and lift weights. Laptops & Lattes (08) With no homeownership or child-rearing responsibilities, residents of these neighborhoods enjoy a single life in the big city. Most households are singles who live alone or with a roommate. With a median age of 38.6 years, these residents are slightly older than the U.S. median of 36.9 years. Residents regularly exercise at a health club and practice yoga, play tennis, jog and bike. Retirement Communities (30) Most of the households in these neighborhoods are single seniors who live alone; a ¼ is married couples with no children living at home. This is an older market and 1/3 of the residents and 44% of householders aged 65 years or older. Most of these residents are white. These residents go dancing, practice yoga and play golf. Page 26
29 MARKET ANALYSIS Demographic Summary The following summarizes the demographic characteristics of the service areas. Both service areas are relatively small in terms of the total population. However, it would be possible for the community to support an indoor aquatic facility. The median age in both service areas is lower, with the City of University Park being significantly lower than the State of Texas and the national number. A lower median age typically points to younger families with children that are primary users of recreation amenities. However, because swimming as an activity crosses all age groups it is important to acknowledge a significant older population that would use an indoor aquatic center. The cost of living in both service areas is significantly higher than the State and national numbers. However, the median household income is such to support that cost of living. The rate of spending for Entertainment & Recreation matches the median household income. The spending potential index for these services is double and in some cases triple the national level. The Tapestry segments for both service areas point to affluent communities with a focus on health and wellness. Both service areas are impacted by the presence of students at SMU. Page 27
30 MARKET ANALYSIS Sports Participation Numbers In addition to analyzing the demographic realities of the service areas, it is possible to project possible participation in recreation and sports activities. Participation Numbers: On an annual basis the National Sporting Goods Association (NSGA) conducts an in-depth study and survey of how Americans spend their leisure time. This information provides the data necessary to overlay rate of participation onto the Primary Service Area to determine market potential. B*K takes the national average and combines that with participation percentages of the Primary Service Area based upon the age distribution, median income and region. Those four percentages are then averaged together to create a unique participation percentage for the service area. This participation percentage when applied to the population of the Primary Service Area then provides an idea of the market potential for various activities. Page 28
31 MARKET ANALYSIS Swimming Participation: The rate of swimming participation is shown below. Table O Recreation Activity Participation Rates for the Primary Service Area Activity Age Income Region Nation Average Swimming 16.3% 23.3% 15.1% 15.8% 17.6% Age Income Region Nation Average Did Not Participate 21.8% 14.6% 22.7% 21.8% 20.2% Age: Income: Region: National: Average: Participation based on individuals ages 7 & Up in the Primary Service Area. Participation based on the 2014 estimated median household income in the Highland Park SD. Participation based on regional statistics (West South Central). Participation based on national statistics. Average of the four columns. Page 29
32 MARKET ANALYSIS Anticipated Participation Numbers for Swimming: Utilizing the average percentage from Table-O above plus the 2010 census information and census estimates for 2014 and 2019 (over age 7) the following comparisons are possible. Table P Participation Rates Primary Service Area Activity Average 2010 Part Part Part. Difference Swimming 17.6% 5,300 5,588 5, Average 2010 Part Part Part. Difference Did Not Participate 20.2% 6,080 6,411 6, Note: The estimated participation numbers for swimming could take place in an indoor aquatic facility in the Primary Service Area. However, these numbers do not translate into attendance figures for an indoor aquatic facility in the Primary Service Area as people already participate in many other locations. The Did Not Participate statistics refers to all 51 activities outlined in the NSGA 2013 Survey Instrument. Page 30
33 MARKET ANALYSIS Anticipated Annual Swimmer Days: Utilizing NSGA s 2013 survey information B*K can determine the average number of times each of the groups listed below participated in swimming. Once that average is determined it can be applied to the participation numbers from Table-P to provide anticipated swimmer days within the service area. Anticipated swimmer days are defined as the number of times all of the individuals within the service area will swim during the year, regardless of duration or location. Table Q Anticipated Annual Swimmer Days Primary Service Area National Male Female Region Income Average Average 2010 Part Part Part. Difference , , ,921 25,376 This is a significant number of swimmer days that are available in the Primary Service Area. Page 31
34 MARKET ANALYSIS In addition to developing a unique participation percentage for the Primary Service Area and looking at the number of swimmer days, B*K also examines the frequency of participation in swimming according to the 2013 NSGA Survey. The chart below outlines that data. Table R Participation Frequency Frequent Occasional Infrequent Swimming Frequency Swimming Percentage of Population 5.9% 44.7% 49.4% In the chart above one can look at swimming and how it is defined with respect to visits being Frequent, Occasional or Infrequent and then the percentage of the population that participates. Table S Participation Numbers in Primary Service Area Frequent Occasional Infrequent Total Swimming Population 330 2,498 2,760 Visits 37, ,366 41, ,716 The table above takes the frequency information one step further and identifies the number of times an individual may participate in swimming. Once that is determined the participation numbers are applied to percentage from Table-R to the population in Table-P and then gives a total number of aquatic facility visits. Those visits are not specific to one facility, but rather specific to the Primary Service Area population. In other words, those visits are already taking place at the facilities within the service area. Frequent Users: Competitive swimmers, multi-sport athletes and individuals that participate in lap swimming for exercise fall into this group. Their preference is 50M or 25Y lap lanes, and they have little concern for the social aspects of aquatics. Occasional Users: Some multi-sport athletes, some lap swimmers and individuals using the pool for other fitness purposes such as water walking or group exercise fall into this group. Also included in this group are some families. Their preference is the inclusion of lap lanes, but also shallow and deep water and varied water temperatures. Infrequent Users: Families and non-lap swimmers fall into this group. Their preference has little to do with exercise in the water. They are looking for shallow water, interactive play features and warm water. Being in the water is merely enough for this group, and the social aspect is significantly more important than exercise or competition. Page 32
35 MARKET ANALYSIS Participation by Ethnicity and Race: Participation in sports activities is also tracked by ethnicity and race. The table below compares the overall rate of participation nationally with the rate for Hispanics and African Americans. Utilizing the information provided by the National Sporting Goods Association's 2013 survey, the following comparisons are possible. Table T Comparison of National, African American and Hispanic Participation Rates Primary Service Area National Participation African American Participation Hispanic Participation Swimming 17.6% 17.0% 5.8% 10.9% Did Not Participate 20.2%% 21.9% 27.1% 25.6% Primary Service Part: National Rate: The unique participation percentage developed for the Primary Service Area. The national percentage of individuals who participate in a given activity. African American Rate: The percentage of African Americans who participate in a given activity. Hispanic Rate: The percentage of Hispanics who participate in a given activity. Based on the fact that there is not a significant Black or Hispanic population in the Primary Service Area, these participation rates become less relevant to the impact on overall participation percentages. Page 33
36 MARKET ANALYSIS Summary of Sports Participation: The following chart summarizes participation in both indoor and outdoor activities utilizing information from the 2013 National Sporting Goods Association survey. Table U Sports Participation Summary Sport Nat l Rank 4 Nat l Participation (in millions) Primary Service Area Primary Service Area % Participation Exercise Walking % Exercising w/ Equipment % Swimming % Aerobic Exercising % Running/Jogging % Club % Weightlifting % Yoga % Basketball % Soccer % Tennis % Baseball % Volleyball % Softball % Football (tackle) % Gymnastics % Cheerleading % Wrestling % Lacrosse % Nat l Rank: Nat l Participation: Primary Service %: Popularity of sport based on national survey. Percent of population that participate in this sport on national survey. Ranking of activities based upon average from Table-O. Primary Service Rank: The rank of the activity within the Primary Service Area. This table indicates that swimming is the third most popular sport nationally and in the Primary Service Area. 4 This rank is based upon the 51 activities reported on by NSGA in their 2013 survey instrument. Page 34
37 MARKET ANALYSIS In addition to examining the participation numbers for various indoor activities through the NSGA 2013 Survey and the Spending Potential Index for Entertainment & Recreation, B*K can access information about Sports & Leisure Market Potential. Table V Market Potential Index 5 for Adult Participation in the Primary Service Area Adults participated in: Expected Percent of MPI Number of Adults Population Swimming 5, % 144 Expected # of Adults: Number of adults, 18 years of age and older, participating in the activity in the Primary Service Area. Percent of Population: Percent of the service area that participates in the activity. MPI: Market potential index as compared to the national number of 100. This table indicates that the overall propensity for adults to participate in swimming is almost 50% greater than the national number. This can be attributed to a number of factors; with access to facilities and ability to pay being two of the most common. 5 Data Note: An MPI (Market Potential Index) measures the relative likelihood of the adults or households in the specified trade area to exhibit certain consumer. Source: These data are based upon national propensities to use various products and services, applied to local demographic composition. Page 35

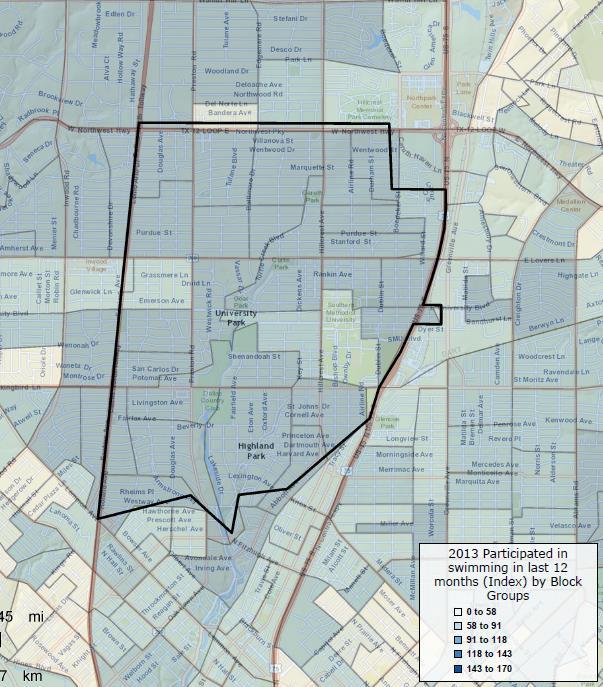
38 MARKET ANALYSIS Map F Swimming Participation: Page 36
39 MARKET ANALYSIS Sports Activity Trends: Below are listed those sports activities and the percentage of growth or decline that each has experienced nationally over the last 10 years ( ). Table W National Activity Trend (in millions) Sport/Activity 2013 Participation 2004 Participation Percent Change Yoga % Wrestling % Lacrosse % Running/Jogging % Aerobic Exercising % Tennis % Gymnastics % Weightlifting % Exercise Walking % Club % Exercising w/ Equipment % Soccer % Volleyball % Basketball % Football (tackle) % Cheerleading % Swimming % Softball % Baseball % 2013 Participation: The number of participants per year in the activity (in millions) in the United States Participation: The number of participants per year in the activity (in millions) in the United States. Percent Change: The percent change in the level of participation from 2004 to It is significant that swimming participation has declined by 14.8% nationally over the last ten years. 6 Participation trend since Participation trend since Page 37

40 Population MARKET ANALYSIS Table X Swimming 15-Year History Year Participation in Millions Chart K Swimming 15-Year History Swimming Page 38
41 MARKET ANALYSIS Aquatic Activity and Facility Trends: Without a doubt the hottest trend in aquatics is the leisure pool concept. This idea of incorporating slides, current channels, fountains, zero depth entry and other water features into a pool s design has proved to be extremely popular for the recreational user. The age of the conventional pool in most recreational settings has been greatly diminished. Leisure pools appeal to the younger children (who are the largest segment of the population that swim) and to families. These types of facilities can attract and draw larger crowds, and people tend to come from a further distance and stay longer to utilize such pools. This all translates into the potential to sell more admissions and increase revenues. It is estimated conservatively that a leisure pool can generate up to 20% to 25% more revenue than a comparable conventional pool and the cost of operation, while being higher, has been offset through increased revenues. Patrons seem willing to pay a higher user fee at a leisure pool than a conventional aquatics facility. Another trend that is growing more popular in the aquatic s field is the development of a raised temperature therapy pool for rehabilitation programs. A raised temperature therapy pool is typically developed in association with a local health care organization or a physical therapy clinic. The medical organization either provides capital dollars for the construction of the pool or agrees to purchase so many hours of pool time on an annual basis. This form of partnership has proven to be appealing to both the medical side and the organization that operates the facility. The medical sector receives the benefit of a larger aquatic center, plus other amenities that are available for their use, without the capital cost of building the structure. In addition, they can develop a much stronger community presence away from traditional medical settings. The facility operators have a stronger marketing position through an association with a medical organization and a user group that will provide a solid and consistent revenue stream for the center. This is enhanced by the fact that most therapy use times occur during the slower mid-morning or afternoon times in the pool and the center. Despite the recent emphasis on recreational swimming and therapy, the more traditional aspects of aquatics (including swim teams, instruction and aqua fitness) remain as the foundation for many aquatic centers. The life safety issues associated with teaching children how to swim is a critical concern in most communities and competitive swim team programs through USA Swimming, high schools, and other community based organizations continue to be important. Aqua fitness, from aqua exercise to lap swimming, has enjoyed strong growth during the last ten years with the realization of the benefits of water-based exercise. A new concept is the spray ground, where a number of water spray features are placed in a playground setting where there is no standing water but the water is treated and recirculated much like a pool. This provides a fun yet safe environment where drowning is not a concern and lifeguards are not necessary. While most spray grounds are outdoor amenities, they are now being integrated into indoor facilities as well. Page 39
42 MARKET ANALYSIS The multi-function indoor aquatic center concept of delivering aquatics services continues to grow in acceptance with the idea of providing for a variety of aquatics activities and programs in an open design setting that features a lot of natural light, interactive play features and access to an outdoor sundeck. The placing of traditional instructional/competitive pools, with shallow depth/interactive leisure pools and therapy water, in the same facility has been well received in the market. This idea has proven to be financially successful by centralizing pool operations for recreation service providers and through increased generation of revenues from patrons willing to pay for an aquatics experience that is new and exciting. Indoor aquatic centers have been instrumental in developing a true family appeal for community-based facilities. The keys to success for this type of center revolve around the concept of intergenerational use in a quality facility that has an exciting and vibrant feel in an outdoor like atmosphere. Aquatic Facilities Market Orientation Based on the aquatic trends and typical aquatic needs within a community, there are specific market areas that need to be addressed with aquatic facilities. These include: 1. Leisure/recreation aquatic activities - This includes a variety of activities found at leisure pools with zero depth entry, warm water, play apparatus, slides, seating areas and deck space. These are often combined with other non-aquatic areas such as concessions and birthday party or other group event areas. 2. Instructional programming - The primary emphasis is on teaching swimming and lifesaving skills to many different age groups. These activities have traditionally taken place in more conventional pool configurations but should not be confined to just these spaces. Reasonably warm water, shallow depth with deeper water (4 ft. or more), and open expanses of water are necessary for instructional activities. Easy pool access, a viewing area for parents, and deck space for instructors is also crucial. 3. Fitness programming - These types of activities continue to grow in popularity among a large segment of the population. From aqua exercise classes, to lap swimming times, these programs take place in more traditional settings that have lap lanes and large open expanses of water available at a 3 1/2 to 5 ft. depth. 4. Therapy A growing market segment for many aquatic centers is the use of warm, shallow water for therapy and rehabilitation purposes. Many of these services are offered by medically based organizations that partner with the center for this purpose. 5. Competitive swimming/diving - Swim team competition and training for youth, adults and seniors requires a traditional 6 to 10 lane pool with a 1 and/or 3 meter diving boards at a length of 25 yards or 50 meters. Ideally, the pool depth should be no less than 4 ft. deep (7 is preferred). Page 40
43 MARKET ANALYSIS Spectator seating and deck space for staging meets is necessary. This market is usually relatively small in number but very vocal on the demands for competitive pool space and time. 6. Specialized uses Activities such as water polo and synchronized swimming can also take place in competitive pool areas as long as the pool is deep enough (7 ft. minimum) and the pool area is large enough. However these are activities that have small participant numbers and require relatively large pool areas. As a result it may be difficult to meet the needs of all specialized uses on a regular basis. 7. Social/relaxation - The appeal of using an aquatics area for relaxation has become a primary focus of many aquatic facilities. This concept has been very effective in drawing non-swimmers to aquatic facilities and expanding the market beyond the traditional swimming boundaries. The use of natural landscapes and creative pool designs that integrate the social elements with swimming activities has been most effective in reaching this market segment. 8. Special events/rentals - There is a market for special events including kids birthday parties, corporate events, community organization functions, and general rentals to outside groups. The development of this market will aid in the generation of additional revenues and these events/rentals can often be planned for after or before regular hours or during slow use times. It is important that special events or rentals not adversely affect daily operations or overall center use. Specific market segments include: 1. Families - Within almost any market, an orientation towards family activities is essential. The ability to have family members of different ages participate in a fun and vibrant facility is essential. 2. Pre-school children - The needs of pre-school age children need to be met with very shallow or zero depth water which is warm and has play apparatus designed for their use. Interactive programming involving parents and toddlers can also be conducted in more traditional aquatic areas as well. 3. School age youth - A major focus should be to meet the needs of this age group from recreational swimming to competitive aquatics. The leisure components such as slides, fountains, lazy rivers and zero depth will help to bring these individuals to the pool on a regular basis for drop-in recreational swimming. The lap lanes provide the opportunity and space necessary for instructional programs and aquatic team use. 4. Teens - Another aspect should be meeting the needs of the teenage population. Serving the needs of this age group will require leisure pool amenities that will keep their interest (slides) as well as the designation of certain teen times of use. Page 41
44 MARKET ANALYSIS 5. Seniors - As the population of the United States and University Park continues to age, meeting the needs of an older senior population will be essential. A more active and physically oriented senior is now demanding services to ensure their continued health. Aqua exercise, lap swimming, therapeutic conditioning and even learn to swim classes have proven to be popular with this age group. 6. Special needs population - This is a secondary market, but with the A.D.A. requirements and the probable existence of shallow warm water and other components, the amenities are present to develop programs for this population segment. Association with a hospital and other therapeutic and social service agencies will be necessary to enhance this market. 7. Special interest groups - This is a market that needs to be explored to determine the use potential from a variety of groups. These could include swim teams (and other aquatic teams), School District teams, day care centers and social service organizations. Aquatics Participation Summary: The following is a brief summary of the possible aquatic participation rates for swimming. Swimming is the number 3 most popular sport nationally as well as in the service areas. The overall popularity of swimming has declined by approximately 14.8% in the last 10 years. The age group with the highest rate of participation in swimming is The rate of participation in swimming is approximately 17.6% of the population over age 7 in the Primary Service Area. There are estimated to be approximately 210,388 swimmer days available in the Primary Service Area (in 2013) and the rate is expected to grow at a steady in the coming years. Slightly more than 50% of all swimmers swim more than 24 times a year but only 6.4% swim 110 times or more. This means that most swimmers are recreational swimmers rather than competitive. Page 42


45 MARKET ANALYSIS University Park Aquatic Facilities Assessment: Within University Park there are a number of indoor and outdoor pools to serve the population base. Public and Non-Profit Providers The City, School District, and the YMCA all have pools in the market. City of University Park The City has an outdoor community pool, Holmes Aquatic Center, which is located in Curtis Park. The facility features a 50 meter and a wading pool, splash pad, and slide pool. Time is set aside for use by the Dolphin Swim Team in the morning, and there is also time allocated for senior swim and swim lessons. From 10:00am until 9:00pm the pool is open for recreational swimming (noon to 9:00pm on Sundays). Since this is an outdoor pool, it is a seasonal operation. Highland Park Independent School District The School District has an indoor 6 lane x 25 yard pool on the campus of Highland Park High School. This pool is utilized by the high school s swim team, Dallas Masters during the early morning hours, and the Dallas Mustangs Swim Team and the Elite Swim Club in the evenings. During the summer hours there is also some use by the tennis team, Special Olympics and even the YMCA. There are no open hours for general public use. The location of the pool on the campus is where the district needs to expand and add a large number of classrooms to serve its academic needs. As a result the district is looking for a new location for the pool off-campus. Park Cities YMCA The Y currently has an 8 lane x 25 yard pool in its building and is planning to build a new facility that will also have a similar sized pool. The Y has its own programming including swim lessons, water exercise classes and a swim team. Highland Park H.S. Pool Holmes Aquatic Center Page 43

46 MARKET ANALYSIS Private The other provider of aquatic facilities is the private sector. SMU The University has an existing 50 meter outdoor pool with a dive tower that is utilized primarily by its swim and dive teams as well as some community based competitive swim teams. The University has long term plans to build a new indoor aquatic center but the size, configuration and location still has to be determined. Dallas Country Club The club also has an outdoor pool that is available on a seasonal basis for its members and guests. SMU Pool It is recognized that there are a number of home pools in the community as well but these cannot serve the broader needs of the public. This is a representative listing of alternative aquatic facilities in University Park and is not meant to be a total accounting of all service providers. There may be other facilities located in the greater service area that have an impact on the market as well. University Park Aquatic Facilities Summary: The following is a summary of the University Park area aquatic facilities market. There are currently three public/non-profit swimming pools located in University Park, two of which are indoor pools. There is also one significant outdoor private pool in the community. Page 44
47 MARKET ANALYSIS Two of the pools (Highland Park High School and SMU) need to be replaced as the property they are sited on is needed for other purposes. SMU hopes to have a significant indoor competitive aquatic center built in the next five years or so. Of the two indoor pools currently in University Park, only the YMCA pool is open for general recreational use. Market Opportunities - Based on the other aquatic facilities located in University Park, the following are market opportunities for a new indoor aquatic center in the community. There are only two indoor pools in the community and the Highland Park High School pool needs to be replaced to allow the high school to expand its classroom space. The existing Highland Park High School pool supports not only high school swimming and diving but other organized community based swim teams. A new pool can support a variety of needs beyond just School District uses. A partnership with the City, School District and other potential partners will provide the opportunity for public use of an indoor pool for recreational and fitness swimming. There are no indoor leisure oriented aquatic facilities in the service area leaving an outstanding market for this type of facility. The demographic characteristics of the Primary Service Area are very conducive to generating a significant number of swimmers. Market Constraints In addition to the market opportunities, it is also important to analyze possible market constraints. These include. The population base in the Highland Park Independent School District is approximately 34,500, which is adequate to support an indoor public pool but with only resident use there are limited opportunities to build a stronger market for a facility. The YMCA will have a new center in the next couple of years that will feature an indoor lap/competitive pool. It is anticipated that SMU will have a new indoor competitive pool in the next five years. However, the location, size and availability to outside users has not been determined. Despite the need for a new indoor aquatic center to replace the high school pool and a possible partnership with the City to manage the facility, the reality is that the pool, like Page 45
48 MARKET ANALYSIS most other indoor pools in the United States, will not be able to cover its total cost of operation by revenues generated from the facility. Page 46
49 COMMUNITY INPUT Section II Community Input A key step in the feasibility process was gaining input from a number of sources. This included a series of stakeholder meetings and focus group sessions as well as a community meeting. The information in this section represents what was heard from these input sessions. Stakeholder Meetings Stakeholder meetings included: Dr. Orr, Highland Park School District Superintendent Leslie Melton, Highland Park School District President-Board of Trustees Jesse Cole, Highland Park High School Swim Coach Bob Livingston, City of University Park - Former City Manager Olin Lane, City of University Park, Mayor Bill Pardoe, City of University Park, Park Board Chairman Gerry Bradley, City of University Park, Parks Director Key findings: The high school needs to add classrooms and there is limited space on the campus for this addition. Moving the pool to another location off-site would help to solve the space issue. The City and School District have had discussions about the possibility of partnering to develop a new indoor pool on a City site that would allow for not only School District use but also public access. The District would pay for the capital cost of the facility while the City would be responsible for operating the center. An indoor pool that would be open to general community use would be a great asset for the City and School District. There is a growing school age population in the District which puts a greater demand on classroom space but could also add to the number of high school swimmers. The City would have an indoor pool available for the community and the indoor center could enhance the existing Holmes Aquatic Center. It sometimes reaches capacity during the season and additional space would be beneficial. However, the Curtis Park site has issues with parking, traffic and safety that will have to be solved. Page 47
50 COMMUNITY INPUT With the opposition to the Curtis Park site for an indoor aquatic center, it may require that other site options be explored. However, there are no other obvious sites available at this time. Utilizing any City park for an aquatic center would result in the loss of green space. The parking requirements for an indoor pool could mean that underground parking may need to be considered but this will add considerable cost to the project. Conversations were held with SMU regarding their plans for a new indoor aquatic center and the possibility of partnering with the City and School District. However, the site for the SMU pool is out of the City s and School District s boundaries. SMU is looking for capital and operational dollars with any partnership. The new YMCA pool cannot serve the needs of the School District as it will be almost fully subscribed for Y programs. The School District s primary use would be for its swim team. Little to no use is expected for school curriculum. The current high school pool is used by Dallas Masters, the Dallas Mustangs and Elite Swim Club for training and the facility is also used by Special Olympics and occasionally by the YMCA. o Dallas Masters 60 kids - swim early morning during the school year and late afternoon to early evening in the summer. They also use a number of other pools in the area for their program. o Dallas Mustangs 120 kids swim late afternoon to early evening during the school year and the summer. They also use a number of other pools in the area for their program. o Elite Swim Club 20 kids swim late evening during the school year. o Special Olympics utilize the pool in the early afternoon one day a week during the summer. o YMCA use the pool for meets two weekends during the summer. The new aquatic center would host local, high school dual/tri meets but not larger district or regional meets or events. The high school swim team has between 50 and 60 members and they swim from August through February. They usually host 5 meets a season. Many of the swimmers would car pool to a new aquatic center. Page 48
51 COMMUNITY INPUT High school water polo is a growing sport in Texas and will be a sanctioned sport in the near future. The existing high school pool is 50 years old and is in need of significant improvements. Key amenities that the School District would like to see in a new aquatic center include: Focus Groups o A minimum of an 8 lane, 25 yard competitive pool for swimming. Ideally the pool should be able to support water polo as well which would require a 25 yard by 25 meter pool. o Spectator seating on both sides of the pool with a maximum of 400 seats o Dedicated school locker rooms. o Adequate deck space for teams and coaches as well as meets. o Separate diving well with 1 and 3 meter diving boards. o Coaches office. o Adequate storage. o A meet/timing room. The following focus group session were held on September 23 rd and 24 th : Competitive Swim Teams Dallas Masters Swim Team Seniors Holmes Aquatic Center Users Curtis Park Neighborhood Residents Highland Park School District Facilities Committee Key findings: The competitive swimming programs indicated that the facility should have two pools one of which is a 25 yard by 25 meter competitive pool and the other a warm water leisure pool. There is a strong demand for pool time for USA swim teams. Diving is a very small sport but there is strong growth in water polo. Some groups mentioned the desire for a 50 meter pool. There was also a desire for dry-land training space. The rates that are charged for pool use are an issue. They cannot be increased much beyond the current level. Most swim team kids are dropped off and picked up at the end of practice. The School District may need to look at other sites besides Curtis Park. They should consider partnering with SMU on their new pool. Page 49
52 COMMUNITY INPUT The Curtis Park neighborhood residents are not against the idea of an indoor pool in the community, they just do not want to see it built in Curtis Park. There will be a loss of green space, and they are concerned about traffic, safety and parking. The City and School District should look at other sites or the District should purchase additional land next to the high school. There is concern that a pool that is shared by the School District and the City would be dominated by school uses. The School District should consider renting pool time from the YMCA or SMU to meet their needs. The seniors would be excited about having an indoor pool available for year round swimming but they are not sure of the overall need in the community and there is concern with the cost to build and operate the facility. There is recognition that the School District needs additional classroom space at the high school and this will likely require a new pool to be built elsewhere. Any new indoor pool should only be open to City and School District residents. There are traffic, safety and parking concerns with the Curtis Park site. Also the cost to build and operate a new indoor pool is a major issue. Existing users of the Holmes Park Aquatic Center want to make sure that an indoor pool on the site would not have a negative impact on the existing outdoor pool. An indoor pool that will serve community needs has to have another body of water besides just a competitive pool. This should be a warm water pool. Community Meeting On the evening of September 24 th, an open community meeting was held at City Hall. The meeting had over 150 people in attendance with overwhelming opposition to building a new indoor pool in Curtis Park. Key Comments Included: There is a petition with 1,000 signatures opposing an indoor aquatic center in Curtis Park. Page 50
53 COMMUNITY INPUT The School District needs to keep the pool on the high school campus. Rather than build a new pool the School District should partner with the YMCA and/or SMU to utilize their facilities. Other sites in the community need to be investigated. The City should not have to bear the total cost for operating the center. There are a number of major concerns with the idea of building an indoor aquatic center in Curtis Park. This includes: o Traffic congestion around the site o Loss of park green space and trees o Parking needs for the center o Safety of school children o Size and magnitude of the building o Capital and operational costs The City needs to complete the following studies on the project: o Traffic study o Environmental impact study o Survey of City residents o Legal assessment of the project and the partnership between the City and School District. Page 51
54 BUILDING PROGRAM Section III Building Program The following is a brief assessment of the Highland Park High School pool as well as the Holmes Aquatic Center. In addition there is a recommended program for a new indoor aquatic center in University Park. Assessment of existing Highland Park HS Pool Located within the main building of Highland Park High School, the existing competition pool consists of a 6-lane, 25 yard tank which varies in depth from 3-6 to 12. The tile pool finish and tile deck finish represent the finest and longest lasting finishes available even by today s standards. The structural condition of the pool s shell appears to be in very good condition, no visible cracks were observed. There are four post starting blocks at the deep end of the pool. The water depth at the shallow end does not meet USA Swimming standards for racing starts from starting platforms so the existing deck inserts for the starting blocks should never be utilized. While there are two 1- meter dive stands, only one of the stands dive boards was positioned for use. The pool s floor profile in regards to depth and length requirements for 1-meter dive boards appears to comply with Texas Department of Health Standards for Pools and Spas but was not physically confirmed. It was not part of this scope to verify if the main drains are VGB (Virginia Graeme Baker Pool and Spa Safety Act) compliant. Such compliance requires the pool to be equipped with antientrapment main drains which includes covers that meet ASME/ANSI A performance standard, the main drains to be interconnected and drain pipe connections to the main drains at a distance from top of pipe to bottom of main drain cover that meets at least 1.5 times the pipe diameter. The original design of pools of this age generally do not comply with this requirement and must have the main drain piping modified. There was not any evidence that the main drain piping had been modified. While the water depth at the shallow end of the pool would support water aerobics, the shallow depth prevents the pool from supporting water polo which requires a minimum 6 foot depth. The sport of water polo in high schools was moved from a fall event to a spring event so it would not conflict with competitive swimming. In the last 5 years water polo has seen a major growth spurt at the Texas high school level. Water polo is currently played at 100+ high schools in Texas and efforts are underway to make it a UIL sanctioned high school sport in Texas. The pool filtration system should be pulling water from both the surface rim flow gutter and the main drains. However, at the time of the visit for this report the pool water level was too low for surface rim flow into the gutter. The pool water clarity at the time of the visit for this report was somewhat cloudy but overall good. The filtration system consists of three Pentair Triton high rate sand filters connected in parallel. The pool mechanical room s limited room height and overall size severely limits options for alternate and better filtration systems. The plastic or fiberglass surge tank container is undersized for a pool of this size. An overflow pipe connected near the top Page 52
55 BUILDING PROGRAM of the tank and drained to a building drain prevents the tank from overflowing into the room. Pool chlorine and acid chemicals are stored in the same room which is causing deterioration of all the metals in the room. It is highly recommended that such chemicals be stored in separate rooms that are mechanically vented to the building exterior. The natatorium seats an estimated 300 people and offers seating on both sides of the pool. However, the meet managers enclosed area located within the seating obstructs the vision of observers sitting on either side of it. The boys and girls locker rooms are located beneath the school s main floor and are only accessible via stairs. The locker rooms and toilets do not meet ADA requirements as far as accessibility from the pool, dressing/locker, showers, etc. The locker rooms are shared between high school swimmers and adult master swim users. Located on the same floor is a small weight room to support the competitive swimmers. Assessment of Holmes Aquatic Center Located in University Park s Curtis Park, the existing Holmes Aquatic Center consists of a 50- meter pool, open flume water slide with deck level run out, shallow water children s pool, splash pad and various shade structures. The 50-meter pool has been modified for the addition of pool steps on the east end which impedes into two of the seven lanes. The pool is not used for competition swim purposes but the Dolphin Swim Team does practice at the facility. The ADA entrance is via a ramp on the south side of the pool. The deep end of the pool includes a 1-meter and 3-meter diving board. It is said that it is tradition for a UP s child s first jump off the 3-meter to be considered a rite of passage while growing up in UP. The entrance to the Holmes Aquatic Center includes a small ticket office, small single toilets, small concession, and pool mechanical room supporting the slide and splash pad. The building s foundation has experienced settlement which is evident by wide cracks in the CMU walls, falling CMU and shift in the door frame of the door to the ticket office. Corrective measures need to be taken soon to ensure the structural integrity of the building and to avoid injury to staff and/or patrons. Page 53


56 BUILDING PROGRAM The main toilets and locker rooms are located at the west end of the complex which is near the deep end of the 50-meter pool. This presents a safety hazard for having small children walk near deep water every time they need to access the toilet room. The facility does not offer a private first aid room which provides a space out of the heat for injured patrons to rest. Page 54
57 BUILDING PROGRAM New Indoor Aquatics Center Based upon input from the stakeholder meetings, focus group sessions and community meeting, the existing Highland Park High School competition pool should be replaced by an indoor competition 25 yard x 25 meter pool (10 yard lanes/8 meter lanes) with a minimum depth of 6 feet at the shallow end and 12 feet at the deep end and two 1-meter dive boards. The pool depths allow for competitive swim starts from starting blocks at both ends of the 25 yard and 25 meter swim directions. In addition to supporting 25-yard and 25-meter competitive swim events, the pool dimensions would support water polo and dive & synchronized dive events. Deck area would be equal to or slightly larger than the deck at the existing pool. Seating for 300 on one side of the pool. Support areas for the pool would include community locker rooms, six family change rooms, two team rooms of 1,000 sq.ft. each, 600 sq.ft. meet room (divisible into two rooms that could be reservable party rooms), coaches office, 1,000 sq.ft. weight and cardio room to support competitive swimmers, and mechanical space to support pool equipment. A concessions or vending area could also be included. With a minimum water depth of 6 foot and a cool water temperature that is desired by competitive swimmers, the competition pool would not adequately support the general population in terms of indoor leisure and exercise. Therefore, the natatorium should also include a warmer water leisure pool which may include zero depth entry, water resistance exercise, water aerobics exercise, interactive water features, water slide, climbing wall, lap swim, water basketball and water volleyball. This pool should be approximately 3,500 square feet of water area. Based upon a 6,150 sq.ft. competition pool and 3,500 sq.ft. leisure pool, the recommended supporting pool deck area is between 10,000 and 14,500 sq.ft. and a code bather load of 480 users. The minimum toilet fixture count is as follows: Females Males Water Closets 5 3 Urinals 0 3 Lavs 3 3 Showers 3 3 The entire building as well as the pools themselves would meet all ADA requirements and the facility should be designed to meet at least a LEED Silver designation. Page 55
58 BUILDING PROGRAM A tabulation of building areas are as follows: Component Square Footage Competition Pool (25 yard x 25 meter/diving) 6,150 Leisure Pool 3,500 Deck Area 14,000 Seating (300) 2,400 Student/Swimmer Locker Rooms 2,000 Public Locker Rooms 2,000 Family Change Rooms (6) 500 Meet Room/Party Room (divisible) 600 Weight Room 1,000 Coaches Office 120 Aquatic Managers Office 120 Lifeguard/First Aid Room 200 Lobby 1,000 Control Desk 200 Concessions/Vending 400 Pool Storage 500 Pool Mechanical Room 1,000 Misc. Circulation & Building support (20%) 7,138 Total 42,828 It should be recognized that once a concept plan is developed for the aquatic center, the square footage noted above could vary. Parking The parking requirements for the aquatic center are based on the bather load number of 480, staffing levels and spectator seating. Page 56
59 BUILDING PROGRAM Expected Peak Use Swim team practices and leisure pool in use. Use Number of Users Number Per Vehicle Number of vehicles Parking Competitive Pool Leisure Pool Staff Spectators Total Maximum use (when the center is being used for a swim meet and the leisure pool is in full use) would only likely occur 6-7 times a year. This could push the parking load to 270 spaces but this could be managed by off-site parking and/or reducing program use of the pool during these time periods. The expected peak use of the center would be late afternoon to early evening on weekdays and mid-day to late afternoon on weekends. Note: This assumes that all users would drive to the center and does not account for people walking or by bicycle. If as few as 20% of the pool users used these other forms of transportation, the parking requirements could drop by approximately 25. It should also be noted that for a number of the competitive swim groups, parents simply drop off their child and then return to pick them up. Having a drop-off/pick-up lane near the front entrance to the center will be essential. Programmatic Uses An aquatic center with the amenities noted above would be able to support a variety of aquatic activities and events including: Competition Pool The primary use of this pool would be to support a variety of competitive aquatic activities with a focus on high school use. However, this pool would also serve a wide range of public uses from programs to open swim. Competitive Uses: High School Swim Practice & Dual Meets High School Dive Practice & Dual Meets Page 57
60 BUILDING PROGRAM High School Water Polo Practice & Informal Meet USA Swimming Practice (potentially a small meet) USA Diving Practice (potentially a small meet) USA Water Polo Practice (match) USA Synchronized Swimming Practice Masters Swimming Practice (potentially a small meet) Public Programs & Recreation: Learn-to-Swim Program (youth & adult) Aqua Aerobics (shallow water & deep water) Diving Lessons Lifeguard Training Stroke Refinement (youth & adult) Adult/Youth Multi-Sport (triathlon) Open Swim (can be enhanced with inflatable play features) SCUBA Instruction Water sports kayaking, etc. Leisure Pool Leisure pools are often considered as being just an amenity for open swim and relaxation when in fact this body of water functions as a program pool as well. Competitive Uses: Warm-Up/Cool Down Lanes Public Programs & Recreation Open Swim Warm Water Lap/Warm-Up Swimming Learn-to-Swim Program (youth & adult) Aqua Aerobics Water Walking Therapy non medical Special Needs Program Relaxation Birthday Parties Page 58
61 BUILDING PROGRAM Why Two Pools? One of the questions that is frequently asked is why there is a need to have two separate bodies of water and won t a single tank serve both the needs of competitive activities and recreational swimming? There are a number of reasons that two pools are being recommended and why they are different in their size and configuration. Time Demands When an aquatic center is going to serve the needs of competitive activities for the high school as well as other community based groups, much of the prime time of the facility will be occupied by these groups, leaving little time for general public use. A second pool will provide time for a stronger focus on community programs and activities. Water Depth With a minimum depth in the competition pool of 6 feet (which is required for competitive swimming), it is simply too deep for many programmatic uses. This includes lower level learn to swim classes, aqua exercise classes, water walking and many open swim opportunities. Water Temperature Another primary issue is water temperature. For the competition pool the water temperature will be between 79 and 81 degrees. This is a great temperature for competition but way too cold for many programmatic uses where the water temperature is 86 to 88 degrees. This is especially true for younger children, seniors and any special needs populations. Revenue The reality is that generating sufficient revenue to offset most of the cost of operation of indoor aquatic facilities is always a challenge. Despite its strong use for competitive activities, the competitive pool does not traditionally generate a robust revenue stream, especially from use by the general public. On the other side, a leisure pool will draw from a much larger and more diverse market, commands a much higher fee value and increases not only open swim but also program use of the facility. The presence of the leisure pool will have a positive impact on overall revenues for the facility as a result. Location If the new natatorium were to be located within Curtis Park and adjacent to the existing Holmes Aquatic Center, some amenities would be shared between the two facilities making the whole complex a more enjoyable experience for the users and economically more sustainable than the two facilities would standing on their own. For example, a new main entrance would replace the existing Holmes entrance that is structurally unsound. The new entrance would be centrally located such to serve visitors to both the outdoor aquatic center and new indoor aquatic center. This reduces having control/ticket staff at two independent swim centers. The concessions would be shared between the outdoor and indoor aquatic centers. This would make the concessions more economically sustainable which could result in greater inventory of menu options. The new toilets Page 59
62 BUILDING PROGRAM would be centrally located within the aquatic complex eliminating the need to take small children near the deep end of the pool to go to the toilet. The new natatorium could also be positioned such that large overhead doors could be opened and the deck area of the outdoor pool would extend into the natatorium. This would provide much needed shade for users at the east end of the 50-meter pool and making the complex a more enjoyable experience for the users. The new indoor leisure pool would add a missing component to the existing Holmes Aquatic Center turning it into a true Family Aquatic Center. Site Requirements Since there is not a designated site for the proposed aquatic center, understanding the necessary land requirements for the building, parking and needed set-backs is important. Building The structure is estimated to be approximately 43,000 SF and will have to be built on a single level due to the two pools and the required support amenities. This will require approximately 1 acre to accommodate. Parking Figuring that approximately 120 parking stalls will be necessary to support the center, but not knowing if there will be surface, structured or a combination of such parking, an area of ¾ to as much as 1 acre will be needed. Set-Backs Realizing that the building will need to have some set-backs from any streets or other amenities, this could take up as much as ½ of an acre (depending on the site). As a result the aquatic center ideally needs a site of between 2.5 and 3 acres. This is the site size that is recommended, but due to the lack of available open land areas in the Primary Service Area, adapting the aquatic center to limited space will likely be required. Page 60
63 CAPITAL COST ESTIMATE Section IV Capital Cost Estimate The following is a preliminary capital cost estimate for the aquatic center based on the building program that has been determined. This cost estimate was developed by Water Technology, Inc. in consultation with Stantec, the School District architect. It should be noted that this cost estimate represents 2014 pricing and will need to escalate to reflect the actual anticipated date of construction. Since there is not a designated site for the facility, site costs contain only a general estimate for utilities. Once a site had been determined this aspect of the project cost estimate will need to be adjusted. The estimate also only has a cost provision for surface parking but based on the final location for the center, a parking structure (either above ground or below) may be necessary. This cost will then need to be added to the project estimate. It is also important to note that no cost has been shown for any possible site acquisition fees. At this point a 10% contingency has been shown to cover unforeseen costs. It must be recognized that a more definitive and exacting cost estimate will need to be completed once a site is determined for the center and a concept and site plan has been developed. This could impact the cost estimate noted below. Page 61
64 CAPITAL COST ESTIMATE ORDER OF MAGNITUDE PROJECT COSTS Aquatic Facility University Park Aquatics Center Water Technology Inc. Indoor Family Aquatic Center December 5, 2014 University Park, Texas Project Phase: Feasibility Study Div/Sec Description Units Quantity Unit Cost Cost Aquatics Indoor 25 yard Competition Pool Multipurpose Program Lap Pool (8 lane) SF $1,537, Competition Equipment LS $55, Moveable Bulkhead 5 feet EA $0.00 Diving 1 Meter EA $30, Timing and Scoreboard LS $55, Program equipment LS $18, Subtotal $1,695, Indoor Leisure Pool Multipurpose Program Leisure Pool SF $1,050, Spray Play Equipment LS $55, Interactive Play Structure LS $200, Water Slide LS $155, Subtotal $1,460, Aquatic Subtotal $3,155, Architectural Natatorium - Lobby, Deck, Change/Toilets, Offices, Concessions, Pool Mech., Storage, Utilities, N.I. Pools SF $10,451, Theme Development LS 0 0 $0.00 Subtotal $10,451, Order of Magnitude Cost Summary Subtotal: Pool components and general costs $13,606, Site Utilities Allowance 1 $400,000 $400,000 Surface Parking Each 120 $2,500 $300,000 Owner Furnished Items (deck furniture, safety equipment, floatables, etc. Allowance 0.3% $13,606,570 $34, Concessions Equipment (minimal heat & serve equip, NO grill or frying) Allowance 1 $75, $75, Project Fees & Permitting - (A&E, Permitting, Surveys, Geo-tech, Testing Allowance 7.0% $13,606,570 $952, Contingency 10.0% $13,606,570 $1,360, Construction Escalation Factor (Not included for 2014) Allowance 0.0% $13,606,570 $0.00 Site Acquisition LS 100.0% $0 $0.00 Total Project Cost $16,728, Page 62
65 BUSINESS PLAN Section V Business Plan The following business plan has been developed for the proposed University Park Aquatic Center. The following are the basic parameters for the business plan or later will be the first year of operation. This pro-forma estimate is based on a preliminary program plan (list and size of components in the facility) but without the benefit of a design concept for the facility. No designated site for the aquatic center has yet to be identified. The aquatic center will be operated by the City of University Park with use by the Highland Park School District for swim team and other programs at no cost. The facility will only be open to all residents of the Highland Park Independent School District and their guests. Revenue and use projections are predicated on the center accepting charge cards for all admissions and services as well as electronic funds transfer for annual passes. The facility will have an active marketing plan to sell annual passes to the center. The fees, use and revenue estimates are reasonably aggressive. Both pools will be guarded for any use including school use and rentals to swim teams etc. The competitive pool will continue to be utilized by other community based swim teams and groups on a rental basis. It is projected that the aquatic center could have varied hours of operation depending on the season of the year. Page 63
66 BUSINESS PLAN Division I - Expenditures Expenditures have been formulated based on the costs that are typically included in the operating budget for this type of facility. The figures are based on the size of the center, the specific components of the facility and the projected hours of operation. Actual costs were utilized wherever possible and estimates for other expenses were based on similar facilities in Texas. All expenses were calculated as accurately as possible but the actual costs may vary based on the design, operational philosophy, and programming considerations adopted by staff. Aquatic Center Description Competitive pool (25 yard x 25 meter) with seating for 300, leisure pool with slide and other elements, meet room/party room, weight room, student and public locker rooms and administration area Approximately 42,828 sq.ft. Operation Cost Model: Personnel Center Budget Full-Time $149,175 Part-Time $447,930 TOTAL $597,105 Commodities Center Budget Office Supplies (forms, paper, etc.) $4,000 Chemicals (pool/mechanical) $20,000 Maintenance/Repair/Materials $10,000 Janitor Supplies $10,000 Rec. Supplies $5,000 Uniforms $2,500 Printing/Postage $5,000 Pro Shop $2,000 Other $2,000 TOTAL $60,500 Page 64
67 BUSINESS PLAN Contractual Center Budget Utilities (elect.-gas) 8 $171,312 Water/Sewer $15,000 Insurance (property & liability) $20,000 Communications (phone) $2,000 Contract Services 9 $25,000 Rent Equipment $2,000 Advertising $3,000 Training (staff time) $3,000 Conference $500 Trash Pickup $3,000 Dues & Subscriptions $1,000 Bank Charges (charge cards, EFT) $20,000 Other $2,000 TOTAL $267,812 Capital Center Budget Replacement Fund $15,000 TOTAL $15,000 All Categories Center Budget Personnel $597,105 Commodities $60,500 Contractual $267,812 Capital $15,000 TOTAL EXPENSE $940,417 NOTE: Line items not included in this budget are exterior site maintenance and vehicle costs. 8 Rates include electric and natural gas and are based on $4.00 a square foot. It should be noted that rates for electric and gas has been very volatile and could result in a substantially higher cost for utilities over time. 9 Contract services cover maintenance contracts, control systems work, and contract labor. Page 65


68 BUSINESS PLAN Graphic Representation of Total Expenses: Total Expense - $940,417 $15,000 $60,500 $267,812 $597,105 Personnel Commodities Contractual Capital Page 66
69 BUSINESS PLAN Staffing Levels: Full-Time Positions Positions Total Aquatic Center Manager 1 $45,000 Aquatics Coordinator 1 $35,500 Maintenance Worker 1 $30,000 Salaries $110,500 Benefits (35%) $38,675 TOTAL 3 F.T.E. $149,175 Part-Time Positions Rate/Hour Hours/Week Front Desk Cashier $ Head Lifeguard $ Lifeguard $ Custodian/Maintenance $ Program Instructors 10 Aquatics Variable $57,045 General Variable $8,160 Salaries $407,209 Benefits (10%) $40,721 TOTAL $447,930 Note: Pay rates were determined based on wage scales for the City of University Park and the Holmes Aquatic Center. The positions listed are necessary to ensure adequate staffing for the center s operation. The wage scales for both the full-time and part-time staff positions reflect an anticipated wage for Program instructors are paid at several different pay rates and some are also paid per class or in other ways. This makes an hourly breakdown difficult. General programs consist of birthday parties and first aid. Aquatics includes learn to swim, aqua fitness and special classes. Page 67


70 BUSINESS PLAN Personnel Break-Out $15,000 $267,812 $60,500 $597,105 $149,175 $447,930 Commodities Contractual Capital Full-Time Part-Time Page 68
71 BUSINESS PLAN Division II - Revenues The following revenue projections were formulated from information on the specifics of the project and the demographics of the service area as well as comparing them to state and national statistics, other similar facilities and the competition for aquatic services in the area. Actual figures will vary based on the size and makeup of the components selected during final design, market stratification, philosophy of operation, fees and charges policy, and priorities of use. Revenue Projection Model: Fees Center Budget Admissions $58,500 Month to Month $209,736 Annuals 11 $100,250 Corporate/Group $10,000 Rentals 12 $72,740 TOTAL $451, Figures are based on an active program to promote the sale of annual passes. 12 Rentals are based on the following: Classroom/Party $50x 2/wk x 50 wks = $5,000 Competitive Pool Dallas Masters $36 (6 lanes) x 1hr x 5 days x 48 wks = $8,640 Dallas Mustangs $48 (8 lanes) x 3.25 hrs x 5 days x 48 wks = $37,440 Elite Swim Team $36 (6 lanes) x 1.25 hrs x 5 days x 48 wks = $10,800 Meets $70 x 6hrs x 8 meets = $3,360 Leisure Pool $150/hr x 1 hr/wk x 50 wks = $7,500 Page 69
72 BUSINESS PLAN Programs 13 Center Budget Aquatics $154,005 General $91,200 Contract Programs $1,000 TOTAL $246,205 Other Center Budget Pro-Shop $2,500 Special Events $2,000 Vending $5,000 TOTAL $9,500 All Categories Center Budget Fees $451,226 Programs $246,205 Other $9,500 TOTAL REVENUE $706, General programs consist of birthday parties and first aid. Aquatics includes learn to swim, aqua fitness and other programs. Page 70
73 BUSINESS PLAN Graphic Representation of Total Revenue Total Revenue - $706,931 $9,500 $246,205 $451,226 Fees Programs Other Page 71
74 BUSINESS PLAN Division III - Expenditure - Revenue Comparison Category Center Budget Expenditures $940,417 Revenues $706,931 Difference -$233,486 Recovery Rate 75% This operations pro-forma was completed based on the best information available and a basic understanding of the project. However, there is no guarantee that the expense and revenue projections outlined above will be met as there are many variables that affect such estimates that either cannot be accurately measured or are not consistent in their influence on the budgetary process. Future Years: Expenditure - Revenue Comparison: Expenses for the first year of operation of the center should be slightly lower than projected with the facility being under warranty and new. Revenue growth in the first three years is attributed to increased market penetration and in the remaining years to continued population growth. In most aquatic facilities the first three years show strong growth from increasing the market share of patrons who use such facilities, but at the end of this time period revenue growth begins to flatten out. Additional revenue growth is then spurred through increases in the population within the market area, a specific marketing plan to develop alternative markets, the addition of new amenities or by increasing user fees. Page 72
75 BUSINESS PLAN Division IV - Fees and Attendance Projected Fee Schedule: The fee schedule is based on only residents (and their guests) of the Highland Park Independent School District being able to use the center. Revenue projections and attendance numbers were calculated from this fee model. Category Daily Month to Month 14 Annual (Prepaid) Res Guest Resident Only Resident Only Adults $8.00 $9.00 $20 $200 Youth (3-17 yrs) $6.00 $7.00 $15 $150 Seniors (60+) $6.00 $7.00 $15 $150 Family 15 N/A N/A $45 $500 Rentals $50/hr Meet/Party room Competitive Pool $6.00/Lane/hr $70/hr Leisure Pool $150/hr pool (0-50 persons) $200/hr pool ( persons) $250/hr pool ( persons) Admission Rate Comparisons: The above rates were determined based on other public indoor aquatic facilities in the Dallas area. The proposed rates are generally higher than other rates for similar facilities but represent a fee for 2017 or later. 14 Month to Month requires an auto debit for a bank/charge account and a prepayment of 1 month. The monthly fee is automatically deducted on the 1 st of each month for the following month. 15 Includes 2 adults and up to four youth, each additional adult would be 50% of the stated rate and each additional youth would be 50% of the stated rate. Page 73
76 BUSINESS PLAN Attendance Projections: The following attendance projections are the basis for the revenue figures that were identified earlier in this report. The admission numbers are affected by the rates being charged, the facilities available for use and the competition within the service area. The figures are also based on the performance of other similar facilities in other areas of the country. These are averages only and the yearly figures are based on 360 days of operation. Yearly Paid Admissions Description Facility Daily 20 admissions/day 7,200 Month to Month 628/12 months sold annually 65,312 Annual sold annually 31,200 Total Yearly 103,712 Total Daily 288 NOTE: The 928 month to and annual passes are based on selling passes to approximately 8% of the households (11,609 projected in 2014) in the Highland Park Independent School District. NOTE: Attendance for other events, programs, and spectator functions is more difficult to predict but a best guess estimate is approximately 2.5 times the number of paid admissions. Indoor aquatic centers are traditionally the busiest from November to March and mid-june to mid-august and are slow from April to early June and again from mid-august to the end of October. Weekdays between the hours of 3pm and 7pm are the busiest times of the week and weekends are also very busy during the winter months. In contrast mid-morning and early afternoon on weekdays are usually slow as well as weekends during the summer months (especially Sundays). 16 Admissions for pass holders were figured based on 104 visits for annual passes per year. Family admissions are counted as one admission. Page 74
77 BUSINESS PLAN Hours of Operation: The projected hours of operation of the aquatic center are as follows: Days Hours Monday - Friday 5:00am 9:00pm Saturday 7:00am 8:00pm Sunday 10:00am 6:00pm Total Hours Per Week 101 Hours usually vary some with the season (longer hours in the winter, shorter during the summer), by programming needs, use patterns and special event considerations. Page 75
78 BUSINESS PLAN Division V - Project Recommendations The following section details specific recommendations for the University Park Aquatic Center project. Remarks are grouped by areas of interest. Programs and Facilities: The design, image and quality of an aquatic center has a direct impact on its ability to attract and keep customers. Thought should be given to the building layout as it pertains to crowd control and access, during the design phase of the project. A visible open design which highlights the different activity areas and encourages participation from the user as well as the non-user, is essential to generating community excitement and revenue. As much natural light as possible needs to be incorporated into the design while not compromising safety or the needs of competitive swimming, and promoting and maintaining energy efficiency in every way possible. The intent is to build a "smart building" that gives the City of University Park and the Highland Park Independent School District the most for their money and the user a sense of quality and value. Pool- The hottest trend in aquatics is the leisure pool concept. This idea of incorporating slides, current channels, fountains, zero depth entry and other water features into a pools design has proved to be extremely popular for the drop-in user. The age of the conventional pool in most recreational settings has greatly diminished. Leisure pools appeal to the younger kids (who are the largest segment of the population that swims) and to families. These types of facilities are able to attract and draw larger user numbers who stay longer to utilize such pools. This all translates into more use and revenue. Of note is the fact that patrons seem willing to pay a higher admission fee for the use of a leisure pool. The sale of annual passes and especially family annual passes is also tied to the appeal of the leisure pool. Programs- Special events and swim meets are an important aspect of any facility but they are difficult to base consistent revenue on. Beyond School District meets, they can be very disruptive to users and care must be taken to evaluate the benefits and problems caused by such activities. The revenues generated from these activities are not always worth the time and effort to put them together. The center should not be designed specifically to handle the once a year event or activity but should have the versatility to adapt to these needs within reason. Long term programming and facility needs of the community, businesses, and special interest groups should be identified and integrated into the operations plan for this facility. The success of indoor aquatic centers is dependent on developing a broad based appeal to the general public as well as servicing the needs of school swim teams and other organizations. The needs of youth, seniors, and families must be considered and their individual concerns and issues addressed. Programs that are intergenerational in nature and those that are specifically oriented towards certain population segments will both need to be developed. The needs of the business community must also be considered if this market is to be developed. Page 76
79 BUSINESS PLAN Consideration should be given to contracting for certain programs or services, especially those that are very specialized in nature. Any contracted programs or services should require a payment of a percentage of the fees collected (at least 30%) back to the center. Budget and Fees: The success of this project depends on a number of budget factors, which need special consideration. An operational philosophy must be developed and priorities for use must be clearly identified. The revenue figures contained in this document are based on the principal that the facility will have a balance between competitive swimming, drop in use and programmed activities. A goal of consistently covering 70%-75% of operational expenses with revenues should be attainable but there is virtually no possibility of recovering all operating expenses through facility revenues unless the Highland Park Independent School District is willing to share in some of the operational costs of the center. However, it must be realized that virtually all indoor aquatic centers that have been built in the last twenty years are not covering their operating expenses with revenues. Maximizing revenue production should be a primary goal. Care must be taken to make sure that a fees and charges policy is consistently followed. No form of revenue production should be given away. A policy should be developed that requires programs and activities which take place in the facility to cost back a percentage of their use in revenue to the building s operation. Capital replacement fund- A plan for funding a capital replacement program should be developed before the center opens. The American Public Works Association recommends between 2% and 4% of replacement cost be budgeted annually for capital items. Costs for maintenance and contract services should be lower than the amount budgeted for the first year since most equipment will still be under warranty. The amount that is shown for capital replacement in the budget will not be enough over the long term to fund needed improvements and repairs after the first 3 years. Fees- The revenue projections were based on the concept of City of University Park and Highland Park Independent School District use only (other than for rentals to swim teams). The proposed fee structure is aggressive and definitely at the high end compared to other facilities in the Dallas area. A senior discount fee schedule was developed for the center, but it should be considered as a marketing tool rather than a discount based on need. Another option is to offer a limited morning or daytime discount rate that would be available to anyone using the center during this slower period of the day. This would work much like a senior discount without having to label it as one. To promote the sale of month to month passes it is absolutely essential that a system be set up that allows for the automatic withdrawal from the pass holder s bank/credit card account of the monthly rate. Without this option it will be very difficult to meet the projected sales of passes. In addition, charge cards need to be accepted for all programs and services offered by the center. A Page 77
80 BUSINESS PLAN computerized registration process must also be introduced to speed registration transactions and improve annual pass management. Pre-selling month to month/annual passes Approximately 3 to 6 months before the center opens there must be a program in place to begin the pre-sale of charter passes with a savings incentive to promote sales. A goal should be to pre-sell between 25% and 50% of all budgeted passes prior to opening the center. Marketing plan- A marketing plan for the facility and its programs is essential. This document should target specific markets, programs, facilities and user groups. It needs to be an active document that is utilized by the facility manager to guide all marketing efforts. This plan should be updated yearly. Special emphasis must be placed on promoting the sale of annual passes to establish a strong revenue base. Staffing- Staffing costs are the biggest single operating expense and alternative options need to be investigated if costs are to be significantly reduced. The use of volunteers, trading facility use for labor and other similar ideas, deserve consideration as methods to reduce staffing budgets. The pay rates for both part-time and full-time personnel were determined based on the need to attract well-qualified employees and minimize staff turnover rates. It is important to budget for an adequate level of staffing in all areas. One of the biggest mistakes in operations comes from understaffing a center and then having to come back and ask for more help later. Maintenance staffing is of particular concern and is most often where cuts are made. Detailed job descriptions should be written for all staff and areas of responsibility need to be clearly defined. An adequate training fund is essential to a well-run center. An emphasis needs to be placed on the importance of safety, image and customer service in all training programs. The key to opening an aquatic center and have it operate smoothly is hiring the necessary staff well in advance and having them well organized, properly trained and comfortable with the building s features. They need to be ready to hit the ground running with policies and procedures in place, and a marketing and maintenance program under way. Partnership Agreement- If this project is to move forward there will need to be a formal IGA signed between the City of University Park and the Highland Park Independent School District regarding where the center will be built, capital cost responsibilities, long term capital improvements, ownership and operational responsibilities as well as specific priorities of use. Page 78
81 BUSINESS PLAN Division VI Business Plan Appendix Part-Time Staff Hours Program Revenue Projections Fee Revenue Projections Page 79
82 BUSINESS PLAN Part-Time Staff Hours: Front Desk Cashier (Fall/Winter/Spring-37 wks) Days Time Hours Employees Days Total Hours/Week Mon-Fri 4:30A-1:00P :00P-3:00P :00P-8:00P :00P-9:00P Saturday 7:00A-1:00P :00P-8:00P Sunday 10:00A-1:00P :00P-6:00P TOTAL 138 Front Desk Cashier (Summer/Holidays-15 weeks) Days Time Hours Employees Days Total Hours/Week Mon-Fri 5:00A-1:00P :00P-7:00P :00P-9:00P Saturday 7:00A-1:00P :00P-8:00P Sunday 10:00A-1:00P :00P-6:00P TOTAL 143 Custodian/Maintenance Days Time Hours Employees Days Total Hours/Week Mon-Fri 4:00A-7:00A :00P-11:00P Sat & Sun 6:00A-9:00A :00P-9:00P TOTAL 42 Page 80
83 BUSINESS PLAN Lifeguard Staffing Fall/Winter/Spring Season (37 wks) Days Time Hours Employees Days Total Hours/Week Mon-Fri 4:30A-9:00A :00A-1:00P :00P-3:00P :00P-8:00P :00P-9:00P Saturday 6:30A-9:00A :00A-1:00P :00P-8:00P Sunday 9:30A-1:00P :00P-6:00P TOTAL Summer Season (June, July, August & Holidays, 15 wks) Days Time Hours Employees Days Total Hours/Week Mon-Fri 4:30A-9:00A :00A-1:00P :00P-7:00P :00P-9:00P Saturday 6:30A-9:00A :00A-1:00P :00P-8:00P Sunday 9:30A-1:00P :00P-6:00P TOTAL Page 81
84 BUSINESS PLAN Head Lifeguard Staffing Fall/Winter/Spring Season (37 wks) Days Time Hours Employees Days Total Hours/Week Mon-Fri 3:00P-9:30P Saturday 1:00P-8:30P Sunday 1:00P-6:30P TOTAL 45.5 Summer Season (June, July, August & Holidays, 15 wks) Days Time Hours Employees Days Total Hours/Week Mon-Fri 1:00P-9:30P Saturday 1:00P-8:30P Sunday 1:00P-6:30P TOTAL 55.5 NOTE: This schedule is based on a guard rotation concept and on utilizing the Head Lifeguard in the rotation schedule (approximately 48 hrs. a week additional). Based on the pool's basic program, schedule and estimated use patterns, this level of lifeguard staffing will be necessary to ensure adequate protection for swimmers. This is an estimate of anticipated guard hours only and actual needs could vary depending on the pool design, actual use patterns, and hours of operation. Page 82
85 BUSINESS PLAN Aquatics Program Staffing Swim Lessons Season Staff Rate/Class Classes/Day Days Weeks Total Summer $ $9,900 Spring/Fall $ $3,960 Winter $ $1,980 TOTAL $15,840 Note: Classes are 45 minutes in length. Water Aerobics Season Staff Rate/Class Classes/Day Weeks Total Summer $ $5,250 Spring/Fall $ $9,750 Winter $ $3,600 TOTAL $18,600 Private Swim Lessons Lessons/Week Staff Rate/Lesson Weeks Total 15 $ $7,425 TOTAL $7,425 Lifeguard Training Staff Staff Rate/Class Hours/Class Sessions Total 1 $ $1,980 TOTAL $1,980 Page 83


86 BUSINESS PLAN Therapy Classes Staff Staff Rate/Class Classes/Week Weeks Total 1 $ $7,200 TOTAL $7,200 Miscellaneous Staff Staff Rate/Class Classes/Week Weeks Total 1 $ $6,000 TOTAL $6,000 Aquatic Program Staffing Category Swim Lessons $15,840 Water Aerobics $18,600 Private Swim Lessons $7,425 Lifeguard Training $1,980 Therapy Classes $7,200 Miscellaneous $6,000 TOTAL $57,045 Aquatic Program Summary $1,980 $7,200 $6,000 $15,840 Swim Lessons Water Aerobics $7,425 Private Swim Lessons $18,600 Lifeguard Training Therapy Classes Misc. Page 84
87 BUSINESS PLAN General Programs Birthday Parties Staff Staff Rate/Party Parties/Week Weeks Total 1 $ $6,000 TOTAL $6,000 Miscellaneous (CPR, First Aid, Clinics, etc.) Staff Staff Rate/Class Classes/Week Weeks Total 1 $ $2,160 TOTAL $2,160 General Programs Category Birthday Parties $6,000 Miscellaneous $2,160 TOTAL $8,160 General Program Summary $2,160 Birthday Parties $6,000 Misc. Page 85
88 BUSINESS PLAN NOTE: Some programs and classes could be on a contractual basis with the center, where the facility will take a percentage of the revenues charged and collected. These programs have not been shown in this budget as a result. Program Revenue Estimates: Aquatics This is a representative sample of possible aquatic programming and revenue at the center. Swim Lessons Title Classes Fee Sessions/ Weeks Total Revenue Summer 18 classes/4 per class $ sessions $36,000 Spring/Fall 12 classes/4 per class $ sessions $14,400 Winter 9 classes/4 per class $ sessions $7,200 Private Lessons 15 classes/wk $25.00/cl. 45 weeks $16,875 TOTAL $74,475 Water Aerobics Title Classes Fee Sessions/ Weeks Total Revenue Summer 15 classes/8 per class $10.00/cl. 14 weeks $16,800 Spring/Fall 12 classes/8 per class $10.00/cl. 26 weeks $24,960 Winter 12 classes/8 per class $10.00/cl. 12 weeks $11,520 TOTAL $53,280 Page 86
89 BUSINESS PLAN Other Title Classes Fee Sessions/ Total Weeks Revenue Lifeguard Training 1 class/10 per class $ sessions $6,750 Therapy 6 classes/5 per class $10.00/cl. 40 weeks $12,000 Misc. 3 classes/5 per class $10.00/cl. 50 weeks $7,500 TOTAL $26,250 Aquatics Program Revenue $154,005 General This is a representative sample of possible general programming and revenue at the center. Title Classes Fee Sessions/ Total Weeks Revenue Birthday Parties 8 per week $200/pty. 52 weeks $83,200 Misc. 4 classes/5 per class $100.00/sess. 4 sessions $8,000 TOTAL $91,200 Total General Program Revenue $91,200 Page 87
90 BUSINESS PLAN Fee Revenue Projections Worksheet: Daily Category Fee # Per Day Revenue Days Total Adult $ $40 Youth $ $60 Senior $ $30 TOTAL 20 $ $46,800 Guests 25% of users x $1.00 fee increase $11,700 GRAND TOTAL $58,500 Month to Month Pass Category Fee # Sold Months Revenue Adult $ $48,000 Youth $ $5,040 Senior $ $18,000 Family $ $162,000 TOTAL 628 $233,040 Projected Loss 10% of fees $23,304 GRAND TOTAL $209,736 Annual Pass Category Fee # Sold Revenue Adult $ $18,000 Youth $ $2,250 Senior $ $7,500 Family $ $72,500 TOTAL 300 GRAND TOTAL $100,250 Page 88


91 BUSINESS PLAN Revenue Summary Pass & Daily Admission Revenue - $368,486 $100,250 $58,500 Daily Month to Month $209,736 Annual Passes NOTE: This work sheet was used to project possible revenue sources and amounts. These figures are estimates only, based on basic market information and should not be considered as guaranteed absolutes. This information should be utilized as a representative revenue scenario only and to provide possible revenue target ranges. Page 89
John H. Furbee Aquatics Center Operations Study
 Final Report John H. Furbee Aquatics Center Operations Study Ken Ballard Ballard*King & Associates 2743 E Ravenhill Cir. Highlands Ranch, CO 80126 (303) 470-8661 ken@ballardking.com March 6, 2013 Table
University Park, Texas
 City of University Park, Texas Feasibility Study to Assess the Viability of Developing Shared Indoor Pool/Aquatic Facility Final Report January 7, 2015 2743 Ravenhill Circle, Highlands Ranch, CO 80126
Athletic Field Use & Demand Analysis Study
 Athletic Field Use & Demand Analysis Study Final Report October 13, 2014 2743 Ravenhill Circle * Highlands Ranch, CO 80126 * 303.470.3014 * www.ballardking.com * bka@ballardking.com Table of Contents Section
Aquatic Facility Needs Assessment Study
 Aquatic Facility Needs Assessment Study Final Report September 5, 2012 In association with: Ken Ballard -President Darin Barr - Senior Associate BallardKing & Associates, Ltd. 2743 E. Ravenhill Circle
Aquatic Facility Feasibility Study Falmouth, MA. Presented By: James Preisig: Falmouth Aquatics Kevin Post: Counsilman-Hunsaker
 Aquatic Facility Feasibility Study Falmouth, MA Presented By: James Preisig: Falmouth Aquatics Kevin Post: Counsilman-Hunsaker Agenda 1. Introduction to Falmouth Aquatics 2. Counsilman-Hunsaker Process
COMMUNITY AQUATIC FACILITY
 COMMUNITY AQUATIC FACILITY Brunswick, Maine Feasibility Study Prepared for: Town of Brunswick Parks & Recreation Department Prepared by: Bargmann Hendrie + Archetype, Inc. Boston, MA December 16, 2016
SPORTS PARTICIPATION IN THE UNITED STATES 2016 EDITION
 A STATISTICAL STUDY OF SPORTS PARTICIPATION FOR 55 SPORTS / RECREATIONAL ACTIVITIES SPORTS PARTICIPATION IN THE UNITED STATES 2016 EDITION ISSN: 0882-8210 Prepared for the NATIONAL SPORTING GOODS ASSOCIATION
Paddlesports Kayaking Canoeing. A Partnership Project of:
 A Special Report on Paddlesports 2009 Kayaking Canoeing Rafting A Partnership Project of: PADDLESPORTS Paddlesports Paddlesports offer some of the most diverse outdoor experiences of any nature-based activity
CITY COUNCIL AGENDA REPORT
 CITY COUNCIL AGENDA REPORT Subject: GROSVENOR POOL REPORT Recommendation(s) 1. That the Grosvenor Outdoor Pool Report Part 2, 2015, provided as Attachment 1 to the Grosvenor Pool Report agenda report dated
LAKE BLUFF PARK DISTRICT BLAIR PARK SWIMMING POOL Questions and Answers OVERVIEW
 LAKE BLUFF PARK DISTRICT BLAIR PARK SWIMMING POOL Questions and Answers www.lakebluffparks.org OVERVIEW Q: How did the community rate the pool on the Community Wide survey? A: The top three highest rated
Honey Lake Valley Recreation Authority Pool Community Workshop Presentation
 PREVIOUS WORK UNDERTAKEN BY HLVRA Phase I 19 sites were explored and scored for viability Phase II 3 finalists emerged 800 South Street Site Credence School Site* Mesa Street Site March 2014 Aquatic Design
Q1 In your household, who would come to the Long Bridge Aquatics & Fitness Center?
 Q1 In your household, who would come to the Long Bridge Aquatics & Fitness Center? Answered: 983 Skipped: 34 Youth and adults Adults only Only adults who are over 55 0% 10% 20% 30% 40% 50% 60% 70% 80%
Understanding YOUR GROWTH Demographics
 Understanding YOUR GROWTH Demographics Outline 1. Bowling Demographic Snapshot 2. Youth Bowlers 3. Adult Bowling Segments 4. Local-Center Demographics Bowling Demographic Snapshot Bowler Overview 2009
Bethel School District Aquatic Center Study. April 30, 2014
 Bethel School District Aquatic Center Study Prepared By The Sports Management Group April 30, 2014 Bethel School District Aquatic Center Study Prepared For The Bethel School District By The Sports Management
Memo. Pat Hogan, USA Swimming Club Development Managing Director NEW MEMBERSHIP CATEGORY RECOMMENDATIONS
 Memo To: From: 2017 USA Swimming House of Delegates Pat Hogan, USA Swimming Club Development Managing Director RE: NEW MEMBERSHIP CATEGORY RECOMMENDATIONS Date: August 28, 2017 At the 2017 USAS Convention
Big Sky Recreation Center Big Sky Event Center
 Big Sky Recreation Center Big Sky Event Center Feasibility Study Update The Isaac Sports Group And USAquatics March 13, 2014 AQUATICS Family Aquatic Center 84 to 86 degrees Zero Depth entry Maximum Depth
Town of Carbondale John M. Fleet Municipal Pool
 Town of Carbondale John M. Fleet Municipal Pool History Master Plans Survey Data Present Pool Funding RSUT Budget Actuals- 2014-2017 Budget FY 2018 Pool admittance numbers comparison 2015-2017 Cost Recovery
City of Placerville M E M O R A N D U M. Steven M. Youel, Director of Community Services
 City of Placerville M E M O R A N D U M DATE: February 27, 2007 TO: FROM: SUBJECT: City Council Steven M. Youel, Director of Community Services RECOMMENDATION That the City Council adopt a resolution establishing
CITY OF MERRIAM PARKS AND RECREATION FACILITIES MASTER PLAN
 CITY OF MERRIAM PARKS AND RECREATION FACILITIES MASTER PLAN Process Site analysis and facility assessments Programs and services assessments Financial analysis Levels of service standards Where are We
Q1 What is your name?
 Q1 What is your name? Answered: 2,135 Skipped: 194 1 / 40 Q2 What is your age? Answered: 2,329 Skipped: 0 15-19 20-29 30-39 40-49 50-59 60-69 70-79 80+ ANSWER CHOICES 15-19 20-29 30-39 40-49 50-59 60-69
WHERE ARE ARIZONA DEMOGRAPHICS TAKING US? HOW GROWING SLOWER, OLDER AND MORE DIVERSE AFFECTS REAL ESTATE
 WHERE ARE ARIZONA DEMOGRAPHICS TAKING US? HOW GROWING SLOWER, OLDER AND MORE DIVERSE AFFECTS REAL ESTATE March 2017 Tom Rex Office of the University Economist and Center for Competitiveness and Prosperity
Manatee County Parks & Natural Resources. John H. Marble Community Pool Revitalization & Marketing Plan Summer 2014
 Manatee County Parks & Natural Resources John H. Marble Community Pool Revitalization & Marketing Plan Summer 2014 Submitted March 2014 Manatee County Parks & Natural Resources John H. Marble Community
A Comparison for Ames, Iowa
 A Comparison for Ames, Iowa Overview Comparative analysis not concept planning Costs based on defined pool types and sizes Costs indexed to 2017 Pool examples shown Pool Types Considered Option 1 --- competition
Golfers in Colorado: The Role of Golf in Recreational and Tourism Lifestyles and Expenditures
 Golfers in Colorado: The Role of Golf in Recreational and Tourism Lifestyles and Expenditures by Josh Wilson, Phil Watson, Dawn Thilmany and Steve Davies Graduate Research Assistants, Associate Professor
102 E. Michigan, Urbana Green/Grey/Bronze Questions: Register: Closure Dates Closed all day - No public activities
 Well-trained Guards Zero-depth Pool equipped with water geysers, dinosaur slide and rain drop umbrella toy Drop & Flume Slides Competition Pool 1-Meter Diving Board Locker Rooms Party Room Follow us on
MANITOBA'S ABORIGINAL COMMUNITY: A 2001 TO 2026 POPULATION & DEMOGRAPHIC PROFILE
 MANITOBA'S ABORIGINAL COMMUNITY: A 2001 TO 2026 POPULATION & DEMOGRAPHIC PROFILE MBS 2005-4 JULY 2005 TABLE OF CONTENTS I. Executive Summary 3 II. Introduction.. 9 PAGE III. IV. Projected Aboriginal Identity
February Funded by NIEHS Grant #P50ES RAND Center for Population Health and Health Disparities
 Urban Use and Physical Activity Deborah Cohen, Thom McKenzie, Amber Sehgal, Stephanie Williamson, Daniela Golinelli, Multi-Cultural Area Health Education Center (MAHEC) Funded by NIEHS Grant #P50ES012383
Title VI Fare Change Equity Analysis
 Title VI Fare Change Equity Analysis Evaluation Report Submitted to Dallas Area Rapid Transit Submitted by TranSystems June 2012 Title VI Fare Change Equity Analysis Introduction DART has proposed a schedule
APPENDIX 2 PROPOSAL FOR REPLACEMENT FOR POOLE (DOLPHIN) LEISURE CENTRE FINAL SPECIFICATION
 LEISURE CENTRE FINAL SPECIFICATION") APPENDIX 2 PROPOSAL FOR REPLACEMENT FOR POOLE (DOLPHIN) LEISURE CENTRE FINAL SPECIFICATION 1 PURPOSE 1.1 To provide the following information and supporting evidence for the Member decision (reference
APPENDIX 2 PROPOSAL FOR REPLACEMENT FOR POOLE (DOLPHIN) LEISURE CENTRE FINAL SPECIFICATION 1 PURPOSE 1.1 To provide the following information and supporting evidence for the Member decision (reference
Today s Agenda. Health Benefits of Team Sports
 Webinar, October, 21 Today s Agenda Team Sports Participation Trends Gender and Venues Filling the Team Sports Participation Funnel PE and Team Sports Participation The Leaky Bucket Health Benefits of
TRENDS SEPTEMBER
 2 Chapter 2 TRENDS In order to keep pace with the demands of a growing population, the City of Chanhassen needs to consider how the dynamic nature of technologies, trends, cultures, and activities will
JOHN RHODES COMMUNITY CENTRE POOL A
 JOHN RHODES COMMUNITY CENTRE POOL A INTO THE BLUE On hot early June day, as Kate Smith stared out at the John Rhodes pool through her office window she wondered: Where do we go from here? Kate, Aquatic
Paddlesports. Kayaking Canoeing Rafting Stand up paddling. A Partnership Project of:
 2014 Special Report on Paddlesports Kayaking Canoeing Rafting Stand up paddling A Partnership Project of: PADDLESPORTS Paddlesports A record number of Americans enjoyed paddlesports in 2013. Whether kayaking
Summary of Athletic Field Analysis Findings
 Summary of Athletic Field Analysis Findings Baseball/softball 1: Mercer Island city has one of the highest ratios (0.46) of baseball/softball fields per 1,000 residents compared with other municipal jurisdictions
Mary Wayte Pool. Questions? Please call (206) iba. Fall 2017 August 27th December 31st, 2017 Recreational Swim and Swim Lesson Schedule
 iba. Fall 2017 August 27th December 31st, 2017 Recreational Swim and Swim Lesson Schedule") Mary Wayte Pool Questions? Please call (206) 588-1117 iba Fall 2017 August 27th December 31st, 2017 Recreational Swim and Swim Lesson Schedule Mary Wayte Pool 8815 SE 40th Mercer Island, WA 98040 (206)
Mary Wayte Pool Questions? Please call (206) 588-1117 iba Fall 2017 August 27th December 31st, 2017 Recreational Swim and Swim Lesson Schedule Mary Wayte Pool 8815 SE 40th Mercer Island, WA 98040 (206)
Fishing License Renewals and Angler Lifestyles 2015 Angler Participation Research Summary Report
 Fishing License Renewals and Angler Lifestyles 2015 Angler Participation Research Summary Report Released March 2016 Final Report Background Produced for the American Sportfishing Association by Southwick
2017 SPECIAL REPORT ON FISHING
 2017 SPECIAL REPORT ON FISHING A partnership project of: CONTENTS Executive Summary.... 1 Fishing.... 3 Freshwater Fishing.... 17 Saltwater Fishing.... 22 Fly Fishing.... 27 Youth.... 32 Hispanics....
The 2001 Economic Benefits of Hunting, Fishing and Wildlife Watching in MISSOURI. Prepared by:
 The 2001 Economic Benefits of Hunting, Fishing and Wildlife Watching in MISSOURI Prepared by: Southwick Associates, Inc. PO Box 6435 Fernandina Beach, FL 32035 Ph (904) 277-9765 Fax (904) 261-1145 Email:
Mary Wayte Pool. Questions? Please call (206) iba. Summer 2015 June 21st August 7th, 2015 Recreational Swim and Swim Lesson Schedule
 iba. Summer 2015 June 21st August 7th, 2015 Recreational Swim and Swim Lesson Schedule") Mary Wayte Pool Questions? Please call (206) 588-1117 iba Summer 2015 Recreational Swim and Swim Lesson Schedule Mary Wayte Pool 8815 SE 40th Mercer Island, WA 98040 (206) 588-1117 www.mercerislandpool.com
Mary Wayte Pool Questions? Please call (206) 588-1117 iba Summer 2015 Recreational Swim and Swim Lesson Schedule Mary Wayte Pool 8815 SE 40th Mercer Island, WA 98040 (206) 588-1117 www.mercerislandpool.com
The Future of Quarterpath Pool. October 8, 2012
 The Future of Quarterpath Pool October 8, 2012 The Big Questions Primary Purpose: Swimming lessons or recreation? What can Williamsburg do that others can t or that differentiates us? Pool Open: How do
CONTENTS. The consultant team for this study included: 292 Design Group Ballard*King and Associates RJM Construc!on Reengineered
 Family Aquatic Center Study Brooklyn Park, Minnesota May 23, 2018 DRAFT CONTENTS Statement of Purpose & Scope of Work Execuve Summary ES1 Process 1 Demographic & Market Analysis 2 Concept Opons Overview
Texas Housing Markets: Metropolitan vs. Border Communities. September 22, 2014
 Texas Housing Markets: Metropolitan vs. Border Communities Luis Bernardo Torres Ruiz, Ph.D. Research Economist El Paso Branch Dallas Federal Rio Grande Economic Association September 22, 2014 Contents
Business and Marketing Plan Overview
 Business and Marketing Plan Overview GL Sports Entertainment 813.484.2842 curt@glsportsentertainment.com OVERVIEW: The Pasco County full-service multisport complex will be Florida's premier year-round
Briefing Paper #1. An Overview of Regional Demand and Mode Share
 2011 Metro Vancouver Regional Trip Diary Survey Briefing Paper #1 An Overview of Regional Demand and Mode Share Introduction The 2011 Metro Vancouver Regional Trip Diary Survey is the latest survey conducted
Joint Plan for Orderly Annexation of Gainesville s Urban Reserve Area
 Legislative File #: 080404 ORDERLY ANNEXATION TEAM Joint Plan for Orderly Annexation of Gainesville s Urban Reserve Area September 29 th, 2008 ORDERLY ANNEXATION TEAM Presentation Overview I. Background
1999 On-Board Sacramento Regional Transit District Survey
 SACOG-00-009 1999 On-Board Sacramento Regional Transit District Survey June 2000 Sacramento Area Council of Governments 1999 On-Board Sacramento Regional Transit District Survey June 2000 Table of Contents
KINDERSLEY AQUATICS CENTRE Town of Kindersley. Public Consultation #2 July
 KINDERSLEY AQUATICS CENTRE Town of Kindersley Public Consultation #2 July 7 2015 Agenda Introduction Summary of Consultation #1 Site Review 3 Options Team Exercise Costs Team Exercise Next Steps Process
Fred Endert Municipal Swimming Pool 10-Year Operations Master Plan Crescent City, CA
 Fred Endert Municipal Swimming Pool 10-Year Operations Master Plan Crescent City, CA Completed by: Counsilman-Hunsaker Contact: George Deines 2425 N. Central Expressway Suite 359 Richardson, TX 75080 972-370-3741
More of the Same; Or now for Something Completely Different?
 More of the Same; Or now for Something Completely Different? C2ER Place cover image here Richard Wobbekind Chief Economist and Associate Dean for Business and Government Relations June 14, 2017 Real GDP
QUEEN ELIZABETH SCHOOL PARK AND GLENGARRY PARK USAGE SURVEY RESULTS Integrated Strategic Development- Citizen Services- City of Edmonton
 QUEEN ELIZABETH SCHOOL PARK AND GLENGARRY PARK USAGE SURVEY RESULTS 2016 Integrated Strategic Development- Citizen Services- City of Edmonton Introduction Background and Objectives District Parks are busy,
John W. Black Aquatic Center
 John W. Black Aquatic Center 1551 N. Hwy 393 ~ LaGrange, KY 40031 ~ 502-225-0656 www.oldhamcountyky.gov > Parks and Recreation Parks & Rec. Summer 2018 ~ SATURDAY, MAY 26 th - SEPTEMBER 7 th Our Rules
CYCLING & MOUNTAIN BIKING FINDINGS FROM THE 2013/14 ACTIVE NEW ZEALAND SURVEY. Sport & Active Recreation Profile ACTIVE NEW ZEALAND SURVEY SERIES
 ACTIVE NEW ZEALAND SURVEY SERIES Te Rangahau Korikori o Aotearoa Sport & Active Recreation Profile CYCLING & MOUNTAIN BIKING FINDINGS FROM THE 2013/14 ACTIVE NEW ZEALAND SURVEY www.sportnz.org.nz Introduction
SPECIAL REPORT ON FISHING AND BOATING. A partnership. project of:
 A partnership project of: SPECIAL REPORT ON FISHING AND BOATING 2013 CONTENTS Executive Summary.... 1 Fishing.... 3 Freshwater Fishing.... 17 Saltwater Fishing.... 21 Fly Fishing.... 25 Youth, A Focused
BASKETBALL. Sport & Active Recreation Profile FINDINGS FROM THE 2013/14 ACTIVE NEW ZEALAND SURVEY ACTIVE NEW ZEALAND SURVEY SERIES.
 ACTIVE NEW ZEALAND SURVEY SERIES Te Rangahau Korikori o Aotearoa Sport & Active Recreation Profile BASKETBALL FINDINGS FROM THE 2013/14 ACTIVE NEW ZEALAND SURVEY www.sportnz.org.nz Introduction Content
FINAL REPORT December 2015
 ALTERNATIVE GOLF EXPERIENCES FINAL REPORT December 2015 BACKGROUND There are a wide variety of golf-related experiences that are off-shoots of the traditional game. Their one common thread is that their
Diversity & Inclusion 9
 Diversity & Inclusion 9 Diversity and inclusion (D&I) is a top strategic priority for the USTA. As such, the USTA created four subcommittees for the four major target demographic areas African-American,
Mary Wayte Pool. Questions? Please call (206) iba. Fall 2014 September 2nd December 31st, 2014 Recreational Swim and Swim Lesson Schedule
 iba. Fall 2014 September 2nd December 31st, 2014 Recreational Swim and Swim Lesson Schedule") Mary Wayte Pool Questions? Please call (206) 588-1117 iba Fall 2014 September 2nd December 31st, 2014 Recreational Swim and Swim Lesson Schedule Mary Wayte Pool 8815 SE 40th Mercer Island, WA 98040 (206)
Mary Wayte Pool Questions? Please call (206) 588-1117 iba Fall 2014 September 2nd December 31st, 2014 Recreational Swim and Swim Lesson Schedule Mary Wayte Pool 8815 SE 40th Mercer Island, WA 98040 (206)
Public Swim Hours Regular Hours (Jan 3-end of USD116 school year) Lap Swim Hours Regular Hours (Jan 3-end of USD116
 Lap Swim Hours Regular Hours (Jan 3-end of USD116") Well-trained Guards Zero-depth Pool Drop & Flume Slides Competition Pool 1-Meter Diving Board Locker Rooms Party Rooms Water Exercise Follow us on Twitter! @UrbanaIndoorAC 102 E. Michigan, Urbana Questions:
Well-trained Guards Zero-depth Pool Drop & Flume Slides Competition Pool 1-Meter Diving Board Locker Rooms Party Rooms Water Exercise Follow us on Twitter! @UrbanaIndoorAC 102 E. Michigan, Urbana Questions:
North Liberty, Iowa. Aquatic Master Plan
 North Liberty, Iowa Aquatic Master Plan November 2016 North Liberty, Iowa Aquatic Master Plan Table of Contents Introduction 3 Executive Summary 3 Aquatic History 6 The Traditional Pool 6 The Trend in
The North Shore Transportation Improvement Strategy and Western Richmond Terrace 1 : The Forgotten Corridor
 Elm Park Civic Association Island Voice Do Me A Faber The North Shore Transportation Improvement Strategy and Western Richmond Terrace 1 : The Forgotten Corridor Introduction Richmond Terrace is the northernmost
Final Report, October 19, Socioeconomic characteristics of reef users
 Socioeconomic Study of Reefs in Southeast Florida - Executive Summary By Hazen and Sawyer in association with Florida State University and National Oceanic and Atmospheric Administration, October 19, 2001
Programs Guide spring summer. full of Fun & Fitness
 Youth Programs Guide 2014 spring summer A year full of Fun & Fitness ATHLETIC DEVELOPMENT IGNITE! Combining fitness, sports, movement training and games, IGNITE! helps children improve their movement patterns,
U.S. Bicycling Participation Study
 U.S. Bicycling Participation Study Report of findings from the 2016 survey Conducted by Corona Insights Commissioned by PeopleForBikes Released July 2017 Table of Contents Background and Objectives 3 Research
Mary Wayte Pool. Questions? Please call (206) iba. Winter 2019 January 2nd, 2019 April 7th, 2019 Recreational Swim and Swim Lesson Schedule
 iba. Winter 2019 January 2nd, 2019 April 7th, 2019 Recreational Swim and Swim Lesson Schedule") Mary Wayte Pool Questions? Please call (206) 588-1117 iba Winter 2019 January 2nd, 2019 April 7th, 2019 Recreational Swim and Swim Lesson Schedule Mary Wayte Pool 8815 SE 40th Mercer Island, WA 98040 (206)
Mary Wayte Pool Questions? Please call (206) 588-1117 iba Winter 2019 January 2nd, 2019 April 7th, 2019 Recreational Swim and Swim Lesson Schedule Mary Wayte Pool 8815 SE 40th Mercer Island, WA 98040 (206)
The 2006 Economic Benefits of Hunting, Fishing and Wildlife Watching in TEXAS. Prepared by:
 The 2006 Economic Benefits of Hunting, Fishing and Wildlife Watching in TEXAS Prepared by: Southwick Associates, Inc. P.O. Box 6435 Fernandina Beach, FL 32035 Ph (904) 277-9765 Fax (904) 261-1145 Email:
Pleasant Valley Aquatic Center
 Pleasant Valley Aquatic Center Schedule & Fees January - March 2018 1030 Temple Avenue, Camarillo (805) 482-1996 / 987-8198 www.pvrpd.org SCHEDULE Lap Swimming Morning Lap M-F 5:30-8am Morning Lap* Sa
Public Meeting #1 Minutes Job No March 06, 2018
 Gig Harbor Sports Complex Bruce Dees & Associates Public Meeting #1 Minutes Job No. 173-02-01 March 06, 2018 PURPOSE The purpose of this meeting was to receive public input on the preliminary program for
Bike Share Social Equity and Inclusion Target Neighborhoods
 Bike Share Social Equity and Inclusion Target Neighborhoods Target Neighborhoods West End/Visitation Park/Academy/Hamilton Heights Wellsgoodfellow/Kingsway West The Ville/Greater Ville Kingsway East/Fountain
Population & Demographics
 Population & Demographics Conditions and Trends When looking at trends in the total number of people living in Windham (population) and at the characteristics of the people who live here by factors such
 Page 1 of 16 Screening Questions 1. How are you going to report your Operating Expenses (i.e Game Day expenses)? By Team Per participant 2. Select the type of Sports at your institution Men's Only Both
Transfer Composition of Division I Teams July 2018
 Transfer Composition of Division I Teams July 201 Summary The percentage of women who transferred into a Division I school from another four-year college (6.73%) has edged above the percentage of 4-4 transfers
MAKE FRIENDS HAVE FUN AND PARTY. Downtown YMCA Party Rentals
 MAKE FRIENDS HAVE FUN AND PARTY Downtown YMCA Party Rentals INDEX CAMP RENTAL...3 FENCING PARTY...4 FIELD TRIP...5 GAME ROOM PARTY...6 GROUP ACTIVITIES...7 GYMNASTICS PARTY...8 MEETING ROOMS...9 SWIM BIRTHDAY
Surfing Tourism Destination Feasibility Study, Kincardine, Ontario
 Surfing Tourism Destination Feasibility Study, Kincardine, Ontario Prepared for: Regional Tourism Organization 7 and the February 24, 2014 EXECUTIVE SUMMARY With support from the Regional Tourism Organization
COOPERATIVE EXTENSION Bringing the University to You
 COOPERATIVE EXTENSION Bringing the University to You Special Publication - 06-16 ECONOMIC IMPACT OF TOURISM ON COLORADO RIVER COMMUNITIES INCLUDING: LAUGHLIN BULLHEAD CITY FORT MOHAVE MOHAVE VALLEY GOLDEN
WAUPUN FAMILY AQUATIC CENTER
 FAMILY AQUATIC CENTER Summer 2018 June 2 nd - August 26 th LOCATED IN FOND DU LAC COUNTY PARK The Waupun Family Aquatic Center features zero depth entry, two water slides, a kiddie slide, water spouts
City of Novi Non-Motorized Master Plan 2011 Executive Summary
 City of Novi Non-Motorized Master Plan 2011 Executive Summary Prepared by: February 28, 2011 Why Plan? Encouraging healthy, active lifestyles through pathway and sidewalk connectivity has been a focus
Travel and Rider Characteristics for Metrobus
 Travel and Rider Characteristics for Metrobus 040829040.15 Travel and Rider Characteristics for Metrobus: 2012-2015 Overview The Miami Dade County Metropolitan Planning Organization (MPO) conducted a series
2016 Capital Bikeshare Member Survey Report
 2016 Capital Bikeshare Member Survey Report Prepared by: LDA Consulting Washington, DC 20015 (202) 548-0205 February 24, 2017 EXECUTIVE SUMMARY Overview This report presents the results of the November
Oakmont: Who are we?
 Oakmont: Who are we? A Snapshot of our community from the April 2010 US Census Contents Age and Gender... 1 Marital Status... 2 Home Ownership and Tenure... 3 Past Demographic Characteristics... 5 Income
KINDERSLEY AQUATICS CENTRE DESIGN Town of Kindersley. Public Consultation #1 May
 KINDERSLEY AQUATICS CENTRE DESIGN Town of Kindersley Public Consultation #1 May 19 2015 Agenda Introduction Project Goals Past Needs Assessment Indoor vs Outdoor Operational Costs Change Rooms Brief Review
ECONOMIC DEVELOPMENT ELEMENT
 ECONOMIC DEVELOPMENT ELEMENT Background The Economic Development Element considers labor force and labor force characteristics, employment by place of work and residence, and analysis of the community
Florida Atlantic University Athletic Workshop BOT Athletics Sub-Committee March 19, 2008
 BOT Athletics Sub-Committee March 19, 2008 1 FAU ATHLETIC DEPARTMENT 18 Intercollegiate Division I Sports Men: (8) Women: (10) Football (I-A) Volleyball Basketball Basketball Soccer Soccer Cross Country
Saturday 3/17 9am Saturday 4/7 9am Saturday 3/24 9am Saturday 4/28 9am
 Pleasant Valley Aquatic Center Schedule & Fees April - May, 2018 1030 Temple Avenue, Camarillo 482-1996 / 987-8198 www.pvrpd.org Lap Swimming Morning Lap M-F 5:30-8:30am Morning Lap* Sa 5:30-11:30am Afternoon
Have your say. Aquatic AND Leisure Facility. Aquatic AND Leisure Facility ON THE NEW. Information Booklet
 Have your say Aquatic AND Leisure Facility ON THE NEW Aquatic AND Leisure Facility Information Booklet It s time to upgrade our aquatic and leisure facilities to meet your needs now, and into the future.
Maryland-National Capital Parks and Planning Commission (M-NCPPC)
") Maryland-National Capital Parks and Planning Commission (M-NCPPC) Southern Area Aquatic / Recreation Community Center (SAARC) Complex Feasibility Study June 26 th AGENDA BACKGROUND PUBLIC INPUT AND DATA
Maryland-National Capital Parks and Planning Commission (M-NCPPC) Southern Area Aquatic / Recreation Community Center (SAARC) Complex Feasibility Study June 26 th AGENDA BACKGROUND PUBLIC INPUT AND DATA
Aquatic Concepts. July 23, 2018
 Aquatic Concepts July 23, 2018 DESIGN DIRECTION Lazy River Zero Depth Entry Water slides at least one for 48 + and one for little kids Spray features Indoor lap lanes Outdoor lap lanes that can accommodate
Jackson R. Lehman Family YMCA
 Program Name Session Name Age Range Day Time Member Program Participant Bible Study Cooking Classes Dance Classes Dive-In Movie Middle School Programs New Member Receptions Parents Night Out Special Events
MEETING Agenda. Introductions. Project Overview. Key Study Components. Alternative Station Concepts. Preferred Station Concept. Next Steps.
 City GARLAND Council ROADVISION Briefing STUDY VISION STUDY Dallas, TX April 8, 2010 1 1 MEETING Agenda Introductions Project Overview Key Study Components Alternative Station Concepts Preferred Station
SAMPLE REPORT SUPPLEMENTAL REPORT
 SAMPLE REPORT SUPPLEMENTAL REPORT Handgun Consumers: An In-Depth Exploration Supplement to the Consumer Segmentation Analysis on the Commercial Firearms & Accessories Market 2017 Southwick Associates,
Côte Saint-Luc Aquatics Guide
 Côte Saint-Luc Aquatics Guide SUMMER 2015 514-485-6806 CoteSaintLuc.org Aquatic Facilities Aquatic and Community Centre Pools The Aquatic and Community Centre has two swimming pools. The Recreation Pool
2016 Capital Bikeshare Member Survey Report
 2016 Capital Bikeshare Member Survey Report Prepared by: LDA Consulting Washington, DC 20015 (202) 548-0205 February 24, 2017 EXECUTIVE SUMMARY Overview This report presents the results of the November
Wenlin Liu, Senior Economist. Stateof Wyoming. Economic Analysis Division State of Wyoming 1
 WYOMING DEMOGRAPHIC AND ECONOMIC TREND LCCC LIFE Program April 7, 2012 Cheyenne, Wyoming Wenlin Liu, Senior Economist Economic Analysis Division Stateof Wyoming Economic Analysis Division State of Wyoming
AQUATIC SERVICES & INFRASTRUCTURE STRATEGY ( )
") AQUATIC SERVICES & INFRASTRUCTURE STRATEGY (2015 2040) CONTENTS Introduction 3 Background 3 Executive Summary 5 Framework for Planning Aquatic Services 7 Existing Aquatic Infrastructure and Use 11 Goals
AQUATIC SERVICES & INFRASTRUCTURE STRATEGY (2015 2040) CONTENTS Introduction 3 Background 3 Executive Summary 5 Framework for Planning Aquatic Services 7 Existing Aquatic Infrastructure and Use 11 Goals
Pleasant Valley Aquatic Center
 Pleasant Valley Aquatic Center Schedule & Fees 1030 Temple Avenue, Camarillo 482-1996 / 987-8198 www.pvrpd.org Lap Swim Morning Lap M-Sa 5:30-7:30am Lunch Time Lap M/W/F/Sa 11:15am-12:45pm Evening Lap
Sport & Active Recreation Profile JOGGING & RUNNING FINDINGS FROM THE 2013/14 ACTIVE NEW ZEALAND SURVEY ACTIVE NEW ZEALAND SURVEY SERIES
 ACTIVE NEW ZEALAND SURVEY SERIES Te Rangahau Korikori o Aotearoa Sport & Active Recreation Profile JOGGING & RUNNING FINDINGS FROM THE 2013/14 ACTIVE NEW ZEALAND SURVEY www.sportnz.org.nz Introduction
2015 Swim Guide. City of Rifle. Art Dague Pool and Waterslide 1718 Railroad Avenue Rifle, CO in-season off-season
 City of Rifle Season Dates: May 23, 2015- September 7, 2015 2015 Swim Guide Contents Fees and Descriptions p. 2-5 Training Opportunities p. 6-7 Swim Lesson Descriptions p. 8-9 Swim Lesson Schedules p.
Walkable Retail: When Old Becomes New Again Part 1
 Walkable Retail: When Old Becomes New Again Part 1 By Erin Talkington, Vice President, and Jacob Ross, Associate You have probably read the following headline thousands of times, perhaps this year alone:
Newton Recreation Commission Annual Report 2017 / 2018
 Newton Recreation Commission Annual Report 2017 / 2018 Superintendent s Message The enclosed report will detail the 2017/2018 year in review for the Newton Recreation Commission. This report will include
Rochester Area Bike Sharing Program Study
 roc bike share Rochester Area Bike Sharing Program Study Executive Summary ~ January 2015 JANUARY 2015 8484 Georgia Avenue, Suite 800 Silver Spring, MD 20910 3495 Winton Pl., Bldg E, Suite 110 Rochester,
User Characteristics and Use Trends Since the 1990s on Paved State Bicycle Trails
 User Characteristics and Use Trends Since the 1990s on Paved State Bicycle Trails State paved bicycle trails (segments studied are mapped) Paul Bunyan segment near Bemidji Heartland Paul Bunyan Gitchi-Gami