Walkability. The Pathway to Atlanta s Future Growth April 19, 2017
|
|
|
- Derek Perry
- 5 years ago
- Views:
Transcription


1 Walkability The Pathway to Atlanta s Future Growth April 19,
2 Walkability The Pathway to Atlanta s Future Growth This report was prepared by the ULI Atlanta s Livable Communities Council Working Group on Walk-UPS in October Marc Pollack, Chair Ken Bleakly Sharon Gay Bob Hughes Noel Khalil Ray Kimsey Cheri Morris Malaika Rivers John Sibley Matt Smith Jim Stokes Scott Selig Monte Wilson Research by Geoff Koski 2
3 Panelists Moderator: Jonathan Gelber, AICP, Senior Consultant, Bleakly Advisory Group Panelists: Ken Bleakly, AICP, President, Bleakly Advisory Group Terry Morris, President, Morris & Fellows Real Estate Services Brantley Day, AICP, Director of Community Development, City of Woodstock 3
4 ULI Atlanta is a district council of the national Urban Land Institute. ULI is a non-profit education and resource group supported by a diverse membership base of experts. Their mission is to provide leadership in the responsible use of land and in creating and sustaining thriving communities worldwide. ULI Atlanta 800+ members, One of the largest and most active district worldwide ULI. Offering 20 high-quality educational programs a year Technical Advisory Panels stocked with expert members who advise local communities. 4
5 LIVABLE COMMUNITIES COALITION Originally established in 2005 by Metro Atlanta Chamber, moved to ULI in Spin-off of the Metro Atlanta Chamber s Quality Growth Task Force, 50 diverse from local governments, the state legislature, businesses, developers, universities, and civic and environmental groups. LCC has worked to support greater density, walkability, housing choices and mixed-use developments in appropriate regional and transportation centers. LCC is focused on TOD and walkable communities. The Livable Communities Council's (LCC) mission Improve metro Atlanta s quality of life through smart growth Focus on Transit Oriented Development (TOD) and walkable communities. Play an explicit role in advising on development around existing and future transit Make tangible impacts on land use. 5
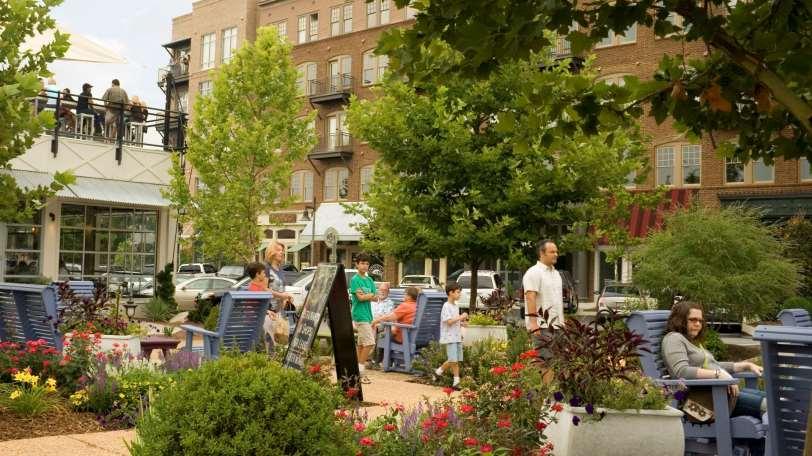
6 Walkability: The Planner s Perspective 6
7 Walkability: The Other Perspectives Developers Property Owners Commercial Tenants Brokers Loan Officers Bankers The people who control most of the land. The people who control most of the money. 7
8 + = 8

9 What is Walkability? Jeff Speck, in Walkable City, defines four principles of Walkablilty: Useful most aspects of daily life are located close at hand and organized in a way that walking serves them well Safe means that the street has been designed to give pedestrians and bicyclists a fighting chance... they must not only be safe but feel safe Comfortable buildings and landscape shape urban streets into outdoor living rooms in contrast to wide open spaces Interesting sidewalks are lined by unique buildings with friendly faces and signs of humanity abound. These ideas are simple in concept but challenging in execution. The true potential of walkability is only achieved by getting all four principles working in unison. 9

10 Why is Walkablity important? It seems like planning jargon, but it is far more significant: Walkability is a development pattern that is already redefining our downtowns, town centers, and commercial districts 10

11 Why is Walkablity important? Walkability capitalizes on dramatic demographic Capitalizes and generational dramatic demographic changes and generational changes; 11

12 Why is Walkablity important? Walkability provides lifestyle and health benefits to its participants 12

13 Why is Walkablity important? Walkability generates the higher rents and development values that off-set higher development costs 13

14 Why is Walkablity important? Walkability accelerates growth in local government revenues 14

15 Why is Walkablity important? Walkability creates efficiencies in providing local services. 15

16 Walkability has become the Dominant Development Pattern In 2012 Christopher Leinberger, a analyzed the presence of Walkable Urban Places or WalkUPs From , 14% of all development in metro Atlanta was in WalkUPs to 2008: just 26% 2009 to 2013 : 60% of all development in metro Atlanta was in WalkUPs. 16
 comprises 1/3 of the population, as national birth rates continue to exceed those for Gen X.")
17 Age 60+ Age Age 0-29 Younger Generations will Continue to Drive Demand Demographics = Destiny Long-term future real estate demand from younger generations will continue The youngest generation (Age 0-25) comprises 1/3 of the population, as national birth rates continue to exceed those for Gen X. Atlanta is unique in that Gen X has an outsized influence here due to 1990s and 2000s inmigration. Current Population by Age USA & Atlanta Metro Region Kids - Late Millennials First Millennials - Gen X Boomers ATL USA ATL USA ATL USA Atlanta USA 0% 5% 10% 15% 20% 25% 30% 35% 40% 45% 50% Source: US Census, American Community Survey 17

18 Nationwide: 70% place a high value on walkability when choosing a new community 61% would accept a smaller home in exchange for a shorter commute. 54% of Americans prefer three or more community attributes associated with compact development Source: America in 2013: A ULI Survey 18
19 24% 23% 27% 34% Generational Preferences for Compact Communities Millennials (Gen Y) and Baby Boomers state higher preference for living in a compact, walkable community. Compact Community Attributes: Shorter commute/smaller home Close to mix of shops Mix of incomes Public transportation options Mix of homes 40% 35% 30% 25% 20% 15% 10% 5% 0% Preference for compact community attributes Gen Y (18-34) Gen X (35-47) Baby boomers (48-66) Silent generation (67+) Source: America in 2013: A ULI Survey 19

20 Atlanta s TOD Supply Atlanta s Supply of Transit-Oriented Development lags National Peers Fewer households near Transit Less density around transit Atlanta likely undersupplied by 12,500-58,000 TOD Households Equivalent to 300 1,400 40/Ac Metro Area % of HH near Transit Avg HHs per Station Area Washington DC 10.6% 5,561 San Francisco 8.6 % 3,371 Atlanta 6.9% 1,388 Based on data from the Center for Neighborhood Technology 20

21 Built Environment Impacts Lifestyle The lack of walkable supply suppresses demonstrated demand, but not LATENT demand. Less of walkable infrastructure Less housing within walkable infrastructure. Less access to transit 40.0% 35.0% 30.0% 25.0% 20.0% 15.0% 10.0% 5.0% % Walk, Bike, Transit to Work, by Age Cohort Non-car transport is far less prevalent in Atlanta (shown in orange) than in peer cities. 0.0% USA Atlanta Boston DC Source: US Census, 2012 American Community Survey 1-Year Estimates Metro Area MSA Data 21

22 Do the Math: The Walkability Premium Pricing for office, retail, for-sale and rental housing are up to 50% higher in walkable locations in Atlanta than non-walkable locations. The Atlanta Region has 3.4 Billion SF of Real estate. 22
23 $ / Sq. Foot Monthly Rent Do the Math: The Walkability Premium The Walkability Premium in Atlanta In 2013 Bleakly collected data on 35 newer apartment projects in the Central Perimeter, Brookhaven, Buckhead, North Midtown areas Very walkable locations, with most errands able to be accomplished on foot, achieve 6% higher rents on a Square foot average to those comparable projects in car dependent and somewhat walkable locations. Similar research in Gwinnett and DeKalb showed a premium of 15% to 50%. $1.44 $1.43 $1.42 $1.41 $1.40 $1.39 $1.38 $1.37 Comparable Monthly Rents $/SF, by Walkability Car Dependent/Somewhat Walkable Very Walkable Walk Score: Walk Score: Source: Bleakly Advisory Group 23


24 Do the Math: The Walkability Premium Apartment Rent Premium Compared to Local Market Average Emory Point TOWN: Brookhaven Perimeter Place 182% 157% 133% Source: Bleakly Advisory Group,
 = Much higher overall values, property values, & tax revenue.")
25 Do the Math: The Walkability Premium 2 units to the acre Higher unit values (demand-driven) x Higher densities (demand-driven) = Much higher overall values, property values, & tax revenue. 4 units to the acre 25


26 Do the Math: Property Value Comparison Case 1: Emory Point & Post Briarcliff 26

27 Do the Math: Property Value Comparison Higher- Density Vertical Mixed Use Emory Point 7.73 Acres 443 Apartments Ground-Level Retail Suburban- Density Horizontal Multi Use Briarcliff Acres 888 Apartments Starbucks & Whole Foods 27


28 Do the Math: Property Value Comparison Higher- Density Vertical Mixed Use Emory Point Taxable Value: $104,776,800 $13,554,567/Acre 2015 Taxes /Acre $246,187 Suburban- Density Horizontal Multi Use Briarcliff Taxable Value: $92,611,490 $5,150,806/Acre 2015 Taxes Acre: $94,520 28


29 Do the Math: Property Value Comparison Case 2: Downtown Woodstock & The Outlet Shoppes at Atlanta 29
30 Do the Math: Property Value Comparison Walkable Downtown District Downtown Woodstock Acres 150 Parcels 3.4 Acre Park Commercial District Outlet Center The Outlet Shoppes at Atlanta Acres 370,000 SF 1,781 Parking Spaces 30


31 Do the Math: Property Value Comparison Walkable Downtown District Downtown Woodstock Taxable Value: $23,627,960 $1,460,409/Acre Property tax/acre: $31,000 Outlet Center The Outlet Shoppes at Atlanta Taxable Value: $13,381,648 $274,158/Acre Property tax/acre $6,000 31

32 Walkability: How does your community rank? 32
33 Thank You & Contact Info Moderator: Jonathan Gelber, AICP, Senior Consultant, Bleakly Advisory Group Panelists: Ken Bleakly, AICP, President, Bleakly Advisory Group Terry Morris, President, Morris & Fellows Real Estate Services Brantley Day, AICP, Director of Community Development, City of Woodstock 33
Planning for Economic and Fiscal Health
 Planning for Economic and Fiscal Health Christopher Zimmerman Vice President for Economic Development Cheyenne, Wyoming April 21, 2015 2 Planning for Economic and Fiscal Health The pattern of development
Community & Transportation Preferences Survey
 Community & Transportation Preferences Survey Webinar: August 5, 2015 Hugh Morris, AICP, LEED Realtor.org Jennifer Dill, Ph.D. trec.pdx.edu 1 Introduction National Association of Realtors Over 1,000,000
Future of Housing Trends and the Housing Market Demographic Waves in the Region and Future of Housing. Illinois Finance Forum January 25, 2019
 Future of Housing Trends and the Housing Market Demographic Waves in the Region and Future of Housing Illinois Finance Forum January 25, 2019 Millions OUR STATE S POPULATION 2000-2017 13.0 12.4 M 12.9
National Community and Transportation Preferences Survey. September 2017
 National Community and Transportation Preferences Survey September Executive Summary - Overview The Community and Transportation Preferences Survey echoes many of the major findings from the previous surveys.
NC Demographic Trends Through 2035
 NC Demographic Trends Through 2035 House Select Committee on Strategic Transportation Planning and Long Term Funding Solutions February 22, 2016 Rebecca Tippett, University of North Carolina July 1 Population
State of the Housing Market in our Region: Sacramento. ULI Sacramento. August 24,
 State of the Housing Market in our Region: Sacramento ULI Sacramento August 24, 2018 www.thegregorygroup.com 1 Building Permits (Six County Sacramento Region) 25,000 22,500 20,000 17,500 15,000 12,500
The Brookings Institution Metropolitan Policy Program
 The Brookings Institution Metropolitan Policy Program The Structural Shift in Building The Built Environment The Next American Dream for the 21 st Century Economy The Brookings Institution Metropolitan
Ranking Walkable Urbanism in America s Largest Metros
 Ranking Walkable Urbanism in America s Largest Metros The Largest 30 Metros in the United States SHARE OF U.S. POPULATION SHARE OF U.S. GDP 54% 46% 42% 58% LARGEST 30 METROS REST OF U.S. The Old Dichotomy
DALLAS MIDTOWN REDEVELOPMENT PLAN FOCUS NORTH TEXAS Peer Chacko, AICP, Assistant Director, City of Dallas
 DALLAS MIDTOWN REDEVELOPMENT PLAN FOCUS NORTH TEXAS 2014 Peer Chacko, AICP, Assistant Director, City of Dallas Dallas Midtown: Strategic growth area Future transit node 2 Peterson Road Study Area Galleria
Capital and Strategic Planning Committee. Item III - B. April 12, WMATA s Transit-Oriented Development Objectives
 Capital and Strategic Planning Committee Item III - B April 12, 2018 WMATA s Transit-Oriented Development Objectives Page 24 of 76 Washington Metropolitan Area Transit Authority Board Action/Information
Complete Streets 101: The Basics
 Complete Streets 101: The Basics Michigan Municipal League - Capital Conference March 21, 2017 Chip Smith, AICP - Senior Planner - Wade Trim Inc. and City Council member City of Ann Arbor 2017 MML Capital
Spring Time for Housing
 Spring Time for Housing Arizona State University December 2 nd, 2015 Presented By: Elliott D. Pollack CEO, IN PHOENIX 1 2 The World has Changed Pre-2007 Post-2007 3 Employment Growth From Bottom of Recession
University of Michigan & Urban Land Institute Real Estate Forum. Mary Beth Graebert Michigan State University
 University of Michigan & Urban Land Institute Real Estate Forum Mary Beth Graebert Michigan State University November 20, 2013 Michigan State University Land Policy Institute Strong focus on research and
I-20 East Transit Initiative. Stakeholder Advisory Committee Meeting September 9, :00-6:00 PM
 I-20 East Transit Initiative Stakeholder Advisory Committee Meeting September 9, 2010 4:00-6:00 PM Meeting Agenda Introductions Project Background Study Overview Role of the SAC Initial Study Findings
Community Improvement Plans: Creating walkable and liveable communities that support local business
 Community Improvement Plans: Creating walkable and liveable communities that support local business Kate Hall Program Manager ~ WALK Friendly Ontario Canada Walks, Green Communities Canada khall@greencommunitiescanada.org
Transit-Driven Complete Streets
 Questions: Type questions into the box at bottom of webinar panel. Panelists for today s webinar: Nimotalai Azeez, Program Associate with the National Complete Streets Coalition Rich Weaver, Director of
NC Demographic Trends Through 2035
 NC Demographic Trends Through 2035 Joint Appropriation Committee on Transportation February 21, 2017 Rebecca Tippett, PhD Director, Carolina Demography July 1 Population (Millions) North Carolina s Total
Community & Transportation Preferences Survey U.S. Metro Areas, 2015 July 23, 2015
 Community & Transportation Preferences Survey U.S. Metro Areas, 2015 July 23, 2015 Realtor.org trec.pdx.edu 1 Highlights: Generation gaps in everyday travel Only 71% of Millennials like driving (the lowest
Walkable Retail: When Old Becomes New Again Part 1
 Walkable Retail: When Old Becomes New Again Part 1 By Erin Talkington, Vice President, and Jacob Ross, Associate You have probably read the following headline thousands of times, perhaps this year alone:
Smart Growth, Climate Change and Prosperity Steve Winkelman Chuck Kooshian
 Smart Growth, Climate Change and Prosperity Steve Winkelman Chuck Kooshian Asilomar Transportation & Energy Conference August 31, 2011 CCAP put the third leg of the stool on the policy map. Reducing VMT
Location Matters: Where America Is Moving
 Location Matters: Where America Is Moving Nearly half of all American households plan to move at some point in the future. While some will move for a larger or nicer home, or perhaps to purchase a home
KEYS TO GREAT PLACES
 KEYS TO GREAT PLACES A Changing America Demographics are destiny: changing, shrinking households 1960: 44% of US Households were Married Couples with Children A Changing America Demographics are destiny:
Demographic Change in North Carolina
 Demographic Change in North Carolina 5 Trends to Watch North Carolina Aggregates Association June 29, 2017 Rebecca Tippett, PhD Director, Carolina Demography July 1 Population (Millions) North Carolina
Changing Commuting Patterns and Impacts on Planning & Infrastructure. William E. Frawley, AICP Texas A&M Transportation Institute October 3, 2013
 Changing Commuting Patterns and Impacts on Planning & Infrastructure William E. Frawley, AICP Texas A&M Transportation Institute October 3, 2013 Change is Constant... Various studies and data sources 1960
Balboa Area Transportation Demand Management
 Balboa Area Transportation Demand Management April 2016 Presented by: Jeff Tumlin What Are We Aiming For? Transportation is not an end in itself. It is merely a means by which we support the community.
Existing Pedestrian Conditions. PSAC February 8, 2011
 Existing Pedestrian Conditions PSAC February 8, 2011 Contents 1. Project Background & Goals 2. Pedestrian Activity: Where people walk 3. Pedestrian Safety: The conditions people face Project Background
Introduction. Mode Choice and Urban Form. The Transportation Planner s Approach. The problem
 Introduction The table below shows transit s share in the urban US (all trip purposes) and the 10 urban areas where it is most popular (2008 data): Mode Choice and Urban Form Philip A. Viton April 4, 2014
WHERE ARE ARIZONA DEMOGRAPHICS TAKING US? HOW GROWING SLOWER, OLDER AND MORE DIVERSE AFFECTS REAL ESTATE
 WHERE ARE ARIZONA DEMOGRAPHICS TAKING US? HOW GROWING SLOWER, OLDER AND MORE DIVERSE AFFECTS REAL ESTATE March 2017 Tom Rex Office of the University Economist and Center for Competitiveness and Prosperity
Walkable Urbanism Impacts on Quality of Life Improvement
 Walkable Urbanism Impacts on Quality of Life Improvement Case Study: Knowledge and Innovation Community, Shanghai, China Adha Viala Urban Health Games Content } Research motivation and topic } Research
Pedestrian Activity Criteria. PSAC March 8, 2011
 Pedestrian Activity Criteria PSAC March 8, 2011 Contents 1. Project Overview a) Revised schedule of PSAC hearings 2. Pedestrian Activity: Where walking is important a) Existing conditions (revisions based
BUILDING HEALTHY AND CULTURALLY VIBRANT COMMUNITIES
 BUILDING HEALTHY AND CULTURALLY VIBRANT COMMUNITIES Housing Opportunity 2017 September 11, 2017 New Orleans, LA # 1 Building Healthy & Culturally Vibrant Communities Monday, September 11 4:15 to 5:30 pm
Active Community Design: Why Here? Why Now?
 Active Community Design: Why Here? Why Now? Chris Holm Development Review Coordinator 20 April, 2015 Sacramento, California Our environment has changed North Natomas We ve rapidly urbanize our open space
Walkable Cities. A Presentation by Michalis Lambrinos Ministry of Transport, Communications and Works
 Walkable Cities A Presentation by Michalis Lambrinos Ministry of Transport, Communications and Works Contents What Makes a City Walkable Why is Walkability Important The Theory of Walkability Restrict
good walking is good business making massachusetts more walkable
 good walking is good business making massachusetts more walkable Nothing draws a crowd like a crowd. P.T. Barnum 15 minutes with WalkBoston who we are / what we do why walkability makes economic sense
BUILDING THE CASE FOR TRAVEL OPTIONS IN WASHING TON COUNTY. Image: Steve Morgan. Image: Steve Morgan
 BUILDING THE CASE FOR TRAVEL OPTIONS IN WASHING TON COUNTY Image: Steve Morgan Image: Steve Morgan Image: TriMet Image: TriMet WHAT ARE TRAVEL OPTIONS PROGRAMS? Travel options programs encourage residents,
Planning for Economic and Fiscal Health
 Planning for Economic and Fiscal Health Christopher Zimmerman Vice President for Economic Development Cheyenne, Wyoming April 22, 2015 2 Planning for Economic and Fiscal Health The pattern of development
7 NE 145TH STREET STATION TOD POTENTIAL
 7 NE 145TH STREET STATION TOD POTENTIAL Key Findings The 145th Street Station area has limited TOD potential, primarily because of its location in an area that is currently zoned predominantly single-family
Prioritizing Transportation Policy and Funding for Active Transportation, Safety, Equity and Health
 Mayor Karl Dean, Chairman Prioritizing Transportation Policy and Funding for Active Transportation, Safety, Equity and Health Leslie A. Meehan, AICP Planning and Implementing the Active Community Webinar
Presentation Summary Why Use GIS for Ped Planning? What Tools are Most Useful? How Can They be Applied? Pedestrian GIS Tools What are they good for?
 1 2 Pedestrian GIS Tools What are they good for? Pro Walk / Pro Bike 2006 Presentation Summary Why Use GIS for Ped Planning? What Tools are Most Useful? How Can They be Applied? Matt Haynes Fehr & Peers
Urban planners have invested a lot of energy in the idea of transit-oriented
 DOES TRANSIT-ORIENTED DEVELOPMENT NEED THE TRANSIT? D A N I E L G. C H AT M A N Urban planners have invested a lot of energy in the idea of transit-oriented developments (TODs). Developing dense housing
OLDER PEDESTRIANS AT RISK
 OLDER PEDESTRIANS AT RISK A TEN-YEAR SURVEY AND A LOOK AHEAD August 0 The population of older adults is growing in the U.S. and in the tri-state region. According to AARP, one in three Americans is now
NASHUA REGIONAL PLANNING COMMISSION REGIONAL BICYCLE AND PEDESTRIAN PLAN
 NASHUA REGIONAL PLANNING COMMISSION REGIONAL BICYCLE AND PEDESTRIAN PLAN June, 2005 Prepared by the Nashua Regional Planning Commission 2005 NRPC Regional Bicycle and Pedestrian Plan- JUNE 2005 ACKNOWLEDGEMENTS
San Mateo County Comprehensive Bicycle and Pedestrian Plan Open House
 San Mateo County Comprehensive Bicycle and Pedestrian Plan Open House October 28, 2010 Presented to San Mateo County residents and interested parties by Lauren Ledbetter, Alta Planning + Design Matt Haynes,
To Shape or Serve: Transit & Land Use Forum Tina M. Votaw, Charlotte Area Transit System (CATS)
") To Shape or Serve: Transit & Land Use Forum Tina M. Votaw, Charlotte Area Transit System (CATS) What s the Strategy? Balanced Approach: Invest in both Streets and Transit First to shape, i.e. manage growth
To Shape or Serve: Transit & Land Use Forum Tina M. Votaw, Charlotte Area Transit System (CATS) What s the Strategy? Balanced Approach: Invest in both Streets and Transit First to shape, i.e. manage growth
National Association of REALTORS National Smart Growth Frequencies
 September 520, 2017 3,000 Weighted Online Respondents National Association of REALTORS National Smart Growth Frequencies Q.2 The first question is about the quality of life in your community. How satisfied
Catalyst for Change:
 Catalyst for Change: Toronto Examples Linking Health and Transportation Presented at Walk 21 Conference Vancouver 2011 Monica Campbell, Director Healthy Public Policy Toronto Public Health 1 About Toronto
INNER LOOP EAST. AIA Rochester Annual Meeting November 13, 2013 TRANSFORMATION PROJECT. Bret Garwood, NBD Erik Frisch, DES
 INNER LOOP EAST TRANSFORMATION PROJECT AIA Rochester Annual Meeting November 13, 2013 Bret Garwood, NBD Erik Frisch, DES Why? We are building a city that encourages walking, biking and enjoying the outdoor
About the Active Transportation Alliance
 About the Active Transportation Alliance Chicagoland s voice for better biking, walking and transit Founded 1985 7,000 members, ~33 full time staff Serve Chicago metro region 1 More Cars, More Driving
News Release. Millennials Favor Walkable Communities, Says New NAR Poll MEDIA COMMUNICATIONS
 News Release MEDIA COMMUNICATIONS For further information contact: Jane Dollinger, 202/383-1042 jdollinger@realtors.org Millennials Favor Walkable Communities, Says New NAR Poll WASHINGTON (July 28, 2015)
TOD COVER. Header. Lessons Learned. Results of FTA s Listening Sessions With Developers, Bankers, and Transit Agencies on Transit Oriented Development
 Header COVER TOD T R A N S I T O R I E N T E D D E V E L O P M E N T Lessons Learned Results of FTA s Listening Sessions With Developers, Bankers, and Transit Agencies on Transit Oriented Development U.S.
Wine Barrels, Straw Wattle, and Elbow Grease: Playing Around with Monterey Road Joshuah Mello, AICP Senior Associate
 Wine Barrels, Straw Wattle, and Elbow Grease: Playing Around with Monterey Road Joshuah Mello, AICP Senior Associate Context Downtown Morgan Hill Timeline of Project 1. Funding must be used! 2. Complete
Detroit Metromode. From Suburban To Urban RELATED IMAGES KIM NORTH SHINE THURSDAY, DECEMBER 01, 2011 CHRISTOPHER B. LEINBERGER
 Detroit Metromode From Suburban To Urban KIM NORTH SHINE THURSDAY, DECEMBER 01, 2011 RELATED IMAGES CHRISTOPHER B. LEINBERGER ENLARGE ENLARGE ENLARGE ENLARGE RELATED TAGS DEVELOPMENT, DOWNTOWN DEVELOPMENT,GOVERNMENT,
THE 2010 MSP REGION TRAVEL BEHAVIOR INVENTORY (TBI) REPORT HOME INTERVIEW SURVEY. A Summary of Resident Travel in the Twin Cities Region
 REPORT HOME INTERVIEW SURVEY. A Summary of Resident Travel in the Twin Cities Region") THE 2010 MSP REGION TRAVEL BEHAVIOR INVENTORY (TBI) REPORT HOME INTERVIEW SURVEY A Summary of Resident Travel in the Twin Cities Region October 2013 WHAT IS THE TBI? The Travel Behavior Inventory (TBI)
THE 2010 MSP REGION TRAVEL BEHAVIOR INVENTORY (TBI) REPORT HOME INTERVIEW SURVEY A Summary of Resident Travel in the Twin Cities Region October 2013 WHAT IS THE TBI? The Travel Behavior Inventory (TBI)
San Jose Transportation Policy
 San Jose Transportation Policy Protected Intersections in LOS Policies to Support Smart Growth Presented by: Manuel Pineda City of San Jose Department of Transportation Bay Area Map San Francisco Oakland
Y O R K R O A D. Baltimore, Maryland. ULI Technical Assistance Panel June 18 & 19, York Road Technical Assistance Panel
 Y O R K R O A D Baltimore, Maryland ULI Technical Assistance Panel June 18 & 19, 2013 The York Road TAP Team ULI York Road TAP Chairperson Addison Palmer, STV Incorporated Technical Assistance Panelists
Approaches. Livable Neighborhood Design. Examples. Traditional neighborhood development. CE 594 University of Wisconsin- Milwaukee
 Approaches Livable Neighborhood Design CE 594 University of Wisconsin- Milwaukee Traditional neighborhood design (TND), new urbanism, transit friendly design, transit oriented development and walkable
Will 2016 Be the Last Hurrah for Commercial Real Estate? Presented By: John Chang First Vice-President Marcus & Millichap Research Services
 Will 2016 Be the Last Hurrah for Commercial Real Estate? Presented By: John Chang First Vice-President Marcus & Millichap Research Services Rising Uncertainty Creating Headwinds for Commercial Real Estate
The Impact of Placemaking Attributes on Home Prices in the Midwest United States
 The Impact of Placemaking Attributes on Home Prices in the Midwest United States 2 0 1 3 C O N S T R U C T E D E N V I R O N M E N T C O N F E R E N C E M A R Y B E T H G R A E B E R T M I C H I G A N
Expansion of Bike Share within San Jose supports the City's ambitious mode shift goals to have 15% of commute trips completed by bicycles by 2040.
 COUNCIL AGENDA: 12/01/15 ITEM: 4 CITY OF SAN JOSE CAPITAL OF SILICON VALLEY TO: HONORABLE MAYOR AND CITY COUNCIL SUBJECT: BAY AREA BIKE SHARE EXPANSION Memorandum FROM: Jim Ortbal DATE: Approved Date irftt/ls'
18% CAP* OFFICE INVESTMENT - NEAR SUNTRUST PARK
 18% CAP* OFFICE INVESTMENT - NEAR SUNTRUST PARK 1900 LELAND DRIVE MARIETTA, GA 30067 Jeff Hammond, MPA Principle 210.889.6819 jhammond@svn.com Del Creviston, CCIM Managing Director 770.992.5112 del.creviston@svn.com
1. Slide Summary: This course covers methods and best practices used by professional planners, engineers, and consultants/researchers This course
 1 1. Slide Summary: This course covers methods and best practices used by professional planners, engineers, and consultants/researchers This course does not focus on advocacy; rather, it introduces current
San Mateo County Comprehensive Bicycle and Pedestrian Plan
 San Mateo County Comprehensive Bicycle and Pedestrian Plan August 26, 2010 Presented to the San Mateo County BPAC by Lauren Ledbetter, Alta Planning + Design in association with: Fehr & Peers Eisen Letunic
FACTS AND FIGURES: MAKING THE CASE FOR COMPLETE STREETS IN LEE COUNTY
 FACTS AND FIGURES: MAKING THE CASE FOR COMPLETE STREETS IN LEE COUNTY Safety: Close to 5,000 pedestrians and bicyclists die each year on U.S. roads, and more than 70,000 are injured. [Mean Streets, Surface
WELCOME EXERCISE. Share your thoughts on the study area by: Placing a GREEN DOT on areas you like or where something good is happening and;
 WELCOME EXERCISE Share your thoughts on the study area by: Placing a GREEN DOT on areas you like or where something good is happening and; Placing a RED DOT on areas you don t like or where area needs
Portland, Oregon. Salt Lake City, Utah. April 20, 2016
 Case Study: Does size matter? A critique of two urban block sizes and the affects on walkability Portland, Oregon Salt Lake City, Utah GoogleEarth Pro, web. 04 Apr 2016 GoogleEarth Pro, web. 04 Apr 2016
Characteristics from these programs were used to compare to and evaluate existing conditions in Howard County.
 EXECUTIVE SUMMARY Bike share is a mobility option that allows users to access a fleet of public bicycles throughout a community. Bike share systems have successfully been implemented in communities throughout
Bike Share Social Equity and Inclusion Target Neighborhoods
 Bike Share Social Equity and Inclusion Target Neighborhoods Target Neighborhoods West End/Visitation Park/Academy/Hamilton Heights Wellsgoodfellow/Kingsway West The Ville/Greater Ville Kingsway East/Fountain
Public Transport and Development: Making It Work
 Public Transport and Development: Making It Work Robert T. Dunphy Urban Land Institute World Bank Transport Forum 2006 March 28, 2006 Transportation Development Disconnect Now Few Then places w/o car Many
City of Davenport CitiBus Public Transportation Study. April 2015
 City of Davenport CitiBus Public Transportation Study April 2015 Overview Project Background Key Findings CitiBus Service Allocation Policy Discussion 2 Project Background 3 About CitiBus Operates 17 routes
Bicycle and Pedestrian Access in Transit Oriented Developments. Bruce Wright Chairman, Fairfax Advocates for Better Bicycling April, 2009
 Bicycle and Pedestrian Access in Transit Oriented Developments Bruce Wright Chairman, Fairfax Advocates for Better Bicycling April, 2009 Overview Reasons to encourage bicycling Compare bike and walk distances
Incorporating Health in Regional Transportation Planning
 Mayor Karl Dean, Chairman Incorporating Health in Regional Transportation Planning Leslie A. Meehan, AICP Center TRT Intervention Webinar January 29, 2013 Objectives for Today Background About the Nashville
Fixed Guideway Transit Outcomes on Rents, Jobs, and People and Housing
 Fixed Guideway Transit Outcomes on Rents, Jobs, and People and Housing Arthur C. Nelson, Ph.D., ASCE, FAICP Professor of Planning and Real Estate Development University of Arizona 1 Changing Transportation
Vision to Action Community Coalition February 14, 2014 Briefing
 Vision to Action Community Coalition February 14, 2014 Briefing Transportation and Transit Planning & Mass Transit Operations Strategic Growth Area Office Brian S. Solis Transportation & Transit Manager
Incorporating Health in Regional Transportation Planning
 Mayor Karl Dean, Chairman Incorporating Health in Regional Transportation Planning Leslie A. Meehan, AICP Center TRT Intervention Webinar January 29, 2013 Objectives for Today Background About the Nashville
PEOPLE ARE PEDESTRIANS BY DESIGN JOIN THE MOVEMENT AT
 PEOPLE ARE PEDESTRIANS BY DESIGN JOIN THE MOVEMENT AT WWW.WALKDENVER.ORG Our Vision: In 2040, Denver will be the most walkable city in the United States. As a result, its residents will be the country
Recommendations from Boston City Council Transportation Policy Briefing Series
 Recommendations from Boston City Council Transportation Policy Briefing Series Report to Boston City Councilors May 2017 Prepared by: Boston City Council Committee on Parks, Recreation & Transportation
Dayton Bike Share Feasibility Study
 6 August 2013 Dayton Bike Share Feasibility Study Conducted by Bike Miami Valley Scott Murphy Aaron Buckley Amy Forsthoefel Matt Lindsay Grant Neeley Emily Wilk Andy Williamson What is Bike Sharing? Annual
Briefing Paper #1. An Overview of Regional Demand and Mode Share
 2011 Metro Vancouver Regional Trip Diary Survey Briefing Paper #1 An Overview of Regional Demand and Mode Share Introduction The 2011 Metro Vancouver Regional Trip Diary Survey is the latest survey conducted
Online Open House Survey Report. December 2016
 December 216 I. OVERVIEW & OUTREACH SUMMARY Introduction Washington County evaluated long-term transportation investments and strategies as part of the Transportation Futures Study. The purpose of the
Transforming the. Michigan Avenue Corridor. a complete streets and transit-oriented development study Michigan State University Student Research Team
 Transforming the Michigan Avenue Corridor a complete streets and transit-oriented development study Michigan State University Student Research Team Dominic Adams Annie Fardell Jon Roberts Jeff Stivenson
Fiscal Impact of SunTrust Park and The Battery Atlanta on Cobb County Executive Summary Sept. 18, 2018
 Fiscal Impact of SunTrust Park and The Battery Atlanta on Cobb County Executive Summary Sept. 18, 2018 Overview Historically, professional sports stadiums were privately owned by the sports teams that
Investing in Real Estate. The smart choice for today s investor
 Investing in Real Estate The smart choice for today s investor Real Estate is preferred over stocks Real estate out performs stocks http://blog.863katy.com/category/national-housing-news/page/2/ Real Estate
JOINT PARTNERSHIPS: Working Together To Support Light Rail in Santa Monica
 JOINT PARTNERSHIPS: Working Together To Support Light Rail in Santa Monica ITY OF ANTA MONICA RAIL-VOLUTION / OCTOBER 17, 2012 SARAH LEJEUNE, PRINCIPAL PLANNER, STRATEGIC + TRANSPORTATION PLANNING DIVISION
I-20 East Transit Initiative
 I-20 East Transit Initiative Public Meetings Tuesday, October 26 DeKalb Medical Center Hillandale Community Room 2801 DeKalb Medical Parkway Lithonia, GA 30058 6:00pm 8:00pm Wednesday, October 27 East
2722, 2724, 2726, 2728, & 2730 REYNARD WAY, SAN DIEGO, CALIFORNIA T F W - A. C O M
 , CALIFORNIA T F W - A. C O M TABLE OF CONTENTS 01 EXECUTIVE SUMMARY 02 PROPERTY HIGHLIGHTS 03 PROPERTY SUMMARY 04 AREA HIGHLIGHTS 05 PLANS SITE This information has been secured from sources we believe
Webinar: The Association Between Light Rail Transit, Streetcars and Bus Rapid Transit on Jobs, People and Rents
 Portland State University PDXScholar TREC Webinar Series Transportation Research and Education Center (TREC) 11-15-2016 Webinar: The Association Between Light Rail Transit, Streetcars and Bus Rapid Transit
Chapter 5. Principles Appropriating Process
 Chapter 5 Principles Appropriating Process New, post and other urbanism [ ] However these urbanism are perceived, they do represent different values and sensibilities. They need to be situated in time
Strategic Plan for Active Mobility Phase I: Bicycle Mobility
 Strategic Plan for Active Mobility Phase I: Bicycle Mobility City of Corpus Christi February 9, 2016 Jeff Pollack, AICP Transportation Planning Director Vision Active Mobility Plan Vision The metropolitan
Presentation Comments and Questions
 Presentation Comments and Questions The community had a number of questions regarding the master plan process and operational issues in and around the MARC rail station areas. The bullet points below are
Fordham Plaza. Conceptual Design Study
 Fordham Plaza Conceptual Design Study WASHINGTON AVE. N Project Scope Timeline Urban Design Transportation Economics/Market Research A Multi-Disciplinary Study Based on meetings and interviews with Stakeholders:
MEETING Agenda. Introductions. Project Overview. Key Study Components. Alternative Station Concepts. Preferred Station Concept. Next Steps.
 City GARLAND Council ROADVISION Briefing STUDY VISION STUDY Dallas, TX April 8, 2010 1 1 MEETING Agenda Introductions Project Overview Key Study Components Alternative Station Concepts Preferred Station
2010 Pedestrian and Bicyclist Special Districts Study Update
 2010 Pedestrian and Bicyclist Special Districts Study Update Pedestrian and Bicyclist Special Districts Program Overview H-GAC s Special Districts Program aims to provide strategic investments in pedestrian
 Time of Change We Are Growing We Are An Attractive Place To Live We Are Age Diverse + Living Longer 50000 40000 30000 20000 10000 0 2010 Census Job Density Housing Sheds Transit Sheds The Project FUNDING
WALK- AND bike-friendly TURLOCK
 WALK- AND bike-friendly TURLOCK Ideas to Encourage Walking and Biking Benefits to the COMMUNITY Get Connected People who walk and bike have many more opportunities for casual interactions with friends
Planning Regionally With Transit
 Planning Regionally With Transit Nathan Coats Director of Operations CTAA Expo 2015 Tampa Began 1992. Serves eastern Cache County to Preston, ID. Population- 115,000 34 bus fleet, 26 fixed route buses;
Bike Planner Overview
 Bike Planner Overview A Web-based Sketch Planning Tool for Los Angeles County presented by William E. Walter, GISP April 12, 2017 GIS-T Transportation leadership you can trust. Bike Planner Overview Guiding
MARKET POSITIONING. (Fall 2010)
") Sandy Point MARKET POSITIONING (Fall 2010) Sandy Point s Product Baby Boomers want Walkable Urban Places. Master Planned Communities of the future, says the Urban Land Institute, will offer a mix of housing
Sandy Point MARKET POSITIONING (Fall 2010) Sandy Point s Product Baby Boomers want Walkable Urban Places. Master Planned Communities of the future, says the Urban Land Institute, will offer a mix of housing
Smart Growth: Residents Social and Psychological Benefits, Costs and Design Barbara Brown
 Smart Growth: Residents Social and Psychological Benefits, Costs and Design Barbara Brown By Scott Siedor 11 At the invitation of the Goodwin-Niering Center for the Environment, Barbara Brown came to Connecticut
Ranking Walkable Urbanism in America s Largest Metros. By Christopher B. Leinberger & Patrick Lynch
 Ranking Walkable Urbanism in America s Largest Metros By Christopher B. Leinberger & Patrick Lynch The George Washington University School of Business 1 The Center for Real Estate and Urban Analysis Table
COMMUNITY SCHOOLS AND TRANSPORTATION
 COMMUNITY SCHOOLS AND TRANSPORTATION Regional Transportation Council Workshop October 8, 2015 Agenda» Existing Conditions and Previous Initiatives (RTC School Policy)» TIGER Grant and the Community Schools