CITY AND COUNTY OF SAN FRANCISCO BOARD OF SUPERVISORS BUDGET AND LEGISLATIVE ANALYST
|
|
|
- James Hart
- 5 years ago
- Views:
Transcription
1 CITY AND COUNTY OF SAN FRANCISCO BOARD OF SUPERVISORS BUDGET AND LEGISLATIVE ANALYST 1390 Market Street, Suite 1150, San Francisco, CA (415) FAX (415) Policy Analysis Report To: Supervisor Eric Mar From: s Office Re: Senior Pedestrian Safety Date: Summary of Requested Action You asked us to review best practices for senior pedestrian safety in other jurisdictions in order to make recommendations on traffic calming measures and other strategies to increase safety for seniors and other people with disabilities Executive Summary The City s Transit First policy provides for enhancement of pedestrian areas to improve the safety of pedestrians. The City s Pedestrian Strategy commits the City to reducing serious and fatal pedestrian injuries by 50 percent by While the City has implemented programs to increase pedestrian safety, the City needs to do more. The number of injuries and deaths has not changed significantly over the past 10 years and San Francisco has the second highest rate of pedestrian injury and death after New York City. An average of 17 pedestrians has been killed and 86 severely injured in San Francisco each year between 2005 and Seniors are more vulnerable to collisions than younger adults; while people 65 and older are only 14 percent of the city s population, they made up over one-third of the pedestrian deaths between 2005 and Discrepancies between San Francisco Police Department (SFPD) data and San Francisco General Hospital admissions data indicate that this may understate the number of serious injuries. Additionally, there are problems with the quality of pedestrian level collision data in the database that the San Francisco Police Department (SFPD) Traffic Unit uses to store and analyze pedestrian collisions. The Department of Public Health (DPH), San Francisco Municipal Transportation Agency (SFMTA), and SFPD are working to remedy these data issues including piloting a transportation-related injury surveillance system that links police and hospital data. The system will provide data to City agencies and the public to inform Vision Zero efforts to reduce preventable injuries and deaths. 1
2 The majority of pedestrian deaths and severe injuries to younger people and seniors occur in crosswalks. In August, 2016, New York City Department of Transportation published a left turn pedestrian and bicyclist crash study that found that left turns are a major cause of pedestrian serious injuries and fatalities and that seniors are disproportionately affected. San Francisco should undertake a similar comprehensive and detailed study including a before/after collision analysis and evaluation of a left turn traffic calming pilot program. As part of the City s Vision Zero policy adopted in 2014, SFPD undertook to issue 50 percent of traffic citations for the five driving violations most associated with collisions that involve serious injury and death in a policy called Focus on Five. Between 2014 and 2015, the Department made substantial increases in issuance of tickets for three Focus on Five violations - Pedestrian Right of Way, Speeding and Failure to Yield violations. However the percentage of Focus on Five traffic citations overall was only 35 percent in Enforcement of Focus on Five violations was not the same among all police district stations; the Central and Tenderloin stations only issued 17 percent of traffic citations to Focus on Five violations, although these two districts had a high incidence of pedestrian injury and death. Increased enforcement of the Focus on Five traffic violations would require either increased SFPD Traffic Unit activity and/or increased traffic citation issuance by police assigned to the city s ten district police stations. SFMTA recently implemented the grant-funded Safer Streets Campaign pilot program to reduce speed limit violations. SFMTA will provide 44 Light Detection and Ranging (LIDAR) units to traffic police to increase speed limit enforcement on the City s high injury corridors. SFMTA s Sustainable Streets Division is mapping vehicle collisions involving senior pedestrians against senior facilities such as senior centers and residences to determine whether there is a pattern of collisions around these facilities and whether collisions are occurring on residential streets that would be eligible for the program. SFMTA reports that early indications are that a very small group of senior facilities meet these conditions. DPH launched the Safe Streets for Seniors Program in April 2016, which includes presentations to seniors to increase their knowledge of and involvement in Vision Zero. Policy Recommendations In order to enhance the City s existing pedestrian safety programs especially for seniors, including improvements in data collection and analysis, and in enforcement, the Board of Supervisors should request: The Chief of Police and SFMTA Director of Transportation to report to the Board of Supervisors and Police Commission by March 31, 2017 on the preliminary results of the first six months of the Safer Streets Campaign pilot 2
3 program, including use by police officers of LIDAR enforcement Safe Streets pilot project to enforce speed limits. The Chief of Police to report to the Board of Supervisors and Police Commission by March 31, 2017 on achievement of the Focus on Five goals by police district, and if the goals are not achieved, a plan (including specific police district actions) to meet the goals. The Chief of Police, Director of Public Health and SFMTA s Director of Transportation to increase traffic calming and public education projects in neighborhoods, and around intersections and streets with high concentration of senior pedestrians. For example, If the senior pedestrian injury mapping that the Sustainable Streets Division is undertaking indicates that senior serious injury collisions and deaths are occurring on streets and corridors outside the High Injury Network or on streets that currently do not meet the program s guidelines, the Board may want to request SFMTA and SFPD to implement traffic calming enforcement and engineering strategies appropriate for these streets, corridors and intersections. The SFMTA s Director of Transportation and the chair of the Vision Zero Task Force Evaluation and Data Subcommittee to expand on the pedestrian safety data analysis presented in the March 2014 report Walk First A Step Towards Vision Zero, and to analyze the data gathered as part of the Safe Speed Campaign, and present to the Board of Supervisors by March 31, 2017 a comprehensive and detailed study similar to New York Department of Transportation s left turn pedestrian and cyclist crash study that includes (1) key findings on degree of injury, frequency of collisions, victim and driver age and gender, location, intersection characteristics, vehicle type etc. (2) a prioritized Action/ Treatment Plan or detailed description of treatments underway and (3) plans for evaluation of the results of treatments. The Chair of the Vision Zero Task Force Evaluation and Data Subcommittee to report to the Board of Supervisors by March 31, 2017 on the transportationrelated Injury Surveillance System progress on resolving inaccuracy of pedestrian collision data and other data quality issues. The SFMTA Director of Transportation to provide up to date and consolidated information to the Board of Supervisors by March 31, 2017 on WalkFirst, Safe Streets for Seniors and other pedestrian safety capital projects completed to date and publish this information on the Vision Zero interactive map. 3
4 Transit First and Pedestrian Safety In 1973, the City adopted the Transit First policy amending the City Charter to establish priority for pedestrians and public transit. The Charter s Transit First policy provides for enhancement of pedestrian areas to improve the safety of pedestrians. Since 1973, this policy has been reiterated in strategic planning documents and ordinances that require the design and operation of the city s transportation system give priority to pedestrians, public transit and, more recently, cyclists. These policies are included in Appendix A. From 2004 through the first quarter of 2016, 17 pedestrians per year on average have been killed in collisions on the City s streets. Although seniors 65 and older are approximately 14 percent of the City s population, between 2005 and they were more than one-third of these fatalities. Additionally, approximately 86 pedestrians on average have been severely injured each year in collisions between 2005 and, and seniors 65 years of age and older make up about 15 percent of these severe injuries. The City s pedestrian safety policies and programs assume that increased pedestrian safety will benefit seniors since they are disproportionately affected in pedestrian collisions. Major U.S. cities have adopted Vision Zero plans to eliminate pedestrian collision deaths and severe injuries. The San Francisco Pedestrian Strategy initially committed the City to reducing serious and fatal pedestrian injuries by 50 percent by San Francisco s Vision Zero supersedes the Pedestrian Strategy and calls for the elimination of traffic deaths and severe injuries by The main strategies that pedestrian safety plans nationwide share are (1) increased enforcement of traffic laws -- specifically moving violations, and (2) redesign of city streets and the pedestrian realm to constrain behaviors that cause pedestrian collisions and to create pedestrian refuge and other forms of pedestrian protection. Some cities have safer streets for seniors programs that operate in conjunction with Vision Zero programming and planning but specifically target increased safety for senior pedestrians. Pedestrian Collisions From 2004 through the first quarter of 2016, 208 pedestrians were killed; and from 2005 through the first quarter of 2016, 959 pedestrians were seriously injured in San Francisco collisions, averaging 17 and 86 pedestrians killed and severely injured annually. Seven pedestrian were killed in the first three months of five over the age of 60 including two who were older than putting 2016 thus far ahead of last year s fatality count. 1 Detailed pedestrian level data for the period 2013 to the present is not yet available. 4
5 Table 1: Pedestrians Killed and Severely Injured 2 in Collisions in San Francisco from 2004 to 2016 (1 st Quarter) Year Killed Severely Injured Subtotal, 2004 to 2012 a (1st Quarter) 7 50 Subtotal, 2013 to 2016 b Total Source: a Statewide Integrated Traffic Records System ( ); b San Francisco Department of Public Health (DPH) and San Francisco Police Department (SFPD) Crossroads database (2013 to 1 st Quarter 2016) As in most cities, the number of senior pedestrians killed and seriously injured in collisions in San Francisco is greater than their share of the City s population. Senior pedestrians sometimes have hearing, visual or mobility impairments and are more vulnerable to death and severe injury in collisions than younger adults. The Alliance for Biking and Walking found that percent of pedestrians hit by a car traveling 40 mph survive, but seniors have only an 8 percent chance of survival when hit at this speed. 3 The San Francisco Department of Public Health has found that the elderly are more vulnerable to more injury complications from collisions than younger adults. 4 There were 58 fatalities involving people 60 years of age and older between 2005 and 2012, averaging 7 fatalities a year for this age group. There were 139 people 60 and older were severely injured between 2005 and 2012 as shown in Table 2 below. The majority of people above 60 killed and injured were 65 or older. 2 Less severe injuries are categorized as complaint of pain and injured 3 Alliance for Biking and Walking 2016 Benchmarking Report page 21 4 Pedestrian injuries in San Francisco: distribution, causes, and solutions; February 15th, 2010; SFDPH 5
6 Table 2: Senior Pedestrians Killed or Severely Injured Killed Seriously Injured Total Aged 60 and Older Percent 42% 20% Aged 65 and Older Percent 37% 15% Source: Statewide Integrated Traffic Records System ( ) As seen in Figure 1 below, from 2005 to 2012 people 60 and older were 42 percent of all pedestrian fatalities. Figure 1: Pedestrians 60 and Older As Percent of Total Fatalities , 42% < 60 years 80, 58% 60 + Source: Statewide Integrated Traffic Records System When the age threshold is raised to 65, senior fatalities as a percentage of total pedestrian fatalities drops, but is still more than one-third, as seen in Figure 2. 5 Pedestrian level data such as age is unavailable from either SFDP or SWITTS for the period 2013 to the present. 6
7 Figure 2: Pedestrians 65 and Older As Percent of Total Fatalities , 37% < 65 years 87, 63% 65 + Source: Statewide Integrated Traffic Records System While adults 65 years and older made up 14 percent of the San Francisco population on average between 2005 and 2012, they made up 37 percent of the pedestrians who were killed and 15 percent of the pedestrians who were seriously injured, as shown in Table 3 below. The high percentage of older pedestrians who were killed compared to seriously injured suggests that older adults often die from their injuries. Table 3: Pedestrians 65 and Older as Percent of All Pedestrians Killed and Severely Injured Percent SF population Killed Severely Injured Year % 29% 18% % 13% 12% % 50% 20% % 43% 18% % 50% 9% % 38% 16% % 41% 12% % 21% 18% Average % 37% 15% Source: Statewide Integrated Traffic Records System ( ) 6 Pedestrian level data such as age is unavailable from either SFDP or SWITTS for the period 2013 to the present. 7
8 Pedestrian Fatality Rates in San Francisco Compared to Other Cities At 17,587 people per square mile San Francisco is the second densest city in the country after New York. 7 According to the Alliance for Walking and Biking, San Francisco has the third highest percentage of commuters that walk to work among the nation s most populous cities just behind Boston and Washington, D.C. and ahead of New York and Seattle 8. Of the nation s 50 most populous cities, San Francisco has the third lowest rate of pedestrian fatalities relative to the number of walking commuters as seen in Table 3. 9 However, as with the other cities with low pedestrian fatality rates relative to the number of walking commuters, San Francisco has a high pedestrian fatality rate as a percentage of all traffic fatalities. At 49 percent, it is the second highest of the 50 most populous cities only behind New York. This percentage was 37 percent in Table 4: Pedestrian Fatalities in Most Populous Cities in U.S City Average of 50 Most Populous Cities Fatalities Per 10,000 Walking Commuters 11 Pedestrian Fatalities as a Percentage of all Traffic Fatalities % New York 4 52% San Francisco 4 49% Washington, D.C. 3 40% Seattle 3 29% Minneapolis 3 22% Boston 2 34% Source: Alliance for Biking and Walking: 2016 Benchmarking Report from U.S. Census Bureau American Community Survey three year estimates 7 Alliance for Biking and Walking 2016 Benchmarking Report page Alliance for Biking and Walking 2016 Benchmarking Report; page 40 9 The accuracy of fatality rates is limited due to the potential for inaccurate and incomplete reporting of fatalities and the use of commuter data since reported fatalities occur during walking trips other than commuting which the ACS does not count. 10 The Pedestrian Safety Project; San Francisco Department of Health Fact Sheet 11 The population rate of injuries is another measure of pedestrian safety. By this measure, San Francisco has a high rate of pedestrian fatalities. The San Francisco Health Improvement Partnership reports that the City s population rate of injury of approximately 100/100,000 residents, is five times the national target. In a 2010 report, SFDPH Dr. Raji Bhatan reported that the City s per resident rate of injuries of 97,100,000 was five times the national public health target and that on a per walking trip bases pedestrian collision rates are 30 percent higher than in the U.S. overall. 8


9 Driver Violations as the Cause of Most Pedestrian Fatalities in Collisions More than one-half of pedestrians who are killed by a vehicle collision are killed when walking in a cross walk. As seen in Figure 3 below, 51 percent of pedestrian collision fatalities between 2005 and 2012 involved pedestrians crossing in a crosswalk. Figure 3: Location of Pedestrian Fatalities for All Ages, , 2% 11, 8% 14, 10% 38, 28% 71, 51% Crossing in Crosswalk at Intersection Crossing in Crosswalk Not at Intersection Crossing Not in Crosswalk In Road, Including Shoulder Not in Road 1, 1% Source: Statewide Integrated Traffic Records System When only pedestrians 65 years of age and older are considered, the percentage of pedestrian fatalities in crosswalks increases to 57 percent, as seen in Figure 4. Figure 4: Location of Pedestrian Fatalities for 65 and Older, % 4% Crossing in Crosswalk at Intersection 11% Crossing Not in Crosswalk 23% 57% In Road, Including Shoulder Not in Road Not Stated Source: Statewide Integrated Traffic Records System 9
10 Undercounting of Pedestrian Injuries 12 In a 2015 report, San Francisco Department of Public Health (DPH) epidemiologists reported a discrepancy between collision victims admitted to San Francisco General Hospital with severe injuries and the number of severe injuries reported by the San Francisco Police Department (SFPD). The number of collision victims admitted to San Francisco General Hospital with severe injuries was greater than the number of severely injured collision victims that the SFPD reported. The California Highway Patrol (CHP) gathers and disseminates statewide collision data through the Statewide Integrated Traffic Record System (SWITRS). SWITRS has collision data, including pedestrian victim data, for San Francisco up to According to DPH personnel, there have been delays at CHP in publishing more recent data. The San Francisco Police Department (SFPD) uses two databases to store crime data: (1) Crossroads is a private company that provides free software that allows the SFPD to store collision data. Currently only SFPD Traffic Unit officers can directly enter their reports into Crossroads. All other officers scan their traffic reports and put them in a shared folder that is sent to Crossroads for coding. (2) Crime Data Warehouse is an Oracle database that SFPD uses for all other crime reporting. It does not support the Traffic Unit. In 2013, due to a staffing change, SFPD did not submit all its collision reports to CHP in time. Therefore the SWITRS 2013 numbers of collisions and victims are underreported for San Francisco. In Crossroads, the total number of 2013 collisions is correct but there are victim level data quality issues including duplicate entries and miscoding. DPH is currently working the MTA, SFPD and the Office of the Controller to clean and reconcile this data set. DPH, MTA, SFPD, and the Office of the Controller are studying options to solve these data issues including a proposal to move collision incident reporting to Crime Data Warehouse. 12 At the time of this report a Data Subcommittee meeting had been scheduled with DPH, MTA, and SFPD, to discuss the possibility of changing the definition of a pedestrian collision is. Currently a pedestrian collision is defined as an injured party who was a pedestrian involved in the collision. 10
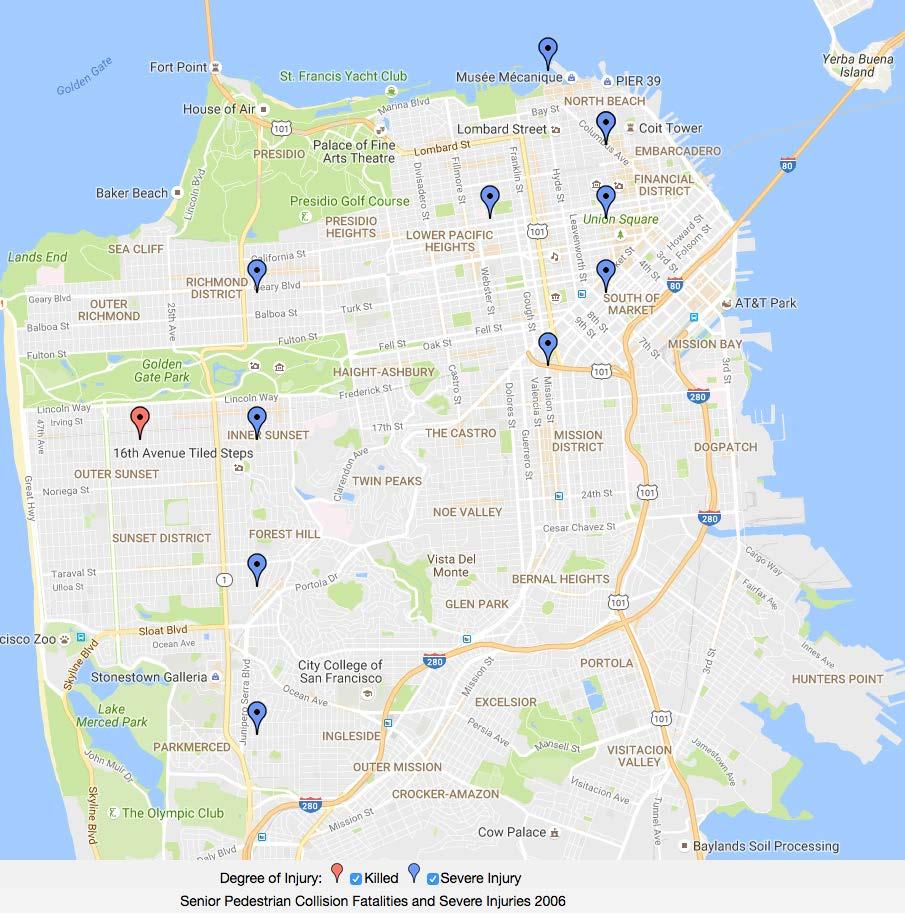
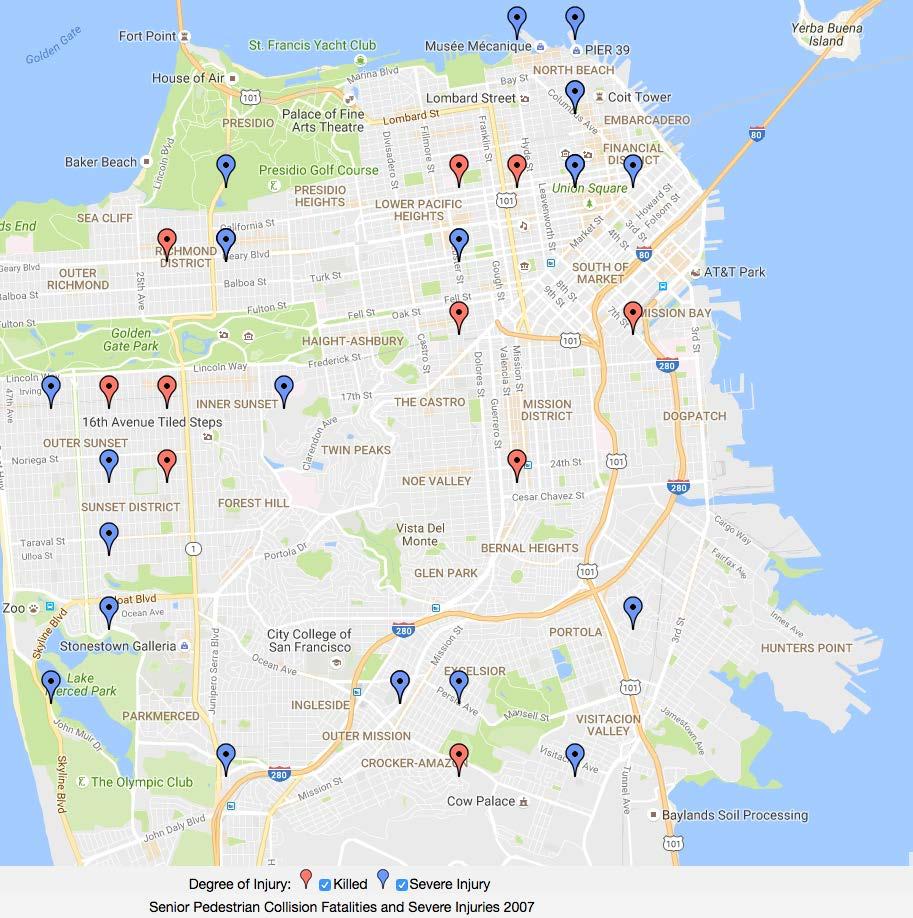
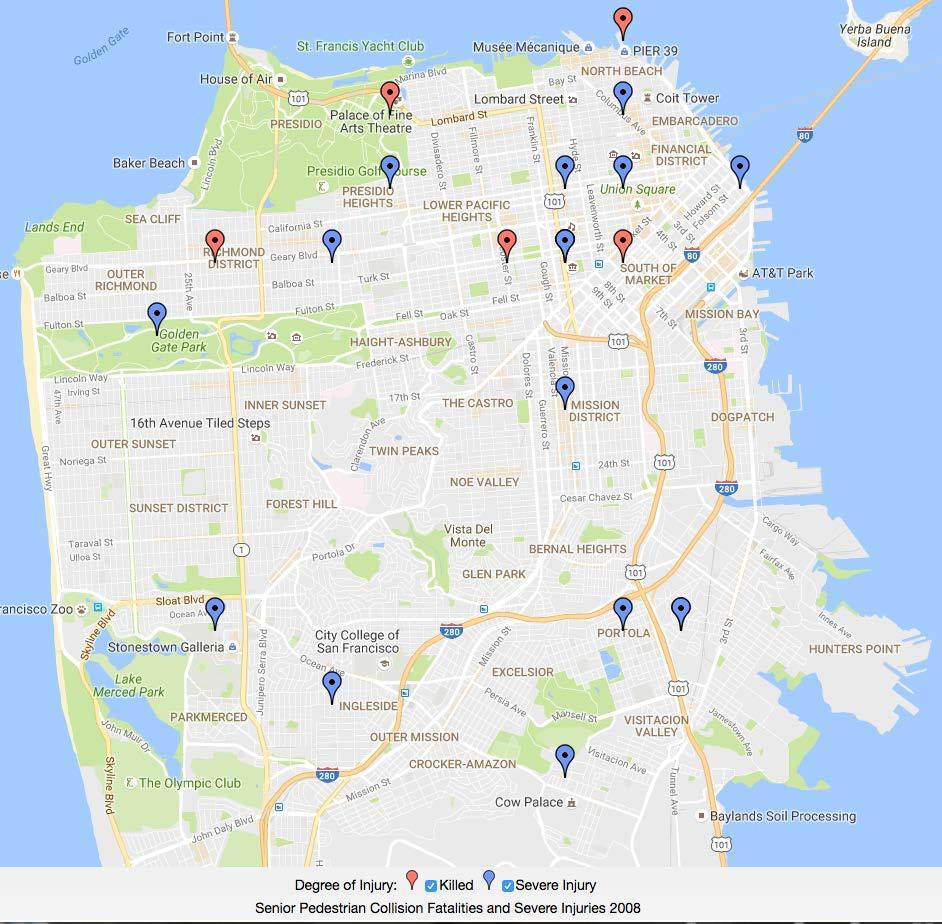
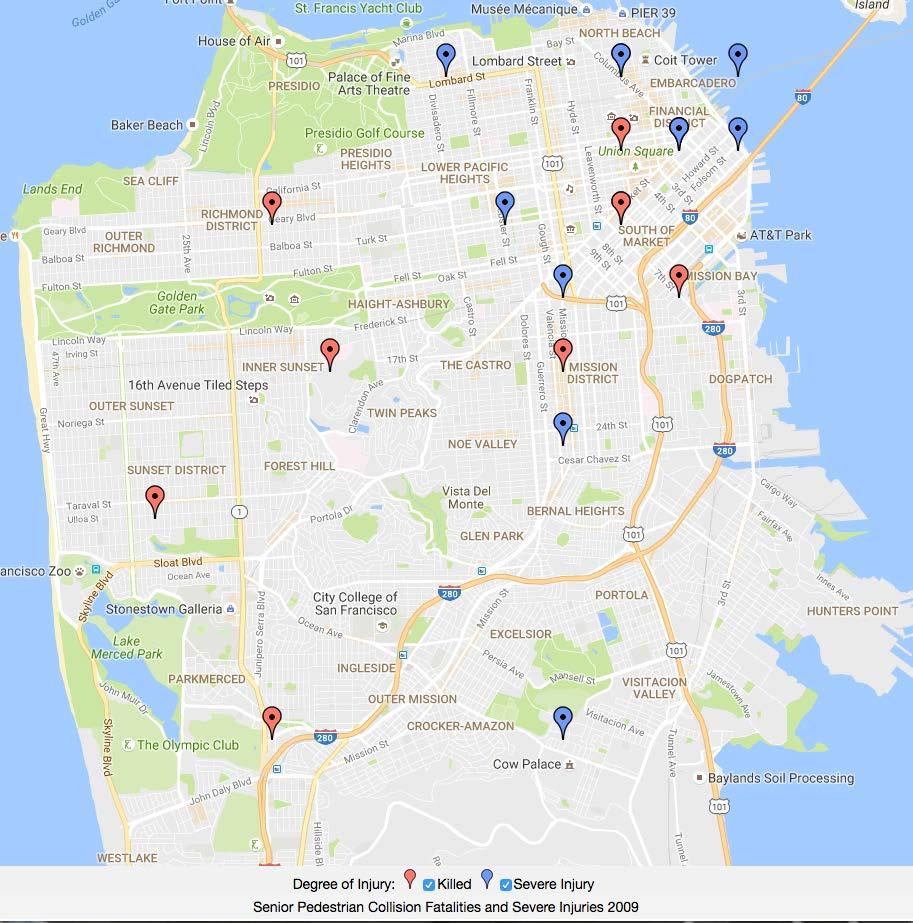
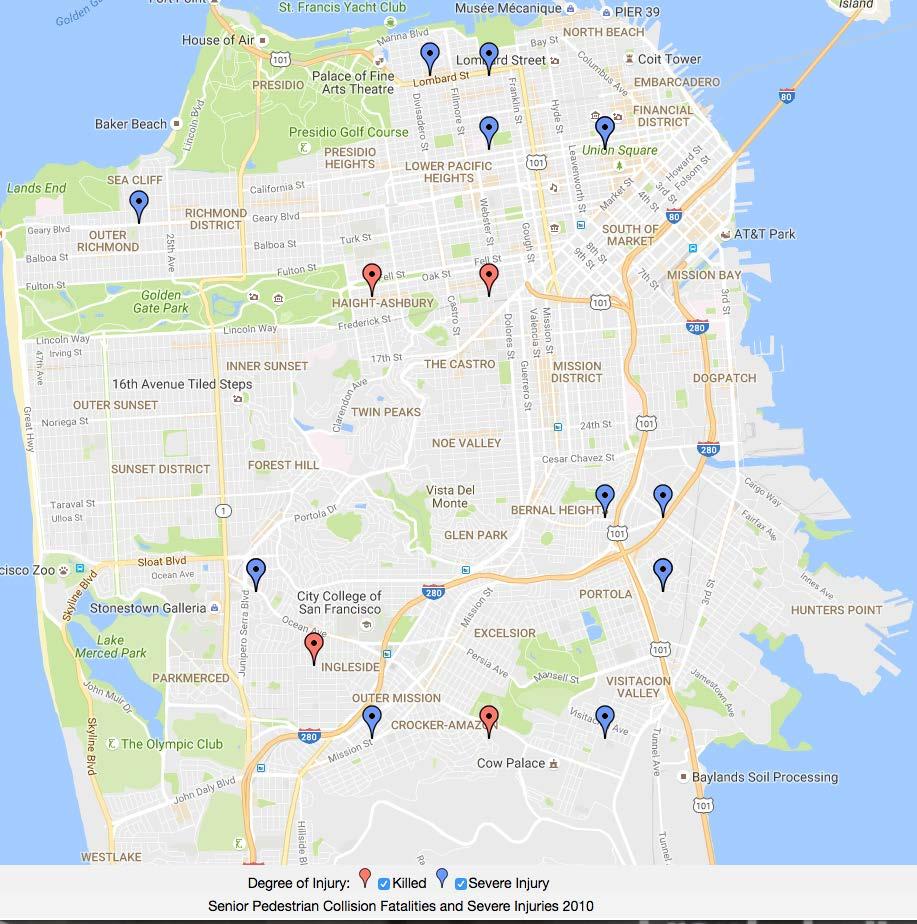
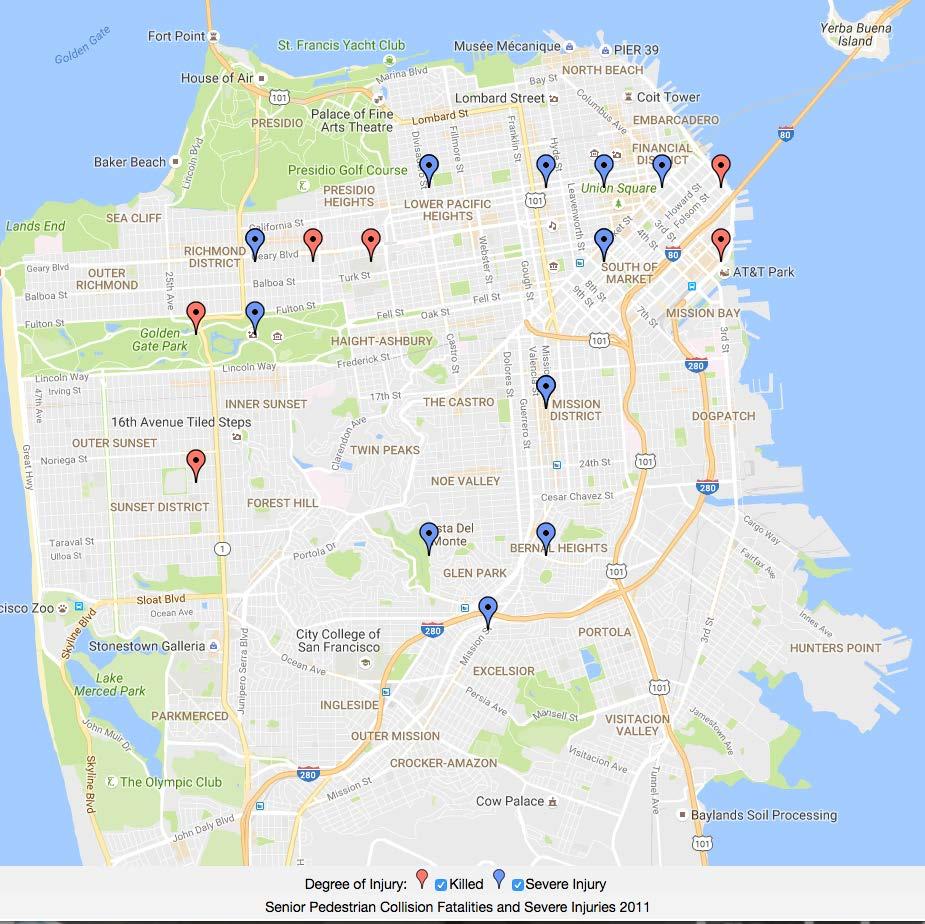
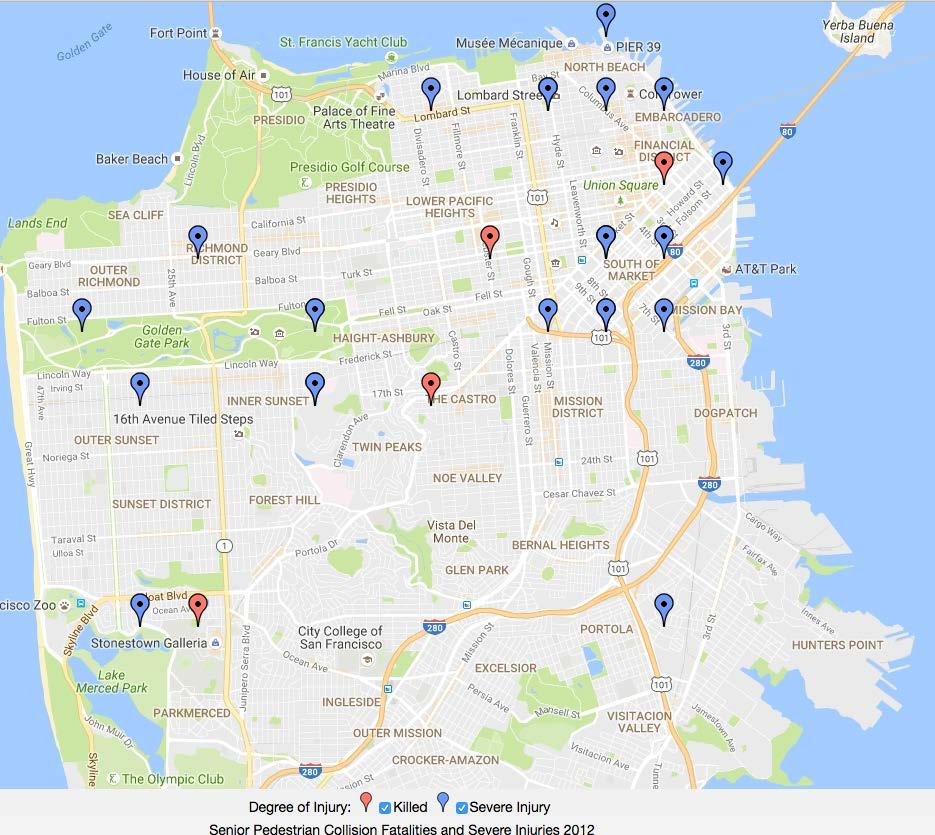
11 San Francisco s Practices to Reduce Pedestrian Injury In San Francisco, the Department of Public Health, Municipal Transportation Agency, and Police Department have responsibility for programs and practices to reduce pedestrian injury and fatality. High Injury Network In 2010, DPH identified streets with the highest incidence of fatalities and injuries and created a high injury corridor map that informs the City s pedestrian safety engineering and traffic enforcement efforts. Other cities with Vision Zero plans have done something similar. Appendix B contains annual maps of senior pedestrian fatal and severe injury collisions from 2005 to Planned Street Calming For Senior Pedestrian Generating Activity Areas For the last four years, the SFMTA s Sustainable Streets Division has operated a program whereby residents may apply for the installation of traffic calming speed humps on local residential streets. The program has required residents to initiate the application process. Arterial and Collector streets, which are where most of the High Injury Network is located, are excluded. Applications are assessed on severity of speeding in the neighborhood. Other criteria are collision history, traffic volumes, and adjacent land uses such as parks and schools. In FY SFMTA received over 100 applications and is currently building 40 speed humps in addition to other measures. Program funding is within SFMTA s Capital Plan. The SFMTA Sustainable Streets Division intends to initiate a proactive traffic calming program in which city staff would proactively identify local residential streets that would benefit from traffic calming. The program would launch in FY when capital funding is available. SFMTA staff is considering whether the program should prioritize streets adjacent to senior centers and/or schools. Staff are now mapping pedestrian collisions against the location of senior pedestrian generating activities such as senior centers, congregate meal sites, senior housing and other senior activity centers to determine whether these senior pedestrian generating activities are occurring on local residential streets that have experienced collisions. Education and Outreach Safe Streets for Seniors is an outreach and education program led by the Department of Public Health (DPH) launched in April 2016 to educate seniors and disabled people on Vision Zero and pedestrian safety Since April 2016, DPH staff have made presentations to 480 seniors and people with disabilities at 16 senior centers. Most participants have been non-english speaking. Presentations have been conducted in English, Spanish, Cantonese, and Mandarin. The goals are to educate seniors and service providers on Vision Zero, how to get involved in traffic safety, and how to stay safe when walking. 11
12 Presentations covered the disproportionate burden of traffic-related injury on seniors, the Vision Zero high injury network, the strategies of the citywide Task Force, projects in 2016, reducing speeding campaign, and pedestrian safety tips. According to DPH staff, participants main concerns have included (1) inadequate time to cross the street, (2) speeding, 3) drivers not yielding to pedestrians, and 4) uneven/broken sidewalks.] DPH also administers a grant program to community-based organizations to work in-depth on Vision Zero education and outreach to seniors, especially in monolingual non-english speaking communities. DPH granted seven awards to community-based organizations totaling $180,000 in both FY and FY Projects range from citywide efforts to neighborhood projects. DPH reports that in response to the Mayor s August Executive Directive, it is analyzing collision and related data to identify areas where safety investments can improve safety for youth, seniors and people with disabilities and, in collaboration with SFMTA, to recommend projects that target these populations. DPH also reports that the WalkFirst program prioritized improvements for seniors by weighting locations where senior injuries occurred. Traffic Enforcement As part of Vision Zero and Pedestrian Safety plans, police departments around the country have begun to focus enforcement on traffic violations most closely associated with fatal and serious injury pedestrian collisions. Since 2014, the SFPD goal has been to issue 50 percent of traffic citations for the five traffic violations most associated with severe and fatal injuries called Focus on Five. 13 The violations are: Red Light Stop Sign Pedestrian Right of Way Speeding Failure to Yield On August 4, 2016, the Mayor issued Executive Directive directing SFPD to expand its efforts to meet Focus on Five goals and continue quarterly public reports and presentations at the Police Commission. Between 2014 and 2015, the Department made substantial increases in citations for Pedestrian Right of Way, Speeding and Failure to Yield violations, for an overall increase in Focus on Five citations of 36 percent. As seen in Table 5, this increase included a dramatic increase in the number of Failure to Yield citations
13 Table 5: Focus on Five Traffic Citations 2014 to 2015 Year Red Light Stop Sign Pedestrian Right of Way Speeding Failure to Yield Focus on 5 Citywide ,504 13,061 4,415 7, , ,636 13,657 7,639 10,700 4,195 41,827 % Increase 2% 5% 73% 44% 976% 36% Source: SFPD However, as of the second quarter of calendar year 2016, the Department had not yet reached the goal for 50 percent of traffic citations to be Focus on Five citations. The percentage of Focus on Five traffic citations was 35 percent in 2015 and 38 percent for the first two quarters of 2016, as shown in Table 6 below. Table 6: Focus on Five Citations as % of All Citywide Traffic Citations in 2015 and 2016 YTD 14 Total Violations Focus on Five Violations Focus on Five % ,133 41,827 35% YTD ,209 19,531 38% Source: SFPD Vision Zero Enforcement Reports Enforcement of Focus on Five traffic violations varies among district police stations, as shown in Figure 5 below. According to SFPD Traffic Unit management, this variation is a result of differing priorities and objectives at each station as well as different physical conditions. For example, some station areas have more stop signs than others. However, while more than 50 percent of traffic citations issued by the Richmond district police station were Focus on Five, only 17 percent of traffic citations issued by the Tenderloin and Central district police stations were Focus on Five, although these two districts had high incidences of pedestrian injury and fatalities (see Appendix B maps). 14 Does not include citations issued by SFPD Tactical Company 13
14 Figure 5: Focus on Five Citations as a Percentage of all Traffic Citations by Station 70% 60% 50% 40% 30% 20% 10% (1st Quarter) 0% Source: SFPD Achievement of the Focus on Five 50 percent goal depends on the type, frequency and extent of traffic enforcement operations. According to SFPD management, in addition to traffic enforcement operations on the High Injury Network, each district captain creates a monthly traffic enforcement plan. Two motorcycle police officers are assigned daily to each of the city s ten stations to support the station s enforcement plans by working various corridors and hot spots which vary daily and are in part based on citizen complaints. These plans have included enforcement around senior housing and senior centers. The remainder of the unit s officers are assigned to company K, which is the Tenderloin and Southern Police District. The SFPD Traffic Unit, which has 59 sworn officers, conducted 56 pedestrian yield operations in 2015 and has conducted 55 in 2016 to date. Plans to Increase Speeding Enforcement and Raise Enforcement Visibility In SFMTA s application to the State of California Department of Transportation for an Active Transportation Program grant, SFMTA noted that the City did not have a sustained speed enforcement program. SFPD Traffic Unit management report that when more officers are involved with traffic enforcement, the number of citations issued increases and traffic operations can involve a broader geographic area. SFMTA received the $2 million Active Transportation Program grant to implement the Safer Streets Campaign program to reduce speeding through increased enforcement on targeted corridors throughout the City. The Safer Streets Campaign program will provide 44 Light Detection and Ranging (LIDAR) units 15 to 15 LIDAR use a laser beam to measure distance and determine the speed of the vehicle. 14
15 traffic officers for a pilot targeting the City s top 11 high injury corridors. A safe road practices educational and outreach campaign for pedestrians, cyclists and drivers will accompany the speed enforcement effort. SFMTA, SFPD and DPH are preparing safety messaging and developing an enforcement approach. The program is distinct from the Department s current efforts in that it proposes a sustained speed enforcement effort throughout the high injury corridor. The program launched in October Support for Speed Cameras Excessive speed is the primary factor in fatal and injury collisions. However, automated speed enforcement is not currently legal in California 16. The Police and Health Commissions has issued resolutions in support of Vision Zero and automated speed enforcement. The San Francisco County Transportation Authority voted to recommend support for automated speed enforcement as San Francisco s key legislative Initiative in support of Vision Zero for the 2016 state legislative session. Reengineering Streets to Constrain Driver and Pedestrian Traffic Violations The National Highway Traffic Safety Administration (NHTSA), public health agencies, and transportation system planners have identified transportation system design (engineering) 17 that allows or encourages excessive driving speed, and insufficient or non-strategic traffic violation enforcement as primary causes of pedestrian collision injuries and fatalities including senior fatalities and injuries. One of the principle objectives of Vision Zero and Safe Streets programs nationwide is to reengineer streets and the pedestrian realm to reduce pedestrian vulnerability and the frequency and severity of pedestrian collisions. This approach reduces reliance on drivers and pedestrians to modify their behavior and instead constrains speed and other vehicle operations and conflicts that lead to pedestrian collisions. Table 8 below describes some of the most widely used reengineering strategies to increase pedestrian safety. 16 According to SFMTA, automated speed enforcement slows speeds by using fixed or mobile cameras and other equipment to detect and capture images of vehicles traveling at dangerous speeds. 17 This includes road layout, and design and engineering of crossing facilities. 15
16 Table 8: Major Engineering and Design Strategies to Reduce Pedestrian Collisions Engineering and Design Increase Pedestrian Clearance Intervals ADA compliant curb ramps Accessible Pedestrian Signals Raised Crosswalks Pedestrian Islands Speed humps and speed cushions Reduce number of lanes (Road Diet) Sidewalk Extensions and Bulb Outs Left Turn Bays and Lanes Left Turn Restrictions Left Turn Only Signals One Way Streets Leading Pedestrian Intervals Countdown Signals Purpose Increases time to cross the street, the primary concern for seniors and people with disabilities Allows disabled individuals to safely cross the street and a safe place to wait on the sidewalk Increases accessibility for visually impaired individuals by including audible tones, speech messages, and raised buttons Increases pedestrian visibility and drivers yielding to pedestrians Slows left turning traffic; provides pedestrian refuge Speed reduction Speed reduction Speed reduction: slows turning vehicles Eliminates vehicles waiting behind turning vehicles Eliminates left turn vehicle pedestrian conflicts Eliminates Vehicle-Pedestrian Conflicts Eliminates two way left turn conflicts Holds traffic for several seconds at start of pedestrian Walk phase allowing pedestrians to establish presence in intersection before turning traffic proceeds Tells pedestrians how much time they have to cross Increasing pedestrian visibility such as Daylighting prohibiting parking in advance of crosswalks Source: Vision Zero programs Boston, Seattle, San Francisco; Portland, New York, and NHTSA; National Complete Streets Coalition SFMTA Pedestrian Safety Capital Planning SFMTA s capital needs are included in the City s Capital Plan and referenced in the SFMTA s Capital Plan and Capital Implementation Program (CIP). Data developed by the Department of Public Health is used to direct pedestrian safety capital improvements to the highest injury locations including the High Injury Network. The City s pedestrian safety upgrades are typically integrated with various larger 16
17 SFMTA Capital projects thus a discreet estimate of expenditures to date and planned spending that specifically address pedestrian safety is not possible 18. Moreover, in a 2011 audit of SFMTA s Sustainable Streets Division, the Controller found that SFMTA inconsistently and inadequately monitors the status of its projects, potentially reducing the ability of project managers and SSD management to keep projects on budget and on schedule 19. Since that audit, the agency has implemented a project management system which will track projects currently and into the future; historical data is not available. According to DPH, project tracking is now done for all pedestrian safety projects on and off the Vision Zero High Injury Network and the data summarized and mapped annually. 20 The estimates that approximately $66,000,000 is budgeted for projects that specifically address pedestrian safety over the next five years including design and construction as seen in Table 10. These projects and funding sources are listed in Appendix B. Table 10: Estimated Expenditures on SFMTA Pedestrian Safety Projects (in millions) Total $18 $7 $12.3 $15.5 $13.5 $66.3 Source:, based on SFMTA data Best Practices in Senior Pedestrian Safety To gather information on best practices for senior pedestrian safety, we interviewed staff and reviewed Vision Zero reports from Portland, Boston, and New York City; reviewed additional best practices reports from Seattle and Washington D.C. and best practices literature from the National Highway Traffic Safety Administration (NHTSA), the National Complete Streets Coalition, Vision Zero Los Angeles Literature Review Collision Data Analysis, and The Alliance For Bicycling and Walking. Much of the literature and reporting on best practices focuses on New York, which was one of the first cities to adopt Vision Zero and to use descriptive and multivariate collision analysis to develop engineering and law enforcement responses to pedestrian collisions. In most instances senior pedestrian safety efforts are embedded in a broader law enforcement, engineering and design response to pedestrian collisions although some cities have an explicit senior 18 DPH Environmental Health Section report engineering project improvements on 12.7 miles of the High Injury Network in Since that audit finding, the agency has implemented a project management system called Ecosys. While Ecosys will track projects currently and into the future, it doesn t have historical data. 20 The summarized information includes number of miles of street segment improvement and instersection spot improvements completed. In 2015 a total of 10.2 miles of street segment improvements and 4.7 miles of intersection spot improvements were completed on the High Injury Network. Citywide there were 34.2 miles of completed engineering projects. 17
18 pedestrian safety program. These practices and programs largely fell into the following seven categories: 1. Identify and Map Locations of Senior Residential Concentrations and Senior Pedestrian Activity and Target These Areas And Corridors for Pedestrian Safety Improvements New York City Used census and collision data to identify Senior Pedestrian Focus Areas (SFPA), Naturally Occurring Retirement Communities (NORC) and location and characteristics of collisions involving seniors. In 2009 New York City s Department of Transportation developed its first SPFA, the Fordham- University Heights Senior Pedestrian Focus Area, and designated the area for improvements to pedestrian safety, particularly for senior citizens. Pedestrian collisions decreased 38 percent while all collisions with injuries decreased 32 percent after three years. Mapped pedestrian collisions involving victims 65 and older to identify clusters. Mapped senior housing and slated areas for pedestrian safety improvements Mapped Naturally Occurring Retirement Communities (NORCS) and made safety improvements on nearby arterials. Mapped facilities for visually impaired and slated areas for pedestrian safety upgrades 2. Funding and Programming Senior Pedestrian Safety Outside of Vision Zero New York City Areas with high senior pedestrian injuries can be funded for studies and redesign even when they lie outside Vision Zero priority areas. Boston (Safe Routes for Seniors) Identified safe routes for seniors in three targeted neighborhoods chosen based on ethnic diversity, resource need and high incidence of pedestrian collision. Portland ( Safe Routes to Senior Centers ) Engineers mapped the location of senior centers and identified physical barriers for removal and pedestrian safety enhancements to make it easier for seniors to walk to senior centers. 3. Outreach, Education & Partnership with Seniors, Senior Advocates and Senior Centers New York City The New York Department of Transportation and NYPD partner with senior centers and advocates for the visually and hearing impaired to increase communication and get input and feedback from seniors about needed street safety improvements, dangerous intersections and problem 18
19 locations, pedestrian safety and to offer special safety educational programs for seniors and the general public on senior pedestrian vulnerability. New York City Department of Transportation has developed Borough-level Pedestrian Safety Action Plans that include outreach and education for seniors within each borough s Priority Areas and along Priority Corridors. The DOT collaborates with the New York City Department for the Aging and Aging Committees on Community Boards and Age Friendly New York City. Portland A yard sign lender program allows residents to borrow signs that carry messaging advising drivers to watch for seniors and children 4. Restrict Left Turns New York City The New York City Department of Transportation analyzed pedestrian and bicycle crash data covering crashes from 2010 to 2014 and found that left turns account for more than twice as many pedestrian and bicyclist fatalities as right turns and over three times as many serious injuries and fatalities. The study found that seniors are more at risk: pedestrians and bicyclists killed by a left-turning vehicle have a median age of 67 while all other fatal crash types have a median age of 50. The study also found that left turn pedestrian and bicyclist injuries are concentrated in the same locations as pedestrian killed and seriously injured in general and that all left turn pedestrian and bicyclist injuries occur at 18 percent of total NYC intersection. In response New York s DOT has prioritized: Leading Pedestrian Intervals (LPIs): at school intersections and along Priority Corridors. Left Turn Traffic Calming Pilot: DOT is undertaking a 100-intersection pilot initiative to test new safer, slower left-turn design Left Turning Restrictions and Left Turn Signals: taking opportunities to incorporate either left turn restrictions or dedicated left turn signals into broader improvement projects. Public Information Campaign: The 3rd phase of the Your Choices Matter campaign will focus on pedestrian crashes at intersections. DOT will develop Turn Speed iconography to illustrate that turns should be taken at 5 mph and roll out a comprehensive failure to yield marketing effort in Fiscal Year Don t Cut Corners; Left Turn Pedestrian and Bicyclist Crash Study; August
20 5. Increase and Raise Visibility Of Enforcement / Aggressive Enforcement New York City Inform / Enforce Vision Zero Street teams are deployed to remind drivers of senior mobility issues followed by enforcement that targets areas identified as having high senior pedestrian travel volumes After police-led information campaign, neighborhoods with a high concentration of seniors receive enforcement operations that focus on Vision Zero citations. Boston Vision zero mock ticket warnings issued in lieu of tickets. Enforcement operation involves pedestrians, cyclists and drivers. High visibility enforcement campaigns against speeding, red light running, and failure to yield focused on high-crash locations Considering more police on high crash corridors including hospital locations, senior housing locations. Seattle High Visibility Enforcement Inform / Enforce approach is used in high crash locations targeting risky behaviors including distracted driving, impairment and speeding. 6. Crash Investigation Rapid Response Team Boston A multi-disciplinary Rapid Response Team will analyze and respond to every fatal crash in the city. The team will recommend appropriate street design changes, judicial or legislative follow up and community outreach. 7. Real Time Data Capture for Vision Zero Collision Analysis New York City The New York Police Department is moving to real time electronic data collection of collision data in coordination with the New York Department of Transportation to ensure that data is available quickly for collision trend analysis New York Department of Transportation staff indicate that the transition to fully electronic collision data capture has been slow and complicated but that the distribution of hand held devices is occurring. 20
21 Conclusion The City s Pedestrian Strategy committed the City to reducing serious and fatal pedestrian injuries by 50 percent by This strategy has been superseded by a Vision Zero plan to eliminate traffic deaths and severe injuries by DPH, SFPD and SFMTA have undertaken improvement of senior pedestrian safety through a variety of education, outreach, traffic enforcement and street safety engineering projects. While the City has implemented programs to increase pedestrian safety, the City needs to do more. San Francisco seniors are disproportionately affected in pedestrian collisions. While people 65 and older are only 14 percent of the city s population, they made up over one-third of the pedestrian deaths between 2005 and The number of injuries and deaths has not changed significantly over the past 10 years and San Francisco has the second highest rate of pedestrian injury and death after New York City. Policy Options In order to enhance the City s existing pedestrian safety programs especially for seniors, including improvements in data collection and analysis, and in enforcement, the Board of Supervisors should request: 1. The Chief of Police and SFMTA Director of Transportation to report to the Board of Supervisors and Police Commission by March 31, 2017 on the preliminary results of the first six months of the Safer Streets Campaign pilot program, including use by police officers of LIDAR enforcement Safe Streets pilot project to enforce speed limits. 2. The Chief of Police to report to the Board of Supervisors and Police Commission by March 31, 2017 on achievement of the Focus on Five goals by police district, and if the goals are not achieved, a plan (including specific police district actions) to meet the goals. 3. The Chief of Police, Director of Public Health and SFMTA s Director of Transportation to increase traffic calming and public education projects in neighborhoods, and around intersections and streets with high concentration of senior pedestrians. For example, If the senior pedestrian injury mapping that the Sustainable Streets Division is undertaking indicates that senior serious injury collisions and deaths are occurring on streets and corridors outside the High Injury Network or on streets that currently do not meet the program s guidelines, the Board may want to request SFMTA and SFPD to implement traffic calming enforcement and engineering strategies appropriate for these streets, corridors and intersections. 4. The SFMTA s Director of Transportation and the chair of the Vision Zero Task Force Evaluation and Data Subcommittee to expand on the pedestrian safety data analysis presented in the March 2014 report Walk First A Step 21
22 Towards Vision Zero, and to analyze the data gathered as part of the Safe Speed Campaign, and present to the Board of Supervisors by March 31, 2017 a comprehensive and detailed study similar to New York Department of Transportation s left turn pedestrian and cyclist crash study that includes (1) key findings on degree of injury, frequency of collisions, victim and driver age and gender, location, intersection characteristics, vehicle type etc. (2) a prioritized Action/ Treatment Plan or detailed description of treatments underway and (3) plans for evaluation of the results of treatments. 5. The Chair of the Vision Zero Task Force Evaluation and Data Subcommittee to report to the Board of Supervisors by March 31, 2017 on the transportationrelated Injury Surveillance System progress on resolving inaccuracy of pedestrian collision data and other data quality issues. 6. The SFMTA Director of Transportation to provide up to date and consolidated information to the Board of Supervisors by March 31, 2017 on WalkFirst, Safe Streets for Seniors and other pedestrian safety capital projects completed to date and publish this information on the Vision Zero interactive map. 22
23 APPENDIX A: City Policies to Promote Pedestrian Safely Official City policy gives priority to pedestrians, public transit and cyclists Since 1973, a series of city policies, code amendments and strategic plans have repeatedly mandated that the design and operation of the city s transportation system give priority to pedestrians and public transit. Transit First: In 1973 the Board of Supervisors adopted the "Transit First Policy" amending the City Charter to establish priority for pedestrians, cyclists and public transit in the use of public rights of way. Better Streets Policy 23 : In 2006, the Board of Supervisors adopted the Better Streets Policy adding Chapter 98 to the Administrative Code that states Decisions regarding the design and use of the city s limited public street space shall prioritize space for pedestrians, bicycles, and public transit over space for automobiles. Better Streets Plan: In 2010, the Board of Supervisors adopted the Better Streets Plan amending the Municipal Code and General Plan to provide design guidance and regulations intended to calm traffic and decrease pedestrian injuries and fatalities. Pedestrian Strategy: In April 2013, Mayor Lee issued the Pedestrian Strategy directing City departments to implement solutions to reduce serious or fatal pedestrian injuries by 25 percent by 2016 and by 50 percent by 2021, increase the walkability of San Francisco and make all neighborhoods safer for pedestrians. Walk First: In March 2014, a Pedestrian Safety Improvement Capital Program was established to prioritize capital improvements needed over the next 5 years to make the city safer for pedestrians. Vision Zero: In 2014 the Board of Supervisors adopted Vision Zero as a policy to eliminate all traffic deaths in San Francisco by The Mayor s Executive Directive of August 2016 directs SFMTA to accelerate Vision Zero and Bicycle Strategy project delivery. 23 Public Works Code Section directs the City to include pedestrian, bicycle, and streetscape improvements as part of any planning or construction in the public right-of-way. 23

24 2005 Appendix B: Maps of Senior (60 and older) Pedestrian Fatal and Severe Injury Collisions 2005 to 2012 a a From Statewide Integrated Traffic Records System. More than one fatality or injury occurred in some locations. 24
25
26
27
28
29
30
31
MEMORANDUM. City Constituents. Leilani Schwarcz, Vision Zero Surveillance Epidemiologist, SFDPH
 MEMORANDUM TO: FROM: CC: City Constituents Leilani Schwarcz, Vision Zero Surveillance Epidemiologist, SFDPH Megan Wier, Co-Chair, San Francisco Vision Zero Task Force, SFDPH Commander Ann Mannix, Traffic
VISION ZERO: ELIMINATING TRAFFIC DEATHS BY 2024 MARCH 2015
 Through Vision Zero SF we commit to working together to prioritize street safety and eliminate traffic deaths in San Francisco by 2024 VISION ZERO: ELIMINATING TRAFFIC DEATHS BY 2024 MARCH 2015 VISION
City of San Diego Vision Zero Draft Strategic Plan FY 2017
 City of San Diego Vision Zero Draft Strategic Plan FY 2017 Engineering Objective: To develop and implement a strategy that employs best planning, design and engineering practices. Background: Over the
Citizens Advisory Committee March 26, 2014
 Memorandum 0..1 Citizens Advisory Committee March, 1 Citizens Advisory Committee Maria Lombardo Chief Deputy for Policy and Programming Elizabeth Sall Interim Deputy Director for Planning Vision Zero Committee
Pedestrian Safety Workshop SAN FRANCISCO, CALIFORNIA
 Pedestrian Safety Workshop 02 15 2011 SAN FRANCISCO, CALIFORNIA 1 Agenda Walking in San Francisco Accomplishments and Current Pedestrian Activities Mayor s Pedestrian Safety Executive Directive Next Steps
Focus on Enforcement. 7/21/2017 Presentation to SFMTA Policy & Governance Committee. Joe Lapka Corina Monzón
 Focus on Enforcement Insights from research and analysis in support of San Francisco s Vision Zero plan to eliminate traffic deaths Joe Lapka Corina Monzón 7/21/2017 Presentation to SFMTA Policy & Governance
San Francisco Pedestrian Safety Capital Improvement Program: A Step Towards Vision Zero
 San Francisco Safety Capital Improvement Program: A Step Towards Vision Zero March 5, 2014 The First Steps In April 2013, Mayor Lee issued the Strategy which directed City departments to implement solutions
Pedestrian injuries in San Francisco: distribution, causes, and solutions
 Pedestrian injuries in San Francisco: distribution, causes, and solutions Presentation to the San Francisco Health Commission RAJIV BHATIA, MD, MPH DIRECTOR OF OCCUPATIONAL AND ENVIRONMENTAL HEALTH, SAN
Closing Plenary Session
 TRAFFIC SAFETY CONFERENCE Closing Plenary Session June 9, 2017 Las Colinas, TX Order of Report Out June 9, 2017 Las Colinas, TX Distracted Driving Prioritized Countermeasures Countermeasure 4a Systemically
CITY AND COUNTY OF SAN FRANCISCO BOARD OF SUPERVISORS. Policy Analysis Report
 CITY AND COUNTY OF SAN FRANCISCO BOARD OF SUPERVISORS BUDGET AND LEGISLATIVE ANALYST 1390 Market Street, Suite 1150, San Francisco, CA 94102 (415) 552-9292 FAX (415) 252-0461 Policy Analysis Report To:
2019 ACTION STRATEGY UPDATE. March 19, 2019
 1 REPORT TO THE HEALTH COMMISSION 2019 ACTION STRATEGY UPDATE March 19, 2019 SAN FRANCISCO ADOPTED VISION ZERO IN 2014 2 3 23 TRAFFIC-RELATED DEATHS IN 2018 45 40 35 30 25 20 15 10 5 0 11 2 15 2 14 15
NYC Pedestrian Safety Study & Action Plan. NYTMC Brown Bag Lunch Presentation December 15, 2010
 NYC Pedestrian Safety Study & Action Plan NYTMC Brown Bag Lunch Presentation December 15, 2010 1 Introduction DOT Safety Goal Strategic Plan: Reduce Fatalities by 50% by 2030 From 274 (2007) to 137 (2030)
Walking in Traffic Violence. The pervasiveness of motor vehicle crashes with pedestrians in New York City
 Walking in Traffic Violence The pervasiveness of motor vehicle crashes with pedestrians in New York City 2 Walking in Traffic Violence New York City is a walking and public transit city. We are proud of
VISION ZERO UPDATE JUNE 2, 2016
 Through Vision Zero SF we commit to working together to prioritize street safety and eliminate traffic deaths in San Francisco by 2024 VISION ZERO UPDATE JUNE 2, 2016 1 TRAFFIC FATALITIES - 2015 31 people
VISION ZERO SAN FRANCISCO
 K VISION ZERO SAN FRANCISCO Two-Year Action Strategy 2017 2018 ELIMINATING TRAFFIC DEATHS IN OUR CITY CONTENTS 2 3 4 5 6 8 11 12 13 14 15 Contents and Introduction Message from Mayor Ed Lee Our Two-Year
8. Collisions INTRODUCTION
 8. Collisions INTRODUCTION While traffic collisions can affect anyone, they have a disproportionate impact on bicyclists, who along with pedestrians are the most vulnerable users of the transportation
NYC Pedestrian Safety Study & Action Plan. Research, Implementation & Safety Division of Traffic Operations
 NYC Pedestrian Safety Study & Action Plan Research, Implementation & Safety Division of Traffic Operations 1 Introduction DOT Safety GOAL Strategic Plan: Reduce Fatalities by 50% by 2030 From 274 (2007)
TASK FORCE UPDATE MARCH 29, 2016
 Through Vision Zero SF we commit to working together to prioritize street safety and eliminate traffic deaths in San Francisco by 2024 MARCH 29, 2016 1 WHY WE RE HERE We never planned on losing our son.
UPDATES, SUCCESSES, AND WHAT S AHEAD ON THE ROAD TO ZERO
 Vol. 1, Issue 1 I Spring 2018 www.planhillsborough.org/vision-zero S A F E S T R E E T S N O W H I L L S B O R O U G H UPDATES, SUCCESSES, AND WHAT S AHEAD ON THE ROAD TO ZERO TRACKING PROGRESS This is
Data Analysis February to March Identified safety needs from reported collisions and existing travel patterns.
 Welcome! Thank you for participating in today s Valencia Bikeway Improvements workshop. Data Analysis February to March Identified safety needs from reported collisions and existing travel patterns. Initial
FINAL PLAN APPENDIX D CITY OF BERKELEY BIKE PLAN D-1
 CITY OF BERKELEY BIKE PLAN D-1 . Proposed Programs D.1. EDUCATION This appendix presents the recommended bicycle-related programs for the City of Berkeley. The recommendations are organized in four E s:
VISION ZERO SF: ELIMINATING TRAFFIC DEATHS BY 2024 JANUARY 5, 2017
 Through Vision Zero SF we commit to working together to prioritize street safety and eliminate traffic deaths in San Francisco by 2024 VISION ZERO SF: ELIMINATING TRAFFIC DEATHS BY 2024 JANUARY 5, 2017
AUTOMATED SPEED ENFORCEMENT: REDUCING SPEED TO SAVE LIVES
 Through Vision Zero SF we commit to working together to prioritize street safety and eliminate traffic deaths in San Francisco by 2024 AUTOMATED SPEED ENFORCEMENT: REDUCING SPEED TO SAVE LIVES INTRODUCING
Pedestrian and Bicycle Improvements in Balboa Park Station Area
 Pedestrian and Bicycle Improvements in Balboa Park Station Area Jamie Parks & Jen Wong, SFMTA, Livable Streets December 15, 2015 Balboa Park Station CAC Monthly Meeting Vision Zero SF Zero traffic deaths
Existing Pedestrian Conditions. PSAC February 8, 2011
 Existing Pedestrian Conditions PSAC February 8, 2011 Contents 1. Project Background & Goals 2. Pedestrian Activity: Where people walk 3. Pedestrian Safety: The conditions people face Project Background
Focus on Enforcement. 3/14/2017 Presentation to the Vision Zero Taskforce. Joe Lapka Corina Monzón
 Focus on Enforcement Insights from research and analysis in support of San Francisco s Vision Zero plan to eliminate traffic deaths Joe Lapka Corina Monzón 3/14/2017 Presentation to the Vision Zero Taskforce
EMPHASIS AREA 1: PEDESTRIANS
 EMPHASIS AREA 1: PEDESTRIANS A pedestrian is seriously injured or killed every 3 days on Toronto s roads. Pedestrian collisions involve any person that is not riding in a vehicle or on a bicycle. 26% OF
Why Zone In on Speed Reduction?
 Learn it. Do it. Live it! SPEED REDUCTION IN THE ZONE Why Zone In on Speed Reduction? Speeding is a serious issue that plays a major role in the risk of serious injury and pedestrian fatality in a crash.
2/25/2015. The Best of Pro Walk Pro Bike Pro Place Continuing Education. Today s presenters
 The Best of Pro Walk Pro Bike Pro Place 2014 For technical assistance during the webinar, call 1 800 263 6317 Choose these audio prompts: 2, 1 February 25, 2015 Continuing Education To document Professional
BD RESOLUTION NO RESOLUTION ADOPTING THE VISION ZERO RAMP INTERSECTION STUDY PHASE 1
 BD00 RESOLUTION NO. - RESOLUTION ADOPTING THE VISION ZERO RAMP INTERSECTION STUDY PHASE [NTIP PLANNING] FINAL REPORT WHEREAS, The Vision Zero Ramp Intersection Study Phase was recommended by Commissioner
Bicycle Master Plan Goals, Strategies, and Policies
 Bicycle Master Plan Goals, Strategies, and Policies Mobilizing 5 This chapter outlines the overarching goals, action statements, and action items Long Beach will take in order to achieve its vision of
BIKE PLAN CONTENTS GATEWAY
 CONTENTS Acknowledgments...vii Great Rivers Greenway District Board of Directors... vii Great Rivers Greenway District Staff... vii Project Consultants... vii Committees... viii Citizens Advisory Committee
CHAPTER 7.0 IMPLEMENTATION
 CHAPTER 7.0 IMPLEMENTATION Achieving the vision of the Better Streets Plan will rely on the ability to effectively fund, build and maintain improvements, and to sustain improvements over time. CHAPTER
Vision Zero Priority Projects (March 2017)
") Key in 201 or of Key Potrero Ave., from Division to Cesar Chavez Begin Construction Spring 201 Winter 201 Achieved Safety measures include dedicated transit lane, sidewalk widening, buffers for existing
Key in 201 or of Key Potrero Ave., from Division to Cesar Chavez Begin Construction Spring 201 Winter 201 Achieved Safety measures include dedicated transit lane, sidewalk widening, buffers for existing
VISION ZERO: What will it take?
 1 Through Vision Zero SF we commit to working together to prioritize street safety and eliminate traffic deaths in San Francisco. VISION ZERO: What will it take? Tom Maguire, Director, Sustainable Streets
Vision Zero & ITE. April 11, Toole Design Group. Jason DeGray, P.E., PTOE. Vision Zero & ITE
 Jason DeGray, P.E., PTOE Toole Design Group April 11, 2017 What is Vision Zero? Traffic deaths and serious injuries are preventable and unacceptable Human life takes priority over mobility Human error
Welcome! San Jose Avenue Open House August 25, 2015
 Welcome! San Jose Avenue Open House August 25, 2015 Vision Zero The City and County of San Francisco adopted Vision Zero San Francisco Vision Zero High Injury Network as a policy in 2014, committing an
State of Vision Zero 2015
 State of Vision Zero 2015 San Francisco May 2016 Contents 1 2 3 4 5 6 7 8 Overview and By the Numbers Looking Back at 2015 The High-Injury Network Engineering Enforcement Education Evaluation Policy Message
Data Analysis February to March Identified safety needs from reported collisions and existing travel patterns.
 Welcome! Thank you for participating in today s Valencia Bikeway Improvements workshop. Data Analysis February to March Identified safety needs from reported collisions and existing travel patterns. Initial
PEDALING FORWARD. A Glance at the SFMTA s Bike Program for SFMTA.COM
 PEDALING FORWARD A Glance at the SFMTA s Bike Program for 2017-2021 SFMTA.COM INTRODUCTION About This Booklet More people from all walks of life see their bicycle as a more convenient way to get where
CITY OF COCOA BEACH 2025 COMPREHENSIVE PLAN. Section VIII Mobility Element Goals, Objectives, and Policies
 CITY OF COCOA BEACH 2025 COMPREHENSIVE PLAN Section VIII Mobility Element Goals, Objectives, and Policies Adopted August 6, 2015 by Ordinance No. 1591 VIII MOBILITY ELEMENT Table of Contents Page Number
Vision Zero: No more traffic deaths on Berkeley streets
 Vision Zero: No more traffic deaths on Berkeley streets Image courtesy of Fehr & Peers Farid Javandel, Transportation Division Manager Beth Thomas, Principal Planner, Transportation Division 1 Presentation
Fiscal Year Budget Overview
 Fiscal Year 2015-2016 Budget Overview Investing in Transportation for Today and Tomorrow Ed Reiskin Director of Transportation APRIL 1, 2014 San Francisco: great city, excellent transportation choices
Creating a Successful Pedestrian Safety Campaign. St. Paul, MN
 Creating a Successful Pedestrian Safety Campaign St. Paul, MN - 2015-2017 The Problem The Problem A pedestrian or bicyclist is struck by a vehicle every other day in St. Paul (.84 per day) This doesn t
Agenda. Overview PRINCE GEORGE S PLAZA METRO AREA PEDESTRIAN PLAN
 PRINCE GEORGE S PLAZA METRO AREA PEDESTRIAN PLAN May 28, 2008 Agenda Welcome and introductions Project overview and issue identification Planning context and strengths Design challenges and initial recommendations
Pinellas County Safety Initiatives
 Florida Department of TRANSPORTATION Pinellas County Safety Initiatives Whit Blanton, FAICP Pinellas County MPO A Distinctive County A unique geography Multi-jurisdictional Key demographics seniors and
The DC Pedestrian Master Plan
 The DC Pedestrian Master Plan September 28, 2010 George Branyan Pedestrian Program Coordinator District Department of Transportation Presentation Agenda Scope of the Plan Methodology Recommendations Implementation
City of Stamford, Vision Zero Planning Study-Education
 City of Stamford, Vision Zero Planning Study-Education Review of National Best Practices Frank Petise (City of Stamford) Sandeep Aysola (Yale School of Forestry & Environmental Studies/ CDM Smith Inc.)
Proposed. City of Grand Junction Complete Streets Policy. Exhibit 10
 Proposed City of Grand Junction Complete Streets Policy Exhibit 10 1 City of Grand Junction Complete Streets Policy Vision: The Complete Streets Vision is to develop a safe, efficient, and reliable travel
2. Vision & Goals. Vision. Santa Rosa is a community where walking and bicycling are comfortable and convenient for people of all ages and abilities.
 2. Vision & Goals Overview The goals of the Santa Rosa Bicycle and Pedestrian Master Plan Update reflect the priorities expressed by the community throughout the public outreach phase of this Plan Update.
Vision Zero San Jose. Moving toward zero traffic deaths and providing safe streets for all
 Vision Zero San Jose Moving toward zero traffic deaths and providing safe streets for all SPUR San Jose April 4, 2017 Source: Vision Zero Network Vision Zero Core Principles 1. Traffic deaths are preventable
PEDESTRIAN ACTION PLAN
 ATTACHMENT 2 CITY OF SANTA MONICA PEDESTRIAN ACTION PLAN CITY OF SANTA MONICA PEDESTRIAN ACTION PLAN This page intentionally left blank EXECUTIVE SUMMARY CHAPTER 1 EXECUTIVE SUMMARY Setting the Stage
POLICY STATEMENT: VISION ZERO
 Overview of APBP Policy Statements POLICY STATEMENT: VISION ZERO The Association of Pedestrian and Bicycle Professionals (APBP) supports the community of professionals working to create more walkable,
IMPLEMENTATION CHAPTER Identifying Priorities 7.2 Maintenance 7.3 Funding 7.4 Education and Enforcement IMPLEMENTATION
 CHAPTER 7.0 IMPLEMENTATION 7.1 Identifying Priorities 7.2 Maintenance 7.3 Funding 7.4 Education and Enforcement IMPLEMENTATION Achieving the vision of the Better Streets Plan will rely on the ability to
Beaverton Police Department Traffic Safety Team
 Traffic Safety Team November 1, 2010 Executive Summary The Beaverton Police Department takes pride in the distinction as being one of the safest cities in the northwest. Being a safe city is more than
Chapter 2. Bellingham Bicycle Master Plan Chapter 2: Policies and Actions
 Chapter 2 Bellingham Bicycle Master Plan Chapter 2: Policies and Actions Chapter 2: Policies and Actions The Bicycle Master Plan provides a road map for making bicycling in Bellingham a viable transportation
ADA Transition Plan. City of Gainesville FY19-FY28. Date: November 5, Prepared by: City Of Gainesville Department of Mobility
 ADA Transition Plan FY19-FY28 Date: November 5, 2018 Prepared by: City Of Gainesville Department of Mobility 1.0 INTRODUCTION 1.1 BACKGROUND The federal statute known as the Americans with Disabilities
CITY OF SAINT JOHN TRAFFIC CALMING POLICY
 CITY OF SAINT JOHN TRAFFIC CALMING POLICY VERSION: 1.0 April 10, 2012 Pedestrians, Cyclists and Motorists Sharing Street Spaces CONTENTS INTRODUCTION... 3 POLICY GOAL... 3 POLICY OBJECTIVES... 3 GUIDING
May 12, 2016 Metro Potential Ballot Measure Issue Brief: Local Return
 Summary: Local return is an important revenue source for cities to maintain their local transportation infrastructure. Most cities use their local return to operate small bus systems and repave streets,
WHERE SAN FRANCISCO STANDS IN ACHIEVING VISION ZERO
 WHERE SAN FRANCISCO STANDS IN ACHIEVING VISION ZERO YEAR ONE PROGRESS REPORT Released by the Vision Zero Coalition, February 2015. ABOUT the vision zero coalition COALITION The goal of Vision Zero is to
SAN FRANCISCO MUNICIPAL TRANSPORTATION AGENCY
 THIS PRINT COVERS CALENDAR ITEM NO. : 10.2 DIVISION: Sustainable Streets BRIEF DESCRIPTION: SAN FRANCISCO MUNICIPAL TRANSPORTATION AGENCY Adopting Conceptual Proposal for Streetscape Improvements to Broadway,
CTDOT Pedestrian and Bicycle Safety Initiatives
 CTDOT Pedestrian and Bicycle Safety Initiatives 2017 Northeast Transportation Safety Conference Mark F. Carlino, P.E. Traffic Engineering Division Chief Bureau of Engineering and Construction Connecticut
Toward Zero Deaths. Regional SHSP Road Show Meeting. Virginia Strategic Highway Safety Plan. presented by
 Toward Zero Deaths Regional SHSP Road Show Meeting presented by Virginia Strategic Highway Safety Plan December 1, 2016 1 Welcome & Introductions Purpose of the Meeting Objectives & Key Outcomes Agenda»
San Francisco 2009 Collisions Report April 21, 2011
 San Francisco 29 Collisions Report April 21, 211 City and County of San Francisco San Francisco Municipal Transportation Agency 1 South Van Ness Avenue, 7 th Floor San Francisco CA 9413 CONTENTS About
A Survey of Planning, Design, and Education for Bikeways and Bus Routes on Urban Streets
 A Survey of Planning, Design, and Education for Bikeways and Bus Routes on Urban Streets, Community & Economic Development Agency, Transportation Services Division (510) 238-3983 bikeped@oaklandnet.com
Chapter PERFORMANCE MEASURES AND ACCOUNTABILITY. Introduction
 PERFORMANCE MEASURES AND ACCOUNTABILITY Introduction Performance measures are helpful in evaluating the progress being made toward achieving the goals and objectives of the Gateway Bicycle Plan. The Plan
SAN FRANCISCO MUNICIPAL TRANSPORTATION AGENCY
 THIS PRINT COVERS CALENDAR ITEM NO. : 11 DIVISION: Sustainable Streets BRIEF DESCRIPTION: SAN FRANCISCO MUNICIPAL TRANSPORTATION AGENCY Approving traffic modifications on Twin Peaks Boulevard between Christmas
April 30 th, Reducing the Risks to Child Pedestrians
 April 30 th, 2018 Reducing the Risks to Child Pedestrians Technical Tips Audio is broadcast through computer speakers Download resources in the File Share pod (above the slides) If you experience audio
Oakland Pedestrian Master Plan Oakland Pedestrian Plan Draft Recommendations Chapter Outline
 EISEN LETUNIC T R A N S P O R T A T I O N, ENVIRO N M E N TA L A N D URBAN PLANNIN G MEMORANDUM To Oakland Pedestrian Plan Technical Advisory Committee & Pedestrian Advisory Group From Victoria Eisen Date
Borough of Danville, PA Traffic Calming Program Guidelines
 Borough of Danville, PA Traffic Calming Program Guidelines Adopted by Borough Council on 1 INTRODUCTION Speeding Traffic is a major concern in the Borough of Danville because of its detrimental impacts
TOWN OF PORTLAND, CONNECTICUT COMPLETE STREETS POLICY
 TOWN OF PORTLAND, CONNECTICUT COMPLETE STREETS POLICY I. VISION, GOALS & PRINCIPLES VISION To improve the streets of Portland making them safer and more accessible for all users including pedestrians,
MEET IN THE STREET MOVING TO ZERO
 WE MEET IN THE STREET MOVING TO ZERO Tips for sharing the street Traffic deaths are preventable. We need your help getting the message out. 2 A NEW PLAN A NEW PLAN Philadelphia is proud to adopt Vision
City of Ann Arbor Pedestrian Safety & Access Task Force
 City of Ann Arbor Pedestrian Safety & Access Task Force (PSATF) Community Wide Meeting Wednesday, July 8th 6:30 to 8:30 PM Multi purpose Room, Downtown Library www.a2gov.org/pedsafety The Greenway Collaborative,
Development of Arlington County s Marked Crosswalk Guidelines. Jon Lawler, P.E. Design Engineer Arlington County, VA
 Development of Arlington County s Marked Crosswalk Guidelines Jon Lawler, P.E. Design Engineer Arlington County, VA April 13, 2015 Transportation System Users Residents Estimated 215,000 in 2014 Lowest
WALKNBIKE DRAFT PLAN NASHVILLE, TENNESSEE EXECUTIVE SUMMARY NASHVILLE, TENNESSEE
 NASHVILLE, TENNESSEE EXECUTIVE SUMMARY Executive Summary A world-class multi-modal transportation system is essential to a vibrant city and better quality of life. -Mayor Barry The WalknBike plan aims
Living Streets Policy
 Living Streets Policy Introduction Living streets balance the needs of motorists, bicyclists, pedestrians and transit riders in ways that promote safety and convenience, enhance community identity, create
CITY OF ANN ARBOR TRAFFIC CALMING PROGRAM PROCESS OVERVIEW. Petitioner defines the project area limits and gathers petition signatures.
 CITY OF ANN ARBOR TRAFFIC CALMING PROGRAM PROCESS OVERVIEW Step 1: Petition Petitioner defines the project area limits and gathers petition signatures. 50% of addresses within the project area must sign
BETHEL ROAD AND SEDGWICK ROAD CORRIDOR STUDY
 DRAFT PLAN City Council Meeting August 14, 2017 STUDY AREA Sedgwick Corridor State Route 160, principal arterial with Class 3 access management designation, commuter and freight route, connection to SR
Madison Urban Area and Dane County. Bicycle Transportation Plan Summary. September Introduction. Bicycle Plan Scope and Planning Process
 Bicycle Transportation Plan Summary Madison Urban Area and Dane County Introduction September 2000 Bicycling is an important mode of transportation in the Madison urban area and countywide that is available
4. Transportation Safety
 4. Transportation Safety INTRODUCTION Safety is a key measure of the quality of the region s transportation system. In 2005, the federal legislation Safe, Accountable, Flexible, Efficient Transportation
REGIONAL BICYCLE AND PEDESTRIAN DESIGN GUIDELINES
 REGIONAL BICYCLE AND PEDESTRIAN DESIGN GUIDELINES November 16, 2011 Deb Humphreys North Central Texas Council of Governments Bicycle and Pedestrian Advisory Committee Snapshot of the Guide 1. Introduction
About the Active Transportation Alliance
 About the Active Transportation Alliance Chicagoland s voice for better biking, walking and transit Founded 1985 7,000 members, ~33 full time staff Serve Chicago metro region 1 More Cars, More Driving
City of Elizabeth City Neighborhood Traffic Calming Policy and Guidelines
 City of Elizabeth City Neighborhood Traffic Calming Policy and Guidelines I. Purpose: The City of Elizabeth City is committed to ensure the overall safety and livability of residential neighborhoods. One
Residential Traffic Calming Program Guide. Town of Ashland, Virginia
 Residential Traffic Calming Program Guide Town of Ashland, Virginia August 1, 2006 TABLE OF CONTENTS A. INTRODUCTION... 1 B. GOALS... 1 C. CRITERIA... 1 D. IDENTIFYING NEIGHBORHOOD TRAFFIC CONCERNS...
APPENDIX F. Safety Planning. October 2018
 APPENDIX F Safety Planning October 2018 APPENDIX F: SAFETY PLANNING October 17, 2018 ABOUT VISUALIZE 2045 & THE TPB Visualize 2045 is the federally required long-range transportation plan for the National
CITY OF LOS ANGELES INTER-DEPARTMENTAL MEMORANDUM
 CITY OF LOS ANGELES INTER-DEPARTMENTAL MEMORANDUM Date: December 12,2011 To: Honorable City Council c/o City Clerk, Room 395, City Hall Attention: Honorable Bill Rosendahl, Chair, Transportation Committee
Northbound San Jose Avenue & I-280 Off-Ramp Road Diet Pilot Project
 Project Overview Fed by a two-lane Interstate-280 (I-280) off-ramp, high vehicular volumes and speeds are longstanding issues along San Jose Avenue. Residents in the surrounding neighborhoods have expressed
Vulnerable Road Users Safety: What Cities Can Do To Make Things Better?
 Vulnerable Road Users Safety: What Cities Can Do To Make Things Better? Transportation Research Board Webinar September 27, 2016 Robert Hull, Cambridge Systematics, Inc. The Issue Today NHTSA 2015 estimates:
TRAFFIC ACTION PLAN. Laurie Meadows Neighborhood CITY OF SAN MATEO
 TRAFFIC ACTION PLAN Laurie Meadows Neighborhood CITY OF SAN MATEO Draft January 2017 Table of Contents Introduction... 2 The Traffic Forum Process... 5 Neighborhood Traffic Issues... 7 Neighborhood Recommendations
VISION ZERO ACTION PLAN
 PALM BEACH Transportation Planning Agency VISION ZERO ACTION PLAN TPA Advisory Committee Meetings March 2019 PURPOSE Present the Data Analysis Key Findings and the Action Items from the Draft Action Plan
Traffic Calming Policy
 Article I. Purpose and Goal. The purpose of this policy is to establish criteria and procedures the City will use to evaluate requests for, and if appropriate, implement traffic calming measures. Neighborhood
Pedestrian Safety: A Federal Perspective. Emmett McDevitt Transportation Safety Engineer September 28, 2010
 Pedestrian Safety: A Federal Perspective Emmett McDevitt Transportation Safety Engineer September 28, 2010 Pedestrian Fatalities by Year in US (1997-2009) 6,000 5,000 4,000 3,000 2,000 1,000 0 1997 1998
STREET SCORE Annual Report Card on Walking. Photo by: Dino Duazo
 STREET SCORE 2015 Annual Report Card on Walking Photo by: Dino Duazo ACKNOWLEDGMENTS This report was written by Walk San Francisco in April 2015. Special thanks to Jillian Nameth for designing the report,
City of Oakland Mayor's Commission on Persons with Disabilities (MCPD) Monday, February 26, Minutes
 Monday, February 26, Minutes") City of Oakland Mayor's Commission on Persons with Disabilities (MCPD) Monday, February 26, 2018 I. Call to Order at 5:34 p.m. Minutes II. Roll Call 9 Commissioners present: Garner, Gregory, Harrington,
City of Oakland Mayor's Commission on Persons with Disabilities (MCPD) Monday, February 26, 2018 I. Call to Order at 5:34 p.m. Minutes II. Roll Call 9 Commissioners present: Garner, Gregory, Harrington,
Corpus Christi Metropolitan Transportation Plan Fiscal Year Introduction:
 Introduction: The Safe, Accountable, Flexible, Efficient Transportation Equity Act: A Legacy for Users (SAFETEA-LU) has continued the efforts started through the Intermodal Surface Transportation Efficiency
DEPARTMENT OF ENVIRONMENTAL SERVICES. North Harrison Street (Lee Highway to Little Falls Road) Comparative Analysis. Prepared for:
 Comparative Analysis. Prepared for:") DEPARTMENT OF ENVIRONMENTAL SERVICES North Harrison Street (Lee Highway to Little Falls Road) Comparative Analysis Prepared for: Arlington County Department of Environmental Services 2100 Clarendon Boulevard,
DEPARTMENT OF ENVIRONMENTAL SERVICES North Harrison Street (Lee Highway to Little Falls Road) Comparative Analysis Prepared for: Arlington County Department of Environmental Services 2100 Clarendon Boulevard,
Caltrans Sloat Boulevard Pedestrian Safety Project Response to Community Questions, Comments & Concerns
 Caltrans Sloat Boulevard Pedestrian Safety Project Response to Community Questions, Comments & Concerns Revised: May 10, 2016 The California Department of Transportation (Caltrans) is planning various
Neighborhood Slow Zone Program Application
 Neighborhood Slow Zone Program Application 2018-2019 Promoting traffic safety on neighborhood streets Applications due by Friday, January 18, 2019 Jointly led by Managing Director s Office of Transportation,
Pedestrian Project List and Prioritization
 To: Kyle Wagenschutz, City of Memphis CC: From: Anne Conlon and John Cock, Alta Planning + Design Date: December, 2014 Re: Project List Development (Task 3.1-3.2) and Project List Prioritization (Task
Vision Zero Richmond Action Plan
 Vision Zero Richmond Action Plan COVER Acknowledgements This Vision Zero Action Plan was prepared by the Safe and Healthy Streets Commission and with numerous partners committed to safety in Richmond,