Background and Goals of SRTS
|
|
|
- Octavia Morgan
- 5 years ago
- Views:
Transcription

1 Safe Routes to School Background and Goals of SRTS Oklahoma Kick-off May 4, 2011


2 The Good, the Bad, and the Ugly

3 Fewer kids are biking and walking More parents are driving % walked or biked 13% walked or biked 12% driven 44% driven (U.S. DOT, 2009)

4 Parents driving Parents driving their children to school account for up to 25% of morning rush hour traffic. (Parisi Associates, 2003; Morris, 2001)
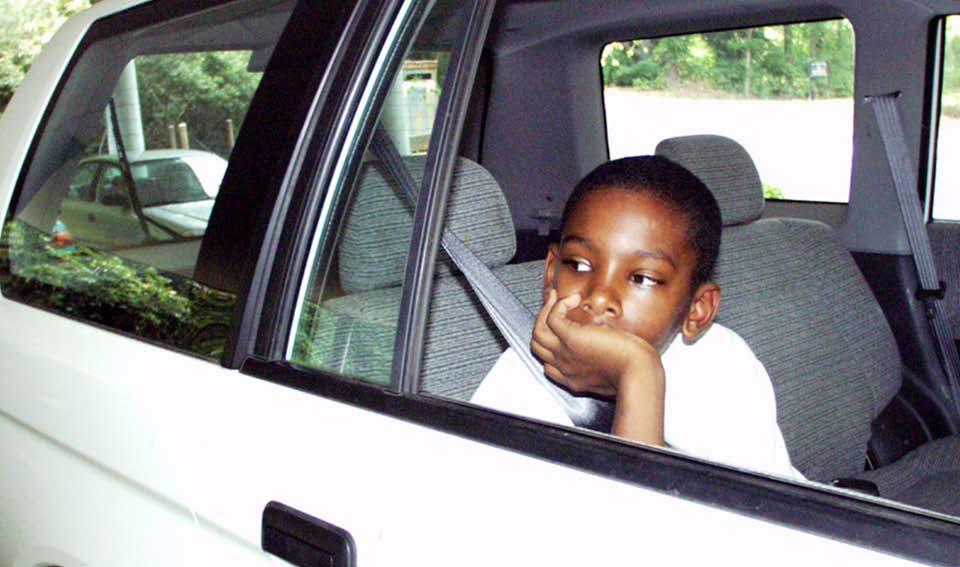
5 The consequences of this

6 instead of this can be alarming.

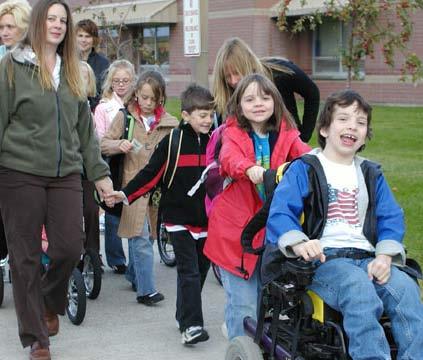
7 Promoting safe walking and bicycling is an ideal strategy to increase physical activity

8 Safe Routes to School programs Make walking and bicycling safe ways to get to school Encourage more children to walk and bike to school


9 History of Safe Routes to School Many child pedestrian fatalities in Denmark during the 1970s Odense reduced the number of injured school children by 30% - 40% Spread to the UK and Canada in the 1990s; Bronx, NY in 1997
10 Benefits of SRTS programs Improve safety for pedestrians and bicyclists Reduce traffic congestion around schools Reduce emissions Improve children s health
11 Other benefits of SRTS programs Cost savings for schools (reduce need for hazard busing) Teach fundamental safety skills Benefit local economy Strengthen family bonds Increase child s sense of freedom and responsibility Provide more transportation options for everyone

12 The Ugly: Today s barriers to walking and bicycling

13 How did we get here? 1. School siting issues 2. Individual barriers to walking to school 3. Community issues

14 1. School siting issues: A generation ago Small (average of 127 students) Located in community centers 48% of kids walked or biked to school (U.S. EPA, 2003)

15 School siting issues: Today Mega-schools (average 521 students) Schools located on 10 to 30+ acres fringe land Lowest-cost construction (National Center for Education Statistics, 2008)
")
16 School consolidation has lengthened the trip between home and school Students living within 1 mile of school: % % (U.S. DOT, 2009)
")
17 It s not just distance Students living within one mile or less who walk or bike to school: % % (U.S. DOT, 2009)
18 2. Individual barriers to walking and bicycling to school Long distances 62% Traffic danger 30% Adverse weather 19% Fear of crime danger 12% (CDC, 2005)

19 Traffic danger
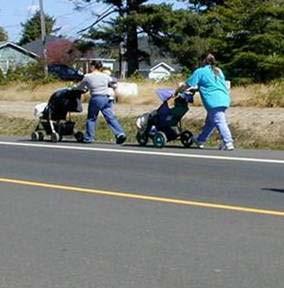
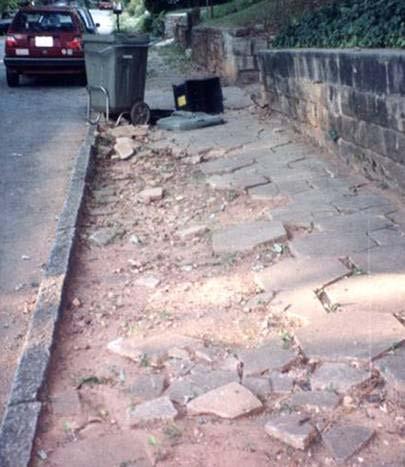
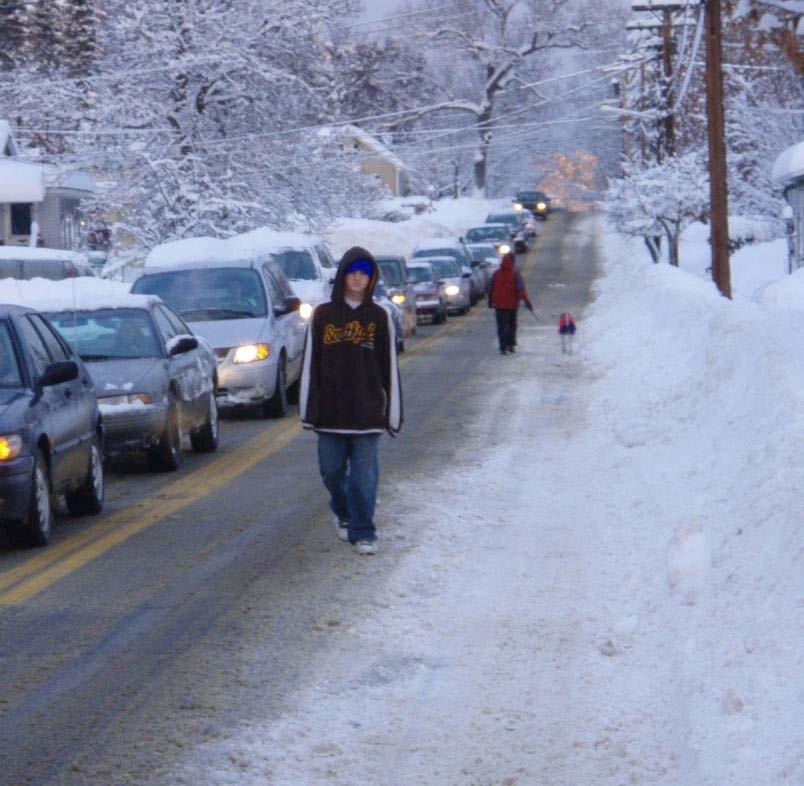
20 Community conditions make it hard to walk or bike

21 Adverse weather Is this barrier reflective of changed social norms?
22 Fear of crime danger Range of concerns is broad, often not unique to walking and bicycling to school Both reality and perceptions need to be addressed SRTS can be a part of a larger, community-wide response


23 3. Difficult community issues Traffic flow problems Abandoned buildings Illegal behaviors


24 The Bad: Unintended consequences of less walking and bicycling to the environment to our health

25 1996 Summer Olympic Games banned single occupant cars in downtown Atlanta
26 Results of the ban Morning traffic 23% Peak ozone 28% Asthma-related events for kids 42% (Friedman, 2001)

27 Air quality Measurably better around schools with more walkers and cyclists (U.S. EPA, 2003)
28 Obesity trends among U.S. adults: 1985 (*BMI 30, or ~ 30 lbs overweight for 5 4 woman) No Data <10% 10% 14% (Behavioral Risk Factor Surveillance System, CDC, 2010)
29 Obesity trends among U.S. adults: 1990 (*BMI 30, or ~ 30 lbs overweight for 5 4 woman) No Data <10% 10% 14% (Behavioral Risk Factor Surveillance System, CDC, 2010)
30 Obesity trends among U.S. adults: 1995 (*BMI 30, or ~ 30 lbs overweight for 5 4 woman) No Data <10% 10% 14% 15% 19% (Behavioral Risk Factor Surveillance System, CDC, 2010)
31 Obesity trends among U.S. adults: 2000 (*BMI 30, or ~ 30 lbs overweight for 5 4 woman) No Data <10% 10% 14% 15% 19% 20 (Behavioral Risk Factor Surveillance System, CDC, 2010)
32 Obesity trends among U.S. adults: 2001 (*BMI 30, or ~ 30 lbs overweight for 5 4 woman) No Data <10% 10% 14% 15% 19% 20% 24% 25% (Behavioral Risk Factor Surveillance System, CDC, 2010)
33 Obesity trends among U.S. adults: 2002 (*BMI 30, or ~ 30 lbs overweight for 5 4 woman) No Data <10% 10% 14% 15% 19% 20% 24% 25% (Behavioral Risk Factor Surveillance System, CDC, 2010)
34 Obesity trends among U.S. adults: 2003 (*BMI 30, or ~ 30 lbs overweight for 5 4 woman) No Data <10% 10% 14% 15% 19% 20% 24% 25% (Behavioral Risk Factor Surveillance System, CDC, 2010)
35 Obesity trends among U.S. adults: 2004 (*BMI 30, or ~ 30 lbs overweight for 5 4 woman) No Data <10% 10% 14% 15% 19% 20% 24% 25% (Behavioral Risk Factor Surveillance System, CDC, 2010)
36 Obesity trends among U.S. adults: 2005 (*BMI 30, or ~ 30 lbs overweight for 5 4 woman) < 10% 10% 14% 15% 19% 20% 24% 25% 29% 30% (Behavioral Risk Factor Surveillance System, CDC, 2010)
37 Obesity trends among U.S. adults: 2006 (*BMI 30, or ~ 30 lbs overweight for 5 4 woman) < 10% 10% 14% 15% 19% 20% 24% 25% 29% 30% (Behavioral Risk Factor Surveillance System, CDC, 2010)
38 Obesity trends among U.S. adults: 2007 (*BMI 30, or ~ 30 lbs overweight for 5 4 woman) < 10% 10% 14% 15% 19% 20% 24% 25% 29% 30% (Behavioral Risk Factor Surveillance System, CDC, 2010)
39 Obesity trends among U.S. adults: 2008 (*BMI 30, or ~ 30 lbs overweight for 5 4 woman) < 10% 10% 14% 15% 19% 20% 24% 25% 29% 30% (Behavioral Risk Factor Surveillance System, CDC, 2010)
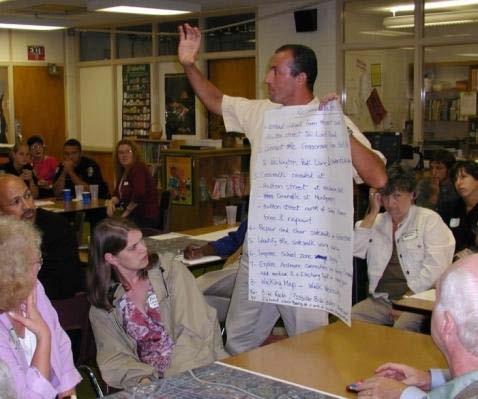
40 Obesity trends among U.S. adults: 2009 (*BMI 30, or ~ 30 lbs overweight for 5 4 woman) < 10% 10% 14% 15% 19% 20% 24% 25% 29% 30% (Behavioral Risk Factor Surveillance System, CDC, 2010)

41 U.S. youth obesity rates (Trust for America s Health and Robert Wood Johnson Foundation, 2010)
42 Overweight children have an increased risk of Type 2 Diabetes Low self esteem Aggravated existing asthma Sleep apnea Decreased physical functioning Many other negative emotional & physical effects (Ogden, 2010; CDC, 2009)

43 Physical activity Most kids aren t getting the physical activity they need. (Surgeon General, 2007; Trust for America s Health and Robert Wood Johnson, 2010)

44 Physical activity recommendation for children and adolescents: At least 60 minutes of physical activity daily. (US Depts. of Health and Human Services, 2008)

45 Physical activity and academic performance
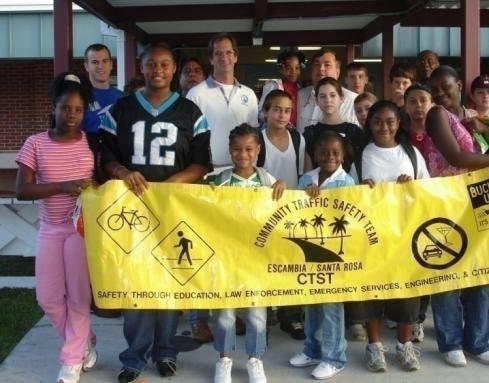
46 The Good: Communities are taking action on behalf of their kids

47 Safe Routes to School programs are part of the solution to increase physical activity to improve unsafe walking and biking conditions to improve poor air quality by reducing vehicle emissions


48 Every school faces a different challenge
49 Steps in creating a SRTS program Bring together the right people Gather information and identify issues Find solutions Make a plan Get the plan funded Act on the plan Evaluate and make changes if needed

50 Elements of Safe Routes to School programs Education Encouragement Enforcement Engineering Evaluation

51 Education Teaches safety skills Creates safety awareness Fosters life-long safety habits Includes parents, neighbors and other drivers

52 Encouragement Increases popularity of walking and biking Is an easy way to start SRTS programs Emphasizes fun of walking and biking

53 Enforcement Increases awareness of pedestrians and bicyclists Improves driver behavior Helps children follow traffic rules Decreases parent perceptions of danger

54 Engineering Creates safer, more accessible settings for walking and biking Can influence the way people behave


55 Evaluation Is the program making a difference?
 More Information: www.saferoutesinfo.")
56 Federal Safe Routes to School program $800 million to States Funds infrastructure and non-infrastructure activities Requires State SRTS Coordinators Funds National Clearinghouse (National Center for SRTS) More Information:
57 Oklahoma s SRTS Program Funding administered through ODOT Program Administrator Ernestine Mrbroh Federal funding requires compliance with federal policies First round of projects currently under construction

58 Success story: Columbia, SC Walk to School Day and Walking Fridays Safety messaging via flyers and announcements Reduced automobile speeds around school Increased parent driver awareness of walkers and bicyclists

59 Success story: Garfield, NJ Students involved with identifying unsafe routes Integrated safety education into the classroom City created safe routes maps Received United Way funding for a new family exercise path

60 Success story: Farmington, NH Small town without many sidewalks leading to school Using state grant funds, constructed the Tiger Trail Connects neighborhoods to local elementary schools Provide safety education, a walking school bus and evaluate the program Increased walking to school

61 Success story: Alpine, UT 2010 Oberstar Safe Routes to School Award Recipient Increased the number of children who regularly walk and bicycle to school from 35% to 50% Used engaging, creative strategies to encourage families to shift habits to a less car-focused commute.


62 Safe Routes to School goals Where it s safe, get kids walking and biking Where it s not safe, make changes
This is a story of the Ugly, the Bad, and the Good. Fewer kids are biking and walking. More parents are driving.
 Why Safe Routes to School Matters: Safety, Health & Transportation This is a story of the Ugly, the Bad, and the Good. Fewer kids are biking and walking. More parents are driving. 2001: 16% walked Parents
Safe Routes to School: A Step in the Right Direction
 Safe Routes to School: A Step in the Right Direction Eric Bjorlin Active Transportation Alliance 1 Safe Routes to School Programs Make walking and bicycling safer options for getting to and from school
Safe Routes to School in New Jersey
 Safe Routes to School in New Jersey The need for Safe Routes to School 1. Fewer kids today walk and bike to school 2. Unintended consequences have resulted 3. SRTS programs can be part of the solution
Montana Safe Routes to School. Encouraging Active Lifestyles
 Montana Safe Routes to School Encouraging Active Lifestyles SRTS Coordinator Taylor Lonsdale, PE taylor.lonsdale@coe.montana.edu (406) 994-7031 Call me! It s my job to help you. The need for Safe Routes
Hermantown Safe Routes to School Kickoff Meeting November 10, 2015
 Hermantown Safe Routes to School Kickoff Meeting November 10, 2015 1. Introductions 2. SRTS Program Overview 1. Purpose 2. Benefits 3. SRTS planning process timeline 4. SRTS Team roles 3. Background on
National Safe Routes to School Program: Initial Results
 National Safe Routes to School Program: Initial Results Lauren Marchetti National Center for Safe Routes to School 9 th Annual New Partners for Smart Growth Thursday, February 4, 2010 Seattle, WA August
Barnum- Safe Routes to School Meeting #2 January 20, 2015
 Barnum- Safe Routes to School Meeting #2 January 20, 2015 1. Introductions 2. SRTS Program Overview 1. Purpose 2. Benefits 3. Background of planning Process 3. Existing Conditions Review and Summary 1.
Safe Routes to School PLAN
 CONGDON ELEMENTARY Safe Routes to School PLAN SRTS Team Kick-off Meeting February 8, 2018 AGENDA Welcome and Introductions Safe Routes to School Program Overview History of SRTS work at Congdon Elementary
Childhood Obesity: A Policy Perspective
 Leadership for Healthy Communities Advancing Policies to Support Healthy Eating and Active Living Childhood Obesity: A Policy Perspective Elizabeth Hinman elizabeth@leadershipforhealthycommunities.org
Making the Case for Healthy Planning & Initiatives
 Making the Case for Healthy Planning & Initiatives George Berger, AICP NC-ARTS Region 4 Coordinator Cabarrus REACH Safe Routes to School Coordinator Counties Served: Alexander, Cabarrus, Catawba, Cleveland,
AGENDA. 5. Next Steps a. Survey Distribution b. Draft Action Plan/Recommendations c. Review at next meeting in advance of document preparation
 Congdon Elementary Safe Routes to School Plan Update SRTS Team Meeting #2-Walk Audit March 21, 2018, 3:00 p.m. Congdon Elementary School Art Room-Duluth, MN 1. Welcome and Introductions 2. SRTS Review
Louisiana Safe Routes to School
 Louisiana Safe Routes to School Safe Routes to School goals Where it s safe, get kids walking and biking Where it s not safe, make it safe Community conditions make it hard to walk or bike Safe Routes
The Walking School Bus Program: A Primer and First Steps
 The Walking School Bus Program: A Primer and First Steps Module 1 (13 minutes): Background Why We Need Walking School Buses, Anyway After completing this module, participants will be able to: Cite data
Summary Report: Built Environment, Health and Obesity
 Research and education Built Environment Edmonton Project Summary Report: Built Environment, Health and Obesity Introduction In 2007 the Canadian Institutes of Health Research and the Heart and Stroke
5/12/2016. Who We Are. Today s Objectives. Today s Presenters
 AFHK Wellness Wednesday Webinar Series Creating Walk and Bike to School Programs that Engage Kids and Families Presented by Action for Healthy Kids May 11, 2016 Telephone or speakers Everyone is muted
Get Oregon kids. Walking, biking and rolling to school planning guide
 Get Oregon kids Walking, biking and rolling to school planning guide The Oregon Health Authority produced this guide with assistance from the Oregon Department of Education, Oregon Department of Transportation
SRTS Programs That Increase Walking and Bicycling to School
 Getting Results: SRTS Programs That Increase Walking and Bicycling to School SafeRoutes National Center for Safe Routes to School Communities initiate Safe Routes to School (SRTS) programs for a variety
WALK- AND bike-friendly TURLOCK
 WALK- AND bike-friendly TURLOCK Ideas to Encourage Walking and Biking Benefits to the COMMUNITY Get Connected People who walk and bike have many more opportunities for casual interactions with friends
Safe Routes to School Guide
 Safe Routes to School Guide Steps to Creating a Safe Routes to School Program Created February 2007 SafeRoutes National Center for Safe Routes to School This guide was developed by the Pedestrian and Bicycle
What is non-infrastructure?
 Non-Infrastructure What is non-infrastructure? Education Encouragement Enforcement Evaluation Education Who needs educational messages? 1. Children 2. Parents 3. Neighbors 1. Educating children Pedestrian
Panel: The Case for Active Transportation
 Panel: The Case for Active Transportation Jenny Hansen Safe Routes to School Travel Plan Coordinator, Toledo Public Schools Eric Oberg Director of Trail Development, Rails-To-Trails Conservancy Moderated
SUSTAINABILITY, TRANSPORT, & HEALTH. Ralph Buehler, Virginia Tech
 SUSTAINABILITY, TRANSPORT, & HEALTH Ralph Buehler, Virginia Tech Prepared for National Academies Roundtable on Science and Technology for Sustainability 6 December 2013 Overview Trends in Motorization
WSB Volunteer Leader Training and Orientation
 WSB Volunteer Leader Training and Orientation Name of Trainer Date of Training Program Summary WHEN? WHERE? 2-4 routes serving
Public Health in the Public Realm: Influencing Street Design with Health in Mind Dr. David McKeown Medical Officer of Health
 Public Health in the Public Realm: Influencing Street Design with Health in Mind Dr. David McKeown Medical Officer of Health Complete Streets Forum April 23, 2010 Common Goals of Public Health and Complete
Public Healthy and Community Design
 Public Healthy and Community Design Jeffery Rosenhall, MA, LCI #2312 Health Program Manager, CDPH April 24, 2017 Stairwell interventions Urban bike track Public health and planning: A Road Map Planning,
SAFE ROUTES TO SCHOOL (SR2S)
") SAFE ROUTES TO SCHOOL (SR2S) In partnership with Burbank Unified School District (BUSD) & City of Burbank George Washington Elementary School Thomas Jefferson Elementary School John Muir Middle School
SAFE ROUTES TO SCHOOL (SR2S) In partnership with Burbank Unified School District (BUSD) & City of Burbank George Washington Elementary School Thomas Jefferson Elementary School John Muir Middle School
WALKSacrame nto. Welcomes you to the 2009 Sacramento County Safe Routes to School Conference
 Sacramento County Department of Transportation Ron Vicari, Principal Civil Engineer In Partnership with: WALKSacrame nto Anne Geraghty, Terry Preston & Staff Welcomes you to the 2009 Sacramento County
Iowa's Bicycle and Pedestrian Encouragement Guide
 1 Iowa's Bicycle and Pedestrian Encouragement Guide Developed by the Iowa Bicycle Coalition for the Iowa Department of Transportation Safe Routes to School Program Acknowledgment Iowa's Bicycle and Pedestrian
Bringing together community and health. Physical Activity and Nutrition Unit Office of Statewide Health Improvement Initiatives
 Bringing together community and health. Physical Activity and Nutrition Unit Office of Statewide Health Improvement Initiatives Physical Activity and Nutrition Unit Office of Statewide Health Improvement
School and Community: Bringing them Closer Rachel Pickering Program Manager (585) ext.112
 ext.112") School and Community: Bringing them Closer Rachel Pickering Program Manager (585) 461-3520 ext.112 rachelpickering@flhsa.org Advocating for a handful of public-policy and practice changes, and blazing
School and Community: Bringing them Closer Rachel Pickering Program Manager (585) 461-3520 ext.112 rachelpickering@flhsa.org Advocating for a handful of public-policy and practice changes, and blazing
A Holistic Approach to Community Connectivity. 50 th International Making Cities Livable Conference Portland, OR June 2013
 A Holistic Approach to Community Connectivity 50 th International Making Cities Livable Conference Portland, OR June 2013 Founded 2008 About GP RED Research Education Advocacy Focus on Health, Recreation
SPARE THE AIR YOUTH SCHOOLPOOL
 SPARE THE AIR YOUTH SCHOOLPOOL GUIDEBOOK Sharing the trip to school with Walking School Buses, Bike Trains, and Carpools JULY 2014 1 SCHOOLPOOL GUIDEBOOK 01 INTRODUCTION Spare the Air Youth is a regional
Safe Routes to School
 Safe Routes to School Amy Paxton-Aiken, Center TRT University of North Carolina Chapel Hill, NC and Ian Thomas, Executive Director PedNet Coalition Columbia, MO Housekeeping If you are calling in on a
Bike To School Day Resource Guide 2012
 Bike To School Day Resource Guide 2012 TABLE OF CONTENTS Brief History of Bike to School Day... 3 Introduction... 5 Why Bike To School?... 5 Suggested Activities for Bike to School Day... 7 Bike To School
MEET IN THE STREET MOVING TO ZERO
 WE MEET IN THE STREET MOVING TO ZERO Tips for sharing the street Traffic deaths are preventable. We need your help getting the message out. 2 A NEW PLAN A NEW PLAN Philadelphia is proud to adopt Vision
TULARE COUNTY ASSOCIATION OF GOVERNMENTS
 TULARE COUNTY ASSOCIATION OF GOVERNMENTS Workshop: Creating Bikeable, Walkable Communities Wednesday, June 7, 2017 REVIEW OF THE 2016 REGIONAL ACTIVE TRANSPORTATION PLAN TCAG - 559-623-0450 210 N. Church
Cascade Bicycle Club Strategic Plan
 The Greater Context Bicycling has become fundamentally important as large-scale currents of change threaten the health, economy and livability of communities throughout the United States and the world
WALK Friendly Communities: Creating Vibrant, Inclusive Places for People
 WALK Friendly Communities: Creating Vibrant, Inclusive Places for People Walkers are the indicator species for vibrant communities ~ Dr. Rodney Tolley, Director, Walk21 Imagine yourself walking safely
Active People, Healthy Nation Creating an Active America, Together
 National Center for Chronic Disease Prevention and Health Promotion Division of Nutrition, Physical Activity, and Obesity Active People, Healthy Nation Creating an Active America, Together October 19,
Southern California Walking/Biking Research And Creative Evaluation
 Southern California Walking/Biking Research And Creative Evaluation Quantitative Research Topline Report December 7, 2015 Background & Objectives The Southern California Association of Governments (SCAG)
Lawrence Safe Routes to School. Community Meeting January 14, 2015
 Lawrence Safe Routes to School Community Meeting January 14, 2015 Safe Routes to School The 6 E s Education Encouragement Enforcement Engineering Evaluation Equity What are the elements of a SRTS plan?
SAFETY GUIDE FOR SCHOOL CHILDREN & PARENTS. toronto.ca/visionzeroto #VisionZeroTO
 SAFETY GUIDE FOR SCHOOL CHILDREN & PARENTS toronto.ca/visionzeroto #VisionZeroTO VISION ZERO ROAD SAFETY PLAN Toronto s Vision Zero Road Safety Plan is a five-year strategy for eliminating traffic-related
Creating Safe Routes to School Programs for Tribal Communities
 Creating Safe Routes to School Programs for Tribal Communities Kristin Haukom, M.P.H. August 24, 2016 1 Background on the Guide Created by the Safe Routes to School Technical Assistance Resource Center
Promoting Physical Activity in Our Neighborhoods
 Promoting Physical Activity in Our Neighborhoods the fastest-growing public health concern for New Jersey is obesity and its causes. -- The NJ State Development and Redevelopment Plan, 2001 Obesity Trends*
VANCOUVER AREA CYCLING COALITION POSITION PAPER ON CYCLING AND SCHOOLS FOR THE CITY OF VANCOUVER
 VANCOUVER AREA CYCLING COALITION POSITION PAPER ON CYCLING AND SCHOOLS FOR THE CITY OF VANCOUVER Submitted for the Vancouver Area Cycling Coalition by: Mary Sherlock Bill Hamilton April 2006 Cycling is
3 Silverton High School Report
 3 Silverton High School Report Principal: Justin Lieuallen Grades: 9-12 Enrollment: 1,277 Address: 1456 Pine Street First bell: 7:55 a.m. Silverton, OR 97381 Last bell: 3:05 p.m. Free & Reduced Lunch:
Chapter 5. Complete Streets and Walkable Communities.
 Chapter 5. Complete Streets and Walkable Communities. 5.1 Description of Complete Streets. Cities throughout the world, and specifically the United States, are coming to embrace a new transportation and
February 2018 HIGHWAY 316 IMPROVEMENTS PROJECT
 February 2018 HIGHWAY 316 IMPROVEMENTS PROJECT Agenda 1 2 3 4 5 A Message from the City Project Area Traffic Conditions Pedestrian/Bicycle Comfort & Safety Next Steps Q&A City of Hastings Supports a study
Active Community Design: Why Here? Why Now?
 Active Community Design: Why Here? Why Now? Chris Holm Development Review Coordinator 20 April, 2015 Sacramento, California Our environment has changed North Natomas We ve rapidly urbanize our open space
Complete Streets 101: The Basics
 Complete Streets 101: The Basics Michigan Municipal League - Capital Conference March 21, 2017 Chip Smith, AICP - Senior Planner - Wade Trim Inc. and City Council member City of Ann Arbor 2017 MML Capital
SAFE ROUTES TO SCHOOL
 CITY OF LOS ANGELES WALKING ACTIVITY HANDBOOK LOS ANGELES UNIFIED SCHOOL DISTRICT CITY OF LOS ANGELES DEPARTMENT OF TRANSPORTATION LOS ANGELES CITYWIDE WALK TO SCHOOL ORGANIZER MANUAL SAFE ROUTES TO SCHOOL
Health and Community Design: The Local Government Role in Promoting Active Living
 Health and Community Design: The Local Government Role in Promoting Active Living Rich Killingsworth, Director Active Living by Design National Program Office University of North Carolina School of Public
School Bicycling and Walking Policies: Addressing Policies that Hinder and Implementing Policies that Help
 School Bicycling and Walking Policies: Addressing Policies that Hinder and Implementing Policies that Help Tip Sheet As key partners in Safe Routes to School (SRTS) programs, schools and school districts
FLETCHER AVENUE PEDESTRIAN AND BICYCLIST BEHAVIOR CHANGE FORMATIVE RESEARCH PROJECT
 FLETCHER AVENUE PEDESTRIAN AND BICYCLIST BEHAVIOR CHANGE FORMATIVE RESEARCH PROJECT EXTENT OF CHANGES IN PEDESTRIAN AND BICYCLIST ATTITUDES AND BEHAVIORS DIRECTLY AFTER A COMPLETE STREETS PROJECT IN FLORIDA
CAPITAL COEXIST TRAFFIC SAFETY AMBASSADOR PROGRAM GUIDEBOOK
 CAPITAL COEXIST TRAFFIC SAFETY AMBASSADOR PROGRAM GUIDEBOOK Contents How to Use This Guide 3 Walking School Bus 4 Safe Routes to School 5 Slow Down / Stop for Pedestrians Campaign 6 Group Bike Ride 7 Helmet
GUIDEBOOK Version
 GUIDEBOOK Version 4. 2010 alk&âoll to Íchool Îays Table of Contents Introduction... 3 How to establish a weekly Walk and Roll to School Day at your elementary school... 4 Words of Wisdom from a Team Leader...
Summary Report School Walking & Bicycling Audits. Mesa County Regional Transportation Planning Office
 Summary Report School Walking & Bicycling Audits Mesa County Regional Transportation Planning Office This page left blank intentionally WALKING & BICYCLING AUDIT SUMMARY 2 Executive Summary Background:
Perryville TOD and Greenway Plan
 Perryville TOD and Greenway Plan Greenway Glossary Pathway: A bicycle and pedestrian path separated from motorized vehicular traffic by an open space, barrier or curb. Multi-use paths may be within the
I am a CUNY student, bicyclist and resident in New York City. This dialogue is presented
 Ming Lin, Fair Treatment for Two Wheels I am a CUNY student, bicyclist and resident in New York City. This dialogue is presented as my real story and recommendation to improve the New York City traffic
Safe Routes to School
 Safe Routes to School Paul Osborne, Safe Routes to Schools Project Director, Sustrans The Danesmead Wing, 33 Fulford Cross, York YO10 4PB, UK paulo@sustrans.org.uk Summary Safe Routes to Schools is a practical
Reflections on our learning: active travel, transport and inequalities
 Reflections on our learning: active travel, transport and inequalities Jill Muirie Glasgow Centre for Population Health Active travel definition Active travel refers to walking, cycling or using some other
KCPS Safe Routes to School Overview Kansas City, Missouri
 KCPS Safe Routes to School Overview Kansas City, Missouri June 1, 2017 BikeWalkKC Kansas City Public Schools Healthcare Foundation of Greater Kansas City About BikeWalkKC BikewalkKC is a 501(c)(3) non-profit
Corridor Vision Workshop Summary James Madison Elementary February 22,2018
 Corridor Vision Workshop Summary James Madison Elementary February 22,2018 WHY DEVELOP THIS STUDY? Ogden City is planning for better connectivity and access to jobs and housing. Working with area partners,
Film Guide for Educators. Designing for Safety
 Film Guide for Educators Designing for Safety Designing For Safety Key Concepts Speeding While Driving Speeding is the number one cause of injuries and deaths from driving. The main reasons are because
FACTS AND FIGURES: MAKING THE CASE FOR COMPLETE STREETS IN LEE COUNTY
 FACTS AND FIGURES: MAKING THE CASE FOR COMPLETE STREETS IN LEE COUNTY Safety: Close to 5,000 pedestrians and bicyclists die each year on U.S. roads, and more than 70,000 are injured. [Mean Streets, Surface
Vallecito Elementary School. Travel Plan
 Vallecito Elementary School Travel Plan TABLE OF CONTENTS 1. PURPOSE... 1 1.1. SR2S PLANNING, IMPLEMENTATION AND MONITORING... 1 1.2. MARIN COUNTY MEASURE A... 1 2. VALLECITO ELEMENTARY SCHOOL PROFILE...
I HAVE A SAFE ROUTES TO SCHOOL PLAN, NOW WHAT? IMPLEMENTATION.
 I HAVE A SAFE ROUTES TO SCHOOL PLAN, NOW WHAT? IMPLEMENTATION. Brad Strader, AICP, PTP LSL Planning, Inc. Schools in Michigan: An Historical Perspective Then Elementary schools integrated into neighborhoods
Traffic Safety Barriers to Walking and Bicycling Analysis of CA Add-On Responses to the 2009 NHTS
 Traffic Safety Barriers to Walking and Bicycling Analysis of CA Add-On Responses to the 2009 NHTS NHTS Users Conference June 2011 Robert Schneider, Swati Pande, & John Bigham, University of California
WALKING SCHOOL BUS. Piedmont Triad Regional Council - Robert Johnson
 WALKING SCHOOL BUS Piedmont Triad Regional Council - Robert Johnson The PedNet Coalition Formed in April, 2000 7,000+ supporters in Columbia Mission: The Mission of the PedNet Coalition of Columbia, MO
COMMUNITY SCHOOLS AND TRANSPORTATION
 COMMUNITY SCHOOLS AND TRANSPORTATION Regional Transportation Council Workshop October 8, 2015 Agenda» Existing Conditions and Previous Initiatives (RTC School Policy)» TIGER Grant and the Community Schools
Safe Routes to School NELLIE STONE JOHNSON COMMUNITY SCHOOL
 December 2010 Safe Routes to School NELLIE STONE JOHNSON COMMUNITY SCHOOL Encouraging walking and biking to school Safe Routes to School: Healthy Kids Focused Students Across the nation, communities are
How Policy Drives Mode Choice in Children s Transportation to School
 How Policy Drives Mode Choice in Children s Transportation to School Physical Activity through Active Transportation Ruth L. Steiner 2011 Technical Conference and Exhibit Lake Buena Vista, FL April 3-6,
Key objectives of the survey were to gain a better understanding of:
 3 COMMUNITY INPUT Community input is an essential part of corridor studies. For the SR 87 corridor study, VTA staff conducted an extensive online survey of people living and commuting along the corridor.
Winnipeg Walk Bike Projects Downtown Tire Talk - Summary
 Winnipeg Walk Bike Projects Downtown Tire Talk - Summary Downtown Projected Bike Lane System Connecting The Forks to the Exchange District (Fort Street, Garry Street & The Forks to Assiniboine Connection)
Attachment A: Columbus Area Metropolitan Transportation Plan Objectives, Performance Measures, and Targets
 OBJECTIVE: Reduce the percentage of commuters driving alone, and increase the percentage of commuters riding transit, ing Reducing single occupancy auto commutes and increasing commuters using alternative
The Basics of The New Urbanism. November 2, Smart Code
 El Paso and The Basics of The New Urbanism November 2, 2010 Development Types Growth: Traditional neighborhoods vs. sprawl Traditional: Mixed use, pedestrian friendly, varied population, dominant development
Walkable Communities and Adolescent Weight
 Walkable Communities and Adolescent Weight Sandy Slater, PhD Assistant Professor, University of Illinois at Chicago, School of Public Health Research Scientist, UIC Institute for Health Research and Policy
Introduction.
 2307-1.0. Introduction. Delaware s Safe Routes to School (SRTS) Program was established September 10, 2002 when Governor Ruth Ann Minner signed Senate Bill 353 of the 141st General Assembly of Delaware
CHAPTER 3: Vision Statement and Goals
 Davidson Walks & Rolls: Active Transportation Master Plan CHAPTER 3 Contents: Overview Vision Statement Measurable Goals Public Outreach CHAPTER 3: Vision Statement and Goals Overview The vision statement
Measuring the Pedestrian Experience Through Walk Audits
 Measuring the Pedestrian Experience Through Walk Audits A presentation to the American Public Works Association September 16, 2009 Agenda 1. Description of a walk audit 2. Field trip 1 City of Columbus
Organizing Successful Bike Trains
 Organizing Successful Bike Trains Thursday, May 5, 1-2PM EDT Safe Routes to School National Partnership Agenda, May 5 th, 2011 Welcome, Administrative Details, and Introduction - Dave Cowan, Safe Routes
Walk Friendly Communities Education and Encouragement Programs
 Walk Friendly Communities Programs Dan Gelinne Walk Friendly Communities Workshop Grandview, MO June 2015 Module Overview Topics Background and purpose What is the role of education and encouragement programs?
Safe Routes to School Blue Zones Project, City of
 Safe Routes to School Blue Zones Project, City of Fort Worth and FWISD Partnership Introduction to Blue Zones Project Blue ZonesProject is a well-being improvement initiative designed to make healthy choices
Mayor s Pedestrian Advisory Council. Wednesday, February 15
 Mayor s Pedestrian Advisory Council Wednesday, February 15 Annual Pedestrian Fatalities 2005-2016 Year-End Pedestrian Fatalities, 2016 (CPD): 44 Year-End Pedestrian Fatalities, 2015 (CPD): 46 Year-End
Walk and Roll Encouragement Projects K-5 IN THIS UNIT
 Walk and Roll Encouragement Projects K-5 IN THIS UNIT Walk and Roll Art Studio What s Your Story? Walk and Roll Team Trivia What s the Speed Limit? K-5 Safety/Community K-5 Community 3-5 Safety/Health
New York State Capital District Transportation Committee. Pedestrian & Bicycle Law Enforcement Training
 New York State Capital District Transportation Committee Pedestrian & Bicycle Law Enforcement Training April 30 - May 1, 2012 New York State Police Academy Albany, NY 1 Why we are teaching this course
What s Health Got to Do With It? Health and Land Use Planning
 What s Health Got to Do With It? Health and Land Use Planning CANDACE RUTT, PH.D. EXECUTIVE DIRECTOR APRIL 13 TH, 2016 Planning and Public Health Planning + Public Health Healthy Communities Healthier
Safe Routes to School as a Transportation Control Measure: Impacts on the Emission Inventory
 Safe Routes to School as a Transportation Control Measure: Impacts on the Emission Inventory Ignatius Fomunung, Joseph Owino, Mbaki Onyango University of Tennessee Chattanooga August 5, 2015 Outline Introduction
Item 7 Enclosure Citizens Advisory Committee March 27, 2013 San Francisco Safe Routes to School Program
 Item 7 Enclosure Citizens Advisory Committee March 27, 2013 1 San Francisco Safe Routes to School Program Ana Validzic, MPH SF Department of Public Health 2 Safe Routes to School Program Need Fewer kids
Non-motorized Transportation Planning Resource Book Mayor s Task Force on Walking and Bicycling City of Lansing, Michigan Spring 2007 pg.
 Non-motorized Transportation Planning Resource Book pg. 105 of 158 Non-motorized Transportation Planning Resource Book pg. 106 of 158 Non-motorized Transportation Planning Resource Book pg. 107 of 158
July 5, Arthur R. Ware, Jr. Elementary School 2017 Safe Routes to School Walkabout Report
 July 5, 2017 Arthur R. Ware, Jr. Elementary School 2017 Safe Routes to School Walkabout Report 1 Walkabout Report Introduction On April 28, 2017, City, School, and SAWMPO staff met to conduct a Safe Routes
MARKET/JFK VISION ZERO PILOT PROJECT FEBRUARY 2019 EVALUATION REPORT
 MARKET/JFK VISION ZERO PILOT PROJECT FEBRUARY 2019 EVALUATION REPORT WHY IS THIS PROJECT IMPORTANT? Market Street and JFK Boulevard in Center City are key east-west corridors in the core business district.
Richard J Jackson MD, MPH, FAAP.
 We Are What We Eat And What We Build Richard J Jackson MD, MPH, FAAP HonASLA, HonAIA dickjackson@ucla.edu http://designinghealthycommunities.org/oram/ USA Today 10/20/2011 Commuting by driving is not
Molalla HEAL MAPPS Community Report
 Molalla HEAL MAPPS Community Report This report was collaboratively generated by Beret Halverson, Oregon State University Extension, Clackamas County, OR and D. John, K. Gunter, and L. Etuk, Oregon State
Telephone Survey of Washington State Voters June 2014
 Telephone Survey of Washington State Voters June 2014 Methodology Telephone survey of likely November 2014 voters in Washington State May 28 th June 2 nd, 2014 506 total interviews statewide MoE = ± 4.4%
School Travel Survey for District Superintendents/Board Chairs
 School Travel Survey for District Superintendents/Board Chairs 1. How do most of the elementary and middle school students in your district get to school in the morning? (Please select only one box) by
Creating walkable, bikeable and transit-supportive communities in Halton
 Creating walkable, bikeable and transit-supportive communities in Halton By presenting current research and best practices, the information in this paper is meant to support and broaden discussion on how
Health and the Built Environment
 Health and the Built Environment Today s children may be the first generation to have a shorter life expectancy than their parents have. Obesity is the tip of the iceberg; other chronic conditions are
OPERATION SAFE STOP. An Educational Campaign by the New York Association for Pupil Transportation
 OPERATION SAFE STOP An Educational Campaign by the New York Association for Pupil Transportation Prepared by NYAPT through the National Highway Transportation Safety Administration under a grant from the
Streets. Safe for Pedestrians 20% 2nd 5,000. Are We People-Friendly?
 Streets Safe for Pedestrians 20% Pedestrian deaths account for more than of all traffic-related fatalities in California each year. 600 More than people are killed and another 13,000 are injured every