Built Environment and Older Adults: Supporting Smooth Transitions Across the Life- Span. Dr. Lawrence Frank, Professor and Bombardier UBC
|
|
|
- Elizabeth Lawson
- 5 years ago
- Views:
Transcription

1 Built Environment and Older Adults: Supporting Smooth Transitions Across the Life- Span Dr. Lawrence Frank, Professor and Bombardier UBC

2 The Hidden Health Costs of Transportation - Frank et al 2010 American Public Health Association
3 Provides Opportunity for Social Interaction Provides Independence and Mobility Distances to Destinations Are Short A Variety of Housing Choices Streets are Interconnected Sidewalks are Even and Street Crossings Are Short Has Parks and Streets With Benches Passive Places to Observe Others Slopes are Not Extreme


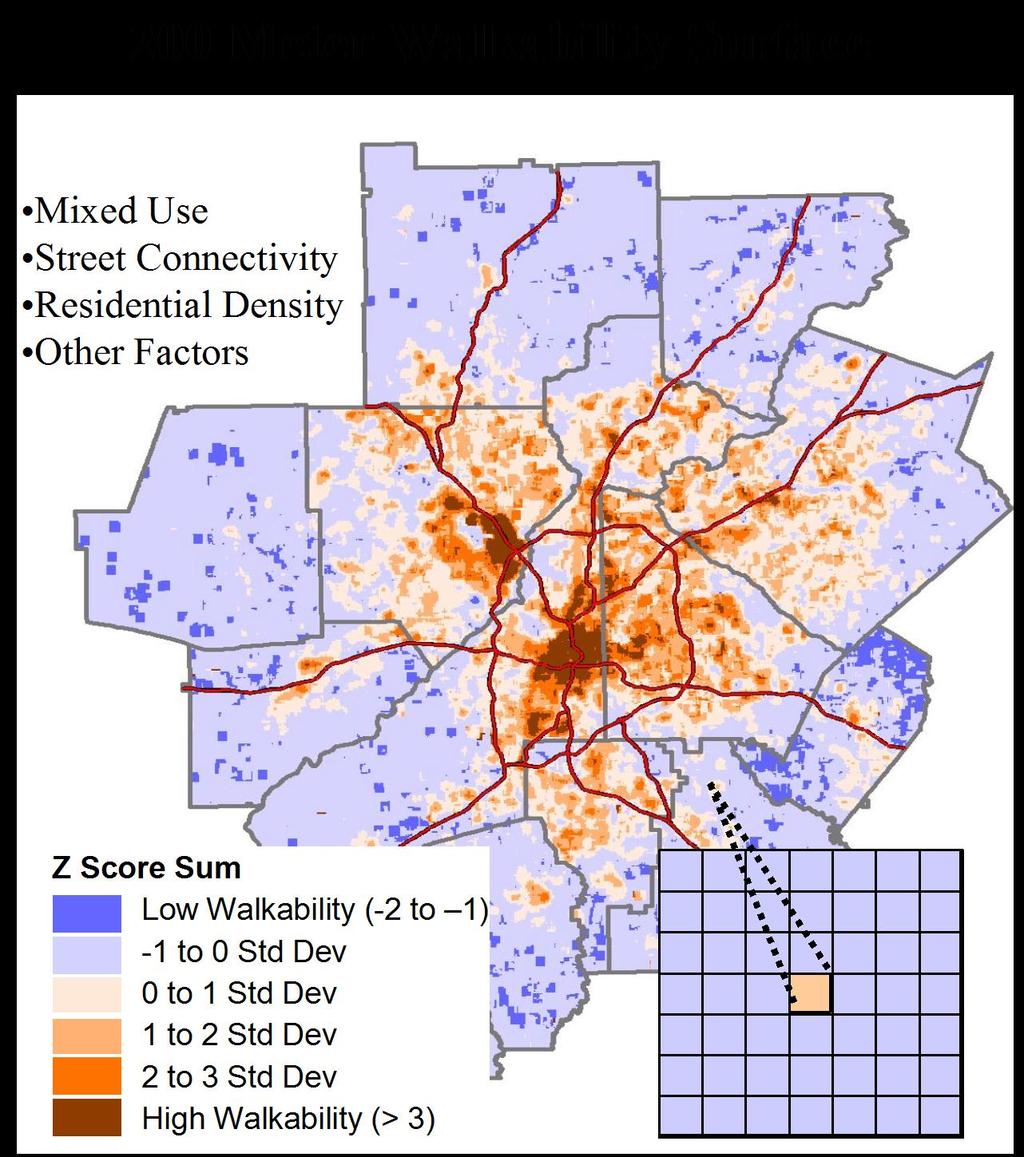
4 Proximity 2 KM 1 KM Connectivity

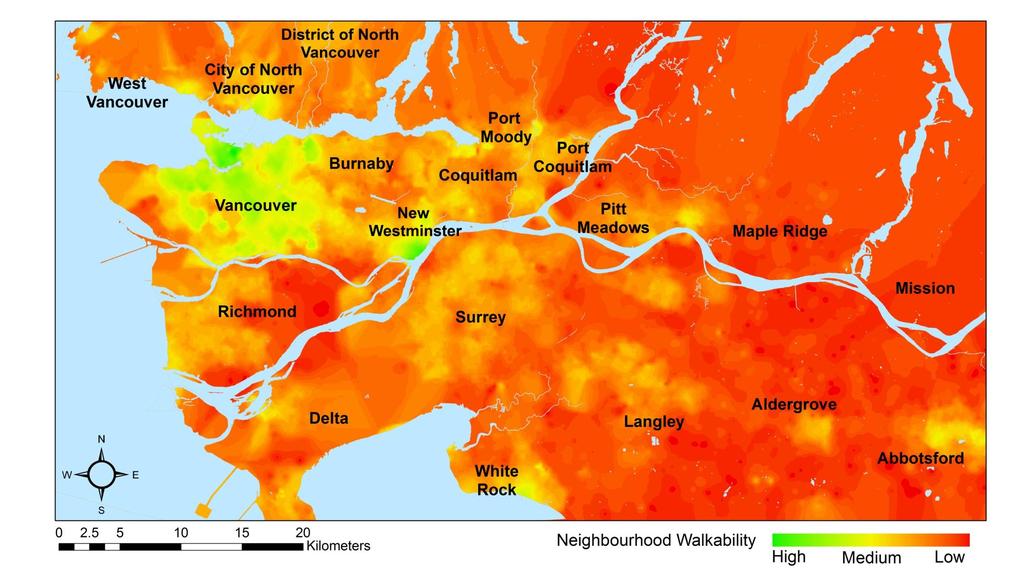
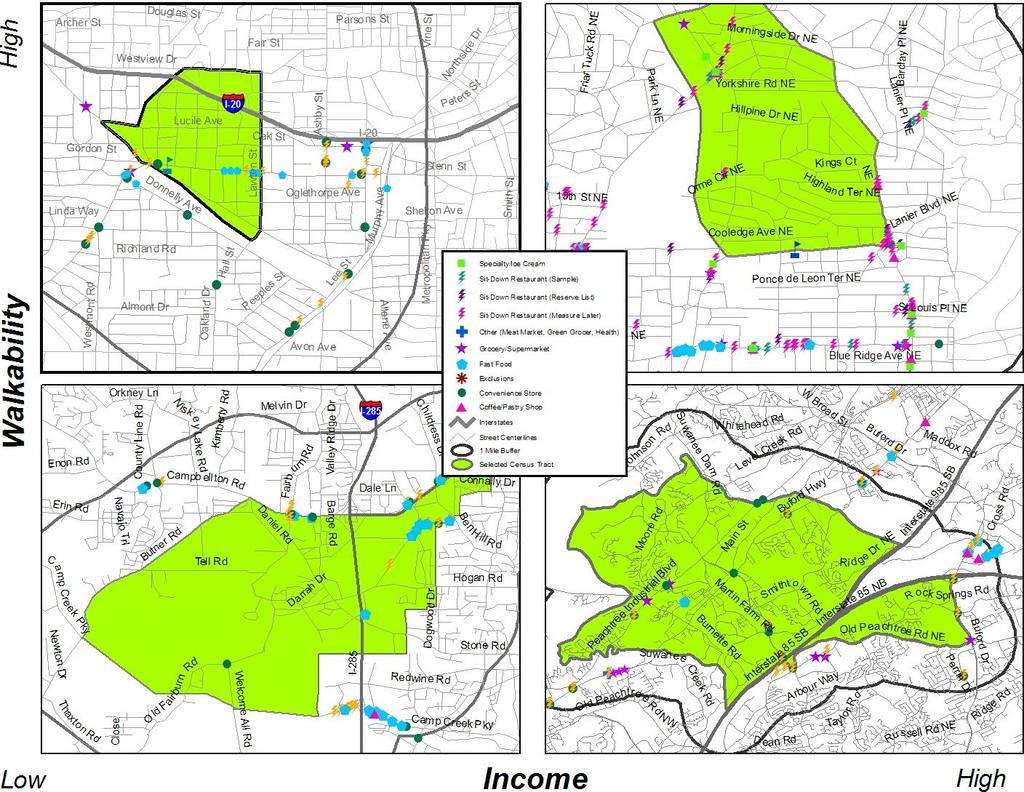
5 Lower Mainland Walkability Map

6 Walkability and Elderly

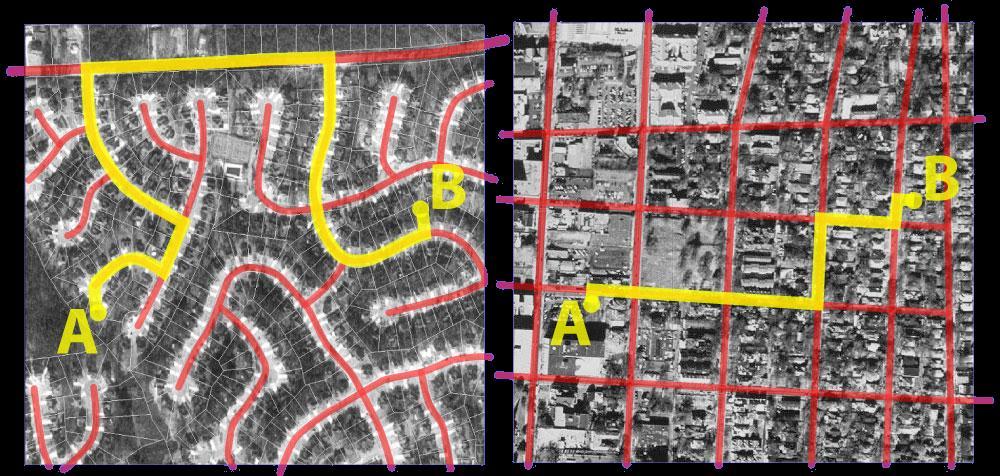
7 Comparing Two Communities
8 California will see its 65-plus population more than double in the next 25 years, from 3.5 million in 2000 (10.6 percent of the state's population) to 8.2 million in 2030 (17.8 percent). Where will the 65-plus population live? Access to services Less reliance on driving for safety reasons Maintaining Independence For elderly, considering cost of service delivery with Aging in Place Suburban Vs Urban setting


9 Population 2000 and 2011 (projection Age 60 and Over 68.1% 62.1% City of Seattle Data Source: Geolytics, Inc.
10
11 Variables 25 to 64 Years Old Years Old years Old 85+ Years Old Percent with no driver's license 6.8% 13.5% 23.1% 57.6% Percent with a medical condition impacting travel 3.6% 12.4% 23.2% 33.6% Percent with no household vehicles 4.2% 7.9% 16.9% 18.2% Total trips daily per person (all modes) Percent traveling by transit (1+ bus or rail trips over two day survey period) 5.0% 2.2% 1.2% 1.3% Miles traveled as driver Percent people whose willingness to walk is affected "very much" by traffic Percent people whose willingness to walk is affected "very much" by sidewalk availability 28.6% 28.8% 23.6% 22.1% 35.3% 35.8% 30.6% 46.2% Atlanta SMARTRAQ Data
12 Increased walkability was related with more walking (OR 2.02), less time spent traveling in a car (OR.53), and lower odds of being overweight (OR.68). Those with 1 or no cars were more likely to walk (OR 2.9) and spend less time in cars (OR.53); but also less likely to get recommended levels of PA (OR.55). Visiting a fast food outlet was associated with increased odds of obesity (OR 1.81).
13 age, number of cars, ethnicity, and walkability were significantly related to walking at least once over the two-day diary period. Only 4 percent of the sample reported walking Fifty seven percent of the sample was overweight and 20 percent were obese. those with one or less cars were almost three times more likely to walk, those with a degree were almost twice as likely to walk, and those living in a highly walkable neighborhood were two times more likely to walk than those in a low walkable neighborhood.
14 the youngest group (65-74), and those with a higher household income and a degree were more likely to travel in a car for an hour a day. Those with one car or less, non-whites, and women were significantly less likely to spend an hour a day in a car. Those living in neighborhoods with medium walkability were 35 percent less likely, and those in high walkable neighborhoods were 47 percent less likely, to travel over an hour a day by car. only those with a car were significantly more likely to meet recommended activity levels.
15 Increased walkability was related with lower odds of being overweight (OR.68). those who walked were significantly less likely (OR.51) to be overweight. Women and those with a degree were less likely to be overweight. Younger participates were more likely to be categorized as obese, as were non-whites and those with no college degree. Those who met the physical activity guidelines were 45 percent less likely to be obese but those who visited a fast food outlet at least once in the 2-day survey period were 1.8 times more likely to be obese.

16 Marshall, Brauer, and Frank 2008 Nitric Oxide

17
18
19 Total variance explained * p<.05 in final block Gender Stratified Linear regression Women Men T P value t P value Block 1 - % variance explained Age * * Race * * Education * * Income * Number in household * * Number of vehicles in household * Two or more children in household * Employment Block 2 - % variance explained Walkability of home * Block 3 - % variance explained Ate at fastfood restaurant * Shopped at grocery store * Block 4 - % variance explained Meeting guidelines for MVPA Walked at least once over 2 days

20 Residential Density and Mix of Housing Type


21 Prefers a Walkable Community Design Neighborhood Preferences 1 2 Low Walkability Built Environment High Walkability 3 4 Prefers Auto - Based Community Design
22 Preference (Subjective) 2 Auto Walk Quadrant 1: Unmatched Walkability -- Low Preference -- Walk Quadrant 3: Matched Walkability -- Low Preference -- Auto Quadrant 2: Matched Walkability -- High Preference -- Walk Quadrant 4: Unmatched Walkability -- High Preference -- Auto Low Neighborhood Walkability (Objective) High
 16.0% 36.6 14 (188) (188) (1 33.9% 25.8 11 (446) (446) (3 3.3% 43.0 21 (246) (246) (2 7.0% 25.")
23 Walkability & Preference Groups Preference for Neighborhood Type Walkability of Current Neighborhood I High Low II III High Low High Low IV Low High Percent Taking a Walk Trip (n) Average Daily Vehicle Miles Traveled (n) 16.0% (188) (188) (1 33.9% (446) (446) (3 3.3% (246) (246) (2 7.0% (43) (43) ( FIGURE 12 - Walking, Driving and Obesity by Neighborhood Preferenc Pe Ob (
24 Policies are needed to bring older Americans closer to shops and services and healthy food outlets as a means of encouraging regular walking and healthy body weight. Incentives to encourage neighborhood grocery stores and affordable housing in central areas along with regulatory reform through zoning can encourage PA and healthy body weight in the elderly.
25
 Re-assessing the meaning and costs of aging in place 7) Healthy eating and food environments for seniors MONETIZING THE BUILT ENVIRONMENTS INFLUENCE ON")
26 1) Housing affordability / Walkability 2) Transit access, physical activity, and site design 3) Design solutions to air pollution exposure 4) Measuring effects of changes in built 5) Environment to support healthy aging 6) Re-assessing the meaning and costs of aging in place 7) Healthy eating and food environments for seniors MONETIZING THE BUILT ENVIRONMENTS INFLUENCE ON HEALTHY AGING
 Supplemented with regional parks & open space data Nearly 70 percent of all multifamily households (and 58 percent of all households) have park access within")
27 Percentage of households within a 0.6 mile (1 km) walking distance of a park entrance Uses field verified data from the Neighborhood Quality of Life Study (NQLS; Principal Investigator Dr. James Sallis, San Diego State University) Supplemented with regional parks & open space data Nearly 70 percent of all multifamily households (and 58 percent of all households) have park access within a 0.6 mile walk Potential Healthy Works Application: City of Santee Park Master Plan
 of a grocery store, produce market, specialty market or farmers market Uses")

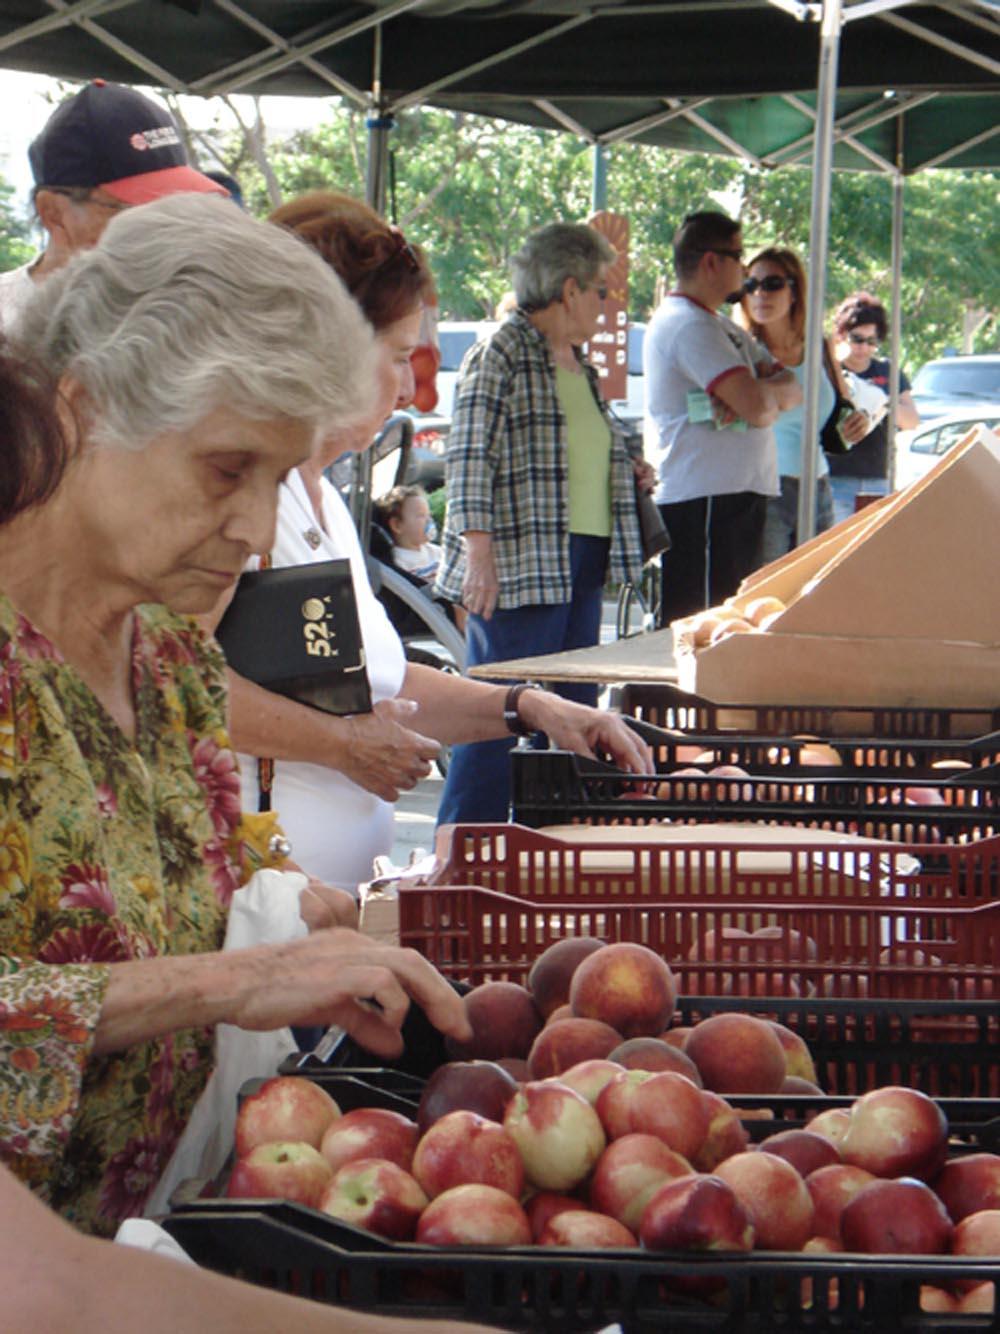
28 Percentage of households within 0.6 miles (1 km) of a grocery store, produce market, specialty market or farmers market Uses Neighborhood Quality of Life Study (NQLS) food outlet data - subject to detailed field verification in Over 80 percent of multi-family households - and nearly 60 percent of all households - have access to a grocery store or farmers market within walking distance.
29

30 Nothing Great Was Ever Achieved Without Enthusiasm Ralph Waldo Emerson
Carbonless Footprints: Health and Environmental benefits of Active Transportation
 Carbonless Footprints: Health and Environmental benefits of Active Transportation Dr. Lawrence Frank, Professor and Bombardier Chair in Sustainable Transportation - University of British Columbia Health
Blueprint for Active Living Communities: Innovative Solutions. James Sallis University of California, San Diego For IOM PA Workshop.
 Blueprint for Active Living Communities: Innovative Solutions James Sallis University of California, San Diego For IOM PA Workshop. April 15, 2015 Outline of Talk Do built environments matter? Progress
Market Factors and Demand Analysis. World Bank
 Market Factors and Demand Analysis Bank Workshop and Training on Urban Transport Planning and Reform. Baku, April 14-16, 2009 Market Factors The market for Public Transport is affected by a variety of
Dr. Lawrence Frank, Professor, University of British Columbia & President, Urban Design 4 Health, Inc.
 Dr. Lawrence Frank, Professor, University of British Columbia & President, Urban Design 4 Health, Inc. On 350 calories one apple tart or a special slice of Ray's Pizza a cyclist can travel 10 miles, a
Urban planners have invested a lot of energy in the idea of transit-oriented
 DOES TRANSIT-ORIENTED DEVELOPMENT NEED THE TRANSIT? D A N I E L G. C H AT M A N Urban planners have invested a lot of energy in the idea of transit-oriented developments (TODs). Developing dense housing
VI. Market Factors and Deamnd Analysis
 VI. Market Factors and Deamnd Analysis Introduction to Public Transport Planning and Reform VI-1 Market Factors The market for Public Transport is affected by a variety of factors No two cities or even
Active and Green: Healthy Communities Are Sustainable Communities
 Active and Green: Healthy Communities Are Sustainable Communities James Sallis, PhD San Diego State University www.drjamessallis.sdsu.edu For LISC Webinar May 4, 2011 Goals of talk Physical inactivity
Motorized Transportation Trips, Employer Sponsored Transit Program and Physical Activity
 Motorized Transportation Trips, Employer Sponsored Transit Program and Physical Activity Ugo Lachapelle Msc. Lawrence D. Frank, PhD Active Living Research Washington, DC April 12, 2008 Outline Background:
University of Michigan & Urban Land Institute Real Estate Forum. Mary Beth Graebert Michigan State University
 University of Michigan & Urban Land Institute Real Estate Forum Mary Beth Graebert Michigan State University November 20, 2013 Michigan State University Land Policy Institute Strong focus on research and
Summary Report: Built Environment, Health and Obesity
 Research and education Built Environment Edmonton Project Summary Report: Built Environment, Health and Obesity Introduction In 2007 the Canadian Institutes of Health Research and the Heart and Stroke
THESE DAYS IT S HARD TO MISS the story that Americans spend
 WHICH COMES FIRST: THE NEIGHBORHOOD OR THE WALKING? BY SUSAN HANDY AND PATRICIA MOKHTARIAN THESE DAYS IT S HARD TO MISS the story that Americans spend more time stuck in traffic than ever, that they re
Health Impact Analysis for Integrated Regional Land Use and Transportation Plan
 Health Impact Analysis for Integrated Regional Land Use and Transportation Plan Hsi-Hwa Hu, Guoxiong Huang, Frank Wen, Simon Choi (Southern California Association of Governments) Margaret Shih (Los Angeles
The best indicator of an individual s and expanding access to parks and open space.
 Health & Wellness Create a Safe and Healthy Built Environment Artist s rendering, 2014 Health is important to Loveland residents, and stakeholders see the many strong connections between quality of life,
Walkable Communities and Adolescent Weight
 Walkable Communities and Adolescent Weight Sandy Slater, PhD Assistant Professor, University of Illinois at Chicago, School of Public Health Research Scientist, UIC Institute for Health Research and Policy
OC Healthy Communities Forum. The proportion of the population that live within a half mile of a major transit access point.
 OC Healthy Communities Forum Transit Access The proportion of the population that live within a half mile of a major transit access point. Use of public transit can result in decreased greenhouse gas emissions
Neighborhood Environment Profiles Related to Physical Activity and Weight Status among Seniors: A Latent Profile Analysis
 Neighborhood Environment Profiles Related to Physical Activity and Weight Status among Seniors: A Latent Profile Analysis Marc A. Adams, Ph.D. University of California, San Diego & Adjunct Assistant Professor
The Impact of Policy and Environmental Outcomes on Youth Physical Activity
 The Impact of Policy and Environmental Outcomes on Youth Physical Activity Childhood Obesity Conference, San Diego, CA June 30, 2011 Sandy Slater, PhD Assistant Professor, University of Illinois at Chicago,
Pocatello Regional Transit Master Transit Plan Draft Recommendations
 Pocatello Regional Transit Master Transit Plan Draft Recommendations Presentation Outline 1. 2. 3. 4. What is the Master Transit Plan? An overview of the study Where Are We Today? Key take-aways from existing
Traffic Safety Barriers to Walking and Bicycling Analysis of CA Add-On Responses to the 2009 NHTS
 Traffic Safety Barriers to Walking and Bicycling Analysis of CA Add-On Responses to the 2009 NHTS NHTS Users Conference June 2011 Robert Schneider, Swati Pande, & John Bigham, University of California
What s Health Got to Do With It? Health and Land Use Planning
 What s Health Got to Do With It? Health and Land Use Planning CANDACE RUTT, PH.D. EXECUTIVE DIRECTOR APRIL 13 TH, 2016 Planning and Public Health Planning + Public Health Healthy Communities Healthier
Improving Pedestrian Access to Transit: The Sacramento Pedestrian Master Plan
 Improving Pedestrian Access to Transit: The Sacramento Pedestrian Master Plan Matt Haynes Fehr & Peers Associates San Francisco, California Rail~Volution 2005 Presentation Outline Policies What are most
Factors influencing choice of commuting mode
 Factors influencing choice of commuting mode Lin Yang J. Aaron Hipp, Deepti Adlakha, Christine Marx, Rachel Tabak, and Ross Brownson Active Living Research February 24, 2015 Active commuting Background
Childhood Obesity: A Policy Perspective
 Leadership for Healthy Communities Advancing Policies to Support Healthy Eating and Active Living Childhood Obesity: A Policy Perspective Elizabeth Hinman elizabeth@leadershipforhealthycommunities.org
ORDINANCE NO
 1 Sponsored by: Councilmembers Stan Flemming, Connie Ladenburg, and Rick Talbert 2 Requested by: Executive/Public Works and Utilities - Transportation Services 3 4 5 6 7 10 11 ORDINANCE NO. 2014-445 12
Peel Health Initiatives Health and Urban Form
 Region of Peel Public Health Peel Health Initiatives Health and Urban Form alpha Conference June 9, 2008 Gayle Bursey Director, Chronic Disease and Injury Prevention Declaration No part of the information
Neighborhood environments and physical activity in youth: from research to practice
 Neighborhood environments and physical activity in youth: from research to practice Jordan Carlson, PhD Center for Children s Healthy Lifestyles and Nutrition Children s Mercy Kansas City Contributors
TRANSPORTATION FACILITIES AND THEIR IMPACT ON HEALTH
 TRANSPORTATION FACILITIES AND THEIR IMPACT ON HEALTH Health and Transportation Air quality Climate change Safety Physical activity Access to food, medical care, employment Policy Link & Prevention Institute
FACTS AND FIGURES: MAKING THE CASE FOR COMPLETE STREETS IN LEE COUNTY
 FACTS AND FIGURES: MAKING THE CASE FOR COMPLETE STREETS IN LEE COUNTY Safety: Close to 5,000 pedestrians and bicyclists die each year on U.S. roads, and more than 70,000 are injured. [Mean Streets, Surface
Development Type - Neighbourhood Planning and Design
 Introduction The design and layout of new neighbourhoods greatly influences the nature of the urban form. When a neighbourhood is well designed it: allocates land for a range of uses, eg shops, community
Sandra Nutter, MPH James Sallis, PhD Gregory J Norman, PhD Sherry Ryan, PhD Kevin Patrick, MD, MS
 Objectively Measured Environmental Correlates of Adolescent Physical Activity Sandra Nutter, MPH James Sallis, PhD Gregory J Norman, PhD Sherry Ryan, PhD Kevin Patrick, MD, MS San Diego State University
Chapter 14 PARLIER RELATIONSHIP TO CITY PLANS AND POLICIES. Recommendations to Improve Pedestrian Safety in the City of Parlier (2014)
") Chapter 14 PARLIER This chapter describes the current status and future plans for biking and walking in the City of Parlier. RELATIONSHIP TO CITY PLANS AND POLICIES The Parlier General Plan is the primary
Chapter 14 PARLIER This chapter describes the current status and future plans for biking and walking in the City of Parlier. RELATIONSHIP TO CITY PLANS AND POLICIES The Parlier General Plan is the primary
INTEGRATING HEALTH INTO SCENARIO PLANNING
 INTEGRATING HEALTH INTO SCENARIO PLANNING Dr. Lawrence Frank, President UD4H, Inc. Seattle, Washington Professor in Population and Public Health and Urban Planning University of British Columbia Outline
City of Davenport CitiBus Public Transportation Study. April 2015
 City of Davenport CitiBus Public Transportation Study April 2015 Overview Project Background Key Findings CitiBus Service Allocation Policy Discussion 2 Project Background 3 About CitiBus Operates 17 routes
National Community and Transportation Preferences Survey. September 2017
 National Community and Transportation Preferences Survey September Executive Summary - Overview The Community and Transportation Preferences Survey echoes many of the major findings from the previous surveys.
Health and the Built Environment Presentation to the Childhood Obesity Conference
 Presentation to the Childhood Obesity Conference By Cole Runge, Principal Planner Brown County Planning Commission September 29, 2011 The built environment strongly influences physical and mental health.
Florida Coalition CTST COMMUNITY TRAFFIC SAFETY TEAMS COLLEGE OF MEDICINE
 CTST Florida Coalition COMMUNITY TRAFFIC SAFETY TEAMS COLLEGE OF MEDICINE How to Choose Your Lifelong Community A Transportation Checklist What Is a Lifelong Community? You might be more familiar with
Translating Research Into Public Policy:
 An Active Living Program supported by The Robert Wood Johnson Foundation and administered by San Diego State University. Translating Research Into Public Policy: The Case of Active Living NCSL. November
Use this guide to learn more about walkability and how you can make your community safer to walk
 Walkability Guide Do You Enjoy Walking In Your Community? Use this guide to learn more about walkability and how you can make your community safer to walk 2 About This Guide Circulate San Diego believes
About the Active Transportation Alliance
 About the Active Transportation Alliance Chicagoland s voice for better biking, walking and transit Founded 1985 7,000 members, ~33 full time staff Serve Chicago metro region 1 More Cars, More Driving
Capital Bikeshare 2011 Member Survey Executive Summary
 Capital Bikeshare 2011 Member Survey Executive Summary Prepared by: LDA Consulting Washington, DC 20015 (202) 548-0205 June 14, 2012 EXECUTIVE SUMMARY Overview This report presents the results of the 2012
Pedestrian Survey Report
 Pedestrian Survey Report The City of Albany conducted a Pedestrian Survey in 2007 with the purpose of identifying resident s concerns about barriers to walking and accessibility in the City. The survey
BUILDING THE CASE FOR TRAVEL OPTIONS IN WASHING TON COUNTY. Image: Steve Morgan. Image: Steve Morgan
 BUILDING THE CASE FOR TRAVEL OPTIONS IN WASHING TON COUNTY Image: Steve Morgan Image: Steve Morgan Image: TriMet Image: TriMet WHAT ARE TRAVEL OPTIONS PROGRAMS? Travel options programs encourage residents,
good walking is good business making massachusetts more walkable
 good walking is good business making massachusetts more walkable Nothing draws a crowd like a crowd. P.T. Barnum 15 minutes with WalkBoston who we are / what we do why walkability makes economic sense
Location Matters: Where America Is Moving
 Location Matters: Where America Is Moving Nearly half of all American households plan to move at some point in the future. While some will move for a larger or nicer home, or perhaps to purchase a home
TULARE COUNTY ASSOCIATION OF GOVERNMENTS
 TULARE COUNTY ASSOCIATION OF GOVERNMENTS Workshop: Creating Bikeable, Walkable Communities Wednesday, June 7, 2017 REVIEW OF THE 2016 REGIONAL ACTIVE TRANSPORTATION PLAN TCAG - 559-623-0450 210 N. Church
Microscale Audit of Pedestrian Streetscapes (MAPS), Mini Version
, Mini Version") Microscale Audit of Pedestrian Streetscapes (MAPS), Mini Version Training Manual & Picture Guide Developed by: Carrie Geremia Kelli Cain Revised February 11, 2014 Tool and protocol developed by: James
Microscale Audit of Pedestrian Streetscapes (MAPS), Mini Version Training Manual & Picture Guide Developed by: Carrie Geremia Kelli Cain Revised February 11, 2014 Tool and protocol developed by: James
Life Transitions and Travel Behaviour Study. Job changes and home moves disrupt established commuting patterns
 Life Transitions and Travel Behaviour Study Evidence Summary 2 Drivers of change to commuting mode Job changes and home moves disrupt established commuting patterns This leaflet summarises new analysis
GRAHAM PEDESTRIAN TRANSPORTATION PLAN
 GRAHAM PEDESTRIAN TRANSPORTATION PLAN Chapter 1 I 1.1 Scope and Purpose n March of 2005, the City of Graham contracted with Greenways Incorporated (GWI) to create a Pedestrian Transportation Plan. The
Title VI Fare Change Equity Analysis
 Title VI Fare Change Equity Analysis Evaluation Report Submitted to Dallas Area Rapid Transit Submitted by TranSystems June 2012 Title VI Fare Change Equity Analysis Introduction DART has proposed a schedule
Creating Complete Streets to Accommodate All Users
 Creating Complete Streets to Accommodate All Users Peter Lagerwey, Toole Design Group plagerwey@tooledesign.com Brian Dougherty, Seattle DOT brian.dougherty@seattle.gov International Conference on Urban
Promoting Health in Low-Wealth Communities: Physical Activity
 Promoting Health in Low-Wealth Communities: Physical Activity Deborah Cohen, MD, MPH Funded by NIEHS #P50ES012383; NHLBI # R01HL71244; HRSA-MCH # R40MC00303 Large Health Disparities Exist Among Low Income
THE 2010 MSP REGION TRAVEL BEHAVIOR INVENTORY (TBI) REPORT HOME INTERVIEW SURVEY. A Summary of Resident Travel in the Twin Cities Region
 REPORT HOME INTERVIEW SURVEY. A Summary of Resident Travel in the Twin Cities Region") THE 2010 MSP REGION TRAVEL BEHAVIOR INVENTORY (TBI) REPORT HOME INTERVIEW SURVEY A Summary of Resident Travel in the Twin Cities Region October 2013 WHAT IS THE TBI? The Travel Behavior Inventory (TBI)
THE 2010 MSP REGION TRAVEL BEHAVIOR INVENTORY (TBI) REPORT HOME INTERVIEW SURVEY A Summary of Resident Travel in the Twin Cities Region October 2013 WHAT IS THE TBI? The Travel Behavior Inventory (TBI)
Real-Life Cost of Incomplete Streets
 Real-Life Cost of Incomplete Streets Presented by: Sheree Davis New Jersey Department of Transportation State Bicycle & Pedestrian Coordinator 609.530.6551 sheree.davis@dot.state.nj.us 2011 New Jersey
2014 Regional Bicycle and Pedestrian Study Evaluation Tools Leslie A. Meehan, AICP MPO Technical Coordinating Committee Meeting April 1, 2015
 Mayor Mayor Kenneth Karl Dean, Wilber, Chairman 2014 Regional Bicycle and Pedestrian Study Evaluation Tools Leslie A. Meehan, AICP MPO Technical Coordinating Committee Meeting April 1, 2015 Evaluation
New Zealand Household Travel Survey December 2017
 New Zealand Household Travel Survey 2015-2017 December 2017 Disclaimer All reasonable endeavours are made to ensure the accuracy of the information in this report. However, the information is provided
Understanding Transit Demand. E. Beimborn, University of Wisconsin-Milwaukee
 Understanding Transit Demand E. Beimborn, University of Wisconsin-Milwaukee 1 Purpose To provide a basic understanding of transit ridership and some common misunderstandings. To explain concepts of choice
The Impact of Placemaking Attributes on Home Prices in the Midwest United States
 The Impact of Placemaking Attributes on Home Prices in the Midwest United States 2 0 1 3 C O N S T R U C T E D E N V I R O N M E N T C O N F E R E N C E M A R Y B E T H G R A E B E R T M I C H I G A N
NASHUA REGIONAL PLANNING COMMISSION REGIONAL BICYCLE AND PEDESTRIAN PLAN
 NASHUA REGIONAL PLANNING COMMISSION REGIONAL BICYCLE AND PEDESTRIAN PLAN June, 2005 Prepared by the Nashua Regional Planning Commission 2005 NRPC Regional Bicycle and Pedestrian Plan- JUNE 2005 ACKNOWLEDGEMENTS
1999 On-Board Sacramento Regional Transit District Survey
 SACOG-00-009 1999 On-Board Sacramento Regional Transit District Survey June 2000 Sacramento Area Council of Governments 1999 On-Board Sacramento Regional Transit District Survey June 2000 Table of Contents
Complete Streets Basics and Benefits
 Complete Streets Basics and Benefits November 14, 2017 Complete Streets Workshop Ann Ogoreuc, AICP, Allegheny County Economic Development Hannah E. Hardy, Allegheny County Health Department Benefits of
Webinar: Development of a Pedestrian Demand Estimation Tool
 Portland State University PDXScholar TREC Webinar Series Transportation Research and Education Center (TREC) 2-18-2016 Webinar: Development of a Pedestrian Demand Estimation Tool Kelly Clifton Portland
Cities Connect. Cities Connect! How Urbanity Supports Social Inclusion
 Cities Connect! How Urbanity Supports Social Inclusion Todd Litman Victoria Transport Policy Institute Metropolis Toronto, Canada - 14 June 2006 Cities Connect People with people. People with jobs. People
5/7/2013 VIA . RE: University Village Safeway Expansion (P13-019)
") 5/7/2013 VIA EMAIL David Hung, Associate Planner Community Development Department, Current Planning Division City of Sacramento 300 Richards Boulevard, 3 rd Floor Sacramento, CA 95811 RE: University Village
5/7/2013 VIA EMAIL David Hung, Associate Planner Community Development Department, Current Planning Division City of Sacramento 300 Richards Boulevard, 3 rd Floor Sacramento, CA 95811 RE: University Village
PUBLIC OPINION STRATEGIES
 PUBLIC OPINION STRATEGIES National Association of REALTORS The key findings from a national survey of 1,000 adults conducted October 5, 7, 9-10, 2007. 07574 Methodology Public Opinion Strategies is pleased
Active Community Design: Why Here? Why Now?
 Active Community Design: Why Here? Why Now? Chris Holm Development Review Coordinator 20 April, 2015 Sacramento, California Our environment has changed North Natomas We ve rapidly urbanize our open space
Appendix 22 Sea angling from a private or chartered boat
 Appendix 22 Sea angling from a private or chartered boat LUC SMRTS2015 Final Report 359 March 2016 Appendix 22 Sea angling from a private or chartered boat Table A22.1: Summary of sample confidence levels
RESIDENTIAL PREFERENCES AND PUBLIC HEALTH IN METRO VANCOUVER. Promoting Health and Well Being by Meeting the Demand for Walkable Urban Environments
 RESIDENTIAL PREFERENCES AND PUBLIC HEALTH IN METRO VANCOUVER Promoting Health and Well Being by Meeting the Demand for Walkable Urban Environments A UBC Health & Community Design Lab Report September 2014
Society for Behavioral Medicine, New Orleans, LA. April 12, 2012
 The Impact of the Built Environment and Safe Routes to School-Related Policies on Youth Active Travel in a National Sample of Public Elementary Schools Society for Behavioral Medicine, New Orleans, LA
cyclingincities opinion survey ABOUT THE STUDY WHO DID WE ASK? WHAT DID WE DO?
 cyclingincities opinion survey ABOUT THE STUDY Using a bicycle for transportation is good for the environment, and it also offers personal health benefits. Cycling is also feasible, since more than 80%
San Mateo County Comprehensive Bicycle and Pedestrian Plan Open House
 San Mateo County Comprehensive Bicycle and Pedestrian Plan Open House October 28, 2010 Presented to San Mateo County residents and interested parties by Lauren Ledbetter, Alta Planning + Design Matt Haynes,
Creating walkable, bikeable and transit-supportive communities in Halton
 Creating walkable, bikeable and transit-supportive communities in Halton By presenting current research and best practices, the information in this paper is meant to support and broaden discussion on how
Reference: Toronto Public Health. The Walkable City: Neighbourhood Design and Preferences, Travel Choices and Health. April 2012
 Reference: Toronto Public Health. The Walkable City: Neighbourhood Design and Preferences, Travel Choices and Health. April 2012 Authors: Kim Perrotta, Monica Campbell, Shawn Chirrey, Larry Frank and Jim
SACRAMENTO AREA TRAVEL SURVEY: BEFORE BIKE SHARE
 SACRAMENTO AREA TRAVEL SURVEY: BEFORE BIKE SHARE August 2017 A Research Report from the National Center for Sustainable Transportation Susan Handy, University of California, Davis Drew Heckathorn, University
Perryville TOD and Greenway Plan
 Perryville TOD and Greenway Plan Greenway Glossary Pathway: A bicycle and pedestrian path separated from motorized vehicular traffic by an open space, barrier or curb. Multi-use paths may be within the
North Carolina Complete Streets Summit. Welcome and Opening Plenary
 North Carolina Complete Streets Summit Welcome and Opening Plenary Schedule Overview 9:00 am 10:15 am 12:00 pm 1:15 pm 3:00 pm Opening Plenary Morning Breakout Sessions Lunch Afternoon Breakout Sessions
Appendix 13 Rowing and sculling in the sea
 Appendix 13 Rowing and sculling in the sea Steve Thompson SMRTS2015 Final Report 251 March 2016 Appendix 13 Rowing and sculling in the sea Table A13.1: Summary of sample confidence levels Responses Spatial
 2 3 40 35 30 25 20 15 10 5 0 1986 1987 1988 1989 1990 1991 1992 1993 1994 1995 1996 1997 1998 1999 Recommended Activity Physical Inactivity 4 90 89 89.3 88 87 87.1 86 85 85 84 83.9 83 82 81 1977 1983 1990
Building Community Partnerships for Mobility:
 Building Community Partnerships for Mobility: San Francisco 2008 Presented by: Cynthia Hoyle, AICP Transportation Planning Consultant Champaign-Urbana Mass Transit District Background The Heartland Champaign-Urbana,
DO OUR NEIGHBORHOODS REALLY MATTER FOR CHILDREN S HEALTH AND PHYSICAL ACTIVITY?
 DO OUR NEIGHBORHOODS REALLY MATTER FOR CHILDREN S HEALTH AND PHYSICAL ACTIVITY? Brian E. Saelens, Ph.D. Seattle Children s Research Institute, University of Washington Childhood Obesity and Public Health
Executive Summary. TUCSON TRANSIT ON BOARD ORIGIN AND DESTINATION SURVEY Conducted October City of Tucson Department of Transportation
 Executive Summary TUCSON TRANSIT ON BOARD ORIGIN AND DESTINATION SURVEY Conducted October 2004 Prepared for: City of Tucson Department of Transportation May 2005 TUCSON TRANSIT ON BOARD ORIGIN AND DESTINATION
Walking in New Zealand May 2013
 May 2013 Walking makes up 13 percent of total time travelled and 16 percent of the number of trip legs. On average women spend more time walking than men, walking 57 minutes per person per week, compared
Strategies to Promote the Availability of Affordable Healthy Food and Beverages
 Strategies to Promote the Availability of Affordable Healthy Food and Beverages CDC Recommended Strategies and Measurements Strategy #1: Communities Should Increase Availability of Healthier Food and Beverage
Automobile Alternatives. S. Handy TTP282 Transportation Orientation Seminar 10/28/11
 Automobile Alternatives S. Handy TTP282 Transportation Orientation Seminar 10/28/11 Why worry about them? Air quality Climate change Congestion Sprawl Equity Health U.S. Mode Split in 2001 Share of Person
KEYS TO GREAT PLACES
 KEYS TO GREAT PLACES A Changing America Demographics are destiny: changing, shrinking households 1960: 44% of US Households were Married Couples with Children A Changing America Demographics are destiny:
Smart Growth: Residents Social and Psychological Benefits, Costs and Design Barbara Brown
 Smart Growth: Residents Social and Psychological Benefits, Costs and Design Barbara Brown By Scott Siedor 11 At the invitation of the Goodwin-Niering Center for the Environment, Barbara Brown came to Connecticut
Built Environment Childhood Obesity Forum September 15, 2010
 Built Environment Childhood Obesity Forum September 15, 2010 TITLE Why do we have cities? Boston MA To minimize travel & maximize exchange (bring people closer together) How have we built our urban roadway
1. Slide Summary: This course covers methods and best practices used by professional planners, engineers, and consultants/researchers This course
 1 1. Slide Summary: This course covers methods and best practices used by professional planners, engineers, and consultants/researchers This course does not focus on advocacy; rather, it introduces current
Thresholds and Impacts of Walkable Distance for Active School Transportation in Different Contexts
 Thresholds and Impacts of Walkable Distance for Active School Transportation in Different Contexts Xuemei Zhu, Chanam Lee, Zhipeng Lu, Chia-Yuan Yu College of Architecture, Texas A&M University CONTENT
Table #6 VISION CHARACTERISTICS
 Table #6 VISION White Flint is a place to live, work, play, shop, and walk with sufficient density to encourage quality redevelopment. Vibrant streets and consistent streetscapes are important. CHARACTERISTICS
Rail Station Fact Sheet University of Dallas Station
 Rail Station Fact Sheet University of Dallas Station Station Overview University of Dallas Station is located on John Carpenter Freeway and west of Loop 12 across from the University of Dallas in Irving.
Sustainable Transportation Planning in the Portland Region
 Sustainable Transportation Planning in the Portland Region Jennifer Dill, Ph.D. Associate Professor School of Urban Studies & Planning jdill@pdx.edu http://web.pdx.edu/~jdill/ Outline Elements of a sustainable
Safety & Convenience for All Users, in All Modes. Barbara McCann NCSL December 3, 2013
 Safety & Convenience for All Users, in All Modes Barbara McCann NCSL December 3, 2013 Safety & Convenience for All Users? Who was left out when this road was planned? Takaaki Iwabu for Raleigh News Observer
Pedestrian Activity Criteria. PSAC March 8, 2011
 Pedestrian Activity Criteria PSAC March 8, 2011 Contents 1. Project Overview a) Revised schedule of PSAC hearings 2. Pedestrian Activity: Where walking is important a) Existing conditions (revisions based
CONCEPTUAL MODELS: THE RELATIONSHIP BETWEEN BUILT ENVIRONMENT AND HEALTH
 CONCEPTUAL MODELS: THE RELATIONSHIP BETWEEN BUILT ENVIRONMENT AND HEALTH TABLE OF CONTENTS Acknowledgements 3 Description of Process 4 Overview Model: From Built Environment to Public Health 8 Aggregate
FROM: CITY MANAGER DEPARTMENT: PLANNING AND COMMUNITY ENVIRONMENT DATE: OCTOBER 4, 2004 CMR:432:04
 TO: HONORABLE CITY COUNCIL FROM: CITY MANAGER DEPARTMENT: PLANNING AND COMMUNITY ENVIRONMENT DATE: OCTOBER 4, 2004 CMR:432:04 SUBJECT: FINANCE COMMITTEE RECOMMENDATION TO ADOPT TRANSPORTATION STRATEGIC
Defining Purpose and Need
 Advanced Design Flexibility Pilot Workshop Session 4 Jack Broz, PE, HR Green May 5-6, 2010 Defining Purpose and Need In your agency s project development process, when do design engineers typically get
Non-motorized Transportation Planning Resource Book Mayor s Task Force on Walking and Bicycling City of Lansing, Michigan Spring 2007 pg.
 Non-motorized Transportation Planning Resource Book pg. 105 of 158 Non-motorized Transportation Planning Resource Book pg. 106 of 158 Non-motorized Transportation Planning Resource Book pg. 107 of 158
Appendix B. NOP Responses
 Appendix B NOP Responses file://p:\projects - All Employees\D50000+\51362.01 65th Street EIR\ADEIR\Appendices\... Page 1 of 1 8/12/2008 From: Fedolia Harris [FHarris@cityofsacramento.org] Sent: Monday,
Planning Regionally With Transit
 Planning Regionally With Transit Nathan Coats Director of Operations CTAA Expo 2015 Tampa Began 1992. Serves eastern Cache County to Preston, ID. Population- 115,000 34 bus fleet, 26 fixed route buses;
Balboa Area Transportation Demand Management
 Balboa Area Transportation Demand Management April 2016 Presented by: Jeff Tumlin What Are We Aiming For? Transportation is not an end in itself. It is merely a means by which we support the community.