Society for Behavioral Medicine, New Orleans, LA. April 12, 2012
|
|
|
- Isabella Lyons
- 5 years ago
- Views:
Transcription
1 The Impact of the Built Environment and Safe Routes to School-Related Policies on Youth Active Travel in a National Sample of Public Elementary Schools Society for Behavioral Medicine, New Orleans, LA April 12, 2012 Sandy Slater, PhD Assistant Professor, University of Illinois at Chicago, School of Public Health
2 Acknowledgments Co-Authors: Lisa Nicholson, PhD Jamie Chriqui, PhD Haytham Zayd Lindsey Turner, PhD Frank Chaloupka, PhD The Research presented is funded by grants from RWJF and NICHD 2
3 Background and Significance 3
4 Comparison of the Usual Travel Mode To School for K-8th Grade Students, 1969 and Family Vehicle Walk/Bike School bus Transit Other National Center for Safe Routes to School,
5 Background and Significance Greater distances to school account for 50 percent of the decline in active travel to school. In percent of K-8 th grade students lived within one mile of school. In 1969, 89 percent of K-8th grade students who lived within one mile of school usually walked or bicycled to school. By 2009, only 35 percent of K-8th grade students who lived within a mile of school usually walked or bicycled to school even once a week. Recent research shows that schools in states with SRTS laws can increase the number of students who walk/bike to school. (McDonald 2007; NCSRTS, 2011; Chriqui et al. 2012) 5
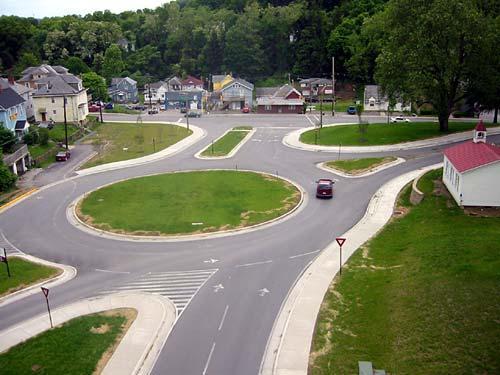
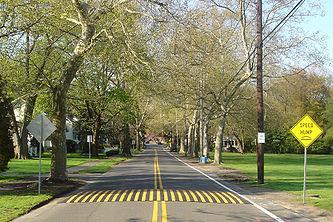
6 After a Systematic Review of the Scientific Literature, the Task Force on Community Preventive Services Recommends the Following Environmental and Policy Approaches to Increase Physical Activity Environmental Policy Approach Enhanced School-based Physical Education Community-Scale and Urban Design Land Use Policies Street-Scale Urban Design Land Use Policies Strategies Increase # of minutes spent in MVPA Mixed use, street connectivity, aesthetics and safety Roadway design standards, traffic calming, safe street crossings, street lighting 6
7 Impact of the built environment and Safe Routes to School-Related policies on youth active travel in a national sample of public elementary schools- Preliminary Results 7
8 The Food and Fitness Survey Data The Food and Fitness Project was launched in 2007 to assess obesity-relevant policies and practices among US elementary schools and their corresponding schools districts. Data were obtained from annual mail-back surveys of school administrators at nationally representative samples of public elementary schools for the through school years. Stacked cross-sectional analysis of 1,020 public elementary schools, nested within 47 states. State laws were obtained through primary legal research. All models controlled for SRTS-related state laws; principal-reported barriers to walking/biking to school; region, locale; school racial composition; % of students receiving free-reduced lunch; and, total number of students attending school. 8
9 The Food and Fitness Survey Data 17.6 percent of students in the sample walk/bike to school, 84% of schools allow students to walk/bike. 54% of schools in sample allow all students to bike to school 77% allow all students to walk to school 31% of principals reported lack of sidewalks as a barrier to walking/biking 56% of principals reported traffic danger as a barrier to walking/biking 44% of principals reported distance as a barrier to walking/biking 20% of principals reported lack of crossing guards as a barrier to walking/biking On average buffers had an intersection density of 372/sq. mi. On average 55% of the streets in our buffers had higher road classifications (i.e. speed limits) 9
10 The Food and Fitness Survey Data 49% of states have a Minimum Bussing Distance law. 22.2% require Sidewalks to be maintained or constructed around schools. 9.8% require crossing guards 38.6% require traffic control measures (e.g. speed humps, traffic calming devices) 81% require speed zones around schools. 10
11 Traffic Calming Scale: Latent Variable Construction L1 IntDensity_25 Dividers_25 LowMobility_25 Parking_25 RoundAbout_


12 12
13 Associations between traffic calming scale and components on Walking/Biking to School across buffers Significance of Poisson Models (RR) (N=1686) ¼ Mile ½ Mile ¾ Mile 1 Mile Traffic Calming Scale *** *** *** *** Scale Items: Intersection Density *** *** *** *** Parking * * * ** Dividers ** ** ** *** Low Mobility *** *** *** *** Roundabouts ns ns ns ns * p<.10, **p<.05, ***p<.01, ns=not significant 13
14 Associations between traffic calming scale and components on Walking/Biking to School across buffers Significance of Inflate Models (OR) (N=1686) ¼ Mile ½ Mile ¾ Mile 1 Mile Traffic Calming Scale ns ns ns ns Scale Items: Intersection Density ** ns ns ns Parking *** *** *** *** Dividers ** ns * ns Low Mobility ns ns ns ns Roundabouts ** ns ns ns * p<.10, **p<.05, ***p<.01, ns=not significant 14
15 Impact of built environment on Youth Active Travel Preliminary Results Results of Poisson Models (OR) (N=1686) Traffic Calming Scale ¼ Mile ½ Mile ¾ Mile 1 Mile (0.753, 1.297) Traffic Danger 1.11 (0.898, 1.371) Mean Speed Limit (0.858, 1.043) (0.598, 1.200) (0.639, 1.244) (0.876, 1.181) (0.782, 1.376) (0.645, 1.272) (0.877, 1.145) (0.889, 1.212) (0.701, 1.180) (0.834, 1.120) Minimum Busing Distance (0.490, 0.867) (0.493, 0.872) (0.492, 0.875) (0.482, 0.870) Sidewalk Construction (0.228, 0.892) (0.239, 0.857) (0.229, 0.801) (0.211, 0.747) Crossing Guards (0.177, 0.713) (0.180, 0.764) (0.189, 0.778) (0.167, 0.658) Traffic Control Measures (0.665, 2.536) (0.692, 2.541) (0.664, 2.489) (0.689, 2.550) Required Speed Zones (0.411, 1.379) (0.403, 1.295) (0.390, 1.266) (0.397, 1.248) Slater et al in development 15
16 Impact of built environment on Youth Active Travel Preliminary Results Results of Poisson Models (RR) (N=1686) Traffic Calming Scale ¼ Mile ½ Mile ¾ Mile 1 Mile (1.022, 1.059) Traffic Danger (0.976, 1.091) (1.022, 1.052) (0.999, 1.024) (1.017, 1.051) (0.968, 0.993) (1.021, 1.056) (0.996, 1.013) Mean Speed Limit (0.965, 0.993) (0.972, 1.000) 1 (0.984, 1.016) 0.99 (0.963, 1.017) Minimum Busing Distance (0.991, 1.124) (0.988, 1.122) (0.989, 1.113) (0.993, 1.116) Sidewalk Construction (1.014, 1.335) (0.998, 1.319) (0.979, 1.313) (0.988, 1.315) Crossing Guards (0.969, 1.408) (0.932, 1.350) (0.936, 1.346) (0.943, 1.351) Traffic Control Measures (0.789, 1.084) (0.777, 1.073) (0.782, 1.081) 0.91 (0.776, 1.069) Required Speed Zones (.0789, 1.132) (0.808, 1.174) (0.803, 1.166) (0.786, 1.128) Slater et al in development 16
17 Predicted probability % walk/bike to school across traffic calming scale range & buffers W a l k / B i k e Traffic Calming Scale 1/4 Mile 1/2 Mile 3/4 Mile 1 Mile 17
18 Conclusions We found that among schools where students walk/bike a greater presence of traffic calming infrastructure near schools increased the odds of students walking/biking to school. These findings can help inform federal, state and local policy, such as: Local: community development plans (Zoning and Subdivision ordinances) and school siting plans. State: State-level SRTS laws Federal: funding for SRTS one of the largest programs that fund biking and walking infrastructure. Changes in the built environment require long-term planning, but they can also have lasting health effects and provide one possible solution to help combat the obesity epidemic. 18
The Impact of Policy and Environmental Outcomes on Youth Physical Activity
 The Impact of Policy and Environmental Outcomes on Youth Physical Activity Childhood Obesity Conference, San Diego, CA June 30, 2011 Sandy Slater, PhD Assistant Professor, University of Illinois at Chicago,
Walkable Communities and Adolescent Weight
 Walkable Communities and Adolescent Weight Sandy Slater, PhD Assistant Professor, University of Illinois at Chicago, School of Public Health Research Scientist, UIC Institute for Health Research and Policy
National Safe Routes to School Program: Initial Results
 National Safe Routes to School Program: Initial Results Lauren Marchetti National Center for Safe Routes to School 9 th Annual New Partners for Smart Growth Thursday, February 4, 2010 Seattle, WA August
Safe Routes to School Program in California: An Update
 Safe Routes to School Program in California: An Update Claudia Chaufan, MD, PhD Jarmin Yeh, MSSW, MPH Leslie Ross, PhD Pat Fox, PhD, MSW Institute for Health & Aging, Department of Social and Behavioral
Using Google Street View to measure the implementation of zoning and land use policies across communities
 Using Google Street View to measure the implementation of zoning and land use policies across communities Sandy Slater, PhD, MS Active Living Research Conference Clearwater Beach, FL February 3, 2016 Project
Measuring the Built Environment Using a Street Segment Instrument
 Measuring the Built Environment Using a Street Segment Instrument Sandy Slater, PhD (sslater@uic.edu) University of Illinois at Chicago, School of Public Health International Society for Behavioral Nutrition
Lawrence Safe Routes to School. Community Meeting January 14, 2015
 Lawrence Safe Routes to School Community Meeting January 14, 2015 Safe Routes to School The 6 E s Education Encouragement Enforcement Engineering Evaluation Equity What are the elements of a SRTS plan?
Built Environment Childhood Obesity Forum September 15, 2010
 Built Environment Childhood Obesity Forum September 15, 2010 TITLE Why do we have cities? Boston MA To minimize travel & maximize exchange (bring people closer together) How have we built our urban roadway
Getting Your SRTS Project Funded. Ryan Snyder
 Getting Your SRTS Project Funded Ryan Snyder Steps in Submitting a Successful Application 1. Stakeholder outreach: create a SRTS coalition 2. Develop a comprehensive plan and program with all 5 Es 3. Conceive
How Policy Drives Mode Choice in Children s Transportation to School
 How Policy Drives Mode Choice in Children s Transportation to School Physical Activity through Active Transportation Ruth L. Steiner 2011 Technical Conference and Exhibit Lake Buena Vista, FL April 3-6,
Summary Report School Walking & Bicycling Audits. Mesa County Regional Transportation Planning Office
 Summary Report School Walking & Bicycling Audits Mesa County Regional Transportation Planning Office This page left blank intentionally WALKING & BICYCLING AUDIT SUMMARY 2 Executive Summary Background:
Sustainable Transportation Initiatives and Plans in Caledon
 Sustainable Transportation Initiatives and Plans in Caledon Arash Olia, P.Eng., PhD. Coordinator, Transportation Development Finance & Infrastructure Services Town of Caledon Eric Chan, P.Eng., PMP Manager,
Non-motorized Transportation Planning Resource Book Mayor s Task Force on Walking and Bicycling City of Lansing, Michigan Spring 2007 pg.
 Non-motorized Transportation Planning Resource Book pg. 105 of 158 Non-motorized Transportation Planning Resource Book pg. 106 of 158 Non-motorized Transportation Planning Resource Book pg. 107 of 158
C/CAG. Sunnybrae Elementary School Walking and Bicycling Audit. San Mateo-Foster City School District JUNE 2013
 Sunnybrae Elementary School Walking and Bicycling Audit JUNE 2013 San Mateo-Foster City School District C/CAG City/County Association of Governments of San Mateo County SUNNYBRAE ELEMENTARY SCHOOL WALKING
AGENDA. 5. Next Steps a. Survey Distribution b. Draft Action Plan/Recommendations c. Review at next meeting in advance of document preparation
 Congdon Elementary Safe Routes to School Plan Update SRTS Team Meeting #2-Walk Audit March 21, 2018, 3:00 p.m. Congdon Elementary School Art Room-Duluth, MN 1. Welcome and Introductions 2. SRTS Review
SUSTAINABILITY, TRANSPORT, & HEALTH. Ralph Buehler, Virginia Tech
 SUSTAINABILITY, TRANSPORT, & HEALTH Ralph Buehler, Virginia Tech Prepared for National Academies Roundtable on Science and Technology for Sustainability 6 December 2013 Overview Trends in Motorization
San Ramon Elementary School. Travel Plan
 San Ramon Elementary School Travel Plan TABLE OF CONTENTS 1. PURPOSE... 1 1.1. SR2S PLANNING, IMPLEMENTATION AND MONITORING... 1 1.2. MARIN COUNTY MEASURE A... 1 2. SAN RAMON ELEMENTARY SCHOOL PROFILE...
Item 7 Enclosure Citizens Advisory Committee March 27, 2013 San Francisco Safe Routes to School Program
 Item 7 Enclosure Citizens Advisory Committee March 27, 2013 1 San Francisco Safe Routes to School Program Ana Validzic, MPH SF Department of Public Health 2 Safe Routes to School Program Need Fewer kids
Parent Survey Report: One School in One Data Collection Period
 Parent Survey Report: One School in One Data Collection Period School Name: Pinckney Elementary School Set ID: 12170 School Group: Douglas County Month and Year Collected: October 2014 School Enrollment:
Safe Routes to School: Neighborhood Assessment Guide
 Safe Routes to School: Neighborhood Assessment Guide September 2012 Safe Routes to School Program Minnesota Department of Transportation 395 John Ireland Blvd., Mail Stop 430 St. Paul, MN 55155 Phone:
Parent Survey Report: One School in One Data Collection Period
 Parent Survey Report: One School in One Data Collection Period School Name: Bilquist Elementary School Set ID: 15803 School Group: Clackamas County Month and Year Collected: December 2016 School Enrollment:
A Safe Routes to School Survey in Hillsborough County
 A Safe Routes to School Survey in Hillsborough County Prepared for Florida Department of Transportation, District 7 Project Manager: Peter Hsu, P.E. Prepared by Huaguo Zhou, Ph.D., P.E. Senior Research
Driverless Vehicles Potential Influence on Bicyclist Facility Preferences
 Driverless Vehicles Potential Influence on Bicyclist Facility Preferences MICHAEL BLAU, MCRP, LCI O T E C O C T O B E R 2 6, 2 0 1 6 S E S S I O N # 8 2 - E V A L U AT I N G T H E P E R F O R M A N C E
Carpooling Without the Car: Walking School Bus and Bicycle Train Program
 Carpooling Without the Car: Walking School Bus and Bicycle Train Program Jason Jackman Safe Routes to School Regional Coordinator Center for Urban Transportation Research University of South Florida In
Planning Guidance in the 2012 AASHTO Bike Guide
 Planning Guidance in the 2012 AASHTO Bike Guide Presentation by: RJ Eldridge Peter Lagerwey August 22, 2012 WEBINAR 2: PLANNING GUIDANCE IN THE 2012 AASHTO BIKE GUIDE Today s Webinar Significant Updates
Rim Rock Elementary School Walking and Biking Audit
 Rim Rock Elementary School Walking and Biking Audit September 29, 2016 Rim Rock Elementary School Audit for Walking and Biking September 29, 2016 Audit Team Members: Sam Atkins, City Engineer, City of
Aitkin School Routing Plan July 2010
 Aitkin School Routing Plan July 2010 Prepared by: Arrowhead Regional Development Commission Regional Planning Division Aitkin School Routing Plan July 2010 Aitkin School Routing Plan July 2010 Prepared
Why Zone In on Speed Reduction?
 Learn it. Do it. Live it! SPEED REDUCTION IN THE ZONE Why Zone In on Speed Reduction? Speeding is a serious issue that plays a major role in the risk of serious injury and pedestrian fatality in a crash.
2016 APS Go! Surveys Summary Results for Oakridge Elementary School
 2016 APS Go! Surveys Summary Results for Oakridge Elementary School This report summarizes results from the 2016 APS Go! surveys for Oakridge Elementary School. Student, parent/caregiver and staff surveys
FAYETTE COUNTY. Fayette County Active Transportation Profile REGIONAL ACTIVE TRANSPORTATION PLAN FOR SOUTHWESTERN PENNSYLVANIA
 REGIONAL ACTIVE TRANSPORTATION PLAN FOR SOUTHWESTERN PENNSYLVANIA 1 2 ACTIVE TRANSPORTATION AT A GLANCE Trails + Bike Routes 4 miles 73 miles 130 miles 90 miles Parkland Parkland Trail Off Street Trail
Implementing the Three Es of School Zone Traffic Calming
 Implementing the Three Es of School Zone Traffic Calming Use this evaluation tool as a guide to analyze the specific safety needs of your school. SCHOOL PROFILE School Name: School District: Address: Phone
Safe Routes to School Comprehensive Plan
 Safe Routes to School Comprehensive Plan City of Apple Valley Dakota County, MN May 2010 Prepared by: Project Background The Statewide Health Improvement Program (SHIP) aims to help Minnesotans live longer,
Blueprint for Active Living Communities: Innovative Solutions. James Sallis University of California, San Diego For IOM PA Workshop.
 Blueprint for Active Living Communities: Innovative Solutions James Sallis University of California, San Diego For IOM PA Workshop. April 15, 2015 Outline of Talk Do built environments matter? Progress
City of Charlottesville Bicycle and Pedestrian Master Plan Update
 City of Charlottesville Bicycle and Pedestrian Master Plan Update September 17, 2014 I. Welcome and meeting overview II. Project status update III. Network overview IV. Break-out groups Pedestrian Network
Safe Routes to School PLAN
 CONGDON ELEMENTARY Safe Routes to School PLAN SRTS Team Kick-off Meeting February 8, 2018 AGENDA Welcome and Introductions Safe Routes to School Program Overview History of SRTS work at Congdon Elementary
Introduction.
 2307-1.0. Introduction. Delaware s Safe Routes to School (SRTS) Program was established September 10, 2002 when Governor Ruth Ann Minner signed Senate Bill 353 of the 141st General Assembly of Delaware
DO OUR NEIGHBORHOODS REALLY MATTER FOR CHILDREN S HEALTH AND PHYSICAL ACTIVITY?
 DO OUR NEIGHBORHOODS REALLY MATTER FOR CHILDREN S HEALTH AND PHYSICAL ACTIVITY? Brian E. Saelens, Ph.D. Seattle Children s Research Institute, University of Washington Childhood Obesity and Public Health
Bicycle and Pedestrian Level of Service Evaluation
 Bicycle and Pedestrian Level of Service Evaluation June 214 Florida Department of Transportation Bicycle and Pedestrian Evaluation Prepared by Sprinkle Consulting Cambridge Systematics For the Florida
Wellington Exempted Village School District SAFE ROUTES TO SCHOOL TRAVEL PLAN January 2014
 Wellington Exempted Village School District SAFE ROUTES TO SCHOOL TRAVEL PLAN January 2014 OHIO SAFE ROUTES TO SCHOOL WELLINGTON EXEMPTED VILLAGE SCHOOL DISTRICT TRAVEL PLAN SECTION 1: WELLINGTON EXEMPTED
Arlington Public Schools Thomas Jefferson Site Evaluation Preliminary Findings. Thomas Jefferson Working Group Meeting #2 October 1, 2014
 Arlington Public Schools Thomas Jefferson Site Evaluation Preliminary Findings Thomas Jefferson Working Group Meeting #2 October 1, 2014 SAN ANTONIO BEXAR COUNTY PEDESTRIAN SAFETY ACTION PLAN INTRODUCTION
School Travel Survey for Principals. 1. How do most of your students get to school in the morning? (Please select only one box)
") School Travel Survey for Principals 1. How do most of your students get to school in the morning? (Please select only one box) by school bus by public transportation (e.g., city bus) by other motor vehicle
School Travel Survey for Principals 1. How do most of your students get to school in the morning? (Please select only one box) by school bus by public transportation (e.g., city bus) by other motor vehicle
WALKSacrame nto. Welcomes you to the 2009 Sacramento County Safe Routes to School Conference
 Sacramento County Department of Transportation Ron Vicari, Principal Civil Engineer In Partnership with: WALKSacrame nto Anne Geraghty, Terry Preston & Staff Welcomes you to the 2009 Sacramento County
Safe Routes to School Action Plan Aberdeen, Idaho
 Background Aberdeen, Idaho is a largely agricultural community of nearly 2,000 people and is located in the southeast portion of the state on the western edge of American Falls Reservoir. The community
City of Elizabeth City Neighborhood Traffic Calming Policy and Guidelines
 City of Elizabeth City Neighborhood Traffic Calming Policy and Guidelines I. Purpose: The City of Elizabeth City is committed to ensure the overall safety and livability of residential neighborhoods. One
Prioritizing Schools for Safe Routes to School Infrastructure Projects
 Prioritizing Schools for Safe Routes to School Infrastructure Projects Determining the most effective use of limited infrastructure funds is a challenging task. It is especially demanding for local transportation
Bikeway action plan. Bicycle Friendly Community Workshop March 5, 2007 Rochester, MN
 Bikeway action plan Summary The was held on March 5, 2007 at the Rochester Mayo Civic Center. The workshop was hosted by Rochester-Olmsted County Planning Department in collaboration with the League of
Parent Survey Report: One School in One Data Collection Period
 Parent Survey Report: One School in One Data Collection Period School Name: Broken Arrow Elementary School Set ID: 12172 School Group: Douglas County Month and Year Collected: October 2014 School Enrollment:
New York City School Safety Engineering Program. Jackson Wandres The RBA Group June 09, 2005
 8,008,271 858,661 New York City School Safety Engineering Program Jackson Wandres The RBA Group June 09, 2005 Office of School Safety Engineering Project Goals 1) Improve traffic and pedestrian safety.
SAFE ROUTES TO SCHOOL (SR2S)
") SAFE ROUTES TO SCHOOL (SR2S) In partnership with Burbank Unified School District (BUSD) & City of Burbank George Washington Elementary School Thomas Jefferson Elementary School John Muir Middle School
SAFE ROUTES TO SCHOOL (SR2S) In partnership with Burbank Unified School District (BUSD) & City of Burbank George Washington Elementary School Thomas Jefferson Elementary School John Muir Middle School
About the Active Transportation Alliance
 About the Active Transportation Alliance Chicagoland s voice for better biking, walking and transit Founded 1985 7,000 members, ~33 full time staff Serve Chicago metro region 1 More Cars, More Driving
AMHERST EXEMPTED VILLAGE SCHOOLS AND SAINT JOSEPH SCHOOL
 AMHERST EXEMPTED VILLAGE SCHOOLS AND SAINT JOSEPH SCHOOL SAFE ROUTES TO SCHOOL TRAVEL PLAN 12/11/18 DRAFT OHIO SAFE ROUTES TO SCHOOL SCHOOL TRAVEL PLAN Ohio s Safe Routes to School Travel Plan Template
CHAPTER 18 NEIGHBORHOOD TRAFFIC SAFETY TABLE OF CONTENTS
 CHAPTER 18 NEIGHBORHOOD TRAFFIC SAFETY TABLE OF CONTENTS Section Title Page 18.1 General... 18-1 18.1.1 Intended Use...18-1 18.1.2 Traffic Calming for New Street Design...18-1 18.1.3 Roundabouts and Mini
Health and Community Design: The Local Government Role in Promoting Active Living
 Health and Community Design: The Local Government Role in Promoting Active Living Rich Killingsworth, Director Active Living by Design National Program Office University of North Carolina School of Public
Health and the Built Environment Presentation to the Childhood Obesity Conference
 Presentation to the Childhood Obesity Conference By Cole Runge, Principal Planner Brown County Planning Commission September 29, 2011 The built environment strongly influences physical and mental health.
Safe Routes to School Blue Zones Project, City of
 Safe Routes to School Blue Zones Project, City of Fort Worth and FWISD Partnership Introduction to Blue Zones Project Blue ZonesProject is a well-being improvement initiative designed to make healthy choices
Florida s Intersection Safety Implementation Plan (ISIP)
") Florida Department of TRANSPORTATION Florida s Intersection Safety Implementation Plan (ISIP) Alan El-Urfali, PE State Traffic Engineering and Operations Office March 28, 2017 Intersection Safety Implementation
Florida Department of TRANSPORTATION Florida s Intersection Safety Implementation Plan (ISIP) Alan El-Urfali, PE State Traffic Engineering and Operations Office March 28, 2017 Intersection Safety Implementation
City of White Rock. Strategic Transportation Plan. May 16, 2005
 City of White Rock Strategic Transportation Plan May 16, 2005 1 Outline Scope of Plan & Approach Council input and direction Key issues based on existing conditions Range of strategies to consider? Next
BUILT FOR WALKING: SAFE ENVIRONMENTS FOR ACTIVE SCHOOL TRANSPORTATION
 TS4.1 BUILT FOR WALKING: SAFE ENVIRONMENTS FOR ACTIVE SCHOOL TRANSPORTATION June 24, City-School Boards Advisory Committee Linda Rothman, BScOT, PhD, Post-Doctoral Fellow, York University, School of Kinesiology
Pedestrian, Bicycle and Traffic Calming Strategic Implementation Plan. January 18, 2011
 Pedestrian, Bicycle and Traffic Calming Strategic Implementation Plan January 18, 2011 Tonight s Agenda Receive update on project Provide feedback on two policy issues Complete Streets Policy Project Prioritization
Childhood Obesity: A Policy Perspective
 Leadership for Healthy Communities Advancing Policies to Support Healthy Eating and Active Living Childhood Obesity: A Policy Perspective Elizabeth Hinman elizabeth@leadershipforhealthycommunities.org
Planning Study SR 976. Project Advisory Team Meeting May 24, 2017
 ` SR 976 BIRD ROAD/SW 40TH STREET FROM SR 821/HEFT TO SR 5/US-1 Miami-Dade County, Florida FPID No.: 434845-4-22-01 Planning Study Project Advisory Team Meeting May 24, 2017 1 Agenda Introductions Project
Protected Bike Lanes in San Francisco Mike Sallaberry SFMTA NACTO Workshop - Chicago IL
 Protected Bike Lanes in San Francisco Mike Sallaberry SFMTA 10 14 2011 NACTO Workshop - Chicago IL San Francisco 2 nd Highest Density in the U.S. 47 square miles Mild Climate Market Population ~810,000
MEMORANDUM. Discussion of the planned crosswalk improvement on Mount Vernon Road near Stratham Drive
 MEMORANDUM To: From: Mayor and City Council Michael Smith, Public Works Director Date: August 24, 2015 Subject: Discussion of the Mount Vernon Road Crosswalk Improvement ITEM DESCRIPTION Discussion of
2016 APS Go! Surveys Summary Results for Arlington Traditional School
 2016 APS Go! Surveys Summary Results for Arlington Traditional School This report summarizes results from the 2016 APS Go! surveys for Arlington Traditional School. Student, parent/caregiver and staff
Built Environment and Older Adults: Supporting Smooth Transitions Across the Life- Span. Dr. Lawrence Frank, Professor and Bombardier UBC
 Built Environment and Older Adults: Supporting Smooth Transitions Across the Life- Span Dr. Lawrence Frank, Professor and Bombardier Chair @ UBC The Hidden Health Costs of Transportation - Frank et al
Vallecito Elementary School. Travel Plan
 Vallecito Elementary School Travel Plan TABLE OF CONTENTS 1. PURPOSE... 1 1.1. SR2S PLANNING, IMPLEMENTATION AND MONITORING... 1 1.2. MARIN COUNTY MEASURE A... 1 2. VALLECITO ELEMENTARY SCHOOL PROFILE...
Road safety and bicycle usage impacts of unbundling vehicular and cycle traffic in Dutch urban networks
 Road safety and bicycle usage impacts of unbundling vehicular and cycle traffic in Dutch urban networks Paul Schepers Ministry of Infrastructure and the Environment SWOV Institute for Road Safety Research
LAWRENCE, KS KEY STEPS TO SILVER CATEGORY SCORES KEY OUTCOMES 10 BUILDING BLOCKS OF A BICYCLE FRIENDLY COMMUNITY /10 3 /10 2 /10
 LAWRENCE, KS Fall 2016 TOTAL POPULATION 91282 POPULATION DENSITY 2664.4 # OF LOCAL BICYCLE FRIENDLY BUSINESSES 1 TOTAL AREA (sq. miles) 34.3 # OF LOCAL BICYCLE FRIENDLY UNIVERSITIES 0 10 BUILDING BLOCKS
Safe Routes to School Comprehensive Plan
 Safe Routes to School Comprehensive Plan City of Rosemount Dakota County, MN June 2010 Prepared by: Project Background The Statewide Health Improvement Program (SHIP) aims to help Minnesotans live longer,
FREMONT CITY SCHOOLS STP
 FREMONT CITY SCHOOLS STP SAFE ROUTES TO SCHOOL TRAVEL PLAN February 2014 OHIO SAFE ROUTES TO SCHOOL SCHOOL TRAVEL PLAN SECTION 1: OUR SCHOOL(S) 1A. Identify Target Schools School District School Name School
SAFE ROUTES TO SCHOOL
 SAFE ROUTES TO SCHOOL Forest Ridge Elementary School Existing Conditions and ACTION PLAN > Oak Creek - Franklin Joint School District Table of Contents CONTEXT Enrollment Boundaries
PRINCE GEORGE S PLAZA METRO AREA PEDESTRIAN PLAN
 PRINCE GEORGE S PLAZA METRO AREA PEDESTRIAN PLAN May 28, 2008 Agenda Welcome and introductions Project overview and issue identification Planning context and strengths Design challenges and initial recommendations
Existing Pedestrian Conditions. PSAC February 8, 2011
 Existing Pedestrian Conditions PSAC February 8, 2011 Contents 1. Project Background & Goals 2. Pedestrian Activity: Where people walk 3. Pedestrian Safety: The conditions people face Project Background
3 Silverton High School Report
 3 Silverton High School Report Principal: Justin Lieuallen Grades: 9-12 Enrollment: 1,277 Address: 1456 Pine Street First bell: 7:55 a.m. Silverton, OR 97381 Last bell: 3:05 p.m. Free & Reduced Lunch:
Safe Routes to School: Creating an Action Plan Template
 odot25m Page 1 4/13/2016-1 - Safe Routes to School: Creating an Action Plan Template Note: This document can be protected to prevent unintended changes to the form. If you wish to protect the template,
Active Transportation in Billings Area Schools: A
 Active Transportation in Billings Area Schools: A report on the current practices and policies Prepared by: AmeriCorps VISTA Isaac Mevis and Emily Martin - Billings Metro VISTA Project Prepared for: Billings
2016 APS Go! Surveys Summary Results for Trades Center
 2016 APS Go! Surveys Summary Results for Trades Center This report summarizes results from the 2016 APS Go! surveys for Trades Center. Staff surveys were conducted at all schools and work sites as part
COASTAL RAIL TRAIL ROSE CREEK BIKEWAY PROJECT COMMUNITY WORKSHOP #2 AUGUST 15, 2013
 COASTAL RAIL TRAIL ROSE CREEK BIKEWAY PROJECT COMMUNITY WORKSHOP #2 AUGUST 15, 2013 CHRIS CARTERETTE, AICP PROJECT MANAGER Chris.Carterette@sandag.org Direct: 619-699.7319 REGIONAL PLANNING BACKGROUND
SAFE ROUTES TO SCHOOL
 SAFE ROUTES TO SCHOOL Edgewood Elementary School Existing Conditions and ACTION PLAN > Oak Creek - Franklin Joint School District Table of Contents CONTEXT Enrollment Boundaries Enrollment
SANTA CLARA COUNTYWIDE BICYCLE PLAN August 2008
 SANTA CLARA COUNTYWIDE BICYCLE PLAN August 2008 To assist VTA and Member Agencies in the planning, development and programming of bicycle improvements in Santa Clara County. Vision Statement To establish,
Castro Valley Municipal Advisory Council March 19, 2018
 Castro Valley Municipal Advisory Council March 19, 2018 1 Background 2 Draft Bicycle Vision and Pedestrian Networks 3 Next Steps 4 Updates Agenda 2 PROJECT AREA: Unincorporated Areas of Alameda County
FLETCHER AVENUE PEDESTRIAN AND BICYCLIST BEHAVIOR CHANGE FORMATIVE RESEARCH PROJECT
 FLETCHER AVENUE PEDESTRIAN AND BICYCLIST BEHAVIOR CHANGE FORMATIVE RESEARCH PROJECT EXTENT OF CHANGES IN PEDESTRIAN AND BICYCLIST ATTITUDES AND BEHAVIORS DIRECTLY AFTER A COMPLETE STREETS PROJECT IN FLORIDA
Sardis Elementary School Road Safety Plan. Produced by: Sardis Elementary School - Safer School Travel Team in cooperation with Safer City
 Sardis Elementary Road Safety Plan Produced by: Sardis Elementary - Safer Travel Team in cooperation with Safer City Plan completed in January 2016 1 Acknowledgements It takes commitment and community
THESE DAYS IT S HARD TO MISS the story that Americans spend
 WHICH COMES FIRST: THE NEIGHBORHOOD OR THE WALKING? BY SUSAN HANDY AND PATRICIA MOKHTARIAN THESE DAYS IT S HARD TO MISS the story that Americans spend more time stuck in traffic than ever, that they re
Safety and Active Transport. Dr. Maureen Carew, Medical Officer of Health Renfrew County and District Health Unit May 30, 2014
 Safety and Active Transport Dr. Maureen Carew, Medical Officer of Health Renfrew County and District Health Unit May 30, 2014 Active Transport Vision Increase levels of walking and cycling Reduce vehicle
CITY OF KASSON TRANSPORTATION ALTERNATIVES KASSON SAFE ROUTES TO SCHOOL
 ve ha 8t G B A Mantorville Ave N 240th Ave 16th St NE 11th Ave NE K-M HIGH SCHOOL SUNRISE TRAIL TO MANTORVILLE MNTH 57 SUNSET TRAIL TO MANTORVILLE NE PARK 16TH ST NE TRAIL K-M ELEMENTARY SCHOOL K-M MIDDLE
KEARNY MESA COMMUNITY PLAN UPDATE
 KEARNY MESA COMMUNITY PLAN UPDATE January 18, 2018 SUBCOMMITTEE MEETING Mobility Concepts and Urban Design Presentation Outline Mobility Concepts: Multimodal Planning Toolbox Presentation and Activities
CITY OF COCOA BEACH 2025 COMPREHENSIVE PLAN. Section VIII Mobility Element Goals, Objectives, and Policies
 CITY OF COCOA BEACH 2025 COMPREHENSIVE PLAN Section VIII Mobility Element Goals, Objectives, and Policies Adopted August 6, 2015 by Ordinance No. 1591 VIII MOBILITY ELEMENT Table of Contents Page Number
Beyond First First Last Last Mile Strategies. APA National Conference April 3, 2016 Chelsea Richer, AICP Fehr & Peers
 Beyond First First Last Last Mile Strategies APA National Conference April 3, 2016 Chelsea Richer, AICP Fehr & Peers 1 Beyond First Last Mile Strategies APA National Conference Jeremy Klop, AICP, Fehr
Safe Routes to School: Creating an Action Plan Template
 odot25m Page 1 4/13/2016-1 - Safe Routes to School: Creating an Action Plan Template Note: This document can be protected to prevent unintended changes to the form. If you wish to protect the template,
Chapter 2. Bellingham Bicycle Master Plan Chapter 2: Policies and Actions
 Chapter 2 Bellingham Bicycle Master Plan Chapter 2: Policies and Actions Chapter 2: Policies and Actions The Bicycle Master Plan provides a road map for making bicycling in Bellingham a viable transportation
OLDER PEOPLE INDEPENDENT MOBILITY FOR LIVEABLE COMMUNITIES. Christopher G B (Kit) Mitchell
 Mitchell") OLDER PEOPLE INDEPENDENT MOBILITY FOR LIVEABLE COMMUNITIES by Christopher G B (Kit) Mitchell Independent mobility is necessary for a high quality of adult life In developed countries, the automobile has
OLDER PEOPLE INDEPENDENT MOBILITY FOR LIVEABLE COMMUNITIES by Christopher G B (Kit) Mitchell Independent mobility is necessary for a high quality of adult life In developed countries, the automobile has
o n - m o t o r i z e d transportation is an overlooked element that can greatly enhance the overall quality of life for the community s residents.
 N o n - m o t o r i z e d transportation is an overlooked element that can greatly enhance the overall quality of life for the community s residents. 84 Transportation CHAPTER 11 INTRODUCTION Transportation
Austell Road Access Management Plan Public Meeting February 17, 2009
 Austell Road Access Management Plan Public Meeting February 17, 2009 Laraine Vance: Dan Cohen: Cobb DOT Project Manager Pond & Company Planning Director 1 Access Management What is Access Management? The
Copenhagen Cycling Map. Red Lines Cycling facilities
 Copenhagen Cycling Map Red Lines Cycling facilities Copenhagen Cycling Facilities Design Approaches Transportation without Pollution Copenhagen s Strategy Where Cycling is one of the top key activities
Public Health in the Public Realm: Influencing Street Design with Health in Mind Dr. David McKeown Medical Officer of Health
 Public Health in the Public Realm: Influencing Street Design with Health in Mind Dr. David McKeown Medical Officer of Health Complete Streets Forum April 23, 2010 Common Goals of Public Health and Complete
7 Complete Streets & Roadway Aesthetics
 7 Complete Streets & Roadway Aesthetics 7.1 OVERVIEW Our streets lay the foundation for how we interface with travel needs, physical exercise, social exchanges and access to goods and services. They are
Safe Routes to School
 Safe Routes to School Survey Results of Students in Breckenridge, Minnesota North Dakota State Data Center at North Dakota State University, an Equal Opportunity Ins tu on October 2010 h p://www.ndsu.edu/sdc/publica
TRAFFIC IMPACT STUDY CRITERIA
 Chapter 6 - TRAFFIC IMPACT STUDY CRITERIA 6.1 GENERAL PROVISIONS 6.1.1. Purpose: The purpose of this document is to outline a standard format for preparing a traffic impact study in the City of Steamboat
The Miami-Dade Safe Routes to School Initiative
 The Miami-Dade Safe Routes to School Initiative Perla Tabares Hantman School Board Chair Miami-Dade County Public Schools & Governing Board Member of the Miami-Dade Metropolitan Planning Organization August