Safety Improvements at Highway-Railroad Crossing for Pedestrians and Bicyclists and the Assessment of Long-Term Effects of Centerline Curbing
|
|
|
- Kathleen Garrison
- 6 years ago
- Views:
Transcription

1 University of Nebraska - Lincoln DigitalCommons@University of Nebraska - Lincoln Nebraska Department of Transportation Research Reports Nebraska LTAP Safety Improvements at Highway-Railroad Crossing for Pedestrians and Bicyclists and the Assessment of Long-Term Effects of Centerline Curbing Aemal Khattak University of Nebraska-Lincoln, khattak@unl.edu Zheng Luo Follow this and additional works at: Part of the Transportation Engineering Commons Khattak, Aemal and Luo, Zheng, "Safety Improvements at Highway-Railroad Crossing for Pedestrians and Bicyclists and the Assessment of Long-Term Effects of Centerline Curbing" (2012). Nebraska Department of Transportation Research Reports This Article is brought to you for free and open access by the Nebraska LTAP at DigitalCommons@University of Nebraska - Lincoln. It has been accepted for inclusion in Nebraska Department of Transportation Research Reports by an authorized administrator of DigitalCommons@University of Nebraska - Lincoln.


 472-1975 This report was funded in part through grant[s] from the Federal Highway")
![Administration [and Federal Transit Administration], U.S. Department of Transportation.](/docs-images/71/66223260/images/2-6.jpg "The views and opinions of the authors [or agency] expressed herein do not necessarily state or")
2 Nebraska Transportation Center Report # SPR-P1(09) P323 Final Report Safety Improvements at Highway-Railroad Crossing for Pedestrians and Bicyclists and the Assessment of Long- Term Effects of Centerline Curbing Aemal Khattak, Ph.D. Associate Professor Department of Civil Engineering University of Nebraska-Lincoln Zheng Luo Researcher 2012 Nebraska Transportation Center 262 WHIT 2200 Vine Street Lincoln, NE (402) This report was funded in part through grant[s] from the Federal Highway Administration [and Federal Transit Administration], U.S. Department of Transportation. The views and opinions of the authors [or agency] expressed herein do not necessarily state or reflect those of the U. S. Department of Transportation.
3 Safety Improvements at Highway-Railroad Crossing for Pedestrians and Bicyclists and the Assessment of Long-Term Effects of Centerline Curbing Aemal Khattak, Ph.D. Associate Professor Department of Civil Engineering University of Nebraska-Lincoln Zheng Luo Researcher Department of Civil Engineering University of Nebraska-Lincoln A Report on Research Sponsored by Nebraska Department of Roads Nebraska Transportation Center June 2012
4 Technical Report Documentation Page 1. Report No. SPR-P1(09) P Government Accession No. 3. Recipient's Catalog No. 4. Title and Subtitle Safety Improvements at Highway-Railroad Crossings for Pedestrians and Bicyclists & Assessment of Long-Term Effects of Centerline Curbing 5. Report Date June Performing Organization Code 7. Author(s) Aemal Khattak, Zheng Luo 9. Performing Organization Name and Address Nebraska Transportation Center University of Nebraska-Lincoln 330 Whittier Research Center Lincoln, NE Sponsoring Agency Name and Address Nebraska Department of Roads 1500 Hwy. 2 Lincoln, NE Supplementary Notes 8. Performing Organization Report No. SPR-P1(09) P Work Unit No. (TRAIS) 11. Contract or Grant No. 13. Type of Report and Period Covered July 2008-June Sponsoring Agency Code MATC TRB RiP No Abstract The focus of the research reported herein was on assessing the long-term effectiveness of median barriers at highway-rail grade crossings (HRGCs), the impacts of barrier maintenance in resurrecting safety, and on exploring and assessing ways to improve pedestrian and bicyclist safety at HRGCs. Nebraska has about 7,000 HRGCs and each one represents a potential conflict point among trains and highway users, i.e., motorists, pedestrians, and bicyclists. Safety at HRGCs is compromised when highway users resort to unsafe maneuvers, such as passing around closed gates when trains are approaching. Gate-related violations by motorists, pedestrians, and bicyclists were studied at three selected HRGCs in Waverly, Fremont, and Lincoln, all cities located in Nebraska. The barrier at the Waverly HRGC was removed after being in place for a long time while the dilapidated barrier at the Fremont HRGC was revived through maintenance. An educational activity focused on pedestrians and bicyclists at the Fremont HRGC was evaluated for reducing gate violations. Removal of the barrier in Waverly contributed to greater frequency of unsafe maneuvers by motorists. Specifically, the frequencies of aggregate unsafe maneuvers (i.e., the sum of motorist gate rush, U-turn and backup), as well as gate rush and U-turn, increased after barrier removal. Safety deteriorated over the long-term at the Fremont HRGC while maintenance resurrected safety by reducing the frequency of passing around fully lowered gates by 30-50%. Regarding the effects of the educational campaign focused on pedestrians and bicyclists at the Fremont HRGC, the drive successfully reduced passing around fully lowered gates by about 39%. The recommendations from this research include emphasis on maintenance of barriers in top condition after installation and educational campaigns focused on pedestrians and bicyclists for safety improvements at HRGCs. 17. Key Words 18. Distribution Statement 19. Security Classif. (of this report) Unclassified 20. Security Classif. (of this page) Unclassified 21. No. of Pages Price ii
5 Table of Contents Acknowledgments... vi Disclaimer... vii Abstract... viii Executive Summary... ix Chapter 1 Introduction Report Organization Background Research Objectives... 2 Chapter 2 Literature Review Motorist Safety at HRGCs Evaluation of Triple Es Safety Countermeasures Specific Safety-Related Parameters Identification of Safety-Associated Factors Non-motorist Safety Evaluation of Triple Es Safety Countermeasures Identification of Safety-Associated Factors Highway Safety Modeling Approaches Models for Counts of Vehicle-Train Collisions at HRGCs Safety Models of Vehicle Collisions on the Roadway System Safety Models of Pedestrian Injury Severity Literature Review Summary Chapter 3 Data Collection Data for Evaluation of Median Barrier s Long-Term Safety Effect Data for Educational Campaign Assessment Chapter 4 Data Analysis Evaluation of Median Barrier Removal at Waverly HRGC Evaluation of Median Barrier s Long-Term Effect at Fremont HRGC Safety Evaluation of Median Barrier Maintenance at the Fremont HRGC Assessment of Maintenance in Assessment of Maintenance in Evaluation of Educational Campaign for Non-Motorists at the Fremont HRGC Chapter 5 Conclusions and Recommendations Conclusions Recommendations and Future Research References Appendix A Appendix B iii
6 List of Figures Figure 3.1 N 141 st St. HRGC in Waverly, Nebraska 29 Figure 3.2 M St. Crossing in Fremont, Nebraska 30 Figure 3.3 Camera Installed at HRGC to Capture Crossing Maneuvers 31 Figure 3.4 Digital Video Recorders (DVR) Housed in Metal Box 31 Figure 3.5 Dilapidated Condition of Barrier at the Waverly HRGC 32 Figure 3.6 Dilapidated Condition of Barrier at Fremont due to Lack of Maintenance 32 Figure 3.7 Devices for Data Extraction 33 Figure 3.8 Interface of DVR Software 34 Figure 3.9 Vehicle Passing Under Descending Gates (Violation Type 1) 35 Figure 3.10 Vehicle Passing Around Fully Lowered Gates (Violation Type 2) 36 Figure 3.11 Vehicles Passing Under Ascending Gates (Violation Type 3) 36 Figure 3.12 Barrier Condition after Maintenance in Figure 3.13 Data Collection Setup at the 44 th St. Crossing in Lincoln, NE 38 Figure 3.14 Preparing for the Educational Campaign 38 Figure 3.15 A Sampling of Operation Lifesaver Educational Material Used in the Campaign 39 Figure 3.16 Education Campaign at the Fremont HRGC 40 Figure 5.1 Installation of Median Barrier on Raised Concrete Curb at an HRGC 60 iv
7 List of Tables Table 2.1 Literature Summary on Triple Es Safety Countermeasures for Motorists at HRGCS 4 Table 2.2 Literature Summary on Safety-Related Parameters and Safety-Associated Factors for Motorists at HRGCs 10 Table 2.3 Literature Summary on Triple Es Safety Countermeasures for Non-Motorists on the Highway System 14 Table 2.4 Literature Summary on Safety-Associated Factors for Non-Motorists on the Highway System 19 Table 2.5 Literature Summary on Models for Counts of Vehicle-Train Collisions at HRGCs 20 Table 2.6 Literature Summary on Safety-Related Models on Count of Vehicle Collisions in Roadway System 24 Table 2.7 Literature Summary on Safety-Related Models on Injury Severity of Pedestrian-Only Traffic 26 Table 4.1 Comparison of Averages before and after Removal of the Barrier 41 Table 4.2 Model for Total Number of Unsafe Maneuvers at Waverly HRGC 43 Table 4.3 Model for Frequency of Gate Rush at Waverly HRGC 44 Table 4.4 Model for the Number of U-turns at Waverly HRGC 45 Table 4.5 Model for the Number of Vehicle Backups at Waverly HRGC 46 Table 4.6 Comparison of Averages Concerning Barrier s Long-Term Safety Effect 47 Table 4.7 Model for Frequency Unsafe Maneuvers at Fremont HRGC between 2006 and Table 4.8 Model for Frequency of Gate Rush at Fremont HRGC between 2006 and Table 4.9 Model for the Number of U-turns at Fremont HRGC between 2006 and Table 4.10 Model for Number of Backups at Fremont HRGC between 2006 and Table 4.11 Comparison of before-and-after Gate-Related Violations for the 2009 Barrier Maintenance 52 Table 4.12 Comparison of before-and-after Gate-Related Violations for the 2011 Barrier Maintenance 53 Table 4.13 Model for Total Gate Rush Frequency at Fremont HRGC in Table 4.14 Model for Frequency of Gate Rush Type 2 at Fremont HRGC in Table 4.15 Comparison of Averages Concerning Educational Activity Effect in Table 4.16 Model for Number of Gate Rush Type 2 before and after Educational Campaign in v
8 Acknowledgments The research team is thankful to the Nebraska Department of Roads for sponsoring this research. Members of the project technical advisory committee including Ellis Tompkins, Dan Waddle, Abe Anshasi, Matt Neeman, Ryan Huff, and John Perry provided direction for this research and insightful comments on multiple aspects of the research. The research team is thankful to Nebraska Department of Roads Materials and Research Division staff including Moe Jamshidi, Mick Syslo, Amy Starr, Jodi Gibson, and Lieska Halsey for providing help with multiple aspects of this research project. Officials from Fremont, Waverly, and Lincoln are acknowledged for their help with data collection sites. The researchers are thankful to Nate Huebner, Matt Schaich, Miao Gao and a multitude of other students for viewing hours of video footage to extract pertinent data. vi
9 Disclaimer This report was funded in part through grants from the Federal Highway Administration, U.S. Department of Transportation. The views and opinions of the authors expressed herein do not necessarily state or reflect those of the U. S. Department of Transportation, the Nebraska Department of Roads, or the University of Nebraska-Lincoln. This report does not constitute a standard, specification, or regulation. Trade or manufacturers names that appear in this report are cited only because they were relevant to this research. The appearances of trade or manufacturers names do not constitute endorsements. vii
10 Abstract The focus of the research reported herein was on assessing the long-term effectiveness of median barriers at highway-rail grade crossings (HRGCs), the impacts of barrier maintenance in resurrecting safety, and on exploring and assessing ways to improve pedestrian and bicyclist safety at HRGCs. Nebraska has about 7,000 HRGCs and each one represents a potential conflict point among trains and highway users, i.e., motorists, pedestrians, and bicyclists. Safety at HRGCs is compromised when highway users resort to unsafe maneuvers, such as passing around closed gates when trains are approaching. Gate-related violations by motorists, pedestrians, and bicyclists were studied at three selected HRGCs in Waverly, Fremont, and Lincoln, all cities located in Nebraska. The barrier at the Waverly HRGC was removed after being in place for a long time while the dilapidated barrier at the Fremont HRGC was revived through maintenance. An educational activity focused on pedestrians and bicyclists at the Fremont HRGC was evaluated for reducing gate violations. Removal of the barrier in Waverly contributed to greater frequency of unsafe maneuvers by motorists. Specifically, the frequencies of aggregate unsafe maneuvers (i.e., the sum of motorist gate rush, U-turn and backup), as well as gate rush and U-turn, increased after barrier removal. Safety deteriorated over the long-term at the Fremont HRGC while maintenance resurrected safety by reducing the frequency of passing around fully lowered gates by 30-50%. Regarding the effects of the educational campaign focused on pedestrians and bicyclists at the Fremont HRGC, the drive successfully reduced passing around fully lowered gates by about 39%. The recommendations from this research include emphasis on maintenance of barriers in top condition after installation and educational campaigns focused on pedestrians and bicyclists for safety improvements at HRGCs. viii
11 Executive Summary Nebraska has about 7,000 highway-rail grade crossings (HRGC) and each one represents a potential conflict point among trains and highway users, i.e., motorists, pedestrians, and bicyclists. Safety at an HRGC is compromised when highway users resort to unsafe maneuvers, such as passing around closed gates when trains are approaching. From 2004 to 2006, the Nebraska Department of Roads (NDOR) sponsored a project that evaluated the efficacy of median barriers installed at HRGCs. These are used to limit drivers abilities to pass around fully-lowered gates at dual-quadrant gated crossings. While the barriers were found effective in reducing unsafe maneuvers by drivers, their long-term safety effectiveness and the effects of barrier maintenance on safety resurrection were unknown. While the focus was on motorists, the need for improving pedestrian and bicyclist safety was also realized during the course of the project. The focus of the research reported herein was on assessing the long-term effectiveness of median barriers at HRGCs, the impacts of barrier maintenance in resurrecting safety, and on exploring and assessing ways to improve pedestrian and bicyclist safety at HRGCs. Gate-related violations by motorists, pedestrians, and bicyclists were studied at three selected HRGCs in Waverly, Fremont, and Lincoln, all cities located in Nebraska. The long-term effectiveness of median barriers installed at HRGCs was evaluated by comparing data collected in 2006 to data collected in 2008 at both Fremont and Waverly HRGCs. However the barrier in Waverly was removed in 2007, so this comparison provided information on the effects of barrier removal after being in place for a relatively long period. The barrier in Fremont was not removed and the 2006/2008 comparison provides information on the long-term effectiveness of barriers at HRGCs with the barrier condition deteriorating over time ix
12 because no maintenance was performed during this period. The effect of maintenance on resurrecting HRGC safety was assessed twice in Fremont after performing maintenance in 2009 and again in After considering various safety options aimed at improving pedestrian and bicyclist safety at HRGCs, an educational campaign using Operation Lifesaver educational materials was carried out and assessed for effectiveness at HRGCs. Results of data analysis showed that compared to 2006, unsafe maneuvers by drivers increased in 2008 at both Waverly and Fremont. Removal of the barrier at the Waverly HRGC contributed to worsening of safety while the deteriorating condition of the barrier at the Fremont HRGC contributed to reduced safety. The two assessments of barrier maintenance and subsequent changes in safety at the Fremont HRGC indicated 30-50% reductions in passing around fully lowered gates in the post-maintenance period. Operation Lifesaver materials were used in educational campaigns at HRGCs in Lincoln and Fremont to improve pedestrian and bicyclist safety. The study at Lincoln was inconclusive because of inadequate pedestrian and bicyclist traffic. However, a similar but longer duration campaign in Fremont showed a 39% reduction in passing around fully lowered gates by pedestrians and bicyclists. This research recommends that installed median barriers must be maintained in excellent condition for continued effectiveness. Also once installed, the removal of median barriers at HRGCs is not prudent. An educational campaign, such as the one used in this research, was effective and is recommended for and for improvement of pedestrian and bicyclist safety at HRGCs. Finally, to reduce maintenance, installation of median barriers on 6-9 inch high concrete curbs is recommended. x
13 Chapter 1 Introduction 1.1 Report Organization This report consists of five chapters; this introductory chapter with background information and objectives is followed by a chapter providing a review of relevant literature on motorist safety at highway-railroad grade crossings (HRGC) and pedestrian and bicyclist safety in traffic. The third chapter presents the process for data collection and reduction in terms of motorist and non-motorist unsafe maneuvers at selected crossings. The fourth chapter describes analysis of the collected data including simple statistics and statistical models. The last chapter of this report presents research conclusions and recommendations for future research. 1.2 Background This research was focused on improving safety of pedestrians and bicyclists at highwayrailroad grade crossings, as well as exploring the long-term effects of median barriers (also called centerline barriers/curbs) at HRGCs on motorist maneuvers. Nebraska has about 7,000 atgrade highway-rail crossings with each serving as a conflict point among trains and motorists, pedestrians, and bicyclists. Safety at an HRGC is compromised when highway users resort to unsafe maneuvers, such as passing around crossing gates when trains are approaching. From the Nebraska Department of Roads (NDOR) sponsored a research project titled Centerline curbing treatment at railroad crossings for improved safety. This project investigated the effects of median barriers installed at HRGCs on reducing unsafe maneuvers by motorists. Median barriers were installed at two HRGCs in Waverly and Fremont, NE. Results of the project showed the median barriers to be effective in reducing unsafe maneuvers by drivers at HRGCs. However, the long-term safety effectiveness and the effects of maintenance in resurrecting safety were unknown at the conclusion of the project. While the 1
14 focus was on motorists, the need for improving pedestrian and bicyclist safety was also realized during the course of the project. The barriers installed on both sides of the HRGC in Waverly were removed at the request of the City of Waverly officials in December 2007 while the barriers installed in Fremont were left in place. However, by 2008 the condition of these barriers was significantly deteriorated compared to 2006, primarily due to traffic and snow plow abuse. The current research was initiated with the following objectives. 1.3 Research Objectives There were two major objectives for this research: 1) to assess the long-term effects of median barriers on motorists unsafe maneuvers at both Waverly and Fremont HRGCs and 2) to investigate and assess different ways to improve pedestrian and bicyclist safety at HRGCs. As part of the first objective, this research estimated median barriers safety impact by comparing motorists unsafe maneuvers at both Waverly and Fremont HRGCs between 2006 and Since barriers at the Waverly HRGC were removed in 2007, the comparison between 2006 and 2008 showed the effect of their removal after being in place for a prolonged period. The Fremont comparison indicated changes in safety due to lack of maintenance since no maintenance was performed during this time. The second objective involved identifying and investigating different ways of improving pedestrian and bicyclist safety at HRGCs, selecting an appropriate method, implementing and then evaluating its effectiveness in reducing unsafe maneuvers by pedestrians and bicyclists. After considering different ways of improving pedestrian and bicyclist safety that included pavement markings, signs, fences, and pedestrian gates, user education was selected for improving safety of pedestrians and bicyclists at HRGCs. Therefore, as part of this objective a 2
15 campaign utilizing Operation Lifesaver s safety educational materials was undertaken at both Lincoln and Fremont HRGCs. Data on unsafe maneuvers by pedestrians and bicyclists before and after the educational campaign were collected to assess changes in safety. The next chapter presents the results of an extensive review of literature that was conducted as part of this research. 3
16 Chapter 2 Literature Review Topics covered in this literature review include: 1) studies on motorist safety at HRGCs, and 2) studies dealing with the safety of pedestrians and bicyclists on the highway system. A discussion on different types of models used in safety research is also provided in this chapter. 2.1 Motorist Safety at HRGCs Three aspects of motorist safety at HRGCs are discussed below: evaluation of countermeasures based on engineering, education, and enforcement (triple Es ); analysis of specific safety-related parameters; and identification of safety-associated factors Evaluation of Triple Es Safety Countermeasures Table 2.1 presents a summary of the literature on triple Es, while a detailed account appears below. Yeh and Multer (2) reviewed literature concerning driver maneuvers at HRGCs from 1990 to 2006 and then addressed a series of engineering design issues related to motorist safety. They summarized that safety-related engineering measures may pertain to roadway signs, pavement markings, and active control devices (e.g., flashing lights and gates) at HRGCs. Table 2.1 Literature Summary on Triple Es Safety Countermeasures for Motorists at HRGCs Research Objective Author Methodology Major Findings/Results Explore safety-related engineering designs Yeh and Multer, 2007 Literature review Safety-related engineering measures include roadway signs, pavement markings, and active control devices such as flashing lights and gates at HRGCs Test the safety effectiveness of two new crossbuck designs Zwahlen and Schnell, 1999 Simple frequency comparisons of driver compliance New designs helped reduce drivers noncompliance Evaluate the safety effectiveness of stop signs at public passive HRGCs Millegan et al., 2009 Simple accident frequency comparisons and negative binomial Annual crash rates decreased after installation of stop signs 4
17 regression model (continued) Safety factors associated with accidents are annual average daily traffic, percentage of trucks, number of daily trains, number of highway lanes, number of rail tracks, and presence of adjacent industrial areas at HRGCs Evaluate the safety effectiveness of pavement marking Stephens and Long, 2003 Analysis of variance (ANOVA) Application of this design at rural HRGCs reduced motorists hazardous maneuvers both in the short- and long-term periods Evaluate safety effectiveness of installing centerline barriers at gated HRGCs for motorists Khattak et al., 2007, 2008, and 2009 Before/after unsafe maneuver data analysis and negative binomial regression model Improvement in safety due to installation of the barriers was found Number of passing around gates increased with longer duration of road closure, but decreased under adverse weather conditions Driver violations at HRGCs were locationspecific but the order of response to installation of the barriers in different locations was fairly similar Evaluate the overall safety at HRGCs with an automated-horn system and its effectiveness in reducing the annoyance level for nearby residents Gent et al., 2000 Survey 92% of locomotive engineers rated the crossings safer or about the same 78% of motorists preferred the new system 71% of the nearby residents had positive attitudes toward it Evaluate the effectiveness of an enhanced crossing safety education and enforcement program at gated HRGCs with flashing warning devices Sposato et al., 2006 Simple violation frequency comparisons Changes in violations were 23% and 71% decreases for two violation types: type that traversed the crossing during gate descent or ascent, and type that traversed the grade crossing after the gates were fully deployed An 15%violation increase was noted for the type that traversed the crossing while the lights were flashing but before the gates descended Investigate the safety effectiveness of automatic photo enforcement system at HRGCs Carroll and Warren, 2002 Simple violation frequency comparisons Violations at California HRGCs were reduced by 36 92% while crashes reduced by 70% Violations in Illinois and in North Carolina were reduced by 47 51% and by 78% 5
18 Zwahlen and Schnell (3) tested the safety effects of two new crossbuck designs (i.e., the buckeye crossbuck equipped with a red yield legend and retroreflective side panels, and the standard improved crossbuck equipped with a reflectorized wooden post and both-side microprismatic sheeting) at 3,833 passive crossings in Ohio. Simple frequency comparisons were conducted in terms of driver compliance maneuvers under the use of traditional and new crossbuck designs, as well as historical crash data. They concluded that the new designs helped reduce drivers noncompliance. Millegan et al. (4) evaluated the safety effectiveness of stop signs at public passive HRGCs (lacking gates, flashing lights, warning bells, etc.) nationwide using Federal Railroad Administration (FRA) data. Simple comparisons of annual vehicle-involved crash rates between the before-and-after stop sign control periods and the negative binomial (NB) regression model for identifying the effect of stop signs, as well as significant accident risk factors were conducted. The authors reported that annual crash rates were consistently higher during the crossbuck-only period, compared to the period after installation of stop signs. Moreover, the NB model showed the positive effect of stop signs on safety at HRGCs. Several factors associated with the increase of crash frequencies were listed, including annual average daily traffic (AADT), percentage of trucks, number of daily trains, number of highway lanes, and number of rail tracks, as well as presence of adjacent industrial areas at HRGCs. The study also indicated that stop signs were more effective with multiple tracks, lower train speeds, and lower motor vehicle and train volumes. Pavement marking is another engineering measurement for improving safety at HRGCs. Stephens and Long (5) tested a new type of pavement marking called 25-ft X shape box in Florida. The authors used the Analysis of Variance (ANOVA) method to test the marking s 6
19 safety effectiveness and identify safety-associated factors. Results indicated that the application of this design at rural HRGCs significantly reduced motorists hazardous stopping maneuvers both in the short- and long-term periods. However, little benefit was found at urban HRGCs. Various traffic control facilities and active warning devices have been installed and evaluated at HRGCs in the past. Khattak (6, 7), and Khattak and McKnight (8) studied the safety impact of installing central barriers at gated HRGCs that prevent motorists from going around closed gates in Nebraska. The negative binomial regression model was adopted to conduct a before-and-after study. The authors reported improvement in safety due to installation of the barriers. Moreover, the results also showed that the number of motorists passing around gates increased with longer duration of road closure due to passage of trains, but decreased under adverse weather conditions. Risky driver maneuvers at HRGCs were location-specific but the order of response to installation of the barriers in the two selected locations was fairly similar. For active warning devices, Gent et al. (9) evaluated the overall safety at HRGCs in Ames, Iowa with an automated-horn system, as well as its effectiveness in reducing the annoyance level for nearby residents. Results of the survey showed that 92% of locomotive engineers rated the crossings safer or about the same compared to the crossings without such a device. About 78% of motorists preferred the new system compared to traditional train horns in terms of safety and 71% of the nearby residents had positive attitudes toward the new system. The USDOT Grade Crossing Action Plan (10) and the 2004 Secretary s Action Plan on Highway-Rail Crossing Safety and Trespass Prevention (11) identified education and enforcement as key actions in reducing motorist crashes at HRGCs. To explore the safety effects of education and enforcement, Sposato et al. (12) conducted an evaluation in terms of the effectiveness of an enhanced crossing safety education and enforcement program at three gated 7
20 HRGCs with flashing warning devices in Arlington Heights, Illinois. Findings indicated that the changes in violations decreased 23% and 71% for two violation types: the type that traversed the crossing during gate descent or ascent, and the type that traversed the grade crossing after the gates were fully deployed. An increase of 15% was noted for the type that traversed the crossing while the lights were flashing but before the gates descended. Carroll and Warren (13) investigated the safety effectiveness of an automatic photo enforcement system at HRGCs in California, Illinois, North Carolina, Florida and Texas. Results showed that violations at HRGCs in California were reduced by 36 92% using photo enforcement while crashes were reduced by 70%. Moreover, a 47 51% reduction in violations was observed in Illinois and a 78% reduction in violations was recorded in North Carolina. The authors concluded that the use of photo enforcement was effective in modifying unsafe driver maneuvers Specific Safety-Related Parameters Table 2.2 presents a summary of safety-related parameters reported in literature while a detailed account follows. Moon and Coleman (14) collected two-day video data in terms of vehicle approaching speeds at two four-quadrant HRGCs, in Hartford and McLean, along the Chicago-St. Louis high-speed rail corridor. A hypothesis testing of differences in speed mean values was conducted. The results showed that there was a definite tendency to reduce speed when vehicles approached HRGCs. Furthermore, the speed profiles of vehicle platoons were less than the speed profiles of single vehicles at both study sites. Estes and Rilett (15) and Cho and Rilett (16) investigated train arrival and crossing times at four HRGCs along the wellborn corridor in College Station, Texas, using two prediction technologies. Firstly, Cluster Analysis was used to categorize approaching trains into four 8
21 groups. After classification, multiple linear regressions were used to predict arrival and crossing times based on speed profiles. Results showed that the predicted train arrival time by this method was within 20 seconds of its true arrival time. Secondly, a modular artificial neural network (MAAN) design was used to group the train speed profiles and then forecast train arrival times. The results were more accurate than the prediction results from the multiple regression model and traditional prediction methods (i.e., 29.7% and 46% improvement). 9
22 Table 2.2 Literature Summary on Safety-Related Parameters and Safety-Associated Factors for Motorists at HRGCs Research Objective Author Methodology Major Findings/Results Explore the characteristics of vehicle approaching speed at HRGCs Moon and Coleman, 1999 Hypothesis testing of differences in mean values There was a definite tendency to reduce speed when vehicles approached HRGCs The speed profiles of vehicle platoons were less than the speed profiles of single vehicles Investigate train arrival and crossing times at HRGCs Estes and Rilett, Cho and Rilett, 2000, 2003 Cluster analysis, multiple linear regressions and modular artificial neural network(maan) design The predicted time by Multiple regression model was within 20 seconds of its true arrival time MAAN method was created to improve the accuracy by 29.7% and 46% compared to multiple regression model and traditional prediction methods Identify factors associated with vehicle-train crashes at HRGCs Oh et al., 2006 Developed statistical models Number of vehicle-train crashes increased when AADT, daily train volume, time duration between the activation of warning signals and the activation of gates increased and when crossings were located near commercial areas Crashes decreased when a speed hump was presented several predictors were different across the HRGC predicted models Find the association between vehicletrain collisions at HRGCs and related factors Hu et al., 2010 Negative binomial regression model Number of crashes increased when number of daily trains, AADT and the number of tracks increased Crash frequency decreased when the crossing length increased and HRGC equipped with physical median at highway side Probability of crash occurrence increased as the AADT increased Explore the measurements to improve safety at HRGCs Kallberg et al., 2002 Developed statistical models vehicle and train s crossing times were safetyassociated factors Measures to improve safety of HRGCs were: improving sight distances by clearing vegetation, conducting crossing bans for trailer trucks, adding speed limits for trains, and using frequent whistles by the trains 10
23 2.1.3 Identification of Safety-Associated Factors A summary of pertinent literature with respect to identification of safety-associated factors is given in table 2.2 and a more detailed account is as follows. Multiple researchers have investigated safety-associated factors related to vehicle and train operations, and HRGC geometry or environment. Oh et al. (17) identified factors associated with vehicle-train crashes at HRGCs in Korea using statistical models. They also examined accident prediction models for HRGC safety, including the Peabody Dimmick formula, the New Hampshire Index and the USDOT Accident Prediction formula. Some disadvantages of these models, like lacking descriptive capabilities, complexity and declining accuracy over time, were cited by the authors. Results indicated that the number of vehicle-train crashes increased when average daily traffic volume, daily train volume, and time duration between the activation of warning signals and the activation of gates increased and when crossings were located near commercial areas. Crashes decreased when a speed hump was presented at the crossing to slow motor vehicle traffic. After comparing their model and the USDOT Accident Prediction formula, they reported that several predictors were different across the models. In the USDOT model, type of highway surface, presence of stop signs and pavement markings were significant factors affecting accident frequency. But they were not found significant in the model with Korean data. Hu et al. (18) explored the association between vehicle-train crashes at HRGCs and related factors in Taiwan by using the negative binomial regression model. According to the results, the number of daily trains, AADT and the number of tracks were significantly and positively associated with the number of crashes, while the crossing length was significantly and negatively associated with crash frequency. Moreover, an HRGC equipped with a physical median at the highway side had less traffic crashes than one without any highway separation. 11
24 The authors also conducted an analysis on marginal effect of AADT on the probability of crash occurrence. The results showed that the probability of crash occurrence increased as the AADT increased. Kallberg et al. (19) collected field-observed data on 360 HRGCs on five main railway links in Finland. According to collected information and calculations, vehicle and train crossing times were identified as the safety-associated factors. The suggested measures to improve safety of HRGCs were: improving sight distances by clearing vegetation, conducting crossing bans for trailer trucks, adding speed limits for trains, and using frequent whistles by the trains. 2.2 Non-motorist Safety Non-motorists on the highway system primarily consist of pedestrians and bicyclists. Compared to pedestrians, relatively few published documents were found on bicyclist safety. Some studies combined pedestrians and bicyclists; an account of the literature findings is presented below in two categories: evaluation of triple E countermeasures for non-motorists and identification of safety-associated factors for non-motorists Evaluation of Triple Es Safety Countermeasures Table 2.3 presents a summary of non-motorist triple E countermeasures. Similar to the engineering design for motorists safety at HRGCs, the typical devices for the safety of nonmotorists in traffic include various traffic signals and warning systems. Scott et al. (20) examined the effectiveness of optimized accessible pedestrian signals (APS) for providing street crossing information to blind pedestrians in Portland, Oregon and Charlotte, North Carolina. Results of before-and-after APS installation showed numerous improvements after APS installation. The installation resulted in a nearly 2 sec reduction in starting delay, which offered additional time 12
25 for pedestrians to complete the crossing. In addition, only 13% of participants in each city could not finish crossing in time, compared to 44 50% before APS installation. Nambisan et al. (21) evaluated the safety effect of automatic pedestrian detection devices and smart lighting deployed at the site on Charleston Boulevard in Las Vegas. A before-and-after study and corresponding statistical analysis were used. Results showed that after deployment of smart lighting, the numbers of pedestrians correctly using the crosswalk and carefully observing both directions increased. The percentage of motorists yielding to pedestrians also increased, as well as the vehicle stopping distance. Furthermore, the proportion of trapped pedestrians decreased and a significant reduction of pedestrian delay was noted that was accompanied by a slight rise in vehicular delay. The authors concluded that the tested devices improved visibility for both motorists and pedestrians and increased motorist compliance and pedestrians safer crossing maneuvers. 13
26 Table 2.3 Literature Summary on Triple Es Safety Countermeasures for Non-Motorists on the Highway System Research Objective Author Methodology Major Findings/Results Examine the effectiveness of optimized accessible pedestrian signals (APS) for blind pedestrians Scott et al.,2008 Before/after data analysis Nearly 2s reduction in starting delay after using APS 13% participants could not finish crossing in time after using APS, compared to 44 50% before APS installation Evaluate the safety effectiveness of automatic pedestrian detection devices and smart lighting Nambisan et al.,2009 Before/after data analysis The numbers of pedestrians correctly using the crosswalk and carefully observing both directions increased The percentage of motorists yielding to pedestrians also increased as well as the vehicle stopping distance The proportion of trapped pedestrians decreased and a significant reduction of pedestrian delay was noted The tested devices improved visibility for both motorists and pedestrians and increased motorist compliance and pedestrians safer crossing maneuvers Examine the effectiveness of LED rectangular rapid-flash beacons (RRFBs) on yielding to pedestrians by motorists in multilane crosswalks Shurbutt et al.,2009 Before/after data analysis RRFBs produced a higher percentage of vehicles yielding to pedestrians and longer yielding distance at multilane uncontrolled crosswalk locations The numbers of vehicle in yielding queue decreased significantly Evaluate the safety effectiveness of the high-intensity activated crosswalk (HAWK) device Fitzpatrick and Park,2009 Before-andafter evaluation used Empirical Bayes (EB) method Pedestrian crashes reduced in the range of % among the multiple sites installed HAWK devices Identify and evaluate a series of engineering measures to reduce pedestrian deaths and injuries Ellis and Houten, 2009 Simple crash rate comparisons Countywide pedestrian crash rates reduced in the range of % at different selected sites Evaluate a pedestrian safety educational program for elementary and middle Gates et al.,2009 Before/after data analysis There was a decrease in violation rates ranged from 2.42% to 18.3% in night schools An overall 23.2% increase in correct response 14
27 school students rate in pre-and-post testing was found Evaluate the effectiveness of enforcement of the crosswalk law Britt et al.,1995 Simple compliance frequency comparisons A modest increase of vehicles compliance was detected, and the numbers of compliance at marked crosswalks were nine times than the ones at unmarked crosswalks Enforcement did not show significant benefits in locations with higher traffic volumes Some other factors, such as speed limit, road surface conditions, pedestrian volumes, the presence of single or grouped vehicles and the intensity of enforcement, may impact the change of vehicles compliance Campaign verified the compliance maneuvers are location-specific Evaluate the effectiveness of a comprehensive intervention program mixed communications/public safety awareness, education and punishment Lobb et al.,2003 Chi-square tests, and Multivariate Analysis of Variance (MANOVA) and correlational analysis A significant decrease in unsafe crossing was found after implementation of the program Punishment of unsafe maneuver was much more effective than education and communication Shurbutt et al. (22) examined the effect of LED rectangular rapid-flash beacons (RRFBs) on motorists yielding to pedestrians in multilane crosswalks in Florida, Illinois and Washington D.C. Results showed that RRFBs produced a higher percentage of vehicles yielding to pedestrians and a longer yielding distance at multilane uncontrolled crosswalk locations. This effect was also increased by installing additional beacons on the median island. Also, the numbers of vehicle in the yielding queue, that passes or attempts to pass the vehicles which stopped in front of them, decreased significantly. After comparing the above variables with the traditional yellow flashing beacon, the RRFB was found to be more effective. 15
28 Fitzpatrick and Park (23) evaluated the safety effectiveness of the high-intensity activated crosswalk (HAWK) device installed in Tucson, Arizona. The before-and-after evaluation used the Empirical Bayes (EB) method to conduct the study. The conclusion indicated, at the multiple sites installed with a HAWK device in the city, that pedestrian crashes were reduced in the range of %. Ellis and Houten (24) identified and evaluated a series of engineering measures to reduce pedestrian deaths and injuries along eight high-crash corridors in Miami Dade County, Florida. A total of 14 engineering countermeasures were implemented. These measures included pedestrian pushbuttons, pedestrian yield signs, pedestrian zone signs, speed trailers, RRFB, offset stop lines and several traffic signal improvements, like reduced minimum green time, lead pedestrian interval and countdown pedestrian signals. Statistical analysis of these mixed engineering measures showed that countywide pedestrian crash rates were reduced in the range of % at different selected sites in the county. Countermeasures involving education and enforcement have been studied for their impact on non-motorist safety in traffic. Gates et al. (25) conducted a large-scale before-and-after evaluation of a pedestrian safety educational program, designed for and delivered to elementary and middle school students at 16 participating schools in Detroit, Michigan. The results showed that among the 10 selected schools for observation, there was a decrease in violation rates that ranged from 2.42% to 18.3% in night schools. There was also a significant 4.44% decrease of the overall violation rates. Furthermore, an overall 23.2% increase in correct response rate in preand-post testing was found. Both of the two tests suggested that the educational program could improve safety of child pedestrians. 16
29 Britt et al. (26) evaluated the effect of enforcement of the crosswalk law in Seattle, Washington. The study concluded that a modest increase of vehicles compliance was detected but enforcement did not show significant benefits in locations with higher traffic volumes. Some other factors, such as speed limit, road surface conditions, pedestrian volumes, the presence of single or grouped vehicles and the intensity of enforcement, may impact the change of vehicles compliance. Finally, the authors reported that the compliance maneuvers were location-specific. In New Zealand, Lobb et al. (27) introduced a comprehensive intervention program that mixed communications/public safety awareness, education and punishment in their study. After using chi-square tests, the study concluded that there was a significant decrease in unsafe crossings after implementation of the program. Comparisons between different parts of the program showed that unsafe crossings were reduced between communication and education and even more so between education and continuous punishment. But no significant changes were found between continuous and intermittent punishments. After applying Multivariate Analysis of Variance (MANOVA) and correlational analysis, the conclusions from surveys indicated that the correct responses increased after conducting the program. This study verified the positive effect of the whole intervention program and also showed that punishment of unsafe maneuvers was much more effective than education and communication Identification of Safety-Associated Factors Table 2.4 shows a summary of this subsection while a detailed account is as follows. Kim and Yamashita (28) applied multiple correspondence analysis technology to explore the relationship between some variables in terms of pedestrian-involved traffic collisions in Hawaii. This method mainly examined data in a contingency table. The analysis results showed that: 1) drivers were 13.8 times more likely than pedestrians to be classified at fault when involved in 17
30 pedestrian crashes in Hawaii, 2) men were more likely than women to commit errors or dangerous actions, and children (i.e., 17 years and younger), compared with adults (i.e., years old) or seniors (i.e., over 65 years of age) were more likely to be at fault as pedestrians, 3) seniors were more likely to be seriously injured than other age groups, and 4) crashes in residential areas appeared to be more likely than in nonresidential areas. The authors suggested that more efforts in terms of enforcement and education should be directed toward drivers instead of pedestrians, as well as toward children and seniors besides having different strategies for residential and nonresidential areas for pedestrian safety. Moudon et al. (29) collected pedestrian-involved collision data on state routes in King County, Washington from 1999 to Binomial logit model results showed that the likelihood of collision occurrence was strongly correlated to the presence of crosswalks with or without traffic signals, the number of roadway lanes, and the presence of nearby retail outlets. Additionally, other significant factors were the number of traffic signals, street block size, AADT, posted vehicle speed, bus ridership and the number of residential units; all increasing the likelihood of collisions with increasing values. The authors suggested that engineering approaches to safety should be complemented by education-and-enforcement-based measures. Moreover, facilities in areas with concentrations of retail outlets should become the targets for conducting safety programs in the future. 18
31 Table 2.4 Literature Summary on Safety-Associated Factors for Non-Motorists on the Highway System Research Objective Author Methodology Major Findings/Results Explore the relationship between some variables in terms of pedestrianinvolved traffic collisions Kim and Yamashita,2008 Multiple correspondence analysis Drivers were 13.8 times more likely than pedestrians to be classified at fault when involved in pedestrian crashes Men were more likely than women to commit errors or dangerous actions, and children (i.e., 17 years and younger), compared with adults (i.e., years old) or seniors (i.e., over 65 years of age) were more likely to be at fault as pedestrians Seniors were more likely to be seriously injured than other age group Crashes in residential areas appeared to be more likely than in nonresidential areas Explore the relationship between some variables in terms of pedestrianinvolved traffic collisions Moudon et al.,2008 Binomial logit model The likelihood of collision occurrence was strongly correlated to presence of crosswalks with or without traffic signals, the number of roadway lanes, and the presence of nearby retail outlets Other significant factors were the number of traffic signals, street block size, AADT, posted vehicle speed, bus ridership and the number of residential units; all increasing the likelihood of collisions with increasing values 2.3 Highway Safety Modeling Approaches A variety of modeling approaches have been adopted in safety studies focused on motorists at HRGCs and non-motorists in traffic. The following section presents a review of models for: 1) counts of vehicle-train crashes at HRGCs, 2) counts of vehicle collisions in traffic, and 3) injury severity of pedestrian-only crashes in traffic. It also found that few existing studies focused on bicyclist-related safety no matter whether at HRGCs or on the highway system. 19
32 2.3.1 Models for Counts of Vehicle-Train Collisions at HRGCs A summary of this subsection appears in table 2.5 and a detailed account is given as follows. Hauer and Persaud (30) estimated a safety equation that was a linear combination of crossing accident history with the mean crash experience of similar crossings by the Generalized Linear Interactive Modeling (GLIM) software package. Results of this effort showed that the equation offered an effective way to estimate vehicle-train crash frequency at HRGCs. In addition, the safety evaluation of warning devices using this method showed that conversions from crossbucks to flashers, from crossbucks to gates, and from flashers to gates reduced the chance of an HRGC crash by 51, 69 and 45%, respectively. Table 2.5 Literature Summary on Models for Counts of Vehicle-Train Collisions at HRGCs Research Objective Author Methodology Major Findings/Results Estimate a safety equation that was a linear combination of crossing accident history with the mean accident experience of similar crossings Hauer and Persaud,1987 Generalized Linear Interactive Modeling The equation offered an effective way to estimate vehicle-train accident frequency at HRGCs Conversions from crossbucks to flashers, from crossbucks to gates, and from flashers to gates reduced the chance of an HRGC crash by 51, 69 and 45%, respectively Explore the relationship between crash frequency and some variables in terms of Vehicle-train Collisions at HRGCs Austin and Carson,2002 Poisson and negative binomial models Crash frequency increased with greater number of nightly through trains, greater number of main track lines and traffic lanes, higher maximum timetable train speeds, greater AADT and paved highway The presence of gates and highway traffic signals reduced HRGC accident frequency Predict the probabilities of unsuccessful crossing maneuvers that result in a vehicle-train crash, injury or fatality McCollister and Pflaum,2007 Logit model Estimated model had better measures of effectiveness compared to those of the FRA models Factors associated with the probability of crash occurrence at HRGCs were identified including higher number of warning devices, greater number of through trains at night, greater number of switching trains 20
33 per day and higher train speed were associated with the greater possibilities of crashes, fatalities and injuries at HRGCs Greater traffic volume and greater percentage of trucks in the traffic were associated with the decreased possibilities of crashes Develop a risk-based model to identify HRGC blackspots Saccomanno et al.,2004 Negative binomial models Collision frequency was associated with: traffic exposure (i.e., log of cross product of AADT and number of trains daily), train speed, road speed, road surface width, and number of tracks Factors associated with collision severity included train speed, number of tracks, track angle, number of vehicles and involved persons Develop advanced statistical model for safety-associated factor identification at HRGCs Park and Saccomanno,2005 Tree-based data mining method and Negative binomial models The reliability of this collision prediction model was significantly improved by adding classifiers when compared to the model without interactions The effect of specific safety countermeasures at HRGCs varied based on classifiers including highway class, track angle, posted road speed, track type and surface width Develop advanced statistical model for safety-associated factor identification at HRGCs Saccomanno and Lai,2005 Cluster analysis and Negative binomial models The process to predict the number of collisions following a countermeasure can take place in two ways: 1) directly obtained from prediction model if the countermeasures have been specified in the model, and 2) indirectly obtained by estimating factor scores and change in cluster membership with the introduction of the countermeasures Austin and Carson (31) reviewed HRGC accident prediction methods and models. These included the Peabody-Dimmick formula, the New Hampshire Index, the National Cooperative Highway Research Program (NCHRP) Hazard Index, and the USDOT Accident Prediction formula. After collecting data on 1,538 vehicle-train crashes at HRGCs from six states (California, Montana, Texas, Illinois, Georgia and New York) for January 1997 through 21
34 December 1998, Austin and Carson estimated the Poisson and NB models. The authors reported that crash frequency increased with a greater number of nightly through trains, greater number of main track lines and traffic lanes, higher maximum timetable train speeds, greater AADT and paved highway. In addition, the presence of gates and highway traffic signals reduced HRGC accident frequency. McCollister and Pflaum (32) presented a logit model to predict the probabilities of unsuccessful crossing maneuvers that result in a vehicle-train crash, injury or fatality. The authors estimated model had better measures of effectiveness compared to those of the FRA models. Factors associated with the probability of crash occurrence at HRGCs were identified including higher number of warning devices, greater number of through trains at night, greater number of switching trains per day and higher train speed were associated with the greater possibilities of crashes, fatalities and injuries at HRGCs. In contrast, greater traffic volume and greater percentage of trucks in the traffic were associated with the decreased possibilities of crashes. In Canada, to provide useful information for economically conducting safety improvements at HRGCs, Saccomanno et al. (33) developed a risk-based model to identify HRGC blackspots, which represent specific crossings with the highest risk of HRGC crashes. NB regression was utilized to develop risk-based models and then predict crashes at HRGCs in Canada. By ranking crossings according to prediction results and historical records, the top 22 crossings based on both risk elements were listed and illustrated on a map. The authors concluded that crash frequency was associated with: traffic exposure (i.e., log of cross product of AADT and number of trains daily), train speed, road speed, road surface width, and number of tracks. Additionally, factors associated with crash severity included train speed, number of 22
35 tracks, track angle, number of vehicles and involved persons. The identified blackspots were found clustering in Saskatchewan, Ontario and Quebec, which respectively represent urban and rural areas. Park and Saccomanno (34) presented a study that showed an advanced statistical model for a safety-associated factor identification at HRGCs. The authors developed a model using a tree-based data mining method that can discover meaningful correlations in attributes among variables in a model. Then an NB model was used to predict crash frequency at HRGCs. Their conclusions indicated that the reliability of this crash prediction model was significantly improved by adding classifiers when compared to the model without interactions. This model also showed that the effect of specific safety countermeasures at HRGCs varied based on classifiers, including highway class, track angle, posted road speed, track type and surface width. Saccomanno and Lai (35) developed another crash prediction model using the same RODS/IRIS database by Statistical Package for the Social Sciences (SPSS). It showed the process to predict the number of crashes following a countermeasure can take place in two ways: 1) directly obtained from the prediction model if the countermeasures have been specified in the model, and 2) indirectly obtained by estimating factor scores and a change in cluster membership with the introduction of the countermeasures Safety Models of Vehicle Collisions on the Roadway System A summary of this subsection is presented in table 2.6. Glauz et al. (36) aimed to establish a relationship between traffic crashes and traffic conflicts (or violations), which have a higher observable frequency. The authors collected 12 different types of traffic conflicts at 46 urban intersections located in the greater Kansas City metropolitan area from 1979 to The authors compared the expected crash rate as predicted by traffic conflict data with the expected 23
36 crash rate as predicted by historical crash data using crash/conflict ratios. The authors concluded that conflicts were nearly as good as crashes in predicting expected crashes for certain types of intersections and, as such, are good surrogates of crashes. Lord et al. (37) balanced statistical fit and theory among the Poisson, NB and zeroinflated (i.e., with excess zeros recorded for the dependent variable) regression models on predicting motor vehicle crashes. The objective of their study was to make an intelligent choice for modeling motor vehicle crash data from amongst several available modeling approaches. The negative binomial distribution was found to provide a superior statistical fit than the Poisson distribution for sites with medium crash exposure. In addition, some theoretically defensible solutions for modeling crash data with excess zeros were addressed, including changing the spatial or time scale of analysis involving unobserved heterogeneity terms in the NB and Poisson models, improving the set of explanatory variables, and applying small-area statistical methods. Table 2.6 Literature Summary on Safety-Related Models on Count of Vehicle Collisions in Roadway System Research Objective Author Methodology Major Findings/Results Establish a relationship between traffic crashes and traffic conflicts (or violations) Glauz et al.,1985 Crash/conflict ratios calculation Conflicts were nearly as good as crashes in predicting expected crashes for certain types of intersection and as such good surrogates of crashes Make an intelligent choice for modeling motor vehicle crash data from amongst several available modeling approaches Lord et al.,2005 Poisson, negative binomial and zero-inflated regression models Negative binomial distribution was found to provide a superior statistical fit than the Poisson distribution for sites with medium crash exposure Defensible solutions for modeling crash data with excess zeros were addressed, including changing the spatial or time scale of analysis involving unobserved heterogeneity terms in NB and Poisson models, improving the set of explanatory variables, and applying small-area statistical methods 24
37 2.3.3 Safety Models of Pedestrian Injury Severity A summary of this subsection is given in table 2.7. Sze and Wong (38) analyzed data involving a crash environment profile, casualty injury profile and vehicle involvement profile, from the Traffic Accident Database System (TRADS) maintained by the Hong Kong Police Force and Transport Department by a binary logistic regression model. Results of the estimated model showed that factors lowering the risk of pedestrian fatality and severe injury included: being male and aged below 15 years, being on an overcrowded or obstructed sidewalk, and being involved in a daytime crash on a road section with severe or moderate congestion. Factors that led to a higher risk of pedestrian fatality and severe injury were: age above 65 years, head injury, crash at crossing or within 15-meters of a crosswalk, crash on a road section with a speed limit above 50 kilometers per hour (km/h), signalized intersection, and two or more lanes. In addition, pedestrian injury risk underwent a decreasing trend from 1991 to 2004, perhaps due to remedial measures, road safety campaigns, pedestrianization, and traffic-calming strategies. These measures were undertaken in Hong Kong during the analyzed time period. 25
38 Table 2.7 Literature Summary on Safety-Related Models on Injury Severity of Pedestrian-Only in Traffic Research Objective Author Methodology Major Findings/Results Estimate models to explore the relationship between the risk of pedestrian fatality and severe injury and associated factors Sze and Wong,2007 Binary logistic regression model Factors lowering the risk of pedestrian fatality and severe injury included: being male and aged below 15 years, being on an overcrowded or obstructed sidewalk, and being involved in a daytime crash on a road section with severe or moderate congestion Factors that led to a higher risk of pedestrian fatality and severe injury were: age above 65 years, head injury, crash at crossing or within 15-meter of a crosswalk, crash on a road section with a speed limit above 50 kilometers per hour (km/h), signalized intersection, and two or more lanes Develop model to explore the relationship between nonmotorist injury severity and associated factors Eluru et al.,2008 Mixed generalized ordered response logit model the MGORL model to be superior to the common ordered response logit model based on a comparison of measures of fit Several associated factors were: age of the individual, speed limit on the roadway, location of crashes, and time-of-day Explore the relationship between the variance of unobserved pedestrian characteristics and the variable age Kim et al.,2008 heteroskedastic multivariate model The probability of pedestrian s fatal injury increased with increasing pedestrian age, male driver, intoxicated driver, the involvement of traffic signs, commercial area, darkness, sports utility vehicle (SUV) and truck crashes, freeway, two-way divided roadway, speeding-involved crash and off roadway The probability decreased with increasing driver age as well as the involvement of PM traffic peak, traffic signal control, inclement weather, curved roadway, crosswalk and walking along roadway Investigate the relationship between the level of injury in pedestrian crashes and various associated factors Jang et al.,2010 Ordered probit model Injury levels tended to increase with older pedestrians (older than 65 years), alcohol consumption, cell phone use, time period between midnight and 6 a.m., weekend, precipitation, proceeding straight vehicle movement and lager vehicle involvement 26
39 Eluru et al. (39) reviewed studies on non-motorist injury severity in U.S. traffic crashes. Their findings were: 1) the logistic regression has been widely used when injury severity is in a binary form while the ordered response model has been commonly used when injury severity is recorded in multiple ordered categories; 2) there were no studies examining injury severity of both pedestrians and bicyclists; 3) few studies have considered attributes of the driver of the motored vehicle in pedestrian injury severity. The authors presented a mixed generalized ordered response logit model (MGORL) structure for modeling severity data, which was sourced from the 2004 General Estimated System (GES). The authors reported the MGORL model to be superior to the common ordered response logit model based on a comparison of measures of fit. Moreover, the MGORL presented the elasticity effect (the percentage change in the probability of an injury severity category due to a change in a variable from 0 to 1) between pedestrians and bicyclists. Several statistically significant associated factors were identified influencing nonmotorist injury severity. They were age of the individual (elderly were more injury-prone), speed limit on the roadway (higher speed limits led to more severe injuries), location of crashes (those at signalized intersections were less severe compared to those elsewhere) and time-of-day (darker periods led to more severe injuries). Kim et al. (40) developed a heteroskedastic multivariate model of pedestrian injury severity in their study. This model was mainly used to explore the relationship between the variance of unobserved pedestrian characteristics and the variable age. Results showed that pedestrian age induced heteroskedasticity across individual pedestrians. It affected the probability of fatal injury, especially for age past 65 years. The probability of a pedestrian s fatal injury increased with increasing pedestrian age, male driver, and intoxicated driver. It also increased with the involvement of traffic signs, commercial area, darkness, sports utility vehicle 27
40 (SUV) and truck crashes, freeway, two-way divided roadway, speeding-involved crash and off roadway. The probability decreased with increasing driver age as well as the involvement of PM traffic peak, traffic signal control, inclement weather, curved roadway, crosswalk and walking along roadway. Finally, Jang et al. (41) investigated the relationship between the level of injury in pedestrian crashes and various associated factors in San Francisco by using an ordered probit model. Based on modeling results that authors concluded that injury levels tended to increase with older pedestrians (older than 65 years), alcohol consumption, cell phone use, time period between midnight and 6 a.m., weekend, precipitation, proceeding straight vehicle movement and larger vehicle involvement. 2.4 Literature Review Summary In summary, the review of literature showed multiple sources of information on the safety of motorists at HRGCs and safety of non-motorists in traffic while relatively fewer publications were uncovered regarding pedestrian and bicyclist safety at HRGCs. Engineering, education and enforcement were found to be the main categories of countermeasures used for improving safety on highways and HRGCs. Statistical models like Poisson, negative binomial and logit models were found useful for safety predictions and associated factor identification. The next chapter provides details of data collection for this research project. 28
. The Waverly crossing has four sets of railroad tracks, two highway lanes, and is equipped with dual-quadrant gates.")
41 Chapter 3 Data Collection 3.1 Data for Evaluation of Median Barrier s Long-Term Safety Effect Data for this research was primarily collected at the N 141 st St. crossing in Waverly and the M St. crossing in Fremont, Nebraska (fig. 3.1 and fig. 3.2, respectively). The Waverly crossing has four sets of railroad tracks, two highway lanes, and is equipped with dual-quadrant gates. The Fremont crossing has two sets of railroad tracks, two highway lanes, and is also equipped with dual-quadrant gates. Figure 3.1 N 141 st St. HRGC in Waverly, Nebraska 29

42 Figure 3.2 M St. Crossing in Fremont, Nebraska Each crossing was monitored for motorists unsafe maneuvers using day- and nightvision cameras and digital video recorders (fig. 3.3 and fig. 3.4, respectively). At the Waverly crossing, a median barrier, consisting of vertical plastic plates and a flexible rubber base, was installed in December 2005 on both sides of the tracks. The barriers on both sides were removed in December 2007 at the request of the City of Waverly officials. The reasons cited were the dilapidated barrier condition (fig. 3.5) and complaints from businesses in proximity of the crossing. Data pertaining to unsafe motorist maneuvers were collected in 2006 and 2008 and therefore, the comparison showed the effect of their removal after being in place for a prolonged period. At Fremont, the barriers were left in place but no maintenance was performed and the condition of the barriers steadily eroded (fig. 3.6). Therefore, a 2006 versus 2008 comparison indicated changes in safety due to lack of maintenance. 30

")
43 Figure 3.3 Camera Installed at HRGC to Capture Crossing Maneuvers Figure 3.4 Digital Video Recorders (DVR) Housed in Metal Box 31


44 Figure 3.5 Dilapidated Condition of Barrier at the Waverly HRGC Figure 3.6 Dilapidated Condition of Barrier at Fremont due to Lack of Maintenance 32

45 Video was recorded continuously in the field and occasionally brought to the office for extraction of train crossing events. Figure 3.7 shows the office setup where after extraction of video clips unsafe maneuvers were visually observed and data populated in spreadsheets. Figure 3.8 shows the DVR interface used for extraction of pertinent video clips. Figure 3.7 Devices for Data Extraction 33
,")
46 Figure 3.8 Interface of DVR Software Four different types of gate related violations by motorists were observed and recorded in spreadsheets: passing under descending gates (gate rush 1/violation type 1), passing around fully lowered gates (gate rush 2/violation type 2), passing under ascending gates (gate rush 3/violation type 3) and passing around fully lowered gates between successive trains or a stopped train (gate rush 4/violation type 4). Examples of the first three types of gate violations are presented in figures 3.9, 3.10, and 3.11, respectively. Non gate-related violations included U-turns and vehicle backups/using wrong side of the road. Maintenance was performed on the barriers installed at the Fremont HRGC in May 2009 to restore the condition. Data on unsafe maneuvers were collected before and after performance of the maintenance to assess changes in safety. Maintenance was again performed on these barriers in April 2011 and data collected before and after the maintenance activity. Figure 3.12 presents the condition of the barriers after the 2011 maintenance. A list of the collected variables, including coding information, appears in Appendix A as table A.1. These variables 34
.")
47 were collected for each vehicle/pedestrian/bicyclist observed at the crossing. These were then aggregated to obtain statistics for each train crossing event. The aggregated variable list also appears in Appendix A (table A.2). Figure 3.9 Vehicle Passing Under Descending Gates (Violation Type 1) 35
48 Figure 3.10 Vehicle Passing Around Fully Lowered Gates (Violation Type 2) Figure 3.11 Vehicles Passing Under Ascending Gates (Violation Type 3) 36
 for recording video footage.")
49 Figure 3.12 Barrier Condition after Maintenance in Data for Educational Campaign Assessment The educational campaign was first carried out at the 44 th St. crossing in Lincoln on July 27, A camera and DVR mounted on a trailer were utilized at this location (fig. 3.13) for recording video footage. Data on pedestrians and bicyclists were collected one week before the educational campaign and then after the campaign. Figure 3.14 shows preparation for the daylong campaign. Unfortunately, no significant pedestrian and bicyclist traffic was observed on the day of the campaign and therefore distribution of the educational materials, shown in figure 3.15, was extremely limited. While data were collected, because of the lack of distribution of educational materials, the study at Lincoln was deemed inconclusive and not pursued further. The Fremont educational campaign is described next. 37


50 Figure 3.13 Data Collection Setup at the 44 th St. Crossing in Lincoln, NE Figure 3.14 Preparing for the Educational Campaign 38


51 Figure 3.15 A Sampling of Operation Lifesaver Educational Material Used in the Campaign The Fremont educational campaign was undertaken for two days on September 29 and 30, 2011 to ensure capturing pedestrian and bicyclist traffic at the crossing. Video footage was captured one week before and after the educational campaign. Significant pedestrian and bicyclist traffic was observed at this location (fig. 3.16), which was partly due to users spreading information about the campaign via word-of-mouth in the community. Figure 3.16 shows distribution of educational materials and conversations amongst research team members and the public. A significant number of materials were distributed during the two days of the campaign and therefore, the research team considered the campaign successful in reaching out to the users. After the collection of data from the video clips, they were checked for errors. The 2006 data collected during the previous project were retrieved from archives for comparisons. Analysis of the collected data is described in the next chapter. 39


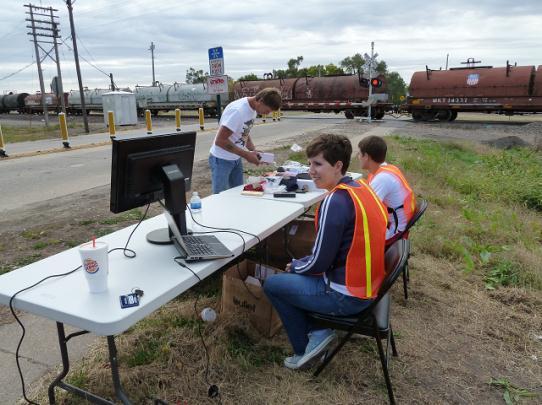
52 Figure 3.16 Education Campaign at the Fremont HRGC 40
53 Chapter 4 Data Analysis Data analysis consisted of comparisons of simple statistics and statistical regression models. Details of the statistical models are given in Appendix B. Simple statistics can directly present the change in unsafe maneuvers before and after certain safety intervention (e.g., barrier maintenance). On the other hand, statistical regression models can account for a variety of factors besides the safety intervention. A mix of both was used in the data analysis described below. 4.1 Evaluation of Median Barrier Removal at Waverly HRGC Table 4.1 presents means and percentage changes for motorists unsafe maneuvers collected at Waverly HRGC in 2006 and Compared to 2006, the means of total unsafe maneuvers (i.e., the sum of gate rush, U-turn and backup), as well as gate rushes and U-turns, increased after barrier removal in Both the means of gate rush and U-turns have significant percentage changes in 2008 (i.e., around 5 times and 3.5 times of 2006 means, respectively) however, compared to 2006, the mean backups decreased in Table 4.1 Comparison of Averages before and after Removal of the Barrier Mean unsafe maneuvers per gate closure event Relative 2008 performance Maneuver 2006 B a NB b. % change of 2008 NB vs B Total Unsafe Gate rush U-Turn Backup a. B represents barrier is in place b. NB represents no barrier (i.e., removed) 41
54 Four models were estimated comparing the total number of unsafe maneuvers, gate violations, U-turns, and vehicle backups for 2006 and 2008 data collected at the Waverly HRGC. These models are presented in tables 4.2, 4.3, 4.4, and 4.5. Table 4.2 shows the estimated negative binomial model for total unsafe maneuvers. In this model the estimated α value is statistically significant at 95% confidence level (t-value > 1.96) indicating over-dispersion and therefore, the appropriateness of the negative binomial regression compared to a Poisson model. Model fit as judged by the ρ 2 statistic appears reasonable and the statistical significance of the chi-squared value (P-value <0.05) at the 95% confidence level shows that overall the model provides useful information. A positive estimated coefficient for an independent variable indicates that aggregate unsafe maneuvers increased with increasing values of that independent variable. The model specification included a dummy variable for the two time periods (2006=0, 2008=1) representing presence and absence of the barrier. This dummy variable provided information on differences in total unsafe maneuvers with and without the barrier in place. The positive estimated coefficient (statistically significant at the 95% confidence level) showed that aggregate unsafe maneuvers per gate closure event were more frequent during 2008 when the barrier was removed compared to
55 Table 4.2 Model for Total Number of Unsafe Maneuvers at Waverly HRGC Independent variable Estimated Coefficient t-value Mean value Constant Time period dummy (2008=1, 2006=0) Duration of gate closure (minutes) Roadway traffic encountered during gate closure Weekend dummy (weekend=1, weekdays=0) Train stop dummy (stopped=1, did not stop=0) Gate malfunction dummy (yes=1, no=0) Clear weather dummy (clear=1, otherwise=0) Alpha Model summary statistics Number of observations 3990 Log likelihood Restricted log likelihood Rho-squared(ρ2) Chi-squared P-value for chi-squared Model results in table 4.2 show that longer durations of gate closure were associated with higher frequencies of aggregate unsafe maneuvers per gate closure event. As well, unsafe maneuvers increased with greater roadway traffic encountered during a gate closure event. Together, the gate closure duration and roadway traffic encountered during gate closure account for exposure in the case of HRGCs. Aggregate unsafe maneuvers were more frequent on weekends as opposed to weekdays, more frequent when trains stopped on the crossing and increased if the gate malfunctioned (i.e., gates descended without a train present in the crossing vicinity). The model further showed that the frequency of unsafe maneuvers at HRGCs was greater in clear weather compared to adverse weather conditions. Table 4.3 presents the negative binomial model for frequency of gate rush. The dummy variable for the two time periods was positive and statistically significant showing that frequency 43
56 of gate rushes per train crossing event increased in 2008 when the barrier was removed compared to The negative sign of the coefficient for the duration of gate closure implies that drivers less frequently rushed the gate when gates were closed for longer duration. Frequency of gate rush increased with greater roadway traffic encountered during gate closure events. Weekends, gate malfunctions and clear weather were associated with greater frequencies of gate rush. Table 4.3 Model for Frequency of Gate Rush at Waverly HRGC Independent variable Estimated Coefficient t-value Mean value Constant Time period dummy (2008=1, 2006=0) Duration of gate closure (minutes) Roadway traffic encountered during gate closure Weekend dummy (weekend=1, weekdays=0) Gate malfunction dummy (yes=1, no=0) Clear weather dummy (clear=1, otherwise=0) Alpha Model summary statistics Number of observations Log likelihood Restricted log likelihood Rho-squared(ρ2) Chi-squared P-value for chi-squared A negative binomial model for the frequency of U-turns was estimated and reported in table 4.4. Modeling results show that U-turns increased in 2008 compared to Longer duration of gate closure and greater roadway traffic encountered during gate closure events were associated with greater frequency of U-turns. Drivers made U-turns more often on weekends 44
57 compared to other days of the week. Likewise, the frequency of U-turns increased when trains stopped on the crossing and when gates malfunctioned. Table 4.4 Model for the number of U-turns at Waverly HRGC Independent variable Estimated Coefficient t-value Mean value Constant Time period dummy (2008=1, 2006=0) Duration of gate closure (minutes) Roadway traffic encountered during gate closure Weekend dummy (weekend=1, weekdays=0) Train stop dummy (stopped=1, did not stop=0) Gate malfunction Alpha Model summary statistics Number of observations Log likelihood Restricted log likelihood Rho-squared(ρ2) Chi-squared P-value for chi-squared The backup maneuver involved a vehicle backing out of a crossing; after backing up, drivers sometimes made U-turns to head back in the direction from where they came or if the barrier was present they sometimes circumvented it by using the wrong side of the road to pass around closed gates (provided the train had not yet reached the crossing). Table 4.5 presents the estimated model. Judging from the negative sign of the estimated parameter for time period dummy variable, vehicular backups decreased in 2008 compared to Greater frequency of vehicle backups were associated with longer gate closure durations however, the model did not show any statistically significant relationship between vehicular backups and the roadway traffic 45
58 encountered during a gate closure event. This variable was retained in the model specification since it is part of exposure at HRGCs and in light of evidence from previous models that show a relationship between roadway traffic encountered during a gate closure event and unsafe maneuvers. Additionally, train stoppage on the crossing was associated with greater frequency of vehicular backups. Table 4.5 Model for the Number of Vehicle Backups at Waverly HRGC Independent variable Estimated Coefficient t-value Mean value Constant Time period dummy (2008=1, 2006=0) Duration of gate closure (minutes) Roadway traffic encountered during gate closure Train stop dummy (stopped=1, did not stop=0) Alpha Model summary statistics Number of observations Log likelihood Restricted log likelihood Rho-squared(ρ2) Chi-squared P-value for chi-squared Evaluation of Median Barrier s Long-Term Effect at Fremont HRGC Table 4.6 presents means and percentage changes for the motorists unsafe maneuvers collected at Fremont HRGC in 2006 and Barrier was installed in 2006 and used at Fremont HRGC until 2008.These statistics show the impact of motorist s unsafe maneuvers over a relatively long term. Compared to 2006, the means of total unsafe maneuvers (i.e., the sum of gate rush, U-turn and backup) and gate rush increased in Specifically, the means of gate 46
59 rush had a significant percentage change in 2008, however, compared to 2006, the means of U- turns and backups decreased in Table 4.6 Comparison of Averages Concerning Barrier s Long-Term Safety Effect Mean unsafe maneuvers per gate closure event Relative 2008 performance Maneuver 2006 B a B % Change of 2008 B vs B Total Unsafe Passing around gate U-Turn Backup a. B represents barrier is in place Similar to previous detailed analysis, statistical regression models were used. Table 4.7 shows the estimated negative binomial model for aggregate unsafe maneuvers. The alpha value was statistically significant at 95% confidence level (t-value > 1.96) indicating the appropriateness of the negative binomial compared to a Poisson model. Model fit was rather low but the statistical significance of the chi-squared value (P-value <0.05) at the 95% confidence level showed that the model provided useful information. 47
60 Table 4.7 Model for Frequency Unsafe Maneuvers at Fremont HRGC between 2006 and 2008 Independent variable Estimated coefficient t-value Mean value Time period dummy (2008=1, 2006=0) Duration of gate closure (minutes) Weather dummy (clear=1, otherwise=0) Number of crossing trains Train stop dummy (stopped=1, did not stop=0) Number of queued vehicles at gate opening Constant Alpha (α) Model summary statistics Number of observations 6600 Log Likelihood Restricted log likelihood Rho-squared ( ) Chi-squared P-value for chi-squared The model specification included a dummy variable for the two time periods (2008=1, 2006=0), which provided information on differences in total unsafe maneuvers during the two periods. The negative estimated coefficient (statistically significant at the 95% confidence level) showed that aggregate unsafe maneuvers were fewer during 2008 compared to The model showed that longer gate closure duration was associated with more frequent unsafe maneuvers. Aggregate unsafe maneuvers were more frequent in clear weather as opposed to adverse (snow, fog, rain, etc.) conditions and more frequent when multiple trains were crossing (either simultaneously or consecutively). Other findings from this model were that aggregate unsafe maneuvers increased if a train stopped on the crossing and also increased with greater number of queued vehicles at gate opening time (a measure of vehicular traffic). 48
61 Table 4.8 presents the estimated negative binomial model for frequency of gate rush. This model showed that the frequency of gate rush increased in 2008 compared to Drivers more often engaged in gate rush with longer duration of gate closures and in clear weather. The finding that longer duration of gate closure contributes to higher frequency of gate rush is likely explained by consecutive trains that have a small time gap between their passages. While the gates remained in down position during this gap, drivers frequently used it to pass to the other side. Train stoppage on the tracks was associated with lower frequency of gate rush (perhaps because drivers more often make U-turns or backup to go elsewhere in this situation) while greater number of queued vehicles at gate opening time (a measure of vehicular traffic) was associated with increased frequency of gate rush. Table 4.8 Model for Frequency of Gate Rush at Fremont HRGC between 2006 and 2008 Independent variable Estimated coefficient t-value Mean value Time period dummy (2008=1, 2006 =0) Duration of gate closure (minutes) Weather dummy (clear=1, otherwise=0) Train stop dummy (stopped=1, did not stop=0) Number of queued vehicles at gate opening Constant Alpha (α) Model summary statistics Number of observations 6600 Log Likelihood Restricted log likelihood Rho-squared ( ) Chi-squared P-value for chi-squared
62 The estimated model for frequency of U-turns is shown in table 4.9; it showed that U-turn frequency decreased during 2008 compared to Increased duration of gate closure was associated with higher frequency of U-turns. Weekends were associated with higher frequency of U-turns compared to weekdays. Similarly, clear weather was associated with higher frequency of U-turns as was greater number of crossing trains. More frequent U-turns were made if a train stopped on the tracks as well if there were more queued vehicles at gate opening. Table 4.9 Model for the Number of U-turns at Fremont HRGC between 2006 and 2008 Independent variable Estimated coefficient t-value Mean value Time period dummy (2008 =1, 2006=0) Duration of gate closure (minutes) Weekend dummy (weekend=1, weekday=0) Weather dummy (clear=1, otherwise=0) Number of crossing trains Train stop dummy (stopped=1,did not stop=0) Number of queued vehicles at gate opening Constant Alpha (α) Model summary statistics Number of observations 6600 Log Likelihood Restricted log likelihood Rho-squared ( ) Chi-squared P-value for chi-squared Table 4.10 presents the estimated model for frequency of backups. Results showed that there was no statistically significant difference between the frequencies of backups in 2008 compared to Similarly, longer gate closure duration was associated with higher frequency of backups. Drivers more often backed up on weekends, more often when more trains were using 50
63 the HRGC, and more frequent when trains stopped on the crossing. Finally, more frequent vehicular backups were associated with greater number of queued vehicles. Table 4.10 Model for Number of Backups at Fremont HRGC between 2006 and 2008 Independent variable Estimated coefficient t-value Mean value Time period dummy (2008 =1, 2006=0) Duration of gate closure (minutes) Weekend dummy (weekend=1, weekday=0) Number of crossing trains Train stop dummy (stopped=1,did not stop=0) Number of queued vehicles at gate opening Constant Alpha (α) Model summary statistics Number of observations 6600 Log Likelihood Restricted log likelihood Rho-squared ( ) Chi-squared P-value for chi-squared Safety Evaluation of Median Barrier Maintenance at the Fremont HRGC Maintenance was performed twice at Fremont; first in 2009 and then in These efforts were assessed by collecting data on unsafe maneuvers before the maintenance activity and then again after the maintenance activity Assessment of Maintenance in 2009 Table 4.11 shows means and percent change in motorists gate-related violations at Fremont HRGC between 2008 and The total number of gate rush violations increased by 31% after maintenance, however, a closer inspection of the different types of gate violations 51
64 indicated a reduction of about 52% in gate rush type 2 violations, which are the most severe type of violation. Also, a 100% reduction was observed in gate rush type 2 violations after maintenance was performed. Table 4.11 Comparison of before-and-after Gate-Related Violations for the 2009 Barrier Maintenance Mean gate rush per train crossing Type of gate rush Before maint. (2008) After maint. (2009) % change Gate rush Gate rush Gate rush Gate rush Total gate rush Assessment of Maintenance in 2011 Table 4.12 presents means and percentage changes for different types of gate-related violations by motorists at the Fremont HRGC in Data concerning motorists gate rush maneuvers were collected before and after the maintenance in March and April of Similar to the previous maintenance evaluation, the total number of gate-related violations increased, though importantly gate rush type 2 violations decreased after the maintenance by about 30%. 52
65 Table 4.12 Comparison of before-and-after Gate-Related Violations for the 2011 Barrier Maintenance Mean gate rush per train crossing Type of gate rush Before maintenance (March 2011) After maintenance (April 2011) % change Gate rush Gate rush Gate rush Gate rush Total gate rush Two Poisson models were estimated using the 2011 dataset. The first was for the total frequency of gate related violations per train crossing and the second was for the frequency of gate rush type 2 violations per train crossing. These models are reported in tables 4.13 and 4.14, respectively. These models are briefly discussed next. 53
66 Table 4.13 Model for Total Gate Rush Frequency at Fremont HRGC in 2011 Independent variable Estimated coefficient t-value Mean value Time period dummy (after maintenance=1, before maintenance=0) Passenger car dummy (passenger car involved=1, no passenger car involved=0) Frequency of violation opportunity Vehicle volume (in queue and violation) Number of crossing trains Daytime dummy (daytime=1, others=0) Constant Model summary statistics Number of observations 986 Log Likelihood Restricted log likelihood Rho-squared ( ) Chi-squared P-value for chi-squared Table 4.14 Model for Frequency of Gate Rush Type 2 at Fremont HRGC in 2011 Independent variable Estimated coefficient t-value Mean value Time period dummy (after maintenance=1, before maintenance=0) Vehicle volume (in queue and violation) Time between light flashing and train arrival (minutes) Constant Model summary statistics Number of observations 974 Log Likelihood Restricted log likelihood Rho-squared ( ) Chi-squared P-value for chi-squared
67 Table 4.13 shows the estimated model for the total frequency of gate rush maneuvers per train crossing. Model fit as judged by the ρ 2 statistic appears reasonable and the statistical significance of the chi-squared value (P-value <0.05) at the 95% confidence level showed that overall the model provided useful information. The estimated coefficient for the dummy variable for the two time periods (after maintenance=1, before maintenance=0) was statistically significant at the 95% confidence level showing that aggregate gate rush maneuvers per gate closure event were more frequent after barrier maintenance in April Passenger car involvement was associated with greater frequencies of aggregate gate rush maneuvers per gate closure event. Unsafe gate rush maneuvers increased with greater roadway traffic encountered during gate closure events and greater number of trains arriving at this HRGC. Aggregate unsafe gate rush maneuvers were more frequent with greater opportunities for violations and during daytimes. The model for the frequency of gate rush type 2 in table 4.14 shows that the estimated parameter for the dummy variable for the two time periods was negative indicating that the frequency of gate rush type 2 decreased after the barrier was maintained. However, this variable was not statistically significant. Therefore, after accounting for different factors affecting gate rush type 2 violations, there was not enough evidence in the data to discern differences in the before-and-after time periods. 4.4 Evaluation of Educational Campaign for Non-Motorists at the Fremont HRGC Table 4.15 presents means and percent changes for the non-motorists gate-related violations at the Fremont HRGC in A two-day educational campaign separates the beforeand-after time periods that spanned one week each. The statistics in the table show that compared to the before period, the means of gate rush type 1 and 2 decreased in the after periods. The 55
68 percent changes were around 90% for gate rush type 1 and 39% for gate rush type 2. Also, the total gate-related violations reduced by about 3% after the educational campaign. Table 4.15 Comparison of Averages Concerning Educational Activity Effect in 2011 Mean gate rush per train crossing Type of gate rush One week before education (Sep.2011) One week after education (Oct. 2011) % change Gate rush Gate rush Gate rush Total gate rush As stated before, the gate rush type 2 violation is the most dangerous maneuver amongst the different types of gate-related violations considered in this study. A Poisson model was estimated to fully investigate the effects of the educational campaign on this particular type of violation. Results of the model are reported in table The dummy variable for the two time periods is negative and statistically significant showing that the frequency of gate rush type 2 violations per train crossing for non-motorists decreased after the educational campaign was completed. The model also shows that the tendency of pedestrians and bicyclists to pass around fully lowered gates was greater when they were crossing the tracks in groups as opposed to when they were not in groups. This variable is statistically significant at 90% confidence level only. 56
69 Table 4.16 Model for Number of Gate Rush Type 2 before and after Educational Campaign in 2011 Independent variable Estimated coefficient t-value Mean value Time period dummy (after maintenance=1, before maintenance=0) Gate rush 2 opportunities for bicyclists Gate rush 2 opportunities for pedestrians Time between light flashing and train arrival (seconds) Dummy for group crossing (group=1; individual=0) Constant Model summary statistics Number of observations 96 Log Likelihood Restricted log likelihood Rho-squared ( ) Chi-squared P-value for chi-squared
70 Chapter 5 Conclusions and Recommendations There were two major objectives of this research. The first was to investigate long-term effects of median barriers on motorists unsafe maneuvers at HRGCs and the second was to investigate different ways to improve pedestrian and bicyclist safety at HRGCs. For the first objective, the long-term safety effect of median barriers on motorists was evaluated at two different HRGCs located in Waverly and Fremont, NE. The effects of removing the barriers and maintaining them in good condition were quantified. The effects of an educational campaign utilizing Operation Lifesaver educational materials on improving pedestrian and bicyclist safety were evaluated as part of the second objective. Based on the findings from the data analysis the following conclusions were drawn. 5.1 Conclusions Removal of the barrier in Waverly contributed to greater frequency of unsafe maneuvers by motorists. Specifically, the frequencies of aggregate unsafe maneuvers (i.e., the sum of motorist gate rush, U-turn and backup), as well as gate rush and U-turn increased after barrier removal in Safety deteriorated over the long-term at the Fremont crossing while maintenance resurrected safety by reducing the frequency of passing around fully lowered gates by 30-50%. Regarding the effects of the educational campaign focused on pedestrians and bicyclists the effort at the Lincoln crossing was inconclusive but the campaign successfully reduced passing around fully lowered gates by about 39%. 58
71 5.2 Recommendations and Future Research The recommendations stemming out of this research are as follows. Median barriers must be maintained in top condition after installation. Due to the frequent maintenance observed during this research the barriers should be installed on a 6-9 inch high concrete curb (see fig. 5.1 below). Once installed at HRGCs, subsequent removal of median barriers is not recommended. Educational campaigns focused on pedestrians and bicyclists are recommended for improvement of safety at HRGCs. Future research is recommended to investigate the long-term effects of educational campaigns on improving pedestrian and bicyclist safety. Also, more-intensive educational campaigns including TV and radio commercials and outreach to schools are recommended for future undertaking. Finally, the potential for enforcement at HRGCs should be considered for evaluation. 59

72 Figure 5.1 Installation of Median Barrier on Raised Concrete Curb at an HRGC 60
Crash Analysis of I-64 Closure in St. Louis County
 Report # MATC-MST: 341 Final Report 25-1121-0001-341 Crash Analysis of I-64 Closure in St. Louis County Ghulam H. Bham, Ph.D. Professor Department of Civil, Architectural, and Environmental Engineering
THE DEVELOPMENT OF MALAYSIAN HIGHWAY RAIL LEVEL CROSSING SAFETY SYSTEMS: A PROPOSED RESEARCH FRAMEWORK. Siti Zaharah Ishak
 THE DEVELOPMENT OF MALAYSIAN HIGHWAY RAIL LEVEL CROSSING SAFETY SYSTEMS: A PROPOSED RESEARCH FRAMEWORK Siti Zaharah Ishak Transport System Centre, School of Natural & Built Environments, University Of
Improving Non-motorist Safety at Gated Railroad Crossings Potential Application of Intelligent Transportation Systems
 Improving Non-motorist Safety at Gated Railroad Crossings Potential Application of Intelligent Transportation Systems 1 Aemal Khattak, 2 Zheng Luo 1 Department of Civil Engineering, University of Nebraska-Lincoln,
Railroad-Highway Grade Crossing Analysis for Corridor Planning Projects
 Railroad-Highway Grade Crossing Analysis for Corridor Planning Projects Word Count: 4,305 Submission Date: August 1, 2015 Author: Adriana Rodriguez, E.I Assistant Engineer Parsons Brinckerhoff 1420 South
Safety Effectiveness of Pedestrian Crossing Treatments
 Portland State University PDXScholar TREC Friday Seminar Series Transportation Research and Education Center (TREC) 10-13-2017 Safety Effectiveness of Pedestrian Crossing Treatments Christopher Monsere
Strategic Research PROGRAM FOLLOW-UP ASSESSMENT OF THE MOBILEYE SHIELD+ COLLISION AVOIDANCE SYSTEM
 165610-1 Strategic Research PROGRAM FOLLOW-UP ASSESSMENT OF THE MOBILEYE SHIELD+ COLLISION AVOIDANCE SYSTEM March 2017 1. Report No. TTI/SRP/17/165610-1 2. Government Accession No. 3. Recipient's Catalog
IMPROVING PEDESTRIAN SAFETY AT UNCONTROLLED CROSSINGS. Guidelines for Marked Crosswalks
 IMPROVING PEDESTRIAN SAFETY AT UNCONTROLLED CROSSINGS Presented by Nazir Lalani P.E. Traffex Engineers Inc. N_lalani@hotmail.com Guidelines for Marked Crosswalks Source: FHWA, Safety Effects of Marked
Recent U.S. Research on Safety Evaluation of Low-Cost Road Engineering Safety Countermeasures Lessons for Canada
 Recent U.S. Research on Safety Evaluation of Low-Cost Road Engineering Safety Countermeasures Lessons for Canada Bhagwant Persaud Department of Civil Engineering, Ryerson University 350 Victoria Street,
Document 2 - City of Ottawa Pedestrian Crossover (PXO) Program
 Program") 40 Document 2 - City of Ottawa Pedestrian Crossover (PXO) Program OVERVIEW The City of Ottawa Pedestrian Crossover (PXO) Program provides the basis for PXO implementation in Ottawa. The program s processes
40 Document 2 - City of Ottawa Pedestrian Crossover (PXO) Program OVERVIEW The City of Ottawa Pedestrian Crossover (PXO) Program provides the basis for PXO implementation in Ottawa. The program s processes
At each type of conflict location, the risk is affected by certain parameters:
 TN001 April 2016 The separated cycleway options tool (SCOT) was developed to partially address some of the gaps identified in Stage 1 of the Cycling Network Guidance project relating to separated cycleways.
Appendix A: Crosswalk Policy
 Appendix A: Crosswalk Policy Appendix A: Crosswalk Policy Introduction This citywide Crosswalk Policy is aimed at improving pedestrian safety and enhancing pedestrian mobility by providing a framework
An analysis of driver behavior in response to warning beacon installations on stop signs
 Graduate Theses and Dissertations Iowa State University Capstones, Theses and Dissertations 2018 An analysis of driver behavior in response to warning beacon installations on stop signs Qilin Liu Iowa
PEDESTRIAN SAFETY IMPROVEMENT EVALUATION GUIDELINE FOR UNCONTROLLED CROSSINGS
 PEDESTRIAN SAFETY IMPROVEMENT EVALUATION GUIDELINE FOR UNCONTROLLED CROSSINGS Traffic Safety Engineering Division Updated: April 2018 EXECUTIVE SUMMARY NDOT Traffic Safety Engineering Division developed
Chapter 5 DATA COLLECTION FOR TRANSPORTATION SAFETY STUDIES
 Chapter 5 DATA COLLECTION FOR TRANSPORTATION SAFETY STUDIES 5.1 PURPOSE (1) The purpose of the Traffic Safety Studies chapter is to provide guidance on the data collection requirements for conducting a
An Application of Signal Detection Theory for Understanding Driver Behavior at Highway-Rail Grade Crossings
 An Application of Signal Detection Theory for Understanding Driver Behavior at Highway-Rail Grade Crossings Michelle Yeh and Jordan Multer United States Department of Transportation Volpe National Transportation
Access Management in the Vicinity of Intersections
 Access Management in the Vicinity of Intersections FHWA-SA-10-002 Technical Summary Photo: Ralph Bentley (used with permission) 0 Access Management is: The design, implementation and management of entry
DOT HS September Crash Factors in Intersection-Related Crashes: An On-Scene Perspective
 DOT HS 811 366 September 2010 Crash Factors in Intersection-Related Crashes: An On-Scene Perspective DISCLAIMER This publication is distributed by the U.S. Department of Transportation, National Highway
CITY OF SARATOGA SPRINGS PEDESTRIAN CROSSING TOOLBOX
 CITY OF SARATOGA SPRINGS PEDESTRIAN CROSSING TOOLBOX This toolbox is to be used to guide pedestrian crossing improvements within the City of Saratoga Springs. Details for each crossing type are provided.
Texas Transportation Institute The Texas A&M University System College Station, Texas
 1. Report No. FHWA/TX-05/0-4084-P1 4. Title and Subtitle GUIDELINES FOR THE USE OF COUNTERMEASURES TO REDUCE CRASHES ON APPROACHES TO SIGNALIZED INTERSECTIONS NEAR VERTICAL CURVES 2. Government Accession
Access Location, Spacing, Turn Lanes, and Medians
 Design Manual Chapter 5 - Roadway Design 5L - Access Management 5L-3 Access Location, Spacing, Turn Lanes, and Medians This section addresses access location, spacing, turn lane and median needs, including
Prediction of Pedestrian Crashes at Midblock Crossing Areas using Site and Behavioral Characteristics Preliminary Findings
 Prediction of Pedestrian Crashes at Midblock Crossing Areas using Site and Behavioral Characteristics Preliminary Findings Timothy J. Gates, Ph.D., P.E. June 22, 2016 Pedestrian-Involved Crashes Pedestrian-Involved
INSURANCE INSTITUTE FOR HIGHWAY SAFETY 1005 NORTH GLEBE ROAD ARLINGTON, VA PHONE 703/ FAX 703/
 Statement before the Virginia House of Delegates Militia, Police, and Public Safety Committee Red light violations and red light cameras Stephen L. Oesch INSURANCE INSTITUTE FOR HIGHWAY SAFETY 1005 NORTH
MEMORANDUM. Background
 MEMORANDUM DATE: September 2, 2013 TO: FROM: SUBJECT: PROJECT: City of Fife Attn: Russ Blount 5411 23 rd Street East Fife, WA 98424 Al Tebaldi, PE 54 th Avenue East Crossing Safety Memorandum FIFE0000-0177-
City of Elizabeth City Neighborhood Traffic Calming Policy and Guidelines
 City of Elizabeth City Neighborhood Traffic Calming Policy and Guidelines I. Purpose: The City of Elizabeth City is committed to ensure the overall safety and livability of residential neighborhoods. One
MEMORANDUM. Charlotte Fleetwood, Transportation Planner
 MEMORANDUM Date: Updated August 22, 2017 To: Organization: Charlotte Fleetwood, Transportation Planner Boston Transportation Department From: Jason DeGray, P.E., PTOE, Regional Director of Engineering
An Analysis of Reducing Pedestrian-Walking-Speed Impacts on Intersection Traffic MOEs
 An Analysis of Reducing Pedestrian-Walking-Speed Impacts on Intersection Traffic MOEs A Thesis Proposal By XIAOHAN LI Submitted to the Office of Graduate Studies of Texas A&M University In partial fulfillment
Designing for Pedestrian Safety in Washington, DC
 Designing for Pedestrian Safety in Washington, DC February 25, 2014 George Branyan Pedestrian Program Coordinator District Department of Transportation DC Journey to work mode split: 2012 Means of Transportation
Active Transportation Facility Glossary
 Active Transportation Facility Glossary This document defines different active transportation facilities and suggests appropriate corridor types. Click on a facility type to jump to its definition. Bike
Driver Behavior at Highway-Rail Grade Crossings With Passive Traffic Controls
 2014 Global Level Crossing Symposium August 2014, Urbana, IL, USA Driver Behavior at Highway-Rail Grade Crossings With Passive Traffic Controls - A Driving Simulator Study Presenter: Dr. Asad J. Khattak
Pedestrian Hybrid Beacon Guide Recommendations and Case Study. FHWA Safety Program.
 Pedestrian Hybrid Beacon Guide ecommendations and Case Study FHWA Safety Program http://safety.fhwa.dot.gov A pedestrian hybrid beacon (PHB) is a traffic control device similar to a European pedestrian
2012 TOWN OF CASTLE ROCK MOTOR VEHICLE ACCIDENT FACTS PREPARED BY THE PUBLIC WORKS DEPARTMENT
 ATTACHMENT A 2012 TOWN OF CASTLE ROCK MOTOR VEHICLE ACCIDENT FACTS PREPARED BY THE PUBLIC WORKS DEPARTMENT ACKNOWLEDGEMENTS This report was assembled from data provided by the Castle Rock Police Department
EMPHASIS AREA 1: PEDESTRIANS
 EMPHASIS AREA 1: PEDESTRIANS A pedestrian is seriously injured or killed every 3 days on Toronto s roads. Pedestrian collisions involve any person that is not riding in a vehicle or on a bicycle. 26% OF
Citywide Sidewalk and Crosswalk Programs
 Citywide Sidewalk and Crosswalk Programs Council Meeting October 20, 2015 Presented by Rita Hu and Jamal Mahmoud Program Goals Implement the City s comprehensive plan. Provide pedestrian with safe walking
C/CAG. Sunnybrae Elementary School Walking and Bicycling Audit. San Mateo-Foster City School District JUNE 2013
 Sunnybrae Elementary School Walking and Bicycling Audit JUNE 2013 San Mateo-Foster City School District C/CAG City/County Association of Governments of San Mateo County SUNNYBRAE ELEMENTARY SCHOOL WALKING
Appendix C. TRAFFIC CALMING PROGRAM TOOLBOX
 Appendix C. TRAFFIC CALMING PROGRAM TOOLBOX PHASE I...2 Do Not Enter Sign...3 One-Way Sign...4 Turn Prohibition...5 Pavement Markings...6 Speed Monitoring Trailer...7 Neighborhood Speed Watch...8 Police
GUIDELINES FOR USING DECISION SIGHT DISTANCE AT IGNALIZED INTERSECTIONS NEAR VERTICAL CURVES
 1. Report No. FHWA/TX-05/0-4084-P2 4. Title and Subtitle 2. Government Accession No. 3. Recipient's Catalog No. GUIDELINES FOR USING DECISION SIGHT DISTANCE AT IGNALIZED INTERSECTIONS NEAR VERTICAL CURVES
Characteristics of Traffic Accidents in Highway Work Zones
 Characteristics of Traffic Accidents in Highway Work Zones A DETAILED ANALYSIS OF WORK ZONE ACCIDENTS REPORTED ON NEW YORK STATE DEPARTMENT OF TRANSPORTATION CONSTRUCTION PROJECTS ESTABLISHED THE PREDOMINANT
USER GUIDE FOR R1-6 GATEWAY TREATMENT
 USER GUIDE FOR R1-6 GATEWAY TREATMENT FOR PEDESTRIAN CROSSINGS Prepared by: Western Michigan University T.Y. Lin International December 2016 Updated May 2018 Acknowledgements Michigan Department of Transportation
Development of Safety Performance Functions and Other Decision Support Tools to Assess Pedestrian and Bicycle Safety FINAL REPORT
 TRCLC 14-6 September 30, 2016 Development of Safety Performance Functions and Other Decision Support Tools to Assess Pedestrian and Bicycle Safety FINAL REPORT By Timothy J. Gates, Peter T. Savolainen,
Appendix T CCMP TRAIL TRAFFIC & TRANSPORTATION DESIGN STANDARD
 Appendix T CCMP 3.3.4 TRAIL TRAFFIC & TRANSPORTATION DESIGN STANDARD 3.3.4 Trail Traffic and Transportation Design Multi-use trails have certain design standards, which vary depending on the agency that
Project Team. Refined Pedestrian Crossing Toolbox. Problem Statement. Aerial of Study Corridor. Crossing Accommodations and Pedestrian Fatalities
 Project Team Refined Pedestrian Crossing Toolbox Treatments on Wide, High Speed Urban Roadways Developed as Part of the Springfield Main Street (OR 126) Safety Study Consultants Scott Mansur, P.E., P.T.O.E.
Fundamentals of Traffic Control Devices
 Fundamentals of Traffic Control Devices Traffic Engineering & Operations October 8, 2014 Raj Ponnaluri, Angela Wilhelm, and Christopher Lewis Agenda Agenda Signs Pavement Markings Signals Traffic Operations
Effects of Traffic Signal Retiming on Safety. Peter J. Yauch, P.E., PTOE Program Manager, TSM&O Albeck Gerken, Inc.
 Effects of Traffic Signal Retiming on Safety Peter J. Yauch, P.E., PTOE Program Manager, TSM&O Albeck Gerken, Inc. Introduction It has long been recognized that traffic signal timing can have an impact
PEDESTRIAN CROSSING STATISTICS
 PEDESTRIAN SAFETY UTILIZATION OF RRFB AND HYBRID BEACONS WILLIAM (BILL) MARSHALL PEDESTRIAN CROSSING STATISTICS STUDIES INDICATE CROSSWALK COMPLIANCE IS FROM 4% 30% HAWAII REPORTED 50 NON YIELDS TO PEDESTRIANS
USER GUIDE FOR R1-6 GATEWAY TREATMENT
 USER GUIDE FOR R1-6 GATEWAY TREATMENT FOR PEDESTRIAN CROSSINGS Prepared by: Western Michigan University T.Y. Lin International December 2016 Acknowledgements Michigan Department of Transportation MDOT
The DC Pedestrian Master Plan
 The DC Pedestrian Master Plan September 28, 2010 George Branyan Pedestrian Program Coordinator District Department of Transportation Presentation Agenda Scope of the Plan Methodology Recommendations Implementation
Glossary of Terms. ABANDONMENT The permanent cessation of rail activity on a given line of railroad.
 Glossary of Terms AAR/DOT CROSSING NUMBER A uniform numbering system in which a unique designation is assigned to every highway-rail grade crossing in the nation. It consists of a six digit number followed
Traffic Parameter Methods for Surrogate Safety Comparative Study of Three Non-Intrusive Sensor Technologies
 Traffic Parameter Methods for Surrogate Safety Comparative Study of Three Non-Intrusive Sensor Technologies CARSP 2015 Collision Prediction and Prevention Approaches Joshua Stipancic 2/32 Acknowledgements
Advance Yield Markings Reduce Motor Vehicle/Pedestrian. Conflicts at Multilane Crosswalks with an Uncontrolled Approach.
 Advance Yield Markings Reduce Motor Vehicle/Pedestrian Conflicts at Multilane Crosswalks with an Uncontrolled Approach by Ron Van Houten Mount Saint Vincent University J.E. Louis Malenfant Center for Education
SCHOOL CROSSING PROTECTION CRITERIA
 CITY OF MADISON TRAFFIC ENGINEERING SCHOOL CROSSING PROTECTION CRITERIA AUGUST 1990 Adopted as Policy on August 31, 1976, by Common Council by Amended Resolution #29,540 Amended on September 14, 1976,
EVALUATION OF HAWK SIGNAL AT GEORGIA AVENUE AND HEMLOCK STREET, NW IN THE DISTRICT OF COLUMBIA FINAL REPORT. August 30, 2010
 EVALUATION OF HAWK SIGNAL AT GEORGIA AVENUE AND HEMLOCK STREET, NW IN THE DISTRICT OF COLUMBIA FINAL REPORT August 30, 2010 Submitted to: Mr. George Branyan Pedestrian Program Manager Policy, Planning
City of Vallejo Traffic Calming Toolbox
 City of Vallejo Traffic Calming Toolbox June 1, 2013 Final Table of Contents Introduction... 1 Non-Physical Devices... 3 High-Visibility Crosswalk... 3 In Pavement Lighted Crosswalk... 4 Rapid Flashing
Evaluation of Large-Truck Fixed-Object Crashes at Bridge Structures in Kansas
 Report # MATC-KU: 466 Final Report 25-1121-0001-466 Evaluation of Large-Truck Fixed-Object Crashes at Bridge Structures in Kansas Steven D. Schrock, Ph.D., P.E. Associate Professor Civil, Environmental,
GOVERNMENT OF SASKATCHEWAN SUBMISSION TO THE RAILWAY SAFETY ACT REVIEW PANEL
 GOVERNMENT OF SASKATCHEWAN SUBMISSION TO THE RAILWAY SAFETY ACT REVIEW PANEL Saskatchewan Highways & Transportation May 29, 2007 I Introduction Government of Saskatchewan Submission To the Railway Safety
CITY OF WEST LAKE HILLS. Forest View Neighborhood Traffic Calming Study
 CITY OF WEST LAKE HILLS 901 South Mopac Expressway Building V, Suite 220 Austin, Texas 78746 Texas P.E. Firm Registration No. F-929 Klotz Associates Final Report Submittal: March 20, 2015 Revised Final
Pedestrian Accidents in Utah
 TRANSPORTATION RESEARCH RECORD 1325 69 Pedestrian Accidents in Utah ERIC YUAN-CHIN CHENG The objectives are to investigate the trend of Utah's pedestrian accident rate and to analyze and discuss some of
Evaluation of a Combined Bicycle Lane/Right Turn Lane in Eugene, Oregon
 Evaluation of a Combined Bicycle Lane/Right Turn Lane in Eugene, Oregon PUBLICATION NO. FHWA-RD-00-151 August 2000 U.S. Department of Transportation Federal Highway Administration Research and Development
EVALUATION OF A GREEN BIKE LANE WEAVING AREA IN ST. PETERSBURG, FLORIDA. William W. Hunter Senior Research Scientist
 EVALUATION OF A GREEN BIKE LANE WEAVING AREA IN ST. PETERSBURG, FLORIDA William W. Hunter Senior Research Scientist Raghavan Srinivasan Senior Transportation Research Engineer Carol A. Martell Senior Applications
TRANSPORTATION ANALYSIS REPORT US Route 6 Huron, Erie County, Ohio
 TRANSPORTATION ANALYSIS REPORT US Route 6 Huron, Erie County, Ohio December 12, 2012 Prepared for: The City of Huron 417 Main Huron, OH 44839 Providing Practical Experience Technical Excellence and Client
Defining Purpose and Need
 Advanced Design Flexibility Pilot Workshop Session 4 Jack Broz, PE, HR Green May 5-6, 2010 Defining Purpose and Need In your agency s project development process, when do design engineers typically get
Development of Arlington County s Marked Crosswalk Guidelines. Jon Lawler, P.E. Design Engineer Arlington County, VA
 Development of Arlington County s Marked Crosswalk Guidelines Jon Lawler, P.E. Design Engineer Arlington County, VA April 13, 2015 Transportation System Users Residents Estimated 215,000 in 2014 Lowest
1.3.4 CHARACTERISTICS OF CLASSIFICATIONS
 Geometric Design Guide for Canadian Roads 1.3.4 CHARACTERISTICS OF CLASSIFICATIONS The principal characteristics of each of the six groups of road classifications are described by the following figure
Pedestrian & Bicycle Safety Innovations & Applications
 Pedestrian & Bicycle Safety Innovations & Applications County Engineers Association of Maryland Spring, 2017 Conference May 25, 2017 George Branyan Pedestrian Program Coordinator District Department of
California Manual on Uniform Traffic Control Devices
 California Manual on Uniform Traffic Control Devices FHWA s MUTCD 2009 Edition as amended for use in California 2012 Edition State of California Business, Transportation and Housing Agency Department of
Development of Left-Turn Operations Guidelines at Signalized Intersections
 TxDOT 0-5840-1 http://itri.tsu.edu/reports/txdot_5840-r1.pdf Development of Left-Turn Operations Guidelines at Signalized Intersections August 2008 By Lei Yu, Ph.D., P.E., Yi Qi, Ph.D. Hongxi Yu Lei Guo
Rectangular Rapid Flashing Beacons
 Countermeasure Strategies for Pedestrian Safety Rectangular Rapid Flashing Beacons Mike Cynecki Lee Engineering November 5, 2015 Today s Presentation Introduction and housekeeping Audio issues? Dial into
CHAPTER 5 LITERATURE REVIEW
 CHAPTER 5 LITERATURE REVIEW This task includes identification of suitable pedestrian safety countermeasures for research at high pedestrian crash sites in high risk zones. Pedestrian Safety Countermeasures
Designing for Pedestrian Safety
 Designing for Pedestrian Safety Treatments at Unsignalized Pedestrian Crossings Presented by: Charlie Zegeer PBIC Director August 17, 2010 Crossing Crashes Part 1: General Principles 3 2 Why do people
Public Opinion, Traffic Performance, the Environment, and Safety After Construction of Double-Lane Roundabouts
 Public Opinion, Traffic Performance, the Environment, and Safety After Construction of Double-Lane Roundabouts TRB 93 rd Annual Meeting Washington, D.C. January 15, 2014 Wen Hu, Ph.D. Intersection crashes
REDUCING COLLISIONS AT HIGH CRASH LOCATIONS
 REDUCING COLLISIONS AT HIGH CRASH LOCATIONS Presented by Nazir Lalani P.E. Traffex Engineers Inc. N_lalani@hotmail.com ACCIDENTS AND SAFETY Why is safety important? Safety components Who is responsible?
SAFETY EFFECTIVENESS OF HIGH-SPEED EXPRESSWAY SIGNALS. Sponsored by the Iowa Department of Transportation Offi ce of Traffic and Safety
 SAFETY EFFECTIVENESS OF HIGH-SPEED EXPRESSWAY SIGNALS Sponsored by the Iowa Department of Transportation Offi ce of Traffic and Safety Final Report August 2005 Disclaimer Notice The opinions, findings,
Vision Zero: No more traffic deaths on Berkeley streets
 Vision Zero: No more traffic deaths on Berkeley streets Image courtesy of Fehr & Peers Farid Javandel, Transportation Division Manager Beth Thomas, Principal Planner, Transportation Division 1 Presentation
INTERSECTION CRASH COUNTERMEASURES
 INTERSECTION CRASH COUNTERMEASURES ALL SEVERE INTERSECTION (include gap CRASHES High Friction Surface Treatment - Intersection Markings - advanced acceptance and intersection approaches to intersections
Town of Orangetown Neighborhood Traffic Calming Program
 Town of Orangetown Neighborhood Traffic Calming Program Table of Contents I Introduction a. Purpose b. Key to successful projects c. What is Traffic Calming? II III IV V VI VII Definitions Street Classification
Draft North Industrial Area-Wide Traffic Plan
 Summary of North Industrial and Hudson Bay Industrial Recommended Improvements Table 1. Summary of s Item Location 1 2 3 4 5 6 7 8 9 10 11 12 Millar Ave north of 51st St Super 8 Motel back lane 400 Block
INSURANCE INSTITUTE FOR HIGHWAY SAFETY 1005 NORTH GLEBE ROAD ARLINGTON, VA PHONE 703/ FAX 703/
 Statement before the Virginia House of Delegates Militia, Police, and Public Safety Committee Red light violations and red light cameras Stephen L. Oesch INSURANCE INSTITUTE FOR HIGHWAY SAFETY 1005 NORTH
Alternative Treatments for At-Grade Pedestrian Crossings
 Alternative Treatments for At-Grade Pedestrian Crossings IN RESPONSE TO A GROWING NEED FOR BETTER INFORMATION ON PEDESTRIAN CROSSING TREATMENTS TO BE COMPILED INTO A SINGLE COMPREHENSIVE DOCUMENT, THE
Saturation Flow Rate, Start-Up Lost Time, and Capacity for Bicycles at Signalized Intersections
 Transportation Research Record 1852 105 Paper No. 03-4180 Saturation Flow Rate, Start-Up Lost Time, and Capacity for Bicycles at Signalized Intersections Winai Raksuntorn and Sarosh I. Khan A review of
A Traffic Operations Method for Assessing Automobile and Bicycle Shared Roadways
 A Traffic Operations Method for Assessing Automobile and Bicycle Shared Roadways A Thesis Proposal By James A. Robertson Submitted to the Office of Graduate Studies Texas A&M University in partial fulfillment
RANJIT PRASAD GODAVARTHY. B.Tech., NAGARJUNA UNIVERSITY, 2007 A THESIS. submitted in partial fulfillment of the requirements for the degree
 EFFECTIVENESS OF A PEDESTRIAN HYBRID BEACON AT MID-BLOCK PEDESTRIAN CROSSINGS IN DECREASING UNNECESSARY DELAY TO DRIVERS AND A COMPARISON TO OTHER SYSTEMS by RANJIT PRASAD GODAVARTHY B.Tech., NAGARJUNA
City of Albert Lea Policy and Procedure Manual 4.10 ALBERT LEA CROSSWALK POLICY
 4.10 ALBERT LEA CROSSWALK POLICY PURPOSE: Pedestrian crosswalks are an integral part of our transportation infrastructure. To be effective and promote safety, marked crosswalks must be installed after
Ohio Department of Transportation Edition of the OMUTCD It s Here!
 Ohio Department of Transportation John R. Kasich, Governor Jerry Wray, Director 2012 Edition of the OMUTCD It s Here! June 6, 2012 Here are reasons why we have a Manual of Uniform Traffic Control Devices
County of Greenville South Carolina. Traffic Calming Program Neighborhood Traffic Education Program and Speed Hump Program
 County of Greenville South Carolina Traffic Calming Program Neighborhood Traffic Education Program and Speed Hump Program (rev) August 2008 I. PURPOSE The potential negative impacts from vehicular traffic
2009 Manual on Uniform Traffic Control Devices
 2009 Manual on Uniform Traffic Control Devices Tori Brinkly, PE Highway Safety Engineer WFL-FHWA April 20, 2010 Paragraphs are numbered. Standard Statements are bolded. Guidance statements are italicized.
FEDERAL HIGHWAY ADMINISTRATION APPLICATION
 FEDERAL HIGHWAY ADMINISTRATION APPLICATION REQUEST FOR PERMISSION TO EXPERIMENT WITH A BICYCLE BOX INTERSECTION TREATMENT Submitted by: City of Columbus Department of Public Service Date: June 26, 2009
STATUS OF 2009 PEDESTRIAN MASTER PLAN (AS OF DECEMBER 2013)
") Appendix P.1 STATUS OF 2009 PEDESTRIAN MASTER PLAN (AS OF DECEMBER 2013) The 2009 Pedestrian Master Plan establishes 21 core recommendations in three goal areas to improve pedestrian transportation in
Appendix P.1 STATUS OF 2009 PEDESTRIAN MASTER PLAN (AS OF DECEMBER 2013) The 2009 Pedestrian Master Plan establishes 21 core recommendations in three goal areas to improve pedestrian transportation in
Title of the proposed project Development of a Toolbox for Evaluation and Identification of Urban Road Safety Improvement Measures
 Centre of Excellence (CoE) in Urban Transport Department of Civil Engineering, IIT Madras Title of the proposed project Development of a Toolbox for Evaluation and Identification of Urban Road Safety Improvement
Safety Corridors a Synthesis. Charlie Nemmers / Derek Vap University of Missouri
 Safety Corridors a Synthesis Charlie Nemmers / Derek Vap University of Missouri 1 Background: Safety Corridors Study Need grew from a four State Safety Summit Funding from Iowa, Kansas, Missouri DOTs and
Recently Developed Intersection CMFs. Nancy Lefler, VHB ATSIP Traffic Records Forum, 2014
 Recently Developed Intersection CMFs Nancy Lefler, VHB ATSIP Traffic Records Forum, 2014 Overview General Methodology Treatments Installation of traffic signals - with and without left-turn lanes (NCDOT)
Traffic Signal Warrant Analysis Report
 Traffic Signal Warrant Analysis Report US26: Springwater At-Grade Intersection key# 15773 US26 at SE 267 th Avenue (M.P. 16.24) and US26 at SE Stone Road (M.P. 16.77) Prepared by Katherine Carlos, E.I.
FLETCHER AVENUE PEDESTRIAN AND BICYCLIST BEHAVIOR CHANGE FORMATIVE RESEARCH PROJECT
 FLETCHER AVENUE PEDESTRIAN AND BICYCLIST BEHAVIOR CHANGE FORMATIVE RESEARCH PROJECT EXTENT OF CHANGES IN PEDESTRIAN AND BICYCLIST ATTITUDES AND BEHAVIORS DIRECTLY AFTER A COMPLETE STREETS PROJECT IN FLORIDA
Pedestrian Safety at Roundabouts
 Countermeasure Strategies for Pedestrian Safety Pedestrian Safety at Roundabouts Hillary Isebrands Federal Highway Administration January 6, 2016 Today s Presentation Introduction and housekeeping Audio
MEMORANDUM. Date: 9/13/2016. Citywide Crosswalk Policy
 MEMORANDUM Date: 9/13/2016 Re: Citywide Crosswalk Policy Foreword Through the s Circulation Element and Complete Streets Policy, it is the City s goal to promote walking trips and provide safe facilities
Pedestrians safety. ROAD SAFETY SEMINAR PIARC/AGEPAR/GRSP Lome, Togo October 2006 Lise Fournier, Canada-Qu
 Pedestrians safety ROAD SAFETY SEMINAR Lome, Togo October 2006 Lise Fournier, Canada-Qu Québec Contents WHO s data Risk factors Pedestrian needs Pedestrian facilities Conclusion Source: WHO WHO reports
DEFINITIONS Activity Area - Advance Warning Area Advance Warning Sign Spacing Advisory Speed Approach Sight Distance Attended Work Space
 DEFINITIONS Activity Area - that part of a TTC zone activity area where the work actually takes place. It consists of the work space, traffic space and one or more buffer spaces. Advance Warning Area -
Relationship of Road Lane Width to Safety for Urban and Suburban Arterials
 Relationship of Road Lane Width to Safety for Urban and Suburban Arterials Phd. Alma AFEZOLLI Polytechnic University of Tirana Construction and Infrastructure Department of Civil Engineering Faculty Tirana,
SCHOOL CROSSING PROTECTION CRITERIA
 CITY OF MADISON TRAFFIC ENGINEERING SCHOOL CROSSING PROTECTION CRITERIA January 2016 Adopted as Policy on August 31, 1976, by Common Council by Amended Resolution #29,540 Amended on September 14, 1976,
DPS 201 RECTANGULAR RAPID FLASHING BEACON (RRFB)
") DPS 201 RECTANGULAR RAPID FLASHING BEACON (RRFB) WHY? PEDESTRIANS NEED TO CROSS CASE STUDY: RRFB (ST. PETERSBURG, FL) St. Petersburg, FL Problem/Background Multi-lane, high-speed roadways Conflicts at
DPS 201 RECTANGULAR RAPID FLASHING BEACON (RRFB) WHY? PEDESTRIANS NEED TO CROSS CASE STUDY: RRFB (ST. PETERSBURG, FL) St. Petersburg, FL Problem/Background Multi-lane, high-speed roadways Conflicts at
Driver Behavior in the Presence of Pedestrians at Signalized Intersections Operating the Flashing Yellow Arrow
 Portland State University PDXScholar Civil and Environmental Engineering Faculty Publications and Presentations Civil and Environmental Engineering 2-2013 Driver Behavior in the Presence of Pedestrians
SCOPE Application, Design, Operations,
 SCOPE Application, Design, Operations, Maintenance, etc.: Typical Traffic Control Signals Pedestrian Hybrid Beacons Emergency Vehicle One-Lane/Two-Way Facilities, Freeway Entrance Ramps, and Movable Bridges