Curbing Cars: Shopping, Parking and Pedestrian Space in SoHo. Prepared for Transportation Alternatives. December 14, Schaller Consulting
|
|
|
- Stanley Dixon
- 6 years ago
- Views:
Transcription
 768-3487 schaller@schallerconsult.com www.")
1 Curbing Cars: Shopping, Parking and Pedestrian Space in SoHo Prepared for Transportation Alternatives December 14, 2006 Schaller Consulting 94 Windsor Place, Brooklyn, NY (718)
2 CURBING CARS 1 Summary This study examines the travel, shopping and spending patterns of visitors, residents and workers on Prince Street, a vibrant commercial street in the historic SoHo neighborhood of Manhattan. The study assesses how changes in the allocation of space between pedestrian, parking and street vendors would affect the attractiveness of Prince Street as a place to visit, live and work, and the likely effects on store and restaurant patronage. Results show that pedestrians experience frequent overcrowding on the sidewalks along Prince Street. Pedestrians interviewed say that Prince Street would be more attractive if more space were allocated to pedestrians, preferably by reducing the amount of space allocated to parking. These views are held by both visitors and residents. Based on interviews with over 1,000 drivers and pedestrians, the study finds that: People travel to Prince Street primarily by public transportation or nonmotorized modes. Overall, 54% of pedestrians interviewed on Prince Street came to the area by subway or bus and an additional 35% by walking or bicycle. Few people travel by private automobile; only 9% drove to the area in a private car. An additional 9% arrived by taxi or livery. Visitors come to Prince Street primarily to shop in the neighborhood s stores or eat in its restaurants. Few visit Prince Street with street vendors as their destination. 80% of people on Prince Street on Saturdays experience the street as very or somewhat crowded, as do 44% visiting on Fridays and 38% visiting on Tuesdays. Results are almost identical for visitors and those who work or live in the area. Expanding the amount of space for pedestrians is highly attractive to pedestrians interviewed. By a ratio of 5:1, expanding pedestrian space would attract people to come to Prince Street more often, even if that meant taking away space to park. Results are almost identical for visitors and those who work or live in the area. Reducing space for street vendors is less attractive than reducing space for parking. Visitors would come to Prince Street more often if there were more space for walking and fewer street vendors by a margin of only 1.4 to one, compared to 5:1 for reduced parking. Visitors who would come more often with a reallocation of space from parking to pedestrians spend about five times as much money in the neighborhood as do visitors who would come less often.
3 CURBING CARS 2 The presence of parking on Prince Street attracts a substantial amount of the traffic on the street. Over one-quarter of drivers interviewed while stopped at a red light were looking for parking. The major implication of the study is that Prince Street would be improved for visitors, residents and workers through an expansion of the space allocated to pedestrians. Doing so would relieve that current overcrowding on the sidewalks. Merchants would benefit as those who patronize the neighborhood s stores and restaurants would come more often, drawn by the reduced crowding on sidewalks. This increased patronage would offset by a five to one ratio any lost retail sales from those not coming due to reduced parking spaces. Creating more pedestrian space is healthy for business, and according to respondents in this study, the most attractive way to increase pedestrian space is to reduce parking on the street. While retailers often balk at proposals to limit vehicle access to the curbside in front of their stores, they are thrilled when business increases as a result. In cities around the world, retail districts similar to SoHo that have increased pedestrian space and reduced space dedicated to vehicles have realized commercial gains. As has recently been demonstrated on Oxford Street in London, even short-term restrictions to vehicles in shopping districts draw crowds of walking shoppers. Fulfilling this vision for SoHo entails event management and streetscape programming challenges. Residents, merchants, other stakeholders and the City should work together to identify the best means of reallocating space from parking to pedestrians, particularly with programming that reflects the district. With a long history of supporting artists, Prince Street could be closed to traffic from Broadway to West Broadway on a series of Saturdays to promote New York City artists. Business Improvement Districts such as the 34th Street Partnership and the Times Square Alliance have shown the benefits of creative event programming. A collaborative initiative by local stakeholders, elected officials, and city agencies responsible for the streets is critical to making the best use of this valuable public space.
4 CURBING CARS 3 Table of Contents Summary...1 Table of Contents...3 Purpose and Methodology...4 Background...5 Pedestrian Characteristics...9 Why People Visit...11 Transportation and Parking...13 Driving on Prince Street...15 Parked Vehicles...17 Street Environment...18 Appendix: Survey Forms...23
5 CURBING CARS 4 Purpose and Methodology This study examines the travel, shopping and spending patterns of visitors, residents and workers on Prince Street. The study assesses how changes in the allocation of space between pedestrian, parking and street vendors would affect the attractiveness of Prince Street as a place to visit, live and work, and the likely effects on store and restaurant patronage. The study gathered information on: Characteristics of pedestrians on Prince Street; Primary attractions of Prince Street to visitors, including the relative importance of street vendors, stores, restaurants and galleries; Modes of transportation used to travel to the area; Parking location of those driving to the neighborhood; Spending levels; Perceptions of the level of crowding; Reaction to changes in the use of the public space, e.g. reallocating the amount of space for pedestrians, street vendors and parking. Origins and destinations of motorists driving on Prince Street; Whether motorists are looking for parking; and Use of parking spaces on Prince Street in terms of vehicle turnover, commercial versus non-commercial vehicles; and overall number of vehicles parking on the street. Three surveys were conducted in order to obtain this information: Intercept interviews with pedestrians walking on Prince Street; Intercept interviews with drivers stopped at traffic signals on Prince Street; and An inventory of vehicles parked on the street. Data collection took place on Tuesdays and Fridays during the late afternoon and evening (approximately 4 p.m. to 8:30 p.m.), and on Saturday afternoons (approximately noon to 6 p.m.), between October 2005 and June The surveys thus capture differences due to seasonality as well as different times of the week. A total of 507 pedestrians and 515 drivers were interviewed and 1,510 parked vehicles were observed. See the appendix for survey forms used in the research. Data collection was conducted by Transportation Alternatives staff and volunteers, supervised by Matthew Roth, Wiley Norvell and Tresa Horney. Bruce Schaller, Principal of Schaller Consulting, designed the study methodology, oversaw the data collection and conducted the analysis.

6 CURBING CARS 5 Background Over the past quarter century, the SoHo neighborhood in Manhattan has changed from a declining manufacturing district to, initially, a vibrant community for artists and galleries, and then to a very attractive neighborhood of retail stores and restaurants mixed with residential spaces and galleries. Although millions of dollars have been invested in private spaces in SoHo, the streets in the neighborhood remain relatively little changed from their late-manufacturing days. Designated an historic district, SoHo still has quaint cobblestone streets. Most streets are one-way with one lane of through traffic. Curb lanes are generally open to unmetered parking in the evenings, overnight and on weekends. During weekday daytime hours, curb lane regulations are either no parking or truck loading. The study area consisted of a seven-block segment of Prince Street between Broadway and Sixth Avenue. (See Figure 1.) This area was selected due to its high level of retail activity and high pedestrian volumes. The street lies one block south and parallel to Houston Street, a major east-west avenue. On this corridor, Prince Street is a 3 lane street. Sidewalks vary in width depending on the size and extent of building stoops, sidewalk cafes, and subway entrances. Street furniture includes mailboxes, newspaper boxes, street lamps, parking signage posts, trees. With the presence of these objects and street vendor tables, there is space for no more than 3 to 4 people to walk or pass sideby-side in many places. Figure 1. Study area
7 CURBING CARS 6 Prince Street offers relatively upscale shopping and eating opportunities compared with the large, value-oriented stores on Broadway. The eastern five blocks of the Prince Street study area are a mix of brand-name stores, including a large Apple Computer store; apparel, cosmetic, jewelry and other shops; galleries; and restaurants and cafes. The western two to three blocks are primarily bodegas, bakeries and book and music stores that appear to cater to a relatively local clientele compared with the stores along the eastern segment of the street. Many of the buildings on Prince Street date from the 19 th century and include a number of cast iron buildings. Lower floors are primarily used as retail spaces; upper floors are primarily residential, their industrial spaces offering high-ceiled lofts that attracted artists and began the post-manufacturing development of the neighborhood. In addition to the Apple Computer store, Prince Street between Broadway and Sixth Avenue has: 16 apparel, shoe and hat stores 12 restaurants and cafes 10 jewelry, watch and handbag stores 6 galleries 4 cosmetics and perfume stores 3 grocery stores/bakeries 2 hair salons 2 houseware stores One copy center, realtor; bar; optician; toy store; stationary store; camera store; and furnishings store. Prince Street also has numerous street vendors, particularly in the late afternoon and evening and on weekends. Street vendors typically sell clothing and clothing accessories (handbags, jewelry, scarves, sweaters, hats, t-shirts, sunglasses) as well as books, photos, prints and novelty items such as small Buddhas. Food vendors are also present. The lively mix of shopping, restaurants and galleries along Prince Street attract sizeable crowds from throughout the metropolitan area as well as domestic and international visitors. Pedestrian volumes are highest on weekends but weekday late afternoon and evening time periods are also quite active, especially on Thursdays and Fridays. Traffic conditions range from highly congested on weekend afternoons to smoothly flowing traffic on weekend mornings and during some weekday days. Photographs on the next two pages show typical conditions on the street.

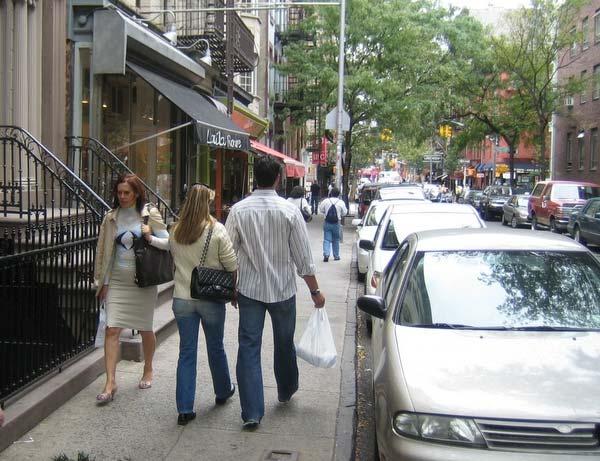
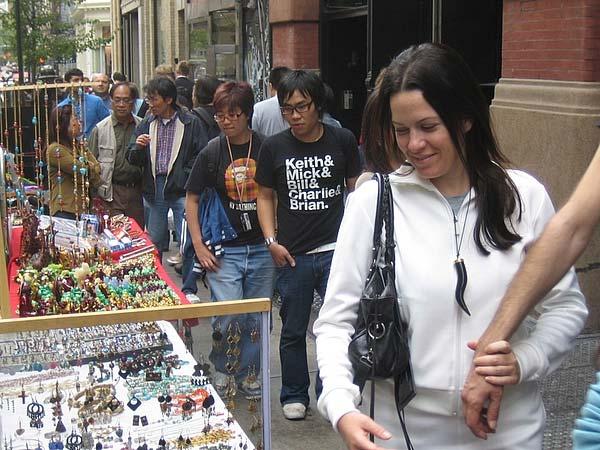
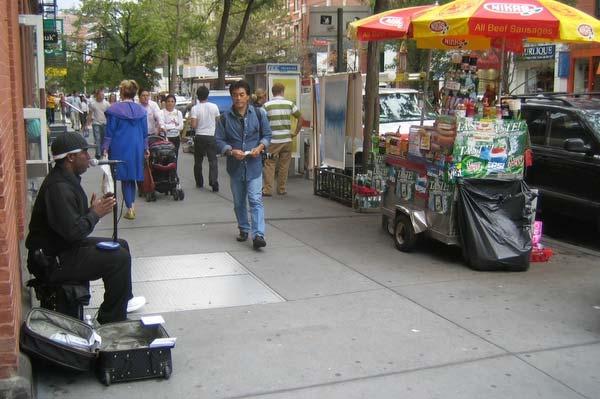
8 CURBING CARS 7

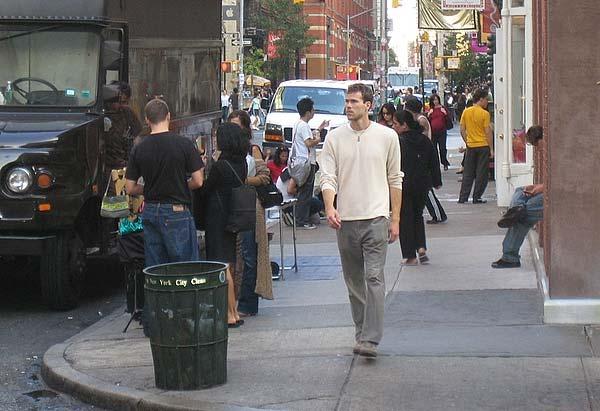
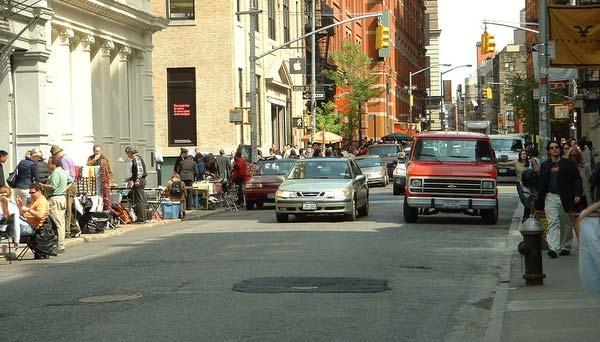
9 CURBING CARS 8
10 CURBING CARS 9 Pedestrian Characteristics The survey of pedestrians randomly stopped on Prince Street shows that most pedestrians are visitors who primarily live in the five boroughs and visit Prince Street several times a month. Place of residence Pedestrians live primarily in Manhattan or the other boroughs, although a significant number are out of town visitors. 48% of pedestrians interviewed live in Manhattan. One-third of Manhattan residents interviewed live in SoHo. 23% live in other New York City boroughs, primarily Brooklyn (13%) and Queens (8%). 7% live in the suburbs. 18% live outside the New York area. Most pedestrians interviewed were visiting Prince Street although about one-third live or work in the area. 70% were visiting the neighborhood (i.e., they neither lived nor worked in SoHo). 17% live in SoHo. 12% work in SoHo. As would be expected, visitors constitute a higher fraction of pedestrians on Saturday (81%) than on weekday late afternoon and evenings (62%). Frequency of visiting Most had visited Prince Street several times within the last month. 64% had visited at least once before over the previous month. Visitors averaged 4.9 visits in the past month, including the current visit. See Table 1 for detailed results.
11 Table 1. Pedestrian survey results for all respondents and by residence and workplace Place of residence TOTAL Visiting SoHo Live/ work in SoHo Manhattan Outerboroughs Suburbs Outside metro area N= (number of respondents) In SoHo n=507 n=356 n=151 n=245 n=118 n=35 n=93 Visiting today 70% 100% 0% 52% 79% 91% 98% Live in SoHo 17% 0% 58% 35% 0% 0% 0% Work in SoHo 12% 0% 42% 13% 20% 9% 2% Avg visits/month Q2 Past month n=500 n=353 n=147 n=242 n=115 n=35 n=92 Eaten in restaurants 68% 60% 87% 78% 57% 49% 63% Shopped in stores 74% 69% 85% 81% 74% 51% 67% Shopped/street vendors 36% 30% 51% 42% 34% 23% 28% Visited galleries 27% 22% 39% 33% 20% 26% 23% Walked around only 19% 18% 21% 19% 13% 17% 26% Other 4% 5% 3% 4% 4% 11% 1% Avg spending last month $ 376 $ 259 $ 647 $ 503 $ 274 $ 287 $ 216 Pct of total spending 100% 48% 51% 65% 17% 5% 11% In past month, spent money in: n=460 n=316 n=144 n=238 n=99 n=30 n=80 Restaurants/cafes/bars 56% 48% 72% 61% 49% 43% 51% Stores 61% 64% 54% 59% 61% 77% 65% Street vendors 8% 9% 6% 8% 9% 0% 13% Mode of travel n=493 n=354 n=139 n=232 n=118 n=35 n=92 Subway 51% 56% 40% 38% 74% 49% 53% Bus 2% 2% 1% 0% 2% 6% 3% Taxi/livery 9% 12% 3% 7% 4% 6% 22% Car 9% 10% 7% 5% 11% 43% 4% PATH/commuter train 1% 2% 0% 0% 0% 11% 1% Bicycle 5% 4% 6% 6% 7% 0% 0% Walk only 29% 21% 50% 48% 6% 0% 23% Specific destination n=500 n=351 n=149 n=241 n=116 n=35 n=92 Yes 66% 59% 85% 76% 69% 57% 46% Destination: Restaurant 15% 17% 10% 17% 16% 6% 12% Store 21% 25% 13% 21% 25% 17% 21% Street vendor 3% 3% 4% 4% 3% 0% 1% Gallery 2% 3% 1% 2% 1% 3% 2% Live in area 7% 1% 23% 15% 0% 0% 1% Work in area 9% 1% 28% 10% 15% 6% 1% Other 9% 10% 6% 9% 8% 17% 8% Expect to spend money in: Restaurants 39% 42% 32% 37% 36% 29% 47% Stores 46% 57% 21% 39% 51% 49% 64% Street vendors 13% 15% 7% 11% 15% 6% 17% Galleries (spend money or visit) 5% 6% 2% 3% 3% 9% 10% Not expecting to spend money 9% 8% 11% 10% 7% 11% 8% Prince St crowding n=505 n=355 n=150 n=245 n=117 n=35 n=92 Very crowded 19% 19% 19% 20% 17% 17% 16% Very/somewhat crowded 58% 61% 50% 56% 58% 63% 64% How often come to Prince St. if: More walk/less parking n=405 n=293 n=112 n=206 n=83 n=31 n=72 More often 42% 41% 45% 43% 48% 19% 38% Less often 8% 8% 6% 6% 6% 35% 3% More walk/fewer vendors n=495 n=346 n=149 n=244 n=114 n=35 n=89 More often 24% 22% 29% 32% 18% 23% 12% Less often 16% 16% 16% 15% 11% 6% 25% More vendors/less parking n=398 n=289 n=109 n=199 n=84 n=31 n=72 More often 24% 24% 24% 28% 21% 16% 18% Less often 18% 16% 21% 17% 12% 35% 17% More vendors/less walk n=493 n=346 n=147 n=240 n=114 n=34 n=91 More often 10% 10% 10% 10% 6% 18% 9% Less often 45% 45% 46% 47% 40% 32% 53%
12 CURBING CARS 11 Why People Visit Visitors come to Prince Street primarily to shop in stores and eat in the neighborhood s restaurants. Relatively few visitors are drawn primarily by street vendors or galleries, although they may shop with vendors or visit galleries during their trip. People who live and work in the area also heavily patronize SoHo stores and restaurants. Visitors Most people visiting Prince Street (i.e., do not live or work in the neighborhood) have a specific destination in mind and expect to spend money during their visit. 57% of visitors had a specific destination in mind 92% expected to spend money in the neighborhood on this visit. Eating and shopping The primary draws for visitors are eating and shopping opportunities. 25% of visitors had a specific store in mind for the trip. About one-third of these visitors were coming to the Apple computer store. Two-thirds of those destined for a specific store mentioned a total of 54 other establishments. 17% had a restaurant destination. 69% had shopped in stores in SoHo in the prior month and 60% had eaten in restaurants. 79% expected to spend money in stores and/or restaurants in SoHo on this visit. Street vendors Few visitors come to SoHo because of the street vendors, although some expect to shop with vendors. 3% of visitors interviewed on the street said that they had street vendors in mind as their destination for this trip. 30% had shopped with street vendors in the past month. 15% expected to spend money with street vendors during this visit. Galleries The neighborhood s remaining art galleries are not a major reason to visit the area among pedestrians interviewed on Prince Street. Only a few visitors planned to visit a gallery on this trip, though a substantial number had done so in the past month.
13 CURBING CARS 12 3% of visitors interviewed on the street said that they had galleries in mind as their destination for this trip. 22% had visited galleries in the past month. 6% expected to visit a gallery on this trip. Spending Visitors report substantial spending in SoHo shops, restaurants and other venues in the past month. The average visitor spent about $260 in the neighborhood in the past month. Visitors who primarily spent money in stores spent more money overall in the past month in SoHo ($365) than those who spending was primarily at restaurants (average of $165 in spending in SoHo in the past month). Residents and workers People who live or work in SoHo are naturally on Prince Street for those reasons, but they also take advantage of the restaurants, shopping and galleries in the neighborhood. 51% were destined for work or home when they were interviewed, while 13% were destined for a store and 10% for a restaurant. 87% had eaten in restaurants in SoHo in the past month. 85% had shopped in SoHo stores in the past month. 51% had shopped with street vendors and 39% had visited galleries. Residents and workers spent on average $650 in SoHo in the past month, primarily in restaurants. See Table 1 for detailed results.
14 CURBING CARS 13 Transportation and Parking Changes to the allocation of public space on Prince Street needs to take account of possible impacts on accessibility to visitors, residents and workers. The research thus examined transportation that people used to reach SoHo and current use of the right of way. Transit and walking predominate Most people on Prince Street either took public transportation or walked to reach the neighborhood. Fewer than one in ten arrived by car. Suburban residents are disproportionately likely to come by auto, but the majority of car users live in the five boroughs. 51% of pedestrians interviewed arrived by subway and an additional 2% by bus. 29% walked. 9% took a taxicab or livery. 9% arrived by auto. 5% arrived by bicycle. Visitors are somewhat more likely than those living and working in the neighborhood to arrive by public transportation. Residents and workers are more likely to arrive on foot than are visitors. Of suburban residents interviewed, 43% arrived by car. Because relatively few pedestrians interviewed live in the suburbs, however, suburban auto users comprise only about one-third of those driving to the area. Over one-half of those arriving by car live in New York City. Auto Use and Parking Among those arriving by car, 31% parked on Prince Street. Most of the others parked elsewhere in SoHo or nearby areas. See Table 2 for detailed results.
15 Table 2. Pedestrian survey results by access mode Mode to reach SoHo: Subway/b us Taxi/livery Car N In SoHo n=258 n=45 n=44 Visiting today 78% 91% 77% Live in SoHo 6% 2% 7% Work in SoHo 16% 7% 16% Avg visits/month Q2 Past month n=255 n=44 n=42 Eaten in restaurants 65% 82% 52% Shopped in stores 69% 75% 57% Shopped/street vendors 32% 39% 26% Visited galleries 22% 39% 26% Walked around only 15% 14% 21% Other 4% 0% 10% Avg spending last month $ 272 $ 459 $ 408 Pct of total spending 37% 11% 9% In past month, spent money in: n=230 n=44 n=37 Restaurants/cafes/bars 53% 64% 43% Stores 60% 61% 76% Street vendors 10% 11% 3% Mode of travel n=258 n=45 n=44 Subway 98% 9% 11% Bus 3% 0% 2% Taxi/livery 2% 100% 0% Car 2% 0% 100% PATH/commuter train 0% 0% 0% Bicycle 1% 2% 0% Walk only 3% 2% 0% Specific destination n=255 n=45 n=44 Yes 67% 62% 66% Destination: Restaurant 11% 29% 9% Store 21% 18% 27% Street vendor 4% 2% 0% Gallery 3% 0% 2% Live in area 4% 0% 7% Work in area 11% 2% 11% Other 9% 11% 11% Expect to spend money in: Restaurants 38% 58% 34% Stores 45% 51% 55% Street vendors 14% 16% 7% Galleries (spend money or visit) 5% 9% 7% Not expecting to spend money 7% 4% 14% Prince St crowding n=257 n=44 n=44 Very crowded 21% 9% 27% Very/somewhat crowded 58% 70% 73% How often come to Prince St. if: More walk/less parking n=200 n=36 n=35 More often 45% 47% 17% Less often 5% 6% 43% More walk/fewer vendors n=252 n=44 n=43 More often 24% 16% 16% Less often 17% 27% 7% More vendors/less parking n=195 n=37 n=35 More often 23% 22% 14% Less often 14% 16% 34% More vendors/less walk n=253 n=43 n=42 More often 10% 19% 14% Less often 45% 42% 36%

16 CURBING CARS 15 Driving on Prince Street The survey of drivers who were randomly approached while stopped at a traffic signal on Prince Street showed that about one-half the drivers are making local trips many of whom are looking for parking and the other one-half are making through trips. Nearly one-half of drivers interviewed on Prince Street are either looking for parking or making local trips: 28% are looking for parking. 19% have other origins and/or destinations within a few blocks of the study area (Area A in Figure 3). 18% of drivers were traveling to, from or between other locations in the area bounded by 14 th Street, Worth Street, the East River and Hudson River (Area B in Figure 2). 24% of drivers are making through trips (not involving origins or destinations between 14 th Street and Worth Street). The remaining 11% did not provide sufficient origin and destination information to classify their trips. As would be expected, there are more through trips on Fridays and more drivers looking for parking on Saturdays: Driver origins and destinations on Tuesday afternoon/evenings are close to the overall averages. Friday afternoon/evenings show relatively more through trips (34%) and fewer drivers looking for parking (18%). Figure 3. Definition of local and area trips Saturdays show more drivers looking for parking (41%) and fewer with through trips. See Table 3 for detailed results.
17 CURBING CARS 16 Table 3. Motorist survey - origin and destination Day interviewed Total Tue Fri Sat Looking for parking 28% 20% 18% 41% Immediate area* 19% 20% 18% 19% Surrounding area* 18% 19% 21% 15% Through traffic* 24% 19% 34% 21% Unknown 11% 22% 9% 4% Total 100% 100% 100% 100% Number of respondents *Trips are grouped as follows: Immediate area = trips with origin or destination in the area bounded by Houston, Varick, Broome and Lafayette. Surrounding area = trips with origin or destination elsewhere between Worth St. and 14 St between the East River and Hudson River. Through traffic = trips with neither origin nor destination between Worth St. and 14 St.
18 CURBING CARS 17 Parked Vehicles The survey of parked vehicles showed that most vehicles parked on Prince Street are privately owned and are parked for one to three hours. Parked vehicles are primarily private cars (as opposed to commercial vehicles). 93% of parked vehicles observed had standard (non-commercial) license plates. Two-thirds were sedans; most of the rest were SUVs or minivans. 6% had commercial plates or standard plates and commercial lettering on the vehicle. Most were vans, trucks or SUVs. 86% of vehicles had New York State license plates; most of the remainder has New Jersey or Connecticut license plates. A moderate level of turnover means that 100 to 300 vehicles are parked on Prince Street per day. 100 unique vehicles were observed on average on weeknights. 330 unique vehicles were observed on average on Saturdays. Vehicles that arrived and departed on weeknights between 6 p.m. and 9 p.m. were parked for an average of about 1 hour. (This does not count vehicles that were parked overnight.) Vehicles that arrived and departed on Saturdays between early afternoon and the evening were parked for an average of about 2.6 hours. (This does not count vehicles that were parked into the late evening or overnight.)
19 CURBING CARS 18 Street Environment People interviewed on Prince Street view the street as crowded. This is particularly the case on Saturdays but is also true during the late afternoon and evening on weeknights. Crowding affects the attractiveness of Prince Street as a place to visit, shop and eat. Visitors, residents and workers would come to Prince Street more often if there were more room to walk. By a ratio of 5:1, expanding pedestrian space would attract people to come to Prince Street more often, even if that meant taking away space to park, than would come less often. An analysis of spending patterns shows that increasing space for walking and reducing parking spaces would benefit restaurants and store owners. Visitors who would come more often with the more pedestrian space and less parking spend more than four times as much as compared with those who would come less often. Crowding Four-fifths of people interviewed on Prince Street on Saturdays rated the street as crowded, as did over one-third of those interviewed during the week. Visitors, residents and workers all view the street as crowded. Those who expect to spend money in stores and restaurants are more likely to view the street as crowded compared with those intending simply to walk around, or who are in route to home or work. On Saturdays, 80% of pedestrians interviewed rate Prince Street as either very crowded (31%) or somewhat crowded (49%). On Fridays, 44% said the street was very or somewhat crowded. On Tuesdays, 38% said the street was very or somewhat crowded. For the three days combined, 70% of those expecting to spend money in stores viewed the street as crowded, as did 59% of those expecting to spend money in restaurants, compared with 48% who were not expecting to spend money in stores or restaurants. Reallocation of space toward pedestrian uses A series of questions asked pedestrians whether they would visit Prince Street more often, less often or about the same under each of several scenarios involving changes in the allocation of public space. The scenarios were: More room to walk and less parking. More room to walk and fewer street vendors. More street vendors and less parking. More street vendors and less room to walk.
20 CURBING CARS 19 Strong attraction of additional pedestrian space Overall, respondents would be most influenced by changes in the amount of pedestrian space. Pedestrians are a great deal more likely to visit Prince Street if parking is reduced in favor of pedestrian space. Results are mixed if the number of street vendors is reduced in favor of space for pedestrians. 42% of pedestrians interviewed said they would come to Prince Street more often if there were more room to walk and less parking, compared to 8% who would come less often. Conversely, 45% would come less often if there were more street vendors and less room to walk while 10% would come more often. The other scenarios yielded a fairly mixed response; 24% would come more often if there were more room to walk and fewer street vendors versus 16% who would come less often. 24% would come more often if there were more vendors and less parking versus 18% who would come less often. Results are similar for visitors, residents and workers. See Figure 4. Figure 4. Response to changes in pedestrian, vendor and parking space allotments 50% Pct. of respondents 45% 40% 35% 30% 25% 20% 15% Come more often Come less often 10% 5% 0% More walking/less parking More walk/fewer vendors More vendors/less parking More vendors/less walk Option
21 CURBING CARS 20 Impact on spending Those who spend money at stores and restaurants are overwhelmingly more likely to visit more often with an expansion of pedestrian space, with few indicating that they would visit less often. Increasing the amount of pedestrian space is thus likely to benefit financially shop and restaurant owners. 42% of those who have shopped in stores in the past month are likely to visit more in the more walking/less parking scenario compared with 7% who would visit less often. 46% of those who have eaten in restaurants in the past month are likely to visit more in the more walking/less parking scenario compared with 8% who would visit less often. Results are similar for those expecting to spend money in stores or eat in a restaurant on this visit. Based on their self-reported spending in SoHo in the past month, it can be estimated that 38% of current spending is by people who would come more often if there were more pedestrian space/less parking, while only 8% of spending is by people who would come less often. The one group that would come less often is people who come by auto: 17% would come more often and 43% less often under the more pedestrian space/less parking scenario. Those who come by auto and say they would come less often in the more pedestrian space/less parking scenario represent 4% of total spending. See Tables 1, 4 and 5 for detailed results.
22 Table 4. Pedestrian survey results by where expecting to spend money and survey day Expect to spend money in SoHo today at: Gallery (spend/ visit) Survey day: Neither stores/ restaur't Tuesday Friday Saturday Restaurant Store N In SoHo n=197 n=232 n=64 n=158 n=163 n=126 n=215 Visiting today 76% 86% 83% 47% 61% 63% 81% Live in SoHo 15% 9% 5% 29% 25% 18% 12% Work in SoHo 10% 5% 13% 23% 14% 18% 7% Avg visits/month Q2 Past month n=197 n=231 n=64 n=152 n=159 n=123 n=215 Eaten in restaurants 82% 57% 53% 71% 65% 83% 61% Shopped in stores 68% 84% 75% 68% 72% 72% 76% Shopped/street vendors 35% 36% 70% 39% 31% 30% 43% Visited galleries 27% 25% 23% 36% 26% 28% 28% Walked around only 25% 22% 30% 13% 10% 16% 27% Other 4% 3% 6% 5% 4% 2% 5% Avg spending last month $ 391 $ 365 $ 301 $ 380 $ 405 $ 398 $ 344 Pct of total spending 40% 44% 10% 0% 35% 26% 39% In past month, spent money in: n=185 n=212 n=59 n=138 n=142 n=114 n=201 Restaurants/cafes/bars 76% 37% 44% 63% 54% 69% 50% Stores 46% 79% 59% 58% 64% 46% 67% Street vendors 8% 8% 31% 11% 8% 3% 12% Mode of travel n=194 n=230 n=64 n=149 n=153 n=124 n=213 Subway 50% 50% 55% 50% 49% 56% 51% Bus 1% 1% 2% 3% 2% 1% 2% Taxi/livery 13% 10% 11% 6% 8% 9% 10% Car 8% 10% 5% 9% 9% 7% 8% PATH/commuter train 2% 2% 0% 1% 1% 0% 2% Bicycle 5% 6% 9% 3% 5% 4% 5% Walk only 29% 28% 27% 32% 29% 26% 31% Specific destination n=196 n=232 n=63 n=152 n=160 n=126 n=211 Yes 65% 55% 51% 74% 74% 79% 54% Destination: Restaurant 39% 5% 6% 0% 12% 31% 9% Store 10% 46% 14% 0% 23% 12% 26% Street vendor 6% 1% 25% 1% 3% 1% 5% Gallery 2% 2% 3% 4% 2% 2% 2% Live in area 5% 2% 3% 16% 13% 8% 3% Work in area 6% 3% 6% 22% 12% 10% 6% Other 4% 3% 3% 21% 9% 13% 6% Expect to spend money in: Restaurants 101% 34% 68% 0% 24% 51% 44% Stores 41% 100% 71% 0% 39% 26% 64% Street vendors 22% 19% 102% 3% 6% 2% 25% Galleries (spend money or visit) 9% 8% 24% 4% 6% 3% 6% Not expecting to spend money 18% 8% 3% Prince St crowding n=196 n=231 n=64 n=157 n=162 n=125 n=215 Very crowded 21% 23% 25% 16% 13% 7% 31% Very/somewhat crowded 59% 70% 75% 48% 38% 44% 80% How often come to Prince St. if: More walk/less parking n=170 n=188 n=57 n=119 n=100 n=96 n=207 More often 45% 43% 40% 39% 39% 40% 45% Less often 8% 7% 5% 8% 9% 10% 5% More walk/fewer vendors n=188 n=223 n=60 n=157 n=162 n=126 n=205 More often 22% 22% 17% 29% 28% 23% 22% Less often 20% 13% 32% 15% 9% 17% 21% More vendors/less parking n=167 n=184 n=55 n=117 n=98 n=96 n=202 More often 23% 25% 36% 22% 17% 21% 29% Less often 17% 14% 9% 23% 22% 16% 16% More vendors/less walk n=189 n=224 n=59 n=156 n=160 n=125 n=206 More often 12% 8% 19% 10% 8% 14% 10% Less often 46% 46% 41% 49% 45% 38% 51%
23 Table 5. Pedestrian survey results for how often visit if more room to walk and less parking How often visit: More About same Less Total N In SoHo Visiting today 41% 51% 8% 100% 293 Live in SoHo 41% 53% 5% 100% 75 Work in SoHo 51% 41% 8% 100% 37 Avg visits/month Q2 Past month Eaten in restaurants 46% 46% 8% 100% 274 Shopped in stores 42% 52% 7% 100% 297 Shopped/street vendors 46% 46% 8% 100% 153 Visited galleries 43% 51% 5% 100% 113 Walked around only 31% 62% 7% 100% 84 Other Not reported due to small sample Avg spending last month $ 337 $ 404 $ 413 Pct of total spending 38% 54% 8% 100% 400 In past month, spent money in: Restaurants/cafes/bars 46% 48% 6% 100% 210 Stores 40% 53% 7% 100% 229 Street vendors 47% 44% 9% 100% 32 Mode of travel Subway 45% 50% 5% 100% 197 Bus Not reported due to small sample Taxi/livery 47% 47% 6% 100% 36 Car 17% 40% 43% 100% 35 PATH/commuter train Not reported due to small sample Bicycle Not reported due to small sample Walk only 44% 50% 6% 100% 125 Specific destination Yes 42% 50% 8% 100% 254 Destination: Restaurant 39% 50% 11% 100% 66 Store 42% 52% 6% 100% 83 Street vendor Not reported due to small sample Gallery Not reported due to small sample Live in area 41% 53% 6% 100% 32 Work in area 45% 45% 10% 100% 31 Other 38% 44% 19% 100% 32 Expect to spend money in: Restaurants 45% 47% 8% 100% 170 Stores 43% 51% 7% 100% 188 Street vendors 40% 54% 5% 100% 57 Galleries (spend money or visit) Not reported due to small sample Not expecting to spend money Not reported due to small sample Prince St crowding Very crowded 44% 48% 8% 100% 84 Very/somewhat crowded 41% 51% 8% 100% 244 How often come to Prince St. if: More walk/less parking More often 100% 0% 0% 100% 171 Less often 0% 0% 100% 100% 31 More walk/fewer vendors More often 62% 32% 6% 100% 97 Less often 62% 31% 8% 100% 65 More vendors/less parking More often 73% 24% 3% 100% 93 Less often 42% 38% 20% 100% 69 More vendors/less walk More often 54% 31% 14% 100% 35 Less often 54% 39% 6% 100% 202
24 CURBING CARS 23 Appendix: Survey Forms
25 SoHo/Prince Street Pedestrian Survey Hi! I m and we are conducting a short survey about SoHo for the SoHo Alliance and Transportation Alternatives. The survey will take about 2 minutes will you help us with the survey? 1. In the past month, how many days have you visited SoHo? [1] 8 or more days [2] 5-7 days [3] 2-4 days [4] Today is only day in past month [5] Live in SoHo [6] Work in SoHo 2. In the past month, have you (check all that apply) [A] Eaten in restaurants in SoHo [B] Shopped in stores [C] Shopped at street vendors [D] Visited galleries [E] Walked around only [F] Other: 3. About how much have you spent in SoHo in the past month? [1] Less than $25 [2] $25-99 [3] $ [4] $ [5] $1,000 or more 4. Did you mostly spend money in? [Check multiple choices if about the same spending for rest/stores/street vendors] [A] Restaurants/cafés/bars [B] Stores [C] Street vendors 5. Did you travel to SoHo today by (Check all that apply) [A] Subway [B] Bus [C] Taxi/livery [D] Car: Where did you park? [intersection:] [E] PATH or commuter train [F] Bicycle [G] Walk [check other modes for persons who live outside Manhattan] 6. In coming here today, did you have a specific destination in mind? [1] Yes [2] No (skip to Q. 8) 7. What was that destination? [A] Restaurant [B] Store [name:] [C] Street vendor [type:] [D] Gallery [E] Live in the area [F] Work in the area [G] Other: [If Q.7 is answered, skip to Q.9] 8. When you came to SoHo today, did you think you might spend any money in (check all that apply) [A] Restaurants [B] Stores [C] Street vendors [D] Galleries [E] Not expecting to spend money on Prince Street today 9. Now, about Prince Street specifically, would you say that Prince Street today is [1] Very crowded [2] Somewhat crowded [3] Not very crowded [4] Not at all crowded
26 Now I m going to give you several hypothetical situations and ask whether in each situation you would come to Prince Street more often, less often or about the same. 10. First, if Prince Street had: More street vendors, and Less room to walk Would you come to Prince Street [A] More often [B] Less often [C] About the same 11. If Prince Street had: More street vendors, and Less parking Would you come to Prince Street [7] More often [8] Less often [9] About the same 12. If Prince Street had: More room to walk, and Fewer street vendors Would you come to Prince Street [4] More often [5] Less often [6] About the same 13. If Prince Street had: More room to walk, and Less parking Would you come to Prince Street [1] More often [2] Less often [3] About the same 14. What is your home zip code? 15. How could Prince Street be made a more attractive place for visiting and shopping? Thank you for participating in this survey! Date: October, 2005 Time: : p.m. Nearest cross street:
27 Prince Street Driver Survey Hi! I m and we are conducting a short survey about traffic in this area for the SoHo Alliance and Transportation Alternatives. It s just 3 questions. 1. What borough or county did you begin this trip? [1] Bronx [2] Brooklyn [3] Manhattan [4] Queens [5] Staten Island [6] Nassau [7] Suffolk [8] Westchester [9] New Jersey [10] Other: 2. [If trip started in Manhattan:] What is the closest intersection to the start of the trip? 3. What is the closest intersection to your destination? [1] Destination is outside Manhattan 4. [If destination is in the area:] Are you currently looking for parking? [1] Yes [2] No Thank you for participating in this survey! Survey staff name: Date: October, 2005 Time: : p.m. Nearest cross street:
28 Prince Street Parking Survey Block between: Date: October 2005 and: North Side South Side TIME: Veh position: h cell, record: Type of vehicle: Example Place horizontal arrow in box License plate number S = sedan ABC 123 if same vehicle as previous Pax [or] commercial plate M = minivan pax; Y; S observation If commercial lettering on v U = SUV V = Van T = Truck
Benefits for the Bronx, Brooklyn, Queens and Staten Island
 Congestion Pricing for New York: Benefits for the Bronx, Brooklyn, and Staten Island Prepared for the Coalition for Traffic Relief April 007 Schaller Consulting 94 Windsor Place, Brooklyn, NY (78) 768-3487
COLUMBUS AVENUE NEIGHBORHOOD TRANSPORTATION STUDY
 COLUMBUS AVENUE NEIGHBORHOOD TRANSPORTATION STUDY Pedestrian Survey Findings Survey Main Findings: Transit and walking are the main two modes used by both visitors and residents of the area, regardless
EAST VILLAGE SHOPPERS STUDY A SNAPSHOT OF TRAVEL AND SPENDING PATTERNS OF RESIDENTS AND VISITORS IN THE EAST VILLAGE
 EAST VILLAGE SHOPPERS STUDY A SNAPSHOT OF TRAVEL AND SPENDING PATTERNS OF RESIDENTS AND VISITORS IN THE EAST VILLAGE CONTENTS 2 4 5 6 7 16 17 19 SUMMARY INTRODUCTION BACKGROUND METHODOLOGY RESULTS CONCLUSION
Transportation Issues Poll for New York City
 2016-17 Transportation Issues Poll for New York City 82% support Vision Zero and reducing traffic deaths 72% on average, support more street space for children to play, protected bike lanes and other safety
Data Analysis February to March Identified safety needs from reported collisions and existing travel patterns.
 Welcome! Thank you for participating in today s Valencia Bikeway Improvements workshop. Data Analysis February to March Identified safety needs from reported collisions and existing travel patterns. Initial
Tunnel Reconstruction Brooklyn CB 1 August 14, 2018
 Tunnel Reconstruction Brooklyn CB 1 August 14, 2018 Reconstructing the Tunnel 2 Service During Tunnel Reconstruction April 2019 through July 2020 3 Projected Cross River Travel Paths of Customers The Service
Tunnel Reconstruction South 5 th Street Association October 16, 2018
 Tunnel Reconstruction South 5 th Street Association October 16, 2018 Reconstructing the Tunnel 2 Service During Tunnel Reconstruction April 2019 through July 2020 3 Projected Cross River Travel Paths of
City of Novi Non-Motorized Master Plan 2011 Executive Summary
 City of Novi Non-Motorized Master Plan 2011 Executive Summary Prepared by: February 28, 2011 Why Plan? Encouraging healthy, active lifestyles through pathway and sidewalk connectivity has been a focus
Set of plans containing details for game day operations of the Ballpark. Plans set forth the responsibilities and the specific actions of:
 What is the TOPP? Set of plans containing details for game day operations of the Ballpark. Plans set forth the responsibilities and the specific actions of: Ballpark management, District Department of
ITS-NY ANNUAL MEETING Bus Rapid Transit in New York City: Bus Lane Operations on One-Way Arterial Streets
 ITS-NY ANNUAL MEETING Bus Rapid Transit in New York City: Bus Lane Operations on One-Way Arterial Streets June 9, 2011 Ted Orosz AICP, Director Long Range Bus Planning MTA New York City Transit 1 Overview
EUCLID AVENUE PARKING STUDY CITY OF SYRACUSE, ONONDAGA COUNTY, NEW YORK
 EUCLID AVENUE PARKING STUDY CITY OF SYRACUSE, ONONDAGA COUNTY, NEW YORK CITY OF SYRACUSE DEPARTMENT OF PUBLIC WORKS 1200 CANAL STREET EXTENSION SYRACUSE, NEW YORK 13210 DRAFT REPORT DATE: November 13,
El Paso County 2040 Major Transportation Corridors Plan
 El Paso County 2040 Major Transportation Corridors Plan Connect-our-County Online Transportation User Survey Preliminary Results June 24, 2010 Years of Residence 2. How many years have you LIVED HERE?
Modal Shift in the Boulder Valley 1990 to 2009
 Modal Shift in the Boulder Valley 1990 to 2009 May 2010 Prepared for the City of Boulder by National Research Center, Inc. 3005 30th Street Boulder, CO 80301 (303) 444-7863 www.n-r-c.com Table of Contents
Table #6 VISION CHARACTERISTICS
 Table #6 VISION White Flint is a place to live, work, play, shop, and walk with sufficient density to encourage quality redevelopment. Vibrant streets and consistent streetscapes are important. CHARACTERISTICS
Outreach Approach RENEW SF served as the primary liaison with the North Beach community; the Chinatown. Executive Summary
 Executive Summary Executive Summary The Columbus Avenue Neighborhood Transportation Study s objective is to identify changes to transportation infrastructure and policies that could enhance the livability
6.0 PEDESTRIAN AND BICYCLE FACILITIES 6.1 INTRODUCTION 6.2 BICYCLE DEMAND AND SUITABILITY Bicycle Demand
 6.0 PEDESTRIAN AND BICYCLE FACILITIES 6.1 INTRODUCTION Bicycle and pedestrian travel along and in the vicinity of the corridor is part of the vision of Somerset and Hunterdon counties and the integrated
Cherry Creek Transportation and Land Use Forum September 25, 2013 Meeting Summary
 Cherry Creek Transportation and Land Use Forum September 25, 2013 Meeting Summary I. LEAD-IN TO SMALL GROUP DISCUSSION, POLLING AND STEERING COMMITTEE/TECHNICAL TASK FORCE DISCUSSION The meeting began
1999 On-Board Sacramento Regional Transit District Survey
 SACOG-00-009 1999 On-Board Sacramento Regional Transit District Survey June 2000 Sacramento Area Council of Governments 1999 On-Board Sacramento Regional Transit District Survey June 2000 Table of Contents
CITY OF ALPHARETTA DOWNTOWN MASTER PLAN TRAFFIC EVALUATION
 CITY OF ALPHARETTA DOWNTOWN MASTER PLAN TRAFFIC EVALUATION June 2015 CITY OF ALPHARETTA DOWNTOWN MASTER PLAN TRAFFIC EVALUATION Introduction The Alpharetta Downtown Master Plan was developed in the fall
Southern California Walking/Biking Research And Creative Evaluation
 Southern California Walking/Biking Research And Creative Evaluation Quantitative Research Topline Report December 7, 2015 Background & Objectives The Southern California Association of Governments (SCAG)
SETTINGS AND OPPORTUNITIES MOBILITY & ACCESS
 7 mobility & access how do people use el camino what is it like to drive on el camino/to park along el camino what is the pedestrian experience like what is the role of transit along the corridor what
Notes to Benefit-Cost Analysis
 Executive Summary Project Matrix Current Status/ Problem to Be Addressed University Avenue not user friendly or safe for cars, pedestrians, bicyclists, or bus riders. Notes to Benefit-Cost Analysis Change
Chapter 5 Future Transportation
 Chapter 5 Future Transportation The Future Land Use Plan identifies the desired land use designations. The land uses desired for Crozet depend, in large part, on the success of the transportation system,
Downtown Tampa Parking User Survey
 Downtown Tampa Parking User Survey 2017 Introduction This Downtown Tampa Parking User Survey was commissioned by the Tampa Downtown Partnership and carried out by Plan Hillsborough. The survey was overseen
APPENDIX H EXISTING TRAFFIC CONDITIONS ANALYSIS
 APPENDIX H EXISTING TRAFFIC CONDITIONS ANALYSIS MEMO : Peter Steacy, P.Eng. Date: December 3, 2014 : Ian Borsuk, P.Eng. Job No.: 3414015-000 Subject: City of Ottawa O-Train Extension Planning & EA Study
NYC Pedestrian Safety Study & Action Plan. NYTMC Brown Bag Lunch Presentation December 15, 2010
 NYC Pedestrian Safety Study & Action Plan NYTMC Brown Bag Lunch Presentation December 15, 2010 1 Introduction DOT Safety Goal Strategic Plan: Reduce Fatalities by 50% by 2030 From 274 (2007) to 137 (2030)
Guidelines for Providing Access to Public Transportation Stations APPENDIX C TRANSIT STATION ACCESS PLANNING TOOL INSTRUCTIONS
 APPENDIX C TRANSIT STATION ACCESS PLANNING TOOL INSTRUCTIONS Transit Station Access Planning Tool Instructions Page C-1 Revised Final Report September 2011 TRANSIT STATION ACCESS PLANNING TOOL INSTRUCTIONS
Grove Hall Business District Parking Analysis
 Grove Hall Business District Parking Analysis February 2014 Prepared for The Roxbury Great Neighborhoods Partnership Nuestra Comunidad Development Corporation Dudley Square Main Streets Greater Grove Hall
Fordham Plaza. Conceptual Design Study
 Fordham Plaza Conceptual Design Study WASHINGTON AVE. N Project Scope Timeline Urban Design Transportation Economics/Market Research A Multi-Disciplinary Study Based on meetings and interviews with Stakeholders:
WELCOME. Purpose of the Open House. Update you on the project. Present a draft recommended plan. Receive your input
 WELCOME Purpose of the Open House The Town of Smiths Falls has initiated the Beckwith Street Redevelopment Plan that includes the preparation of a streetscape functional design for the renewal of Beckwith
Purpose and Need. Chapter Introduction. 2.2 Project Purpose and Need Project Purpose Project Need
 Chapter 2 Purpose and Need 2.1 Introduction The El Camino Real Bus Rapid Transit (BRT) Project (Project) would make transit and other transportation improvements along a 17.6-mile segment of the El Camino
Downtown London Member Survey Regarding BRT. May 8, 2017
 Downtown London Member Survey Regarding BRT May 8, 2017 Table Of Contents 1 Description of the Research 3 Objectives 4 Methodology Profile of Respondents 5 6 2 Summary 9 3 Detailed Results Unaided Opinion
TRANSPORTATION & MOBILITY
 TRANSPORTATION & MOBILITY ROADWAY SYSTEM There are approximately 40 miles of roadways in Manitou Springs. For planning purposes, roadways are typically assigned a functional classification which defines
ABOUT THIS STUDY The Tenderloin-Little Saigon Community-Based Transportation Plan
 ABOUT THIS STUDY The Tenderloin-Little Saigon Community-Based Transportation Plan The Greater Tenderloin Community Study Milestones October Community based organizations (Tenderloin Housing Clinic and
PRINCE GEORGE S PLAZA METRO AREA PEDESTRIAN PLAN
 PRINCE GEORGE S PLAZA METRO AREA PEDESTRIAN PLAN May 28, 2008 Agenda Welcome and introductions Project overview and issue identification Planning context and strengths Design challenges and initial recommendations
Eliminate on-street parking where it will allow for a dedicated bus only lane %
 Traffic Dashboard Priorities Survey Responses Introduction 1) Are you familiar with bus rapid transit (BRT)? a. No, BRT is new to me. 597 23.5% b. I ve heard of BRT, but I don t know much about it. 1,136
Berkeley Strategic Transportation Plan A-76
 Berkeley Strategic Transportation Plan A-76 Appendices 1. A Team Effort 2. Where We ve Been A-11 Berkeley Strategic Transportation Plan Alameda County Transportation Plan Alameda County will be served
Pocatello Regional Transit Master Transit Plan Draft Recommendations
 Pocatello Regional Transit Master Transit Plan Draft Recommendations Presentation Outline 1. 2. 3. 4. What is the Master Transit Plan? An overview of the study Where Are We Today? Key take-aways from existing
OLDER PEDESTRIANS AT RISK
 OLDER PEDESTRIANS AT RISK A TEN-YEAR SURVEY AND A LOOK AHEAD August 0 The population of older adults is growing in the U.S. and in the tri-state region. According to AARP, one in three Americans is now
EXECUTIVE SUMMARY: TRANSIT-ORIENTED DEVELOPMENT IN SMITHS FALLS, ONTARIO; A COMPARISON BETWEEN TWO SITES
 EECUTIVE SUMMARY: TRANSIT-ORIENTED DEVELOPMENT IN SMITHS FALLS, ONTARIO; A COMPARISON BETWEEN TWO SITES Topic and Purpose In 2007, the Mayor of Ottawa s Task Force on Transportation suggested adding a
Mainstreet Master Plan Land Use
 Mainstreet Master Plan 04 Land Use Top Recommendations Active Uses: Promote active ground-floor uses such as retail, restaurants, galleries and personal services with interactive storefronts for Mainstreet
MTA Surveys: Facts and Findings. NYMTC Brown Bag March 12, 2014 Julia Seltzer, MTA Planning
 MTA Surveys: Facts and Findings NYMTC Brown Bag March 12, 2014 Julia Seltzer, MTA Planning MTA Planning Survey Program Why survey? Who was surveyed? Challenges Methodologies Findings Uses for data 1 Why
5/7/2013 VIA . RE: University Village Safeway Expansion (P13-019)
") 5/7/2013 VIA EMAIL David Hung, Associate Planner Community Development Department, Current Planning Division City of Sacramento 300 Richards Boulevard, 3 rd Floor Sacramento, CA 95811 RE: University Village
5/7/2013 VIA EMAIL David Hung, Associate Planner Community Development Department, Current Planning Division City of Sacramento 300 Richards Boulevard, 3 rd Floor Sacramento, CA 95811 RE: University Village
Public Opinion about Transportation Issues in Northern Virginia A Report Prepared for the:
 Public Opinion about Transportation Issues in Northern Virginia A Report Prepared for the: Northern Virginia Transportation Authority By QSA Research & Strategy October 13, 2005 TABLE OF CONTENTS Page
EXECUTIVE SUMMARY. A Executive Summary
 EXECUTIVE SUMMARY The Monroe Avenue Parking and Mobility Study was initiated to provide a comprehensive assessment of existing parking and mobility conditions along the Monroe Avenue corridor from the
Physical Implications of Complete Streets Policies
 Presentation Overview Physical Implications of Complete Norm Cox, ASLA, LLA Landscape Architect Ann Arbor, Michigan, 10:45 to Noon What Are Complete Streets? What Matters to Bicyclists and Pedestrians
CITY OF OAKLAND. 27th Street Bikeway Feasibility and Design. Final Report (v3) March 23, Kimley-Horn and Associates, Inc.
 March 23, Kimley-Horn and Associates, Inc.") CITY OF OAKLAND 27th Street Bikeway Feasibility and Design Final Report (v3) March 23, 2007 PREPARED BY: Kimley-Horn and Associates, Inc. Table of Contents 1. Introduction 3 2. 27 th Street/Bay Place Corridor
CITY OF OAKLAND 27th Street Bikeway Feasibility and Design Final Report (v3) March 23, 2007 PREPARED BY: Kimley-Horn and Associates, Inc. Table of Contents 1. Introduction 3 2. 27 th Street/Bay Place Corridor
Agenda. Overview PRINCE GEORGE S PLAZA METRO AREA PEDESTRIAN PLAN
 PRINCE GEORGE S PLAZA METRO AREA PEDESTRIAN PLAN May 28, 2008 Agenda Welcome and introductions Project overview and issue identification Planning context and strengths Design challenges and initial recommendations
Magnolia Place. Traffic Impact Analysis. Prepared for: City of San Mateo. Prepared by: Hexagon Transportation Consultants, Inc.
 Magnolia Place Traffic Impact Analysis Prepared for: City of San Mateo Prepared by: Hexagon Transportation Consultants, Inc. Updated January 4, 2010 Table of Contents 1. Introduction...1 2. Existing Conditions...6
NACTO Designing Cities Conference Project Evaluation: Tools for Measuring Success and Building Support. October 29, 2015
 NACTO Designing Cities Conference Project Evaluation: Tools for Measuring Success and Building Support October 29, 2015 The case for evaluation: Have a social contract with City Council, staff and community
Bikeway action plan. Bicycle Friendly Community Workshop March 5, 2007 Rochester, MN
 Bikeway action plan Summary The was held on March 5, 2007 at the Rochester Mayo Civic Center. The workshop was hosted by Rochester-Olmsted County Planning Department in collaboration with the League of
Bellevue Downtown Association Downtown Bike Series
 Bellevue Downtown Association Downtown Bike Series Meeting 2 Franz Loewenherz Andreas Piller Kyle Potuzak Chris Long October 26, 2017 Today s Agenda: 1) Meeting Purpose 2) 9/28 Meeting Recap 3) Candidate
West Capitol Avenue Road Rehabilitation and Safety Enhancement Project
 West Capitol Avenue Road Rehabilitation and Safety Enhancement Project Stakeholder Focus Group Meeting #2 Tuesday, August 28, 2018 7:00 8:00 a.m. West Sacramento City Hall 1110 West Capitol Avenue, West
Goodlettsville Bicycle and Pedestrian Plan Executive Summary
 Goodlettsville Bicycle and Pedestrian Plan July 2010 In Cooperation with the Nashville Area Metropolitan Planning Executive Organization Summary Introduction Progressive and forward thinking communities
CAMPUS PARKING STUDY Analysis and Alternatives Executive Summary
 S A L E M S T A T E U N I V E R S I T Y CAMPUS PARKING STUDY Analysis and Alternatives Executive Summary M a y 2 2 0 1 8 C a m p u s C o m m u n i t y S S U N e i g h b o r h o o d A d v i s o r y C o
Converting On-Street Parking to Active Transportation in Toronto: Two Studies of Merchant and Patron Preferences
 Converting On-Street Parking to Active Transportation in Toronto: Two Studies of Merchant and Patron Preferences Author Nancy Smith Lea, Toronto Coalition for Active Transportation, Clean Air Partnership
Better Market Street Project Update. Urban Forestry Council September 17, 2014
 Better Market Street Project Update Urban Forestry Council September 17, 2014 Project Area Limits Better Market Street Schedule Market Street City s busiest transit corridor Over 85 buses per hour 14 surface
NEIGHBORHOOD TRAFFIC CALMING POLICY
 NEIGHBORHOOD TRAFFIC CALMING POLICY I. PURPOSE The City of Kent continually strives to strengthen and protect its neighborhoods by improving the quality of life in residential areas. Traffic conditions
WALK- AND bike-friendly TURLOCK
 WALK- AND bike-friendly TURLOCK Ideas to Encourage Walking and Biking Benefits to the COMMUNITY Get Connected People who walk and bike have many more opportunities for casual interactions with friends
THIS PAGE LEFT BLANK INTENTIONALLY
 GA SR 25 Spur at Canal Road Transportation Impact Analysis PREPARED FOR GLYNN COUNTY, GEORGIA 1725 Reynolds Street, Suite 300 Brunswick, Georgia 31520 PREPARED BY 217 Arrowhead Boulevard Suite 26 Jonesboro,
FONTAINE AVENUE STUDY Final Report
 FONTAINE AVENUE STUDY Final Report March 28, 2005 FONTAINE AVENUE STUDY City of Charlottesville March 28, 2005 Renaissance Planning Group Kenneth Schwartz, FAIA, AICP Director of Design Leigh Wilkerson,
Multimodal Through Corridors and Placemaking Corridors
 68 Multimodal Through Corridors and Placemaking Corridors Corridors have different functions in a region. Some corridors are used to get smoothly and rapidly through a region or to get quickly to major
summary of issues and opportunities
 1 summary of issues and opportunities EXECUTIVE SUMMARY CHAPTER 2: HISTORY - 3: LAND USE This first chapter is an overview of lessons learned from analysis of the existing conditions on El Camino as well
APPENDIX D. BICYCLE AND PEDESTRIAN AWARENESS SURVEY (Completed by Zogby International)
") APPENDIX D BICYCLE AND PEDESTRIAN AWARENESS SURVEY (Completed by Zogby International) Residents Views On Bicycling, Walking, and Jogging In Onondaga County Submitted to: Danielle Zebley Syracuse Metropolitan
APPENDIX D BICYCLE AND PEDESTRIAN AWARENESS SURVEY (Completed by Zogby International) Residents Views On Bicycling, Walking, and Jogging In Onondaga County Submitted to: Danielle Zebley Syracuse Metropolitan
4 DISRUPTION MANAGEMENT PLAN HIGHWAY 7 RAPIDWAY CONSTRUCTION BETWEEN BAYVIEW AVENUE AND WARDEN AVENUE TOWNS OF MARKHAM AND RICHMOND HILL
 4 DISRUPTION MANAGEMENT PLAN HIGHWAY 7 RAPIDWAY CONSTRUCTION BETWEEN BAYVIEW AVENUE AND WARDEN AVENUE TOWNS OF MARKHAM AND RICHMOND HILL The Transportation Services Committee recommends the adoption of
WILMAPCO Public Opinion Survey Summary of Results
 Wilmington Area Planning Council WILMAPCO Public Opinion Survey Summary of Results Prepared by: 2955 Valmont Road, Suite 300 Boulder, Colorado 80301 t: 303-444-7863 f: 303-444-1145 www.n-r-c.com Table
Main-McVay Transit Study: Phase 2 Options Definition and High Level Constraints Evaluation
 Main-McVay Transit Study: Phase 2 Options Definition and High Level Constraints Evaluation APRIL 2016 A collaborative study between: For Additional Information or to Comment If you would like additional
Capital and Strategic Planning Committee. Item III - B. April 12, WMATA s Transit-Oriented Development Objectives
 Capital and Strategic Planning Committee Item III - B April 12, 2018 WMATA s Transit-Oriented Development Objectives Page 24 of 76 Washington Metropolitan Area Transit Authority Board Action/Information
HYATTSVILLE TRANSPORTATION PLAN. City Council Update March 19, 2018
 HYATTSVILLE TRANSPORTATION PLAN City Council Update March 19, 2018 AGENDA PROJECT GOALS DATA COLLECTION WHAT WE LEARNED NEXT STEPS PROJECT GOALS Identify bicycle and pedestrian needs of the city Evaluate
The Impact of Placemaking Attributes on Home Prices in the Midwest United States
 The Impact of Placemaking Attributes on Home Prices in the Midwest United States 2 0 1 3 C O N S T R U C T E D E N V I R O N M E N T C O N F E R E N C E M A R Y B E T H G R A E B E R T M I C H I G A N
TRAFFIC IMPACT ANALYSIS
 TRAFFIC IMPACT ANALYSIS FOR THE CHAMPAIGN UNIT#4 SCHOOL DISTRICT PROPOSED HIGH SCHOOL (SPALDING PARK SITE) IN THE CITY OF CHAMPAIGN Final Report Champaign Urbana Urbanized Area Transportation Study 6/24/2014
STONY PLAIN ROAD STREETSCAPE
 Jasper Place Revitalization Strategy: Vision The people involved in the Jasper Place Revitalization Strategy envision: Goal 1: Feeling safe in our community Create a community where feeling safe is common--where
South Terrace Pedestrian Safety and Streetscape Improvement: Community Engagement Summary
 SUMMARY This report provides a summary of the results of the City of Fremantle s community engagement on the proposed traffic and streetscape improvements to South Terrace, between Sydney Street and Little
WALKNBIKE DRAFT PLAN NASHVILLE, TENNESSEE EXECUTIVE SUMMARY NASHVILLE, TENNESSEE
 NASHVILLE, TENNESSEE EXECUTIVE SUMMARY Executive Summary A world-class multi-modal transportation system is essential to a vibrant city and better quality of life. -Mayor Barry The WalknBike plan aims
METROPOLITAN TRANSPORTATION PLAN OUTREACH: INTERACTIVE MAP SUMMARY REPORT- 10/03/14
 METROPOLITAN TRANSPORTATION PLAN OUTREACH: INTERACTIVE MAP SUMMARY REPORT- 10/03/14 INTRODUCTION This document summarizes the results of the online interactive mapping exercise implemented by MIG for the
A Selection Approach for BRT Parking Lots Nicolls Road Corridor Parking Study
 A Selection Approach for BRT Parking Lots Nicolls Road Corridor Parking Study Chirantan Kansara, P.E. Engineering Construction Design Planning 2018 ITE Northeastern District Annual Meeting Lake George,
PEDALING FORWARD. A Glance at the SFMTA s Bike Program for SFMTA.COM
 PEDALING FORWARD A Glance at the SFMTA s Bike Program for 2017-2021 SFMTA.COM INTRODUCTION About This Booklet More people from all walks of life see their bicycle as a more convenient way to get where
CITY OF BLOOMINGTON COMPLETE STREETS POLICY
 CITY OF BLOOMINGTON COMPLETE STREETS POLICY POLICY OBJECTIVE: The City of Bloomington will enhance safety, mobility, accessibility and convenience for transportation network users of all ages and abilities,
Los Angeles District 4 Data Analysis Report
 Los Angeles District 4 Data Analysis Report January 218 Dixon Resources Unlimited Commissioned by: Los Angeles District 4 Council Office Table of Contents Introduction 4 Project Background 4 Data Collection:
CITY OF NEW ORLEANS. Department of Public Works. Baronne Street Bike Lane
 CITY OF NEW ORLEANS Department of Public Works Baronne Street Bike Lane 9/17/2014 Agenda Welcome Greg Lawson, Office of Neighborhood Engagement Introduction - Deputy Mayor Andy Kopplin, Chief Administrative
Centennial Neighbourhoods Transportation Management Plan Summary of Phase 1 Consultation. Overview of Issues
 1 Centennial Neighbourhoods Transportation Management Plan Summary of Phase 1 Consultation The Centennial Neighbourhoods Transportation Management Plan (CNTMP) is being undertaken to support the Secondary
US 41 COMPLETE STREETS CORRIDOR PLANNING STUDY from University Parkway to Whitfield Avenue
 41 US 41 COMPLETE STREETS CORRIDOR PLANNING STUDY from University Parkway to Whitfield Avenue EXECUTIVE SUMMARY DRAFT FEBRUARY 2019 Project Overview The US 41 Complete Streets Corridor Planning Study,
Designing Streets for Transit. Presentation to NACTO Designing Cities Kevin O Malley Managing Deputy Commissioner 10/24/2014
 Designing Streets for Transit Presentation to NACTO Designing Cities Kevin O Malley Managing Deputy Commissioner 10/24/2014 Chicago -- Streets for Transit TODAY Jeffery Jump Transit Signal Priority Central
2016 Capital Bikeshare Member Survey Report
 2016 Capital Bikeshare Member Survey Report Prepared by: LDA Consulting Washington, DC 20015 (202) 548-0205 February 24, 2017 EXECUTIVE SUMMARY Overview This report presents the results of the November
ALLEY 24 TRAFFIC STUDY
 ALLEY 24 TRAFFIC STUDY in City of Frostburg, Maryland January 2013 3566 Teays Valley Road Hurricane, WV Office: (304) 397-5508 www.denniscorporation.com Alley 24 Traffic Study January 2013 Frostburg, Maryland
Community Task Force July 25, 2017
 Community Task Force July 25, 2017 Welcome and Introductions Project Partners Regional Transportation District (RTD) Colorado Department of Transportation (CDOT) Denver Regional Council of Governments
! Bedford Ave. 1. BEDFORD AVENUE STATION
 SUBWAY-SIDEWALK INTERFACE PROJECT. STATION. LOCATION The Bedford Avenue subway station provides access to the L train on the Canarsie Line in North Brooklyn. Located on North 7 th Street between Bedford
Transportation Trends, Conditions and Issues. Regional Transportation Plan 2030
 Transportation Trends, Conditions and Issues Regional Transportation Plan 2030 23 Regional Transportation Plan 2030 24 Travel Characteristics Why Do People Travel? Over one-half of trips taken in Dane
Complete Street Analysis of a Road Diet: Orange Grove Boulevard, Pasadena, CA
 Complete Street Analysis of a Road Diet: Orange Grove Boulevard, Pasadena, CA Aaron Elias, Bill Cisco Abstract As part of evaluating the feasibility of a road diet on Orange Grove Boulevard in Pasadena,
ITE Northeastern District Meeting
 West Hartford Road Diet and Safety Study ITE Northeastern District Meeting Session 2A Complete Streets May 22, 2018 North Main St. - Classified as a principal arterial But provides high levels of access
Neighborhood Pedestrian Safety and Traffic Calming Study
 Neighborhood Pedestrian Safety and Traffic Calming Study for the area bounded by Foster Avenue, Bedford Avenue, Farragut Road and Ocean Avenue Flatbush, Brooklyn, New York prepared by Michael King, miking@trafficcalmer.com
City of Seattle Edward B. Murray, Mayor
 City of Seattle Edward B. Murray, Mayor Department of Transportation Scott Kubly, Director Eastlake Community Council 117 E Louisa St. #1 Seattle, WA 98102-3278 January 28, 2016 RE: Roosevelt to Downtown
Perryville TOD and Greenway Plan
 Perryville TOD and Greenway Plan Greenway Glossary Pathway: A bicycle and pedestrian path separated from motorized vehicular traffic by an open space, barrier or curb. Multi-use paths may be within the
Southview Blvd & 3 rd Avenue Improvement Project. Public Open House December 4, to 7pm
 Southview Blvd & 3 rd Avenue Improvement Project Public Open House December 4, 2014 5 to 7pm Southview Blvd & 3 rd Avenue Public Information Meeting Agenda Presentation 5:30 to 6:15 pm Purpose of Project
Vision: Traditional hamlet with an attractive business/pedestrian friendly main street connected to adjacent walkable neighborhoods
 N D. Focus Area II Vision: Traditional hamlet with an attractive business/pedestrian friendly main street connected to adjacent walkable neighborhoods Transit Road Focus Area II is located in the Hamlet
VISTA 2025 Goal 1: Maintain and enhance quality of place as a key component of economic health. Goal 1 Team Meeting. April 20, 2017.
 VISTA 2025 Goal 1: Maintain and enhance quality of place as a key component of economic health Goal 1 Team Meeting April 20, 2017 Meeting Notes Team Members Attending: W. Boulton Alexander, Nancy Corson,
9/25/2018. Multi-Modal Level of Service (MMLOS) Bianca Popescu, Transportation Planner
 Bianca Popescu, Transportation Planner") Multi-Modal Level of Service (MMLOS) Bianca Popescu, Transportation Planner 1 What is MMLOS? Is this a nice place to walk? Is this a nice place to bike? Is transit convenient? Bottom line - Are there options
Multi-Modal Level of Service (MMLOS) Bianca Popescu, Transportation Planner 1 What is MMLOS? Is this a nice place to walk? Is this a nice place to bike? Is transit convenient? Bottom line - Are there options
Urban planners have invested a lot of energy in the idea of transit-oriented
 DOES TRANSIT-ORIENTED DEVELOPMENT NEED THE TRANSIT? D A N I E L G. C H AT M A N Urban planners have invested a lot of energy in the idea of transit-oriented developments (TODs). Developing dense housing
APPENDIX A. Outreach Summary
 APPENDIX A Outreach Summary COUNTYWIDE TRANSPORTATION PLAN Summary of Public Outreach and Engagement To gather an understanding of the transportation issues and priorities throughout the county, and inform