Blue Mile, Blue Sound and Stepping Stones to Nature: An Exploration of their Impact. Final Report. October 2010 SERIO
|
|
|
- Roland O’Connor’
- 6 years ago
- Views:
Transcription


1 Blue Mile, Blue Sound and Stepping Stones to Nature: An Exploration of their Impact Final Report October 2010 SERIO A University of Plymouth Centre of Expertise SERIO, Research and Enterprise 3 rd Floor Nancy Astor Building, University of Plymouth, Drake Circus, Plymouth, Devon, PL4 8AA Tel: serio@plymouth.ac.uk Fax: Website: Socio-economic Research and Intelligence Observatory.
2 Executive Summary Introduction Three projects with the aim of increasing public engagement with the environment were launched in Plymouth in 2010: Blue Mile, Blue Sound and Stepping Stones to Nature. The Blue Mile Race for Environment is a new UK mass participation open water event and the inaugural event took place in Plymouth on the 3 rd and 4 th of July The Blue Sound and Stepping Stones to Nature are funded by the Big Lottery to work with local communities to improve their opportunities to access the blue and green environment. In 2010 SERIO, based at the University of Plymouth, was commissioned to develop a monitoring system for assessing the impact and achievements of these projects. As part this assignment, SERIO carried out a socio-economic and environmental impact assessment of the Blue Mile event. Research Aims and Approach A bespoke toolkit was developed, to enable each project to monitor its impacts and achievements throughout its lifetime. The research included the following elements: Street Survey A semi-structured face to face street survey was carried out during the Blue Mile to assess the socio-economic and environmental impact of the event. A total of 206 interviews were completed over the two days. Open Spaces Survey This incorporated a pre and post event survey to collect views on and uses of outdoor open spaces to be completed by participants of each project before and after their participation in a project specific event. A total of 44 pre-event surveys were completed via an online survey amongst registered participants in the Blue Mile, while a subsection of key questions were administered to 123 Blue Mile visitors during the two day event through the street survey. Key Findings from the Blue Mile Event Of the 206 respondents, 53.4% were male and 46.6% were female. The majority were at the Blue Mile event in an adult pair (42.2%). Reflecting the different activities provided during the two days, Saturday saw a larger proportion of groups without children (25.2%) and single adults (15.9%), while a higher proportion of groups with children were present on Sunday (32.3%). Consistent with other studies undertaken for Plymouth events, the Blue Mile catered to a relatively local audience, with the largest proportion of the sample (72.3%) living within the Plymouth Travel to Work Area (PTTWA). Of those living outside the PTTWA, 7.8% lived in the rest of Devon and Cornwall and the Socio-economic Research and Intelligence Observatory i.
3 remaining 19.9% came from beyond Devon and Cornwall, with the majority having visited the city before. Travelling by car was the most common way to arrive at the event (57.8%), while 29.1% indicated they travelled by foot and 11.7% by bus. Three quarters of respondents had travelled six miles or less to arrive at the event. Three-fifths (58.7%) of respondents stated they had visited Plymouth specifically for the Blue Mile, with a quarter (25.2%) indicating that they were repeat visitors to the Blue Mile, planning to visit, or having visited on both days. Awareness of the event was good, with 70.4% of respondents having heard of the Blue Mile before attending. Word of mouth was the most common means for finding out about the event (cited by 34.5%). In addition, information on the event was gained from a range of news and advertising media, such as newspapers, radio and posters. A media coverage evaluation undertaken by the event organisers indicated that there was a good spread of regional coverage about the Blue Mile between February and July The Blue Mile official website was accessed by 16,216 visitors over that period. Despite this, a quarter of respondents highlighted the need to improve communication and marketing strategies, making suggestions for better timing and more widespread publicity both at a local level and throughout the region. The research shows that levels of involvement in the event were high, especially amongst male respondents and groups with children. Overall, 63.1% of respondents indicated they visited the Event Village or took part in one or more activities provided by the event over the two days. Nearly one fifth of respondents (18.0%) also indicated that they had registered to complete a Blue Mile. Positively, the large majority had not experienced any barriers when accessing activities. It is also evident that the majority of those attending the Blue Mile had a positive experience. Almost all rated the event as either extremely good or quite good (92.2%) and considered it to be child and family friendly to some extent. Further to this, the large majority of respondents (70.9%) indicated that they would be likely to complete a Blue Mile if the event was repeated in the future. Findings suggest that the Blue Mile had a positive impact on participants and visitors views and awareness of the environment and environmental issues. Over three-fifths of respondents indicated that attending the event had had a positive impact on their awareness of the blue environment and made them more aware of threats facing the marine environment. In addition, over half of respondents indicated that attending the event would have a positive impact on how they look after the planet and lead to an increase in their engagement with the natural environment. Positively, young people (aged 16-25) emerged as the age group who generally felt more strongly that their attendance at the Blue Mile would impact positively on their future behaviour. Respondents were also overwhelmingly positive about the impact of the event on the community and local area, with the large majority agreeing to some extent Socio-economic Research and Intelligence Observatory ii.
4 that attracting events like the Blue Mile was good for the image of Plymouth (98.5%) and helped to bring the local community together (83.5%). These positive views and perceptions of the event were supported by feedback from exhibitors and competitors, as collected and analysed by the event organisers. Results from a short questionnaire administered to 11 exhibitors showed that exhibitors had a positive overall impression of the event and rated the general organisation of the event positively. Overall, consistent with visitors perceptions, the majority of exhibitors felt that the event was successful to some extent in raising awareness and action for the environment. Positively, nine of the 11 respondents indicated they would be interested in exhibiting again next year. Similarly, of 30 competitors that completed a questionnaire administered by the event organisers after their participation in the Blue Mile, the majority reported to be very satisfied with their experience of the event and rated the event as extremely good. These views were reflected in positive ratings for the registration process, the event location and its impact on the surroundings. For example, all respondents agreed to some extent that Plymouth was a perfect place to host the Blue Mile 2010 and the majority of respondents did not feel that the event had a negative impact on city pollution and traffic issues. Almost all respondents would take part in the Blue Mile again, with a number feeling they would participate in additional event activities and races. Economic Impact: Visitors Expenditure at the Blue Mile in Plymouth Given the sporting nature of the Blue Mile, the UK Sport approach was proposed as a useful model for assessing the economic impact of the event. However, the nature of the visitors to the Blue Mile, in that they were mostly local, and the variety of activities provided by the event raised methodological difficulties in applying the UK Sport methodology and called for an adaptation of it to be applied. While no distinction between types of visitor (spectators, participants, media) was made, filters were applied to ensure that expenditure estimations were based upon respondents who were present at the venue because of the Blue Mile. Using this approach, the total average spend per head for travel, food and drink, accommodation, shopping and tickets for events and tourist attractions was calculated and multiplied by the total number of visitors, as recorded by the event organisers. Two potential scenarios for total visitor numbers were identified, with 5,645 people representing the lower limit and 6,636 people representing the upper limit. As a result, it was estimated that Blue Mile visitors generated between 115,111 and 135,300 in expenditure in Plymouth. This equated to a visitor economic impact of between 57,555 and 67,650 per day. In interpreting the economic impact of the Blue Mile, the following aspects are worthy of consideration. Firstly, accommodation expenditure, which tends to be one of the most significant components of an economic impact, was very low, due to the low number of respondents visiting from outside the local area, and Socio-economic Research and Intelligence Observatory iii.
5 this had repercussions on the total expenditure. Secondly, aspects such as the provision of different activities between the two days, with races held on one day only, potential limitations in advertising the event beyond the local area, and poor weather conditions on the Sunday, might have limited the number of visitors taking part in the event to some extent, limiting in turn the extent of the economic impact. Finally, the robustness of the overall estimate depends upon the accuracy of the estimated number of visitors and the methodology applied for its assessment. Although visitor numbers were monitored by the event organisers, the event was not ticketed, which rendered it difficult to estimate overall attendance. In addition, including the actual spend incurred by local people in the calculations made, it is difficult to distinguish between the expenditure directly attributable to the event and that which would have occurred regardless of this. Environmental Impact: Visitors Carbon Footprint at The Blue Mile in Plymouth Assessing the environmental impact of an event or a project is becoming increasingly relevant, in light of issues associated with climate change and its potential policy and economic implications in the future. An initial assessment of the Blue Mile environmental impact was therefore carried out, based upon an estimate of the greenhouse gases emissions (carbon footprint) as a result of visitors travelling to the event. By applying Defra s transport conversion factors to the number of miles respondents to the street survey had travelled by car, bus, train, taxi or ferry to attend the event, it was estimated that Blue Mile visitors generated between 14, kg CO 2 and 17, kg CO 2 in total, equating to 2.63 Kg Co 2 per head. These findings must be interpreted with a number of caveats. Firstly, they rely on the accuracy of the estimated number of miles visitors stated they travelled to the event, as well as the estimated number of people attending the event. In addition, they only provide a partial understanding of the overall environmental impact. A full life cycle analysis incorporating all potential sources of greenhouse gases, such as waste management and energy use, would be required to provide a comprehensive environmental impact assessment; however this was beyond the scope of the evaluation. Key Findings from the Open Spaces Survey Key findings from the Open Spaces pre-event survey showed that green and blue spaces in the city of Plymouth and in the surrounding area were frequented regularly and positively appreciated. More than 60% of respondents strongly believed that local open spaces were important to them and the same proportion did not feel that Plymouth could make more of its natural environment. Overall, the coast and water emerged as the most frequented open spaces. When it came to name specific open spaces respondents visited most frequently, the Hoe and the waterfront area, along with Central park and the Barbican were Socio-economic Research and Intelligence Observatory iv.
6 the most popular within Plymouth, while Dartmoor was the most cited destination in the surrounding area. When asked about the reasons for visiting these open spaces, respondents reported they went there to enjoy the surroundings, get some fresh air and relax. A lack of time was perceived as the main barrier to visiting green or blue open spaces more frequently both in the city (41.0%) and in the surrounding area (74.4%). In addition, a few respondents mentioned accessibility issues as major factors preventing them from visiting open spaces in Plymouth (6.0%) or in the surrounding area (14.0%). Respondents reported they would be encouraged to visit open spaces more often if there were more organised activities in the city of Plymouth and better parking facilities and transport. Improvements in information and better public transport were considered relevant encouraging factors for visiting open spaces in the surrounding area of Plymouth. Interestingly, these aspects appear to be consistent with the projects main purposes and therefore suggest key elements towards which all projects could work effectively. In terms of attitudes and engagement with the environment, key findings from the survey suggest that respondents were aware and committed to actions that would help to reduce their environmental impact, such as energy saving, controlled water use, recycling. In interpreting this, it is worth highlighting that cultural and sports events, as well as projects engaging with the community, tend to induce an upstream selection of participants, based upon their prior interest and involvement in the event contents. Conclusions and Recommendations Findings from the street survey suggest that the Blue Mile event was successful in engaging visitors with the blue environment and had a positive impact on visitors views and awareness of the environment and environmental issues. Reflecting this in relation to future Blue Mile events, the following points should be considered: The event is advertised further afield and in a more thorough way, continuing to use mainstream media and the internet to target people from beyond the local area and young age groups more effectively. Consideration should be given to the opportunity of broadening the Event Village, providing more varied entertainment and planning a wider range of races on both days to attract a wider public and more paying participants. Thought should be given to adopting more robust methods for counting visitors in the future, using for instance a free ticket at the entrance of the Event Village, to ensure a more accurate estimate of visitor numbers and thus a more robust economic impact assessment. Socio-economic Research and Intelligence Observatory v.
7 Consideration should be given to adopting a more comprehensive monitoring system for assessing the environmental impact, based on the concept of a full life cycle analysis, to ensure the events sustainability. This could be used as part of the marketing strategy in promoting a zero carbon Blue Mile. Findings from the Open Spaces pre-event survey provided useful insights on respondents attitudes towards local open spaces and highlighted practical aspects that would encourage people to visit open spaces more frequently, towards which all projects could work effectively. Socio-economic Research and Intelligence Observatory vi.
8 Contents Page Section One: Introduction Background to the Study Research Aims and Approach Street Survey Open Spaces Survey Structure of the Report 4 Section Two: Key Findings from the Blue Mile Event Respondent Profile Purpose and Method of Visit to the City Awareness of and Involvement in the Blue Mile Views on the Blue Mile Impact of Blue Mile The Blue Mile Event Village: Exhibitors Feedback The Blue Mile Event: Competitors Feedback The Blue Mile Event: Summary of Media Coverage 22 Section Three: Economic Impact: Visitors Expenditure at the 23 Blue Mile in Plymouth 3.1 Introduction Calculations Average Expenditure Per Head The Total Average Expenditure Discussion 27 Section Four: Environmental Impact: Visitors Carbon Footprint at 29 The Blue Mile in Plymouth 4.1 Introduction Visitors Carbon Footprint Calculations Total Greenhouse Gas Emissions The Total Average Visitor Greenhouse Gas Emissions Discussion 32 Section Five: Key findings from the Open Spaces Survey Respondent Profile Outside Open Spaces in Plymouth and the Surrounding Area Most Frequented Open Spaces Barriers and Encouraging Factors to visit Open Spaces Perceptions of Open Spaces Attitudes Towards the Environment 43 Section Six: Conclusions and Recommendations Introduction Blue Mile Impact Assessment Open Spaces Survey 48 References 49 Socio-economic Research and Intelligence Observatory
9 Appendices 50 Appendix One Images of the Blue Mile Event 51 Appendix Two Blue Mile Questionnaire 56 Appendix Three Open Spaces Pre-Event Survey 68 Socio-economic Research and Intelligence Observatory
10 Blue Mile, Blue Sound and Stepping Stones to Nature: An Exploration of their Impact Final Report 1. Introduction 1.1 Background to the Study Three projects with the aim of increasing public engagement with the environment were launched in Plymouth in 2010: Blue Mile, Blue Sound and Stepping Stones to Nature. The Blue Mile Race for the Environment is a new UK mass-participation open water event, designed to encourage and facilitate engagement with the blue environment. The inaugural Blue Mile took place in front of Plymouth s waterfront on the 3 rd and 4 th July Participants and visitors were offered the opportunity to take part in a variety of watersport events and activities, as well as visiting exhibits at the Event Village. Saturday provided the opportunity to participate in the Race for the Environment, which included swimming, kayaking and stand up paddle races, while Sunday was more family focused offering watersport taster sessions. Both days incorporated the National Marine Aquarium Blue Mile Walk and the Event Village. A selection of photographs showing key moments from the event, as provided by the event organisers to SERIO, are included in the Appendix One of this report. The other two projects, Blue Sound and Stepping Stones to Nature are both funded by the Big Lottery Fund. Blue Sound, led by the Marine Biological Association, works with local community and youth groups to address the physical and perceptual barriers to accessing the blue environment. Similarly, Stepping Stones to Nature seeks to improve opportunities to access green space in and around Plymouth. Engaging and working with local communities is important in the delivery of all three projects. In 2010 SERIO, based at the University of Plymouth, was commissioned to develop a monitoring system for assessing the impact and achievements of these projects. In consideration of the similarities of the projects aims a coordinated and collaborative research project was designed to do this. As part this assignment, SERIO carried out a socio-economic impact assessment of the Blue Mile event. This was based upon previous impact assessments of the Plymouth Summer Festival undertaken by SERIO in 2007 and 2008 and in particular upon the economic impact assessment of the Artemis Transat at Sutton Harbour carried out in Socio-economic Research and Intelligence Observatory 1.
11 1.2 Research Aims and Approach The overall aim of this study was to develop a monitoring system based upon a bespoke toolkit for enabling each project to monitor its impacts and achievements throughout its lifetime. The research consisted of two main elements: A semi-structured face-to-face street survey carried out during the Blue Mile two day event to assess the socio-economic and environmental impact of the event; and An Open Spaces Survey, designed as a pre and post event survey to collect views and uses of outdoor open spaces to be completed by participants of each project before and after their participation in a project specific event Street Survey The street survey was designed to collect information on participants and visitors attending the Blue Mile. A semi-structured interview schedule using both open and close questions was developed in consultation with the client and was administered face to face by trained interviewers 2. It investigated the following aspects: Participant and visitor profile, including the nature and purpose of their visit to the city; Participant and visitor expenditure during the day; Distance travelled and means of transport to the event; Awareness of the event (prior to visit); Event satisfaction; and, Perceptions and interpretations of the event s key messages. The fieldwork was undertaken across the two days of the event (3 rd and 4 th July 2010), throughout the Barbican and West Hoe areas, between 10am and 4pm each day. A total of 206 interviews were completed, 107 on Saturday and 99 on Sunday. (Please see Appendix Two for a copy of the questionnaire). 1 At the time of writing, no projects had utilised the post-event survey from the toolkit. 2 Four interviewers were engaged each day of the Blue Mile to carry out the fieldwork. Socio-economic Research and Intelligence Observatory 2.
12 Responses from the completed surveys were entered into SNAP software and analysed using the Statistical Package for the Social Sciences (SPSS). In order to assess the economic impact of the Blue Mile, an adapted application of the UK sport methodology, as used in the previous economic impact study of the Artemis Transat at Sutton Harbour, Plymouth, was adopted Open Spaces Survey A self completion questionnaire was designed to be administered to project participants before their engagement in an event, in order to understand their views on, and uses of green and blue spaces both within the city of Plymouth and its surrounding area. The pre-event questionnaire explored the following aspects: Respondent profile; Awareness, perceptions and use of green and blue space in Plymouth and its surrounding area; Promoters and barriers to use of green and blue spaces in Plymouth and its surrounding area; and Environmental attitudes. The pre-event questionnaire was provided to project co-ordinators in electronic form, to enable copies to be distributed to participants as required (a copy of the questionnaire is shown in Appendix Three). Due to time constraints, the Blue Sound and Stepping Stones to Nature projects were unable to successfully distribute pre-event surveys to participants before the Blue Mile event. As participants for the Blue Mile had to pre-register online, this presented an opportunity to administer an online pre- event survey amongst registered participants. This was developed utilising SNAP survey software and went live on July 1 st. A total of 44 pre-event surveys were completed out of 242 registered participants. Additional opportunities for capturing pre event data were offered by the Blue Mile event itself. To this end, the street survey included a subsection using key questions from the Outdoor Open Spaces survey which was administered to respondents residing within the Plymouth area 3 who had not previously completed the pre-survey. A total of 123 respondents completed this subsection during the Blue Mile two day event. 3 This included all areas identified by a PL postcode to reflect the local scope of the survey. Socio-economic Research and Intelligence Observatory 3.
13 1.3 Structure of the Report This report is organised under the following headings: Key Findings from the Blue Mile Event; Economic Impact: Average Spend at the Blue Mile Event; Environmental Impact: Visitors Carbon Footprint; Key Findings from the Open Spaces Survey; and Conclusion and Recommendations. Socio-economic Research and Intelligence Observatory 4.
14 2. Key Findings from the Blue Mile Event This section of the report presents the findings from the street survey undertaken at the Blue Mile. 2.1 Respondent Profile Data collected from the street survey shows that 53.4% of respondents were male and 46.6% were female, with a slightly larger proportion of male respondents being recorded on Sunday. The age profile is shown in Chart One. The profile reveals a reasonable spread across all the age groups, with Sunday seeing a larger proportion of those aged years (52.5%) and a lower proportion of younger respondents aged years (20.2%), reflecting the family focused activities provided on Sunday. Chart One: Age of Respondents Percent (%) Saturday 3rd July Sunday 4th July Total * Percentages may not total 100, due to rounding Base: All respondents (n=206): attendances on Saturday 3 rd July (n=107), attendances on Sunday 4 th July (n=99) Source: SERIO, Blue Mile Survey 2010 As can be seen from Table One, the largest proportion of respondents attending the Blue Mile formed an adult pair (42.2%), while groups without children were the least represented (18.9%). Reflecting the family focused activities provided on Sunday a higher proportion of groups with children were present on this day (32.3%), while Saturday saw a larger proportion of groups without children (25.2%) and single adults (15.9%), again possibly reflecting the activities of the day. Socio-economic Research and Intelligence Observatory 5.

 lived within the Plymouth Travel to Work Area (PTTWA) 4, 7.")
15 Table One: Attendance Grouping Grouping Saturday 3rd July Sunday 4th July Total No. % No. % No. % Single Adult Adult Pair Group or Single adult with children Group without children Total * Percentages may not total 100, due to rounding Base: All respondents (n=206), attendances on Saturday 3 rd July (n=107), attendances on Sunday 4 th July (n=99) Source: SERIO, Blue Mile Survey 2010 As shown in Chart Two, the majority of respondents (72.3%) lived within the Plymouth Travel to Work Area (PTTWA) 4, 7.8% lived in the rest of Devon and Cornwall (excluding the PTTWA) and the remaining 19.9% came from beyond Devon and Cornwall. Chart Two: Domicile of Respondents Percent (%) PTTWA Devon & Cornwall (excluding PTTWA) Beyond Devon & Cornwall Saturday 3rd July Sunday 4th July Total * Percentages may not total 100, due to rounding Base: All respondents (n=206), attendances on Saturday 3 rd July (n=107), attendances on Sunday 4 th July (n=99) Source: SERIO, Blue Mile Survey The PTTWA covers the postcode areas PL1-14 and PL Socio-economic Research and Intelligence Observatory 6.
16 People living outside of the immediate Plymouth area (54 respondents) were then asked further questions to gather more details on their visit to the city. The majority (45) indicated they had visited the city previously, and less than half (24) stated that they were on holiday, with 27 having stayed or planning to stay in or near the city as part of their visit. The number of nights that visitors stayed in or near the city ranged from one to 27. Two nights was the most frequently occurring length of stay. Of those staying overnight, the majority were accommodated within the city (21) and were more likely to stay at hotels (8) or with friends and relatives (8). These results indicate that the Blue Mile event catered to a relatively local audience and repeat visitors to the city, consistent with other studies undertaken on Plymouth events. The proportion of respondents coming from outside the sub-region was also in line with other events hosted by the city. 2.2 Purpose and Method of Visit to the City When asked about the main reason for their visit to the city, close to threefifths (58.7%) of respondents stated they had visited Plymouth specifically for the Blue Mile. Sightseeing and visiting friends were other common reasons (17.5% and 10.2% respectively). 77% of those residing in the Plymouth area were visiting Plymouth because of the Blue Mile event, compared with 50% of those from Devon and Cornwall and 29% of those from further afield. Of those who had not indicated that the Blue Mile was the primary reason for visiting Plymouth, 15 had came to the Barbican because they had heard of the event. This means a total of 66.0% of respondents were at the Barbican as a direct result of the Blue Mile. A quarter of respondents (25.2%) indicated that they were repeat visitors to the Blue Mile, planning to visit, or having visited on both days. Specifically, while 27.1% of Saturday respondents indicated they would come again the next day, 23.2% of Sunday visitors stated they came to the Blue Mile the previous day. Respondents were then asked to indicate how they travelled to the city and to provide an estimate of the number of miles travelled. As shown in Chart Three, the majority of respondents (57.8%) had travelled to the city by car (including taxi or motorbike), with 29.1% indicating they had travelled by foot and 11.7% by bus 5. Bicycle, train and park and ride were the least common means of transport. 5 Please note that respondents could indicate more than one means of transport. Socio-economic Research and Intelligence Observatory 7.
17 Chart Three: Respondents Means of Transport for Travelling to the Blue Mile Percent (%) Car By foot Bus Bicycle Train Park and Ride Other *Percentages do not total 100% as respondents could give more than one response Base: All respondents (n=206) Source: SERIO, Blue Mile Survey 2010 In terms of miles travelled for getting to the event, these ranged from under a mile to 200 miles, with a median value of four miles. Three quarters of respondents had travelled six or less miles to arrive at the event. Further details about carbon emissions arising from visitors and participants travel is discussed in Section Five with the aim of providing an initial assessment of the environmental impact of the Blue Mile. 2.3 Awareness of and Involvement in the Blue Mile In terms of awareness of the Blue Mile, 70.4% of respondents indicated that they had heard of the Blue Mile prior to being interviewed. Local respondents were much more likely to have heard of the event before their visit compared with those from further afield in Devon and Cornwall or beyond. A higher level of awareness was also detected amongst visitors aged and groups with children. As shown in Table Two word of mouth was the most common means for finding out about the event, with over a third of respondents (34.5%) citing this as the way they had heard about the event. In addition, information on the event was gathered from a range of news and advertising media, such as newspapers, radio and posters. One in ten respondents (9.7%) cited the Blue Mile website and a further 8.3% cited other websites. In addition 15.9% of respondents indicated they found out through other means which included tourist information, other local events and through the University. A summary evaluation of the actual media coverage of the event, as undertaken by the event organisers, is discussed in Section 2.8. Socio-economic Research and Intelligence Observatory 8.
18 Table Two: Means of Awareness of the Blue Mile Channel of Communication No. % Word of mouth Newspaper Radio Poster Blue Mile Website Flyers Other Website Television Work School Other Don't know *Percentages do not total 100% as respondents could give more than one response Base: All respondents that had heard about the Blue Mile (n=145) Source: SERIO, Blue Mile Survey 2010 Data from the street survey also shows that locally based marketing methods, such as posters and fliers, emerged as effective means of raising awareness for young people (16-34), while newspaper and radio proved to be more effective for older people. Television, as well as radio, also appeared to be effective in informing people from across Devon and Cornwall. Despite a high proportion of people being aware of the Blue Mile prior to their visit more than one quarter of respondents highlighted the need for improvements in the advertising of the event (26.7%). Specific suggestions were made for better timing and more widespread publicity both at a local level and throughout the region. See Section 2.4 below for further details on suggested improvements. Respondents involvement in the Blue Mile was also explored. The Blue Mile event included the opportunity to register for completing one or more Blue Mile races, as well as to participate in a variety of entertainment and activities which did not require pre-registration. Overall, data shows that 63.1% of respondents took part in one or more activities provided by the event over the two days. Almost one-fifth of respondents (18.0%) indicated that they had registered to complete a Blue Mile, with 7.2% indicating they had, or planned to, participate in the swim, 6.3% in the kayak and 1% in the stand up paddle. Only one respondent stated they participated in the triple challenge, taking part in all three races. Walks organised both on Saturday and Sunday attracted about Socio-economic Research and Intelligence Observatory 9.
19 one in ten respondents (11.2%), while watersport sessions were attended by four respondents. In addition, around half of respondents (49.0%) indicated that they had, or planned to, visit the Event Village and 6.8% had watched the End of the line film screened at the Aquarium. A higher proportion of male respondents and groups with children indicated they had taken part in one or more activities, compared to other groups of participants. Groups with children were also more likely to visit the Event Village, possibly reflecting the activities there. In addition, age emerged as a determinant in registering for completing a Blue Mile, with the large majority of registered respondents being aged between 17 and Respondents were also asked an open question about any barriers they experienced in accessing activities. While the large majority did not mention any barriers (87.9%), five respondents highlighted the lack of sufficient information on the overall event and four specified registration requirements, in addition three indicated they found the registration closed. Barriers related to facilities and organisation (e.g. narrow walkways, lack of facilities for disabled or for childcare) were also reported by four respondents. 2.4 Views on the Blue Mile Views were sought on the Blue Mile event overall. As Chart Four highlights, the majority of respondents stated that the event was either extremely good or quite good (92.2%). Over half of respondents (52.4%) gave an extremely good rating and only three people (1.5%) rated the event quite poor, while none considered it as extremely poor. 6 Participation to the Blue Mile races was open to people aged 17 or over. Socio-economic Research and Intelligence Observatory 10.
20 Chart Four: Overall Rating of Blue Mile Extremely good Quite good Neither/Nor Quite poor Extremely poor Don't know * Percentages may not total 100, due to rounding Base: All respondents (n=206) Source: SERIO, Blue Mile Survey 2010 Percent (%) Since the Blue Mile included a variety of activities especially organised for families and children, respondents were also asked their views on this aspect. As shown in Chart Five, nine in every ten respondents (90.1%) considered the event to be child and family friendly to some extent, with 65.5% rating it as very child and family friendly. Positively, groups with children were particularly keen to express a high rating for this aspect: 75.5% rated it as very child and family friendly, compared to 62.2% of adults visiting without children. Socio-economic Research and Intelligence Observatory 11.
21 Chart Five: Child and Family Friendly Very child and family friendly Quite child and family friendly Neither/Nor Not very child and family friendly Not at all child and family friendly Don t know * Percentages may not total 100, due to rounding Base: All respondents (n=206) Source: SERIO, Blue Mile Survey Percent (%) Respondents were then invited to suggest what would make the Blue Mile better in the future. As can be seen from Table Three, more than half of respondents made suggestions with the most common suggestion being that more advertising should be available both locally and regionally (26.5%). Linked to this, 7.3% of respondents indicated the need for improving communication and on-site information on the programme of events, such as directions, available facilities and on-going activities. Offering more entertainment was mentioned by 12.1% of respondents. A wide range of additional entertainment and activities were suggested, including activities for children, live music, merchandise stalls and food outlets. Additionally, nine respondents (4.4%) suggested providing a greater variety of races, such as triathlon and a relay mile, as well as more walks. One in twenty respondents (5.3%) also suggested improving facilities for accessing the event, for example by offering more or free parking and public transport and by making more toilet facilities available. It is worth noting that similar suggestions were recorded during previous festival or sports events organised in Plymouth. Socio-economic Research and Intelligence Observatory 12.
22 Table Three: Suggested Improvements to the Blue Mile Suggested Improvements No. % Advertising % More events/entertainment and stalls % Improve communication and on-site information on programme of events/activities % Improve facilities (toilets, parking, etc) % More and varied swims/walks (e.g. relay mile) 9 4.4% Lower entry fee 2 1.0% Other (e.g. later registration, more participants) % Don't know % No improvements suggested % *Percentages do not total 100% as respondents could give more than one response Base: All respondents (n=206) Source: SERIO, Blue Mile Survey Impact of the Blue Mile The survey explored the impact of the Blue Mile in a number of areas including respondents behaviour, environmental awareness, and views of the local area. Respondents were asked what they thought was the event s main purpose. A synthesis of their responses is provided in Chart Six below. 55.3% thought the Blue Mile aimed to raise awareness of the environment (with a minority explicitly referring to the marine environment), and 14.1% perceived it as an event for charity and fundraising. Promoting watersport activities and/or health and fitness were also viewed as a main purpose of the event by 12.6% and 6.3% of respondents respectively, while a few suggested that the event was meant to support the city of Plymouth and especially its waterfront. Finally, around 14.1% of respondents indicated they were unsure about the purpose of the event. Socio-economic Research and Intelligence Observatory 13.
23 Chart Six: Perceived Main Purpose of the Blue Mile Raise awareness of (blue) environment Event for charity/fundraising Promote watersport activities Promote health and fitness Support Plymouth (particularly its waterfront) Wildlife Other (e.g. fun) Don't know Percent (%) *Percentages do not total 100% as respondents could give more than one response Base: All respondents (n=206) Source: SERIO, Blue Mile Survey 2010 When invited to think if they would do anything differently as a result of attending the Blue Mile, over a half of respondents (56.3%) did not mention any potential change in behaviour, with thirteen people reporting they were already aware or engaged with environmental issues and activities (Chart Seven). Of those who stated they would do something differently, the most common action cited was taking part or encouraging family and friends to participate in more watersport or outdoor activities (13.1%). Eight people indicated they would take part in the Blue Mile next year. Fourteen respondents (6.8%) said they would become more environmentally friendly as a result of attending the Blue Mile, while 3.4% said that they would look for more information on environmental issues and events like this. Socio-economic Research and Intelligence Observatory 14.
24 Chart Seven: Perceived Potential Changes in Behaviour as a Result of Attending the Blue Mile Doing nothing differently Taking part and/or encouraging others to take part in more watersport or outdoor activities Being more aware of general environmental issues and more likely to take some actions on these Taking part in the Blue Mile next year Looking for more information on environment and/or events like the Blue Mile Other Don't know *Percentages do not total 100% as respondents could give more than one response Base: All respondents (n=206) Source: SERIO, Blue Mile Survey 2010 Respondents were then presented with a number of statements and asked to indicate the extent to which they agreed or disagreed with each. This stimulated respondents to directly reflect on any potential impact of the event. As shown in Chart Eight, a higher proportion of positive responses were collected, compared to the previous question. Overall the majority of respondents felt attending the Blue Mile would have a positive impact on their behaviour, with 56.3% agreeing to some extent that they were more likely to do more to look after our planet, 54.4% agreeing they were more likely to enjoy the natural environment with family and friends, and 43.7% agreeing that they were likely to take part in more water activities as a result of attending the Blue Mile. Positively, young people (aged 16-25) emerged as the age group who generally felt more strongly that their attendance at the Blue Mile would impact positively on their future behaviour. Socio-economic Research and Intelligence Observatory 15.
 Source: SERIO, Blue Mile Survey 2010 Percent (%) More likely to enjoy natural environment with family/friends Likely to")

25 Chart Eight: Impact of the Blue Mile on Behaviour Strongly agree Slightly agree Neither nor Slightly disagree Strongly disagree DK/NA Likely to do more to look after planet * Percentages may not total 100, due to rounding Base: All respondents (n=206) Source: SERIO, Blue Mile Survey 2010 Percent (%) More likely to enjoy natural environment with family/friends Likely to take part in more water activities To further measure the impact of the Blue Mile on respondents behaviour all respondents were asked how likely they would be to complete a Blue Mile if the event took place again in the future. As can be seen from Chart Nine, the large majority of respondents (70.9%) indicated that they would be likely to complete a Blue Mile, if the event returned in the future, with 44.7% indicating that they would be very likely to do so. Socio-economic Research and Intelligence Observatory 16.
26 Chart Nine: Likelihood to Complete a Blue Mile Very likely Quite likely Neither likely nor unlikely Quite unlikely Very unlikely Don't know * Percentages may not total 100, due to rounding Base: All respondents (n=206) Source: SERIO, Blue Mile Survey Percent % The impact of the Blue Mile on respondents environmental awareness was also measured. As shown in Chart Ten, a large proportion of respondents felt attending the Blue Mile had had a positive impact on their awareness of a number of environmental issues. Two-thirds of respondents (65.5%) agreed to some extent that the Blue Mile had raised their awareness of the blue environment, 60.2% agreed that the Blue Mile had made them more aware of threats facing the marine environment and 53.4% agreed that the Blue Mile had opened their mind to environmental issues. Socio-economic Research and Intelligence Observatory 17.
27 Chart Ten: Impact of the Blue Mile on Environmental Awareness Strongly agree Slightly agree Neither nor Slightly disagree Strongly disagree DK/NA * Percentages may not total 100, due to rounding Base: All respondents (n=206) Source: SERIO, Blue Mile Survey 2010 Percent (%) Blue Mile has made me more aware of threats facing marine environment Blue Mile has opened mind to environmental issues Blue Mile has raised awareness of Blue environment Finally the impact of the Blue Mile on the community and local area was measured. Respondents were overwhelmingly positive about the impact of the event in this regard, as shown in Chart Eleven. Almost all respondents (98.5%) agreed to some extent that attracting events like the Blue Mile was good for the image of Plymouth, with nearly nine in every ten agreeing that the Blue Mile and events like it help to bring the local community together (89.8%) and that their experience during the Blue Mile had enhanced their image of Plymouth as a tourist destination (83.5%). Socio-economic Research and Intelligence Observatory 18.
 Source: SERIO, Blue Mile Survey 2010 Percent (%) My experience during Blue Mile has enhanced my image of Plymouth Attracting events like Blue")
28 Chart Eleven: Impact of the Blue Mile on Environmental Awareness Strongly agree Slightly agree Neither nor Slightly disagree Strongly disagree DK/NA * Percentages may not total 100, due to rounding Base: All respondents (n=206) Source: SERIO, Blue Mile Survey 2010 Percent (%) My experience during Blue Mile has enhanced my image of Plymouth Attracting events like Blue Mile is good for image of Plymouth Blue Mile helps to bring local community together 2.6 The Blue Mile Event Village: Exhibitors Feedback During the Blue Mile event, the Event Village hosted a variety of exhibits on the environment and related issues. At the end of the event a very short structured questionnaire was administered to exhibitors by the event organisers to collect views and feedback on their experience. Eleven questionnaires were completed and a summary of responses was provided to SERIO. Specifically exhibitors were asked to rate several aspects of the event on a numeric scale from one to five (where one corresponds to poor and five to excellent). Key findings suggest that exhibitors were positive about the event (Chart Twelve). The average rating for the overall impression of the event was 3.9, with six respondents rating this as a four and two respondents as five out of five. None provided a score lower than three. The general organisation of the Event Village was considered positively, with a mean score of 4.1. Ten respondents rated this aspect as four or five out of five. However one respondent was not completely satisfied with this, providing a rating of two. Views were more varied in relation to the location of the event village. While the mean score was 3.9, one respondent rated this as a two, and three exhibitors rated this as three out of five. Other aspects Socio-economic Research and Intelligence Observatory 19.
29 related to information, customer care and support received far more positive responses. All respondents felt the information and pre-event instructions supplied in the Event Village Exhibitor Pack were clear, with the mean rating for this being 4.5, with six respondents rating this aspect as five out of five. Everyone also reported that they found the pre-event customer care leading up to the event as a four or five out of five, which resulted in a mean score of 4.5. In addition, although three respondents considered staff support as three out of five, five respondents were particularly pleased with the help the Blue Mile staff provided during the event, again rating this as five out of five. The mean score for this was 4.2. Overall, the majority of exhibitors felt that the event was successful to some extent in raising awareness and action of the environment, as this received a mean rating of 3.5. Positively nine of the eleven respondents indicated they would be interested in exhibiting again next year. In supporting these positive views and experiences an exhibitor commented as follows: We have had a fantastic time, and have made so many contacts with other exhibitors and people attending the event. It's been so chilled and so organised, we all feel lovely and relaxed and I just want to carry on for another few days!! Chart Twelve: Exhibitors Feedback on the Blue Mile s Event Village Overall impression of the event General organisation Location Event Village Exhibitor Pack Pre event customer care Staff support Level of success in raising awareness and action for the Environment Base: Exhibitors at the Blue Mile Event (n=11) Source: Sport Environment Mean Score Socio-economic Research and Intelligence Observatory 20.
30 2.7 The Blue Mile Event: Competitors Feedback Following their participation in the Blue Mile, competitors were invited by the event organisers to complete a short questionnaire on their experiences and perceptions of the event. This covered aspects related to the registration process, participation in the day, levels of satisfaction, and intention to take part in the event again. Social and environmental impacts of the event, and competitors commitment to raise money for charity were also explored. A total of 30 questionnaires were completed and a summary of the quantitative responses were provided to SERIO. Respondents included 14 female (49%), 12 males (41%) and three that preferred not to provide their gender. They were mainly aged between 16 and 44 years (22, 73%) and attended the event accompanied by their partner, family or friends (22, 73%). The majority took part in the Blue Mile Swim (20, 67%). Eight respondents (27%) also reported they used the event to raise money for charity, with three (10%) raising funds specifically for the official charity partner WWF-UK. Supporting the findings from the street survey conducted by SERIO (see Section 2.4), results indicated that respondents were satisfied with their experience of the Blue Mile, with 22 (73%) reporting to be very satisfied and rating the event as extremely good. In terms of the registration process, both the on-line event entry/booking systems and the pre-event customer support received were rated positively: 21 (69%) and 22 (73%) respondents respectively considered these as quite or extremely good. In considering more general aspects of the event, such as its location and its impact on the surroundings, almost all respondents agreed to some extent that Plymouth was a perfect place to host the Blue Mile 2010 (29, 96%), and that the event promoted a positive image of Plymouth (29, 96%), which confirmed the views expressed by visitors more generally (see Section 2.5). All respondents but one also felt that the Blue Mile increased opportunity for people to participate in water sports (29, 96%). In addition, the majority of respondents did not feel that the event had a negative impact on city pollution and traffic issues. Reflecting the positive experience, all respondents but one stated that not only would they recommend the event to others, but they would also take part in the Blue Mile again. A number felt they would participate in additional event activities, including the Two Mile Open Water Swim (13, 43%) or the 0.5 Mile Open Water Swim (7, 23%). Comments from competitors, event volunteers and other staff involved in the organisation of the event that were collected by the event organisers supported these positive views and experiences. Socio-economic Research and Intelligence Observatory 21.
31 [The Blue Mile Event] was brilliant and I had an absolutely wonderful time. I swam in the slow wave, it has been 30 plus years since I last competed and had set this event as a personal challenge and I did it I wear my Blue Mile t-shirt with great pride, I earned it. (Blue Mile competitor) Best event in Plymouth. (Blue Mile competitor) Excellent day!!! Very well organised and enjoyed it very much. (Blue Mile competitor) I enjoyed the day and thought it was a great event to showcase the water sports that Plymouth has to offer, as well as raising money for a worthwhile cause. (Blue Mile volunteer) I think the event was well undertaken. It now needs to build upon the very good start. (Blue Mile Supplier) I attended the first Blue Mile and felt it was a great success! The Blue Mile 'crew' did a fantastic job of organising the event and taking care of participants. Ocean enthusiasts and the public at large enjoyed the Event Village and activities in the water My hope is that this event spreads to cities around the world to educate people about our marine environment, and enable them to take steps daily to protect it. (Olympic Gold Medallist in Synchronised Swimming & Panel Member for Beyond Sport Awards) 2.8 The Blue Mile Event: Summary of Media Coverage An evaluation of the media coverage of the event was undertaken by the event organisers and a summary of results provided to SERIO. Key findings indicated that the event was covered in the UK only, with peak coverage being achieved during the Launch Event (July 2009), Live Registration (February 2010) and during the event weekend (July 2010). Regular press releases were issued throughout the period from the launch in July 2009 to the actual event in July In terms of volume of coverage (by circulation), television and online accounted for 77% of the total volume (42% and 35% respectively), followed by print (13%) and radio (10%). Articles were published, for instance, in the Western Morning News and the Herald, and the event was covered by BBC Spotlight and the BBC News website. The Blue Mile official website was accessed by 16,216 visitors between February and July The media evaluation concluded that overall a good spread of regional coverage was achieved between February and July 2010 which resulted in a reported high awareness level of the Event. In addition, the evaluation suggested that the message and tone of the coverage was accurate and very positive of the Event (Sport Environment, 2010). Socio-economic Research and Intelligence Observatory 22.
32 3. Economic Impact: Visitors Expenditure at the Blue Mile in Plymouth 3.1 Introduction The Blue Mile impact assessment was primarily aimed to gain a better understanding of the event effectiveness in engaging visitors with the blue environment and in raising their awareness of environmental issues. Along with this, an economic evaluation was undertaken to provide an initial recording of the expenditure generated by the event in the host city. In being the first event of its kind, the event was not expected to achieve an impact comparable to other well established sports events hosted in Plymouth or elsewhere in the UK. However, the findings will be particularly useful as a point of reference for future events. A variety of methodological approaches have been developed for assessing the economic impact of festivals, sport and cultural events. In 2007 and 2008 SERIO undertook a literature review to determine the most appropriate approaches to be applied to the overall Plymouth Summer Festival and to the Artemis Transat at Sutton Harbour, Plymouth. Given the different nature and purpose of these events, two different methodologies were adopted: while an input-output model, based upon the British Arts Festival association s recommendations, was applied to the Plymouth Summer Festival, an adaptation of the UK sport approach was utilised for the Artemis Transat (SERIO, 2007; 2008a; 2008b). Since the Blue Mile Race for Environment was presented as a UK massparticipation open water event, focused around a range of watersport races and activities, the UK Sport approach was deemed appropriate for its assessment. According to the this approach, impact assessments aim to determine: the total amount of additional expenditure generated within a defined area, as a direct consequence of staging an event (EventIMPACTS, 2009, p19). The UK Sport approach to impact assessments and the input-output model differ from each other in the way they calculate expenditure directly generated by an event. The input-output model involves calculating the average visitor spend per capita and the multiplier effect within the local economy, less any capital expenditure that can be explicitly identified as incurred by the tourism event. According to the UK Sport approach, though, multipliers are specific to a given economy and therefore a multiplier recommended for tourism events would be inappropriate for a sporting event. Instead, the average spend is calculated and then multiplied by the number of bed-nights and day visits generated to provide a gross spend for the event. Additionally, the UK Sport model (1999, p15) recommends analysis of the data by three key filters: Socio-economic Research and Intelligence Observatory 23.
33 By whether the respondents are local residents or visitors 7 ; By respondent group type (e.g. spectators, participants, media); and, By day and overnight visitors for each respondent group. Excluding local residents from this assessment would remove the majority of the visitors (72.3%) from the analysis. Given that the majority of the respondents were at the venue specifically to attend the event, using this filter would appear to be inappropriate and it has therefore not been applied to the data. Instead, the calculation is based upon respondents who reported the Blue Mile was the main purpose of their visit to the city or they came to the venue because of this event (66.0%). This is still in line with the UK sport approach, which aims to exclude casual visitors from the eligible visitor group, as their expenditure would have been made regardless of the event (EventIMPACTS, 2009, p42). The Blue Mile event consisted of a variety of sports activities and entertainment, with only a few requiring a registration for competing. Since all visitors were given the opportunity to engage in the event activities, any distinction between competitors and spectators is difficult. The majority of visitors interviewed (63.1%) indicated they took part in one or more activities, with 18.0% of respondents stating they registered to participate in a race. In addition official or media groups were not directly surveyed. Therefore, this second filter has not been applied to the calculations. UK Sport also suggests separating day and overnight visitors. Only two respondents who came to the venue because of the Blue Mile reported spending any money on accommodation in Plymouth, therefore this filter was not applied to the data. Finally, budgeted spend was not collected. Instead respondents were asked to provide a total indication of what they spent or planned to spend in the city on the day of the visit, including the evening. The economic impact assessment presented in this report, then, is based upon an adaptation of the UK Sport model, which resembles the one applied to the Artemis Transat at Sutton Harbour, Plymouth (SERIO, 2008b). 3.2 Calculations Average Expenditure Per Head As the analysis is based upon the average spend per head, the total spend for travel, food and drink, accommodation, shopping, and tickets for events and 7 Local residents are excluded from the economic impact calculations. According to the UK sport approach, their expenditure is considered deadweight based upon the argument that it would have been made regardless of the event (Sport UK, 2004, p10). Socio-economic Research and Intelligence Observatory 24.
34 tourist attractions was calculated as a first step 8. Where the spend data was collected as a total for a family group, it was divided by the number of adults in the group. Separate averages were calculated for actual spend for: All respondents. That is, all respondents at the venue, including those present for reasons other than the Blue Mile. All respondents at the venue because of Blue Mile, including registered participants. The full economic assessment is based upon the expenditure of respondents present at the venue because of the Blue Mile, although analyses for both groups are presented in Table Four below as there are some variations in the averages between the two 9. Specifically Table Four shows that the average spend of respondents present at the venue because of the Blue Mile were generally lower than the average spend for all respondents, with the exception of train and tickets expenditure. Table Four: Average Spend Per Head at the Blue Mile Item All respondents Respondents at the venue because of the Blue Mile Bus Car Train Other travel expenses (ferry, taxi) Food/drinks Tickets for events (included Blue Mile registration fee and related events) Shopping/souvenirs Accommodation in Plymouth Base: All respondents (n=206); Respondents at the venue because of the Blue Mile (n= 136) Source: SERIO, Blue Mile Survey The latest edition of the UK Sport approach suggests that direct leakages are deducted from the total spending, that is any expenditure incurred by visitors with concessions or traders not resident in the host economy (e.g. petrol stations), based on the argument that this would not directly impact on the host economy. For the scope of the study, this filter has not been applied. However, when interpreting findings, consideration must be given to the possibility that some expenditure, especially related to travel, may not have occurred in the Plymouth area. 9 In considering the average spend, please note that where car expenditure was not given, the distance travelled was used to calculate expenditure by applying an average fuel cost of 13.7p per mile (based on motoring costs provided by the Automobile Association Limited for 2010 (AA, 2010); bus and train expenditures do not take into account seasonal passes. Socio-economic Research and Intelligence Observatory 25.
35 The second stage of the calculation involves totalling the average expenditure based upon respondents who stated they were present at the venue because of the Blue Mile. The total average spend per head per day was The Total Average Expenditure To calculate the total impact of the Blue Mile average spend has been multiplied by the total number of visitors, including registered participants, using estimates provided by the event organiser, Sport Environment. Sport Environment monitored visitor numbers, as a result of which they estimated that 7,947 people passed through the Event Village over the two days and approximately 1,500 watched the water activities from the roadside that runs from the Barbican up to the Hoe; additionally, organisers reported that a total of 242 individuals registered to complete a race, 212 attended the water taster session and 187 took part in the walk. It is recognised though that it is difficult to provide a robust estimate of visitors numbers and that these figures might overlap to some extent, due to the counting methods used 10. In addition, the event was organised over two days, offering people the opportunity to return to the event the next day and therefore be counted twice. The street survey shows that a quarter of respondents (25.2%) were repeat visitors to the Blue Mile, planning to, or having visited on both days. Eligible visitor numbers to the event were estimated using these figures and findings from the street survey. Specifically, assuming 25.2% of repeat visitors, the total number of visitors, spectators and registered participants was downsized to 7,768. Further to this, casual visitors were discounted: since the street survey shows that around a third of respondents were at the venue for other reasons than the event itself, 930 people were exempt from economic impact evaluation 11. The overall number of visitors was thus reduced to 6,636 people. Finally, in considering any potential overlapping between figures, a second figure for actual visitors was estimated, which excluded the group of people (1500) who watched from the roadside, based upon the scenario that all those visited the event village at some point, thus being counted twice. This reduced the total number of eligible visitors to 5,645 people. As a results, two final estimates were established for the Blue Mile visitors, 5,645 people representing the lowest limit and 6,636 people representing the upper limit. Taking these high and low estimates, the total direct expenditure generated by the event was between 115,111 and 135,300, which equated to an economic impact per day of between 57,555 and 67, Visitors to the Event Village were counted in and out with a clicker by event volunteers. Individuals could register for more than one activity and thus be counted more than once. 11 Registered participants (242) were excluded from this calculation, since it is assumed that they had to decide in advance to register and take part in the event and could not be at the venue casually. Socio-economic Research and Intelligence Observatory 26.
36 It is recognised that this figure was lower than the impact generated by spectators of other major sports events held in Plymouth, such as the Artemis Transat at Sutton Harbour 12 in 2008, which ranged between 151,200 and 192,720 per day (SERIO, 2008b). However, it is worth considering that the Blue Mile was a maiden event and had a budget significantly lower than that of other well established events. In fact, it emerged that the average spend per head per day at the Blue Mile ( 21.35) 13 was higher than both the average spend per spectator per day at the Artemis Transat ( 12.60) and the average spend per day per respondent visiting the city specifically because of the Artemis Transat event ( 19.23). Overall, although caution must be exercised when drawing comparison with the spend data collected using a full application of the UK Sport approach, to provide some context the Blue Mile visitors economic impact appears to fall within the lowest range of visitors daily economic impacts 46,678 to 355,009 generated across six major events assessed by UK Sport in (UK Sport, 2006). 3.3 Discussion In interpreting the economic impact of the Blue Mile, three main considerations can be made with reference to the estimated number of visitors and their provenance. Firstly, learning can be taken from the fact that, in comparison with other sports events, the expenditure at the Blue Mile appeared to fall within the lowest range of visitors daily economic impacts. In interpreting this, the low numbers of visitors from outside the local area is particularly relevant. Visitors and participants coming from beyond the host area are more likely to spend money on accommodation, which tends to be one of the most significant components of economic impact. Findings from the street surveys showed that only two respondents visiting the city because of the Blue Mile reported accommodation spend and this has had significant repercussions on the total expenditure. Secondly, the overall estimate provided by this assessment should be interpreted with a number of caveats. On the one hand, its robustness is dependent upon the accuracy of the estimated number of visitors. Although the event organisers monitored the number of visitors passing through the Event Village with a clicker and some of the activities required a registration, access to the Blue Mile event was not ticketed which rendered it difficult to provide accurate estimations of overall attendance. On the other hand, the nature of the visitors at the Blue Mile prevented a full application of the UK Sport approach to economic impact assessments and, in so doing, incorporated an element of uncertainty in the overall estimate. In fact the local provenance of the majority of visitors to an event renders it difficult to 12 The Artemis Transat is the oldest solo ocean race in history and is held every four years since Please note that this figure incorporates participants registration fee. Socio-economic Research and Intelligence Observatory 27.
37 clearly distinguish between the expenditure directly attributable to the event and that which would have occurred regardless of this. In this respect, the success of the event in attracting visitors from beyond the local area is again crucial. Finally, results show that although the total expenditure generated per day was lower than that of the Artemis Transat, the total average spend per head per day compares favourably with it. This means that an increase in levels of attendance would be likely to ensure an increase of the events economic impact in the future. For this reason, consideration should be given to those elements that might have limited to some extent the number of visitors taking part into the event. Although levels of awareness of the event prior their visit were high, respondents from the street survey highlighted the need to provide more advertisement. This might suggest that marketing and publicity strategies had a limited impact in reaching all potential target audiences especially those beyond the local area who needed to plan their visit in advance. The event activities organised on Saturday differed from those on Sunday as, consequently, did their target audiences. Key sport activities like the races were arranged on Saturday only, while Sunday was more family focused. This might have had an impact on attendance, since races and competitions are more likely to attract a greater number of spectators and participants. In addition, this may be seen as creating significantly different spending patterns during the two day event (e.g. registration fees were required for taking part in Saturday races only) and a significantly lower total expenditure on Sunday. Generally, attendance to outdoor events is more likely to be dependent on the weather conditions than indoor events. On Sunday the weather conditions worsened, compared to the previous day and attendance decreased substantially, as figures on visitors proved. Organisers estimated that the event attracted more than six thousand visitors on Saturday and less than three thousand on Sunday 14. A number of recommendations with regard to the issues discussed so far, are presented in the conclusions of this report. 14 These figures refer to the organiser original estimate prior to any adjustment. Socio-economic Research and Intelligence Observatory 28.
38 4. Environmental Impact: Visitors Carbon Footprint at The Blue Mile in Plymouth 4.1 Introduction There are many reasons for assessing and monitoring the environmental impact of an event or a project. Firstly, setting up an event or an activity and travelling to it typically requires using motorised transport and consequently, generates greenhouse gases associated with climate change. Secondly, sport and cultural events and projects, like the Blue Sound and Stepping Stones to Nature, are increasingly engaged with promoting environmental awareness and sustainable behaviours. As such, they are required to endorse a direct commitment to monitor their own impact on the environment. Thirdly, travel and supply costs might rise in the future, as a consequence of changes in policies and regulations for coping with climate change. Assessing the environmental impact would thus be essential in order to understand how exposed an event is in terms of changes in these areas and to ensure cost effectiveness and financial viability (EventIMPACTS, 2009). This section presents an exploratory assessment of the environmental impact of the Blue Mile. This is based upon an estimate of climate change emissions (carbon footprint) as a result of visitors travel to the event, that is the amount of greenhouse gas emissions emitted by travelling to and from the event. Other aspects related to setting up and running the event, including energy consumption and waste, were not captured and as such are not included in this assessment. 4.2 Visitors Carbon Footprint Calculations Total Greenhouse Gas Emissions According to Defra, Greenhouse Gases can be measured: By recording emissions at source by continuous emissions monitoring or by estimating the amount emitted using activity data (such as the amount of fuel used) and applying relevant conversion factors (e.g. calorific values, emission factors, oxidation factors) (Defra, 2009). These conversion factors are used to convert activity data, such as number of miles driven, KWh of electricity used, tonnes of waste recycled, into kilograms of carbon dioxide equivalent (kg CO 2 eq), which is: a universal unit of measurement used to indicate the global warming potential of one unit of carbon dioxide (DEFRA, 2009). Socio-economic Research and Intelligence Observatory 29.
39 This in turn allows for comparison with different greenhouse gases and different activities. The activity data available for the Blue Mile included the travel information respondents provided through the street survey, in terms of means of travel used and estimated number of miles travelled to the event (see Section 2.2). As the analysis is based upon the environmental impact of the overall visit, the total number of miles for a return journey was calculated as the first step 15. Where public transport (e.g. bus, train, taxi and ferry) was reported to be used, miles were converted into kilometres to allow the application of Defra conversion factors for those means of transport. The second stage of the calculation involved applying the Defra transport conversion factors to the total distance travelled by each mode of transport. The specific emission factors used in this analysis are reported in Table Five below. Table Five: Defra Transport Conversion Factors Means of Transport Kg CO 2 per unit* Car (unknown fuel) Local bus Train Regular taxi Foot passenger ferry *Transport conversion factor for car refers to miles travelled per vehicle, whereas conversion factors for all public transport are provided by km per passenger Source: DEFRA, 2009 The Defra conversion factor for car is based upon the vehicle emission, regardless of the number of passengers. Therefore, where the means of transport was reported to be a car, the total emissions were divided by the total number of adults and children who were with the respondent at the event 16. Table Six shows the total greenhouse gases emitted by all respondents and by those who visited the city because of the Blue Mile. Although the full assessment is based upon emissions generated by respondents present at the venue because of the Blue Mile only, analysis for both groups are presented here, as there are some variations in the totals. 15 This is based upon the assumption that all visitors would travel back to the same place they started the journey from, using the same means of transport. 16 This is based upon the assumption that all the people reported to be at the event with the respondent travelled together, although it is accepted that in some cases this might not have been the case. Socio-economic Research and Intelligence Observatory 30.
40 Table Six: Respondents Greenhouses Gases Emissions, by Means of Transport Greenhouse Gases emissions (kg CO Means of 2 ) Respondents at Transport All respondents the venue because of the Blue Mile Car Bus Train Taxi Ferry Total Car also includes motorcycles and minivan, Ferry also includes watertaxi and boat. Base: All respondents travelling by a motorised vehicle (n=150); Respondents at the venue because of the Blue Mile travelling by a motorised vehicle (n=102) Source: SERIO, Blue Mile Survey 2010 As can be seen, a total of kg CO 2 were generated by respondents present at the venue because of the Blue Mile. In being the most common means of transport used to get to the Blue Mile (57.8% of respondents used it), car emissions accounted for the highest amount of greenhouse gases generated for taking part in the event. These totalled to kg CO 2. In addition, respondents who travelled by bus (11.7%) emitted a total of kg CO The Total Average Visitor Greenhouse Gas Emissions The total CO 2 emissions per respondent to the street survey were then calculated. These are as follows: All respondents: 2.70 kg CO 2 per head Respondents at the venue because of the Blue Mile: 2.63 kg CO 2 per head The total average transport emissions for respondents have also been multiplied by the number of visitors, using the estimates provided in Section It is calculated, thus, that the event visitors generated between 14, kg CO 2 and 17, kg CO 2. It must be emphasised however, that the robustness of this assessment is dependent upon the accuracy of the estimated number of visitors, as was the case for the economic assessment. Socio-economic Research and Intelligence Observatory 31.
41 4.4 Discussion This initial assessment of the Blue Mile environmental impact estimates that visitors travelling to the event generated between 14, kg CO 2 and 17, kg CO 2 in total, and 2.63 kg CO 2 per head. These findings must be interpreted with a number of caveats. Firstly their robustness is dependent on the accuracy of the estimated number of miles visitors stated they travelled to the event, as well as the estimated number of people attending the event. Secondly, in being based on visitors transport emissions only, this provides a partial understanding of the overall environmental impact. A comprehensive measurement of the event s carbon footprint is not possible at this stage, due to the lack of information on other aspects involved in the setting up and running of the event that might have generated greenhouse gases (e.g. energy consumption, waste produced). Establishing accurate estimates for these aspects was beyond the scope of the present study. In order to accurately model the events environmental impact in the future a full life cycle analysis, incorporating waste management, energy use, etc. related to all aspects of the event (including planning and administration) would be required. However, this would be unable to capture the longer term benefits of behaviour change that the event seeks to achieve. Socio-economic Research and Intelligence Observatory 32.
42 5. Key Findings from the Open Spaces Survey This study aimed at developing a monitoring system based upon a bespoke toolkit to enable the Blue Mile, Blue Sound and Stepping Stones to Nature to monitor their impacts and achievements throughout the projects lifetimes. As reported in Section 1.3, a key element of this toolkit was a pre-event survey exploring respondent s awareness and use of outdoor open spaces in the Plymouth area. Findings from this are discussed in this section. Specifically, this analysis incorporates the pre-event survey data collected during the Blue Mile event and through the on-line survey administered to registered participants. A total of 44 on-line surveys and 123 street surveys were completed. An overview of the respondent profile is provided in Section 5.1 and key findings emerging from the survey are presented in Sections 5.2 and Respondent Profile The survey was completed by 52.1% of females and 47.9% of males. As shown in Chart Thirteen below there was a broad spread of ages within the sample, although a higher proportion of those in the age group took part (24.6%). Chart Thirteen: Age of Respondents Percent (%) Base: All respondents (n=167) Source: SERIO, Open Spaces Pre-Survey, 2010 In terms of domicile, amongst on-line respondents who provided their postcode, the majority indicated they were living in areas identified by a PL postcode (37), two were living in Devon and Cornwall and three beyond Devon and Cornwall. Since relevant questions included in the street survey were related only to open spaces in Plymouth, a filter was applied to ensure Socio-economic Research and Intelligence Observatory 33.
43 only respondents living in areas identified by a PL postcode were included, this resulted in people from the PTTWA alone being interviewed. Additional demographic data on working status, ethnicity and disability were also collected from the on-line survey. Results show that 63.6% of respondents were working full time, 11.4% part time, 11.4% were self employed and 11.4% were students and one was retired. The overwhelming majority were white British (95.5%). Only one respondent indicated they considered themselves to have a disability. 5.2 Outside Open Spaces in Plymouth and the Surrounding Area The first set of questions included in the pre-survey focused on the use and views of open spaces in the city of Plymouth, with the majority of these administered to all participants, including Blue Mile visitors. Later questions covered similar issues with regard to open spaces outside of Plymouth and were not included in the street survey. Registered participants were initially asked to indicate how often they visited a range of places in the city of Plymouth and in the surrounding area (within a 30 minute journey time from the city), such as the coast, water, park, woodlands, nature reserve and national park 17. Results are presented in Table Seven and Eight below. The most frequently visited places in the city of Plymouth as well as in its surrounding area were the coast and water. Plymouth s coast and water were visited at least once a week by half of respondents, while this decreased to around four in every ten if these places were outside of Plymouth. Four in ten respondents also visited parks in the city of Plymouth at least once a week and almost three in ten regularly went to Dartmoor or other national parks. Woodlands were visited less often while nature reserves emerged as the least visited open space. 17 National park was included in the question on places outside of Plymouth only. Socio-economic Research and Intelligence Observatory 34.
44 Table Seven: Frequency of Visits to Open Spaces in the City of Plymouth Open Space Every day 3-4 times a week Once a week 2-3 times a month Once a month A couple of times a year Less frequently No. % No. % No. % No. % No. % No. % No. % No. % The coast 3 6.8% % % % 3 6.8% % 3 6.8% 1 2.3% Water 3 7.0% % % % 2 4.7% % 4 9.3% 1 2.3% Park 2 4.8% % % % 3 7.1% % % 4 9.5% Woodland 0 0.0% 1 2.3% % % % % 3 6.8% % Nature reserve 0 0.0% 0 0.0% 1 2.4% % 3 7.1% % % % Base: Online pre-survey respondents (42-44) 18 Source: SERIO, Open Spaces Pre-Survey, 2010 Never Table Eight: Frequency of Visits to Open Spaces Outside of Plymouth Open Space Every day 3-4 times a week Once a week 2-3 times a month Once a month A couple of times a year Less frequently No. % No. % No. % No. % No. % No. % No. % No. % The coast 1 2.3% 3 6.8% % % % % % Water % % % % % % Park % % % % % % 3 7.5% Woodland 1 2.3% 1 2.3% % % % % % 2 4.7% Nature reserve 0 0.0% 0 0.0% % 3 7.5% % % % % National park 1 2.4% 2 4.8% % % % % 3 7.1% 2 4.8% (e.g. Dartmoor) Base: Online pre-survey respondents (40-43) 19 Source: SERIO, Open Spaces Pre-Survey, 2010 Never 18 Please note that some respondents chose not to answer one or more items in this question. 19 Please note that some respondents chose not to answer one or more items in this question. Socio-economic Research and Intelligence Observatory 35.
45 5.2.1 Most Frequented Open Spaces All respondents were asked to indicate which open space in Plymouth, if any, they visited most frequently. While 12.8% of respondents indicated they did not visit any open spaces in Plymouth, for those who did, the most popular place was the Hoe and waterfront area, with 50.7% indicating this was the place they went most often in Plymouth. This was followed by Central Park (21.6%) and the Barbican (19.6%). Freedom Fields and other local parks were also indicated by 12.2% of respondents. Table Nine: Most Frequented Open Spaces in the City of Plymouth Open Space No. % The Hoe and Waterfront area % Central Park % Barbican % Mount Batten % Cann Woods % Saltram 7 4.7% Freedom Fields 6 4.1% Jennycliff 6 4.1% Coast/beaches 9 6.1% Devils Point 4 2.7% Plymbridge 4 2.7% Other local parks (e.g. Victoria Park, Devonport Park, etc) % Mount Wise 2 1.4% Other places (City Centre, Plym Valley, Bircham Valley, 9 6.1% Estover) *Percentages do not total 100% as respondents could name more than one place Base: All respondents visiting open spaces in Plymouth (n=148) Source: SERIO, Open Spaces Pre-Survey, 2010 The popularity of the Hoe and waterfront areas is also confirmed by responses provided to a direct question about the frequency of visit here, with 52.4% indicating they visited at least once a week A similar question was asked to registered participants of the Blue Mile with regards to places in the surrounding area of Plymouth (within a 30 minute journey time) 20. Responses are provided in the Table Ten below. Dartmoor emerged as the open space where more respondent go most frequently (33.3%), followed by beaches, such as Whitsand Bay (16.7%) and Wembury Beach (14.3%). 20 Note that a few respondents indicated open spaces located in areas farther away from Plymouth. Socio-economic Research and Intelligence Observatory 36.
46 Table Ten: Most Frequented Open Spaces in the Surrounding Area of Plymouth Open Space No. % Dartmoor % Whitsand Bay % Wembury Beach % Bantham % Bodmin Moor 2 4.8% Cawsand 2 4.8% Mothecombe 2 4.8% Other open spaces (E.G. Bigbury, The Coastal Path, Yealm % Estuary, etc) *Percentages do not total 100% as respondents could name more than one place Base: Registered participants visiting open spaces outside of Plymouth (n=42) Source: SERIO, Open Spaces Pre-Survey, 2010 Respondents were then asked to indicate the reason for going to the place/s they visited most frequently in the city of Plymouth and outside of it. As shown in Table Eleven, whether visiting an open space in the city or in the surrounding area, respondents reported enjoying the surroundings and getting some fresh air as the main reason for their visits. In addition, a high proportion of respondents indicated they visited open spaces in Plymouth or outside of it to relax (44.9% and 61.9%). Other common reasons were proximity to home and spending time with family and friends, with more than one third of respondents indicating these as reasons for visiting places in the city, and more than half as reasons for visiting places outside of the city. Taking part in recreational activities appears to be a more relevant reason for visiting places in Plymouth s surrounding area, than in the city, while only a few people went to their favourite open space, regardless of its location, for an educational visit or to learn about the natural environment. Socio-economic Research and Intelligence Observatory 37.
47 Table Eleven: Reasons for Going to the Most Frequently Visited Open Spaces in Plymouth and the Surrounding Area Reason for visiting Open spaces in the city of Plymouth Open spaces in the surrounding area No. % No. % To enjoy the surroundings % % To get some fresh air % % To relax % % It is close to home % % To participate in recreational activities (walking/surfing/sailing) % % To spend time with family/friends % % To take my children to play % % To walk the dog % % To learn about the natural environment 5 3.4% 4 9.5% For an educational visit 6 4.1% 2 4.8% No particular reason 3 2.0% 0 0.0% Other % % *Percentages do not total 100% as respondents could provide more than one response Base: All respondents visiting open spaces in the city of Plymouth (n=147); Registered participants visiting open spaces in the surrounding area (n=42) Source: SERIO, Open Spaces Pre-Survey, 2010 In addition to this, registered participants were asked to indicate how they usually travel to get to those places and who they usually go with. In terms of means of transport, a large proportion of respondents reported they usually went by car. Predictably this proportion was higher when it came to travelling to places in the surrounding area of Plymouth (81.0% compared to 50.0% of people visiting open spaces in the city). Conversely, travelling by foot was more common for going to open spaces in the city (29.4%) than in the surrounding area (11.9%). Public transport appears to be the least popular, with no one using it for going to places outside of the city. Socio-economic Research and Intelligence Observatory 38.
 Open spaces in the city of Plymouth Open spaces in the surrounding area of Plymouth *Percentages may not total 100% due to rounding Base:")
.")
48 Chart Fourteen: Preferred Means of Transport for Travelling to Most Frequently Visited Open Spaces in the City of Plymouth and the Surrounding Area Percent (%) Car/Motorbike By foot Bicycle Public transport (bus/train) Open spaces in the city of Plymouth Open spaces in the surrounding area of Plymouth *Percentages may not total 100% due to rounding Base: Registered participants visiting open spaces in Plymouth (34), and in the surrounding area (42) Source: SERIO, Open Spaces Pre-Survey, 2010 As shown in Chart Fifteen, whether visiting places in Plymouth or in the surrounding area respondents were more likely to do so with their partner (52.9% and 61.9%). Additionally, a large proportion visited open spaces in the city alone, while friends and family were preferred when it came to visiting places in the surrounding area. Socio-economic Research and Intelligence Observatory 39.


49 Chart Fifteen: Who Respondents usually go to the Most Frequently Visited Open Spaces with By myself With my partner With my friend(s) With my family With my pet(s) Varies Open spaces in the city of Plymouth Open spaces in the surrounding area of Plymouth *Percentages do not total 100% as respondents could provide more than one response Base: Registered participants visiting open spaces in Plymouth (n=34) and in the surrounding area (n=42) Source: SERIO, Open Spaces Pre-Survey, Barriers and Encouraging Factors to visit Open Spaces Further to investigating preferred open spaces, the survey explored any potential barriers as well as aspects that would encourage residents to go to open spaces. As can be seen from Table Twelve, a quarter of respondents did not perceive any barriers to their visits to open spaces in Plymouth, while another 10.2% did not mention any particular reasons. Similar results were recorded with regards to visiting places outside of the city, albeit with lower proportions. Of those who did feel there were barriers, the majority reported the lack of time and being too busy as factors that prevented them going to open spaces more frequently. In addition a few indicated that places were too hard to get to, especially if they were not in the city, and four people reported they could not afford to travel to the surrounding area. Finally, one-fifth of respondents visiting open spaces in the city indicated other barriers, including security issues (5), poor facilities and unkemptness (5) and parking costs (2). Living far away from the city (9) and adverse weather conditions (8) were also mentioned. Socio-economic Research and Intelligence Observatory 40.
50 Table Twelve: Perceived Barriers to Visiting Open Spaces in the City of Plymouth and in the Surrounding Area more frequently Barriers I don't have enough time/i am too busy Open spaces in the city of Plymouth Open spaces in the surrounding area of Plymouth No. % No. % They are too hard to get to I can't afford to travel there I don't know how to get to them I don't have anyone to go with I can't afford to do things when I get there I do not enjoy being outdoors They are not suitable for my family No particular reason Nothing Other *Percentages do not total 100% as respondents could provide more than one response Base: All respondents (166); Registered participants (43) 21 Source: SERIO, Open Spaces Pre-Survey, 2010 When asked about aspects that would encourage respondents to go to open spaces, different views emerged with regards to visiting places in the city or in the surrounding area, as shown in Table Thirteen. For open spaces in the city, respondents indicated the availability of more organised activities (14.5%) improvements in parking facilities and costs and public transport (13.3%) as the main things that would encourage them to visit more frequently. Around one in ten respondents also mentioned improvements in information available and access, while 7.9% indicated that they would be encouraged to go more frequently if more children's play features were provided. In addition, 30 other responses were reported which ranged from cleanness of facilities (8) to more time available (7) and security issues (3). When it came to open spaces in the surrounding area of Plymouth, respondents prioritised the need for more information (22.5%) and better public transport (22.5%). Better parking facilities and better access were also indicated by respondents (20.0% and 17.5% respectively). 21 Please note that one respondent chose not to answer this question. Socio-economic Research and Intelligence Observatory 41.
51 Finally, it is worth noting that almost a third of respondents felt they would not be encouraged by anything to visit open spaces in Plymouth more frequently and more than one third indicated the same with regard to places in the surrounding area. Table Thirteen: Aspects that would Encourage Respondents to Visit Open Spaces in the City of Plymouth and in the Surrounding Area more frequently Aspects that would encourage respondents Open spaces in the city of Plymouth Open spaces in the surrounding area of Plymouth No. % No. % Better parking facilities Better public transport available More children's play features More organised activities More seating Better access (e.g. paths, signs etc) More information about them Nothing Don't know Other *Percentages do not total 100% as respondents could provide more than one response Base: All respondents (165); Registered participants (40) 22 Source: SERIO, Open Spaces Pre-Survey, Perceptions of Open Spaces Finally, the pre-survey administered to registered participants sought to understand respondents overall view of open spaces in the city and elsewhere. As can be seen from Table Fourteen, the large majority of respondents shared a positive view of open spaces. However, open spaces in the surrounding area of Plymouth tended to be seen more positively than those in the city, with 74.4% of respondents viewing them very positively compared with 36.4%. 22 Please note that four respondents chose not to answer this question. Socio-economic Research and Intelligence Observatory 42.
52 Table Fourteen: Respondents Views of Open Spaces in the City of Plymouth and in the Surrounding Area (within a 30 minute journey time). Rating View of Open spaces in the city of Plymouth View of Open Spaces in surrounding area of Plymouth No. % No. % Very positively Quite positively Neither positively nor negatively Quite negatively Don't know Base: Registered participants (43-44) 23 Source: SERIO, Open Spaces Pre-Survey, Attitudes Towards the Environment Given the aim of the Blue Mile, Blue Sound and Stepping Stone to Nature to raise awareness and promote engagement with the environment, a section of the pre-survey was designed to explore respondents attitudes toward this. Respondents were presented with a number of statements concerning their behaviour toward water use, energy saving and more general attitudes towards climate change and asked to indicate the extent to which they agreed or disagreed with each. As shown in Chart Sixteen, the majority of respondents appeared to be thoughtful with regards to energy and water consumption, with 80.0% and 60.0% of respondents respectively strongly disagreeing with the assumption that they don t give much thought to saving energy in their home and don t pay much attention to the amount of water they use at home. In addition, nearly eight in ten respondents strongly disagreed with the idea that the effects of climate change were too far in the future to really worry them. When considering potential barriers to sustainable behaviour, the lack of practical alternatives to travelling by car in Plymouth appears a factor preventing two thirds of respondents reducing their car use. 23 Please note that one respondent chose not to answer the question on their views on open spaces outside of Plymouth. Socio-economic Research and Intelligence Observatory 43.
 24 Source: SERIO, Open Spaces Pre-Survey, 2010 Percentages (%) I don't give much thought to saving energy in my home I don't pay much attention to the amount of water I use at")


53 Chart Sixteen: Respondents Attitudes toward Sustainable Behaviour Strongly agree Slightly agree neither/nor Slightly disagree Strongly disagree Don't know Base: All respondents ( ) 24 Source: SERIO, Open Spaces Pre-Survey, 2010 Percentages (%) I don't give much thought to saving energy in my home I don't pay much attention to the amount of water I use at home The effects of climate change are too far in the future to really worry me I would like to reduce my car use but there are no practical alternatives in Plymouth To further explore respondents views of environmental issues, respondents were asked the extent to which they agreed or disagreed with a set of statement on their attitude towards local open spaces and their expectations on Plymouth s commitment to protect their natural environment. Results are shown in Chart Seventeen. As it can be seen, the large majority considered local open spaces important to them, with 61.9% of respondents strongly agreeing with this statement. In addition, 45.5% would like to do more to protect Plymouth s marine environment, however, it should be noted that a quarter of respondents did not agree. However, this data should not be interpreted as an indication of disinterest, since many respondents indicated elsewhere that they were already engaged with the environment as much as they could and did not feel they could do more. A strong level of agreement was also expressed with regards to the duty for Plymouth residents to recycle: 74.4% of respondents agreed with this. Conversely, when respondents were asked to indicate whether Plymouth could make more of its natural environment, a wider range of opinions emerged, with six in ten respondents disagreeing either quite or strongly and a quarter agreeing either quite or strongly. 24 Please note that two to three respondents chose not to answer one or more items of this question. Socio-economic Research and Intelligence Observatory 44.
 25 Source: SERIO, Open Spaces Pre-Survey, 2010 Percentage")
 are important to me I would like to do more to protect Plymouth's marine environment Plymouth could make more of its natural environment People in Plymouth have a")
54 Chart Seventeen: Respondents Attitudes toward the Local Environment Strongly agree Slightly agree neither/nor Slightly disagree Strongly disagree Don't know Base: All respondents ( ) 25 Source: SERIO, Open Spaces Pre-Survey, 2010 Percentages (%) Local open spaces (e.g. the coast, water, parks, woodland) are important to me I would like to do more to protect Plymouth's marine environment Plymouth could make more of its natural environment People in Plymouth have a duty to recycle In interpreting these findings, it must be emphasised that respondents were participants and visitors of an event clearly aimed to promote the environment and as such might not be representative of the general population of Plymouth and beyond. Attendance and engagement with projects like the Blue Mile, Blue Sound and Stepping Stones to Nature tend to be filtered by the public s structural features and attitudes towards cultural and scientific contents and outdoor activities, resulting in an upstream selection of visitors. It is therefore more likely that people already interested in the environment and aware of issues around this, take part in these projects. 25 Please note that two to three respondents chose not to answer one or more items of this question. Socio-economic Research and Intelligence Observatory 45.
55 6. Conclusions and Recommendations 6.1 Introduction This study sought to develop a monitoring system based upon a bespoke toolkit for assessing the impact and achievements of the Blue Mile, Blue Sound and Stepping Stones to Nature projects. This toolkit included a street survey carried out during the Blue Mile two day event (3 rd and 4 th July) and an Open Spaces Survey to be completed by participants of each project. This report presented findings from the Blue Mile impact assessment and a summary of results emerging from the Open Spaces pre-event survey. Conclusions drawn from these findings, together with related recommendations are discussed in the following sections. 6.2 Blue Mile Impact Assessment Findings from the street survey suggest that the event was successful in engaging visitors with the blue environment. Levels of participation in the activities were high, 92.2% of respondents rated the overall event good or extremely good and the majority felt that attending the Blue Mile had a positive impact on their views and perceptions of the environment and environmental issues. Awareness of the event was good, with 70.4% of respondents having heard of the event before attending. Word of mouth was the most common means for finding out about the event. Six out of ten respondents visited the city or were at the venue specifically for the Blue Mile and a quarter of respondents indicated that they were repeat visitors to the Blue Mile, planning, or having visited on both days. Linked to this, it is of note that, consistent with other surveyed events staged in Plymouth over a short time scale, the event catered for a relatively local audience, mainly resident in the PTTWA. Overall, in being a maiden event and with a lower budget than that of other well established sports events held in Plymouth, the Blue Mile was attended by a number of visitors ranging between 5,645 and 6,636 and generated an economic impact of between 57,555 and 67,650 per day. The event also appeared to contribute to some extent in promoting sports development, as 13.1% of respondents stated they would take part or encourage family and friends to engage in more watersport or outdoor activities, as a result of their attendance. In addition, the Blue Mile appeared to be successful in developing a positive image of the city of Plymouth amongst its visitors. Such positive perceptions were reflected in the high proportion of respondents (70.9%) reporting that they would be likely to complete a Blue Mile, if the event was repeated in the future. Reflecting these findings, the following points are worth considering in relation to future Blue Mile events. Socio-economic Research and Intelligence Observatory 46.
56 Marketing The media evaluation reported a good spread of regional media coverage and the use of a wide range of media. However, in taking into account visitors most common suggestion, the event could potentially be advertised further afield and in a more thorough way, particularly beyond the local area, as this would help to increase attendance and attract more people from outside of Plymouth, with potential beneficial economic returns. Given the positive impact the Blue Mile had on young people and the low proportion of attendees from this age group, especially on Sunday, this audience could also be targeted more effectively. Marketing methods could continue to include mainstreaming media (TV, newspapers, radio, fliers and banners), as they proved to be effective in generating overall awareness, but also strengthen the online coverage and the use of social networking that could help attract more young people. Organisation and communication Respondents to the street survey felt that more and varied activities and entertainment, including more watersport races, would improve the event. Consideration could be given to the feasibility of broadening the event offering, by adding food and merchandise stalls and more varied entertainment. The opportunity of organising a wider range of races (e.g. relay) and of planning them on both days should also be taken into consideration, as this would help to attract a wider public including a higher number of paying participants, and to retain visitors from beyond the local area in the city overnight. It is also recommended that consideration should be given to improving on-site information on the programme of events, providing directions and making available facilities more easily accessible and providing clearer communication on registration requirements and details of the programme of events each day. Monitoring total visitor numbers The robustness of the economic impact assessment significantly relies on the accuracy of estimated numbers of visitors to the Blue Mile. Consideration should be given to adopting appropriate methods for counting visitors in the future, particularly if events will not be ticketed. It is suggested that the opportunity to monitor access to the Event Village, distributing a free ticket doubling as a flier or a programme at the entrance is explored in the future. Monitoring the environmental impact The assessment of the environmental impact in this report is limited to the travel related impact of visitors. It is suggested that for future Blue Mile events a sound monitoring system for assessing environmental Socio-economic Research and Intelligence Observatory 47.
57 impact should be developed, based on the concept of full life cycle analysis. This will contribute to ensuring the events sustainability and, in being consistent with the Blue Mile s main purpose, may be effectively used as part of the overall marketing strategy, in promoting a zero carbon Blue Mile. 6.3 Open Spaces Survey Findings from the Open Spaces pre-event survey provided useful insights on the characteristics and attitudes of those engaged in projects promoting engagement with the environment, like the Blue Mile, Blue Sound and Stepping Stones to Nature. Cultural and sport events, as well as projects engaging with the community, tend to induce an upstream selection of participants, based upon their prior interest and involvement in the event contents. The Blue Mile, Blue Sound and Stepping Stones to Nature do not make an exception. The majority of respondents proved to be already aware and, to some extent, engaged with the environment and related issues, regularly visiting open spaces in Plymouth and in the surrounding area. The lack of time was perceived as the main barrier to visiting green or blue open spaces more frequently. However respondents also indicated a range of aspects that would encourage them to go to open spaces, including more organised activities, information available and better public transport. These aspects appear to be consistent with the projects main purposes and in doing so, suggest key elements towards which all projects could work effectively. Socio-economic Research and Intelligence Observatory 48.
58 References AA (2010): Running Cost Tables. [Internet]. Available at: [Accessed August 2010] Defra (2009) Guidelines to Defra / DECC's GHG Conversion Factors for Company Reporting. [Internet]. Available at: [Accessed August 2010] SERIO (2008a). Economic Impact Assessment of the Summer Festival in Plymouth. University of Plymouth. SERIO (2008b). Economic Impact Assessment of the Artemis Transat at Sutton Harbour, Plymouth. University of Plymouth. SERIO (2007). Economic Impact Assessment of the Summer Festival in Plymouth. University of Plymouth. EventIMPACTS (2009). EventIMPACTS Toolkit, London. Sport Environment (2010): Blue Mile Media Report, July, Plymouth. UK Sport (2006). Measuring Success 3: The Economic Impact of Six Major Sports Events Supported by the World Class Events Programme in 2005 & London. UK Sport (2004). Measuring Success 2: The Economic Impact of Major Sports Events. London. UK Sport (1999). The Economic Impact of Sports Events: Guidance Document. London. Socio-economic Research and Intelligence Observatory 49.
59 Appendices Appendix One: Images of the Blue Mile Event Appendix Two: Blue Mile Questionnaire Appendix Three: Open Spaces Pre-Event Survey Socio-economic Research and Intelligence Observatory 50.


60 Appendix One Images of the Blue Mile Event Socio-economic Research and Intelligence Observatory 51.
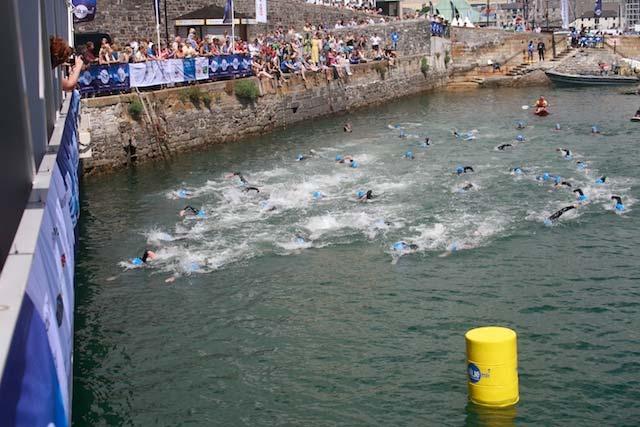
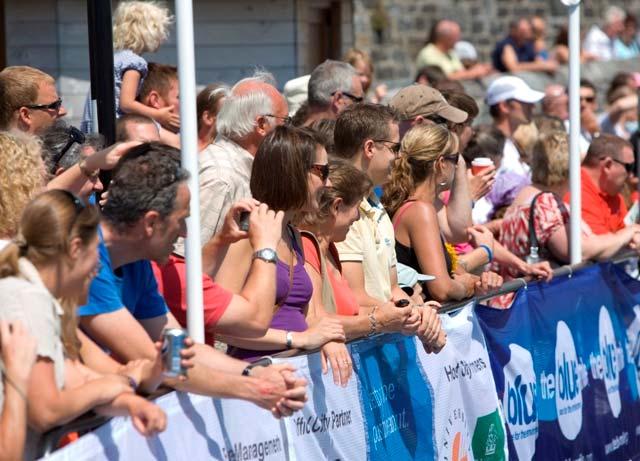
61 Socio-economic Research and Intelligence Observatory 52.
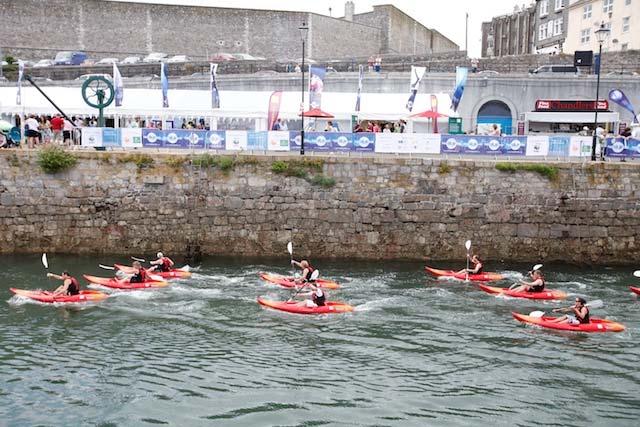
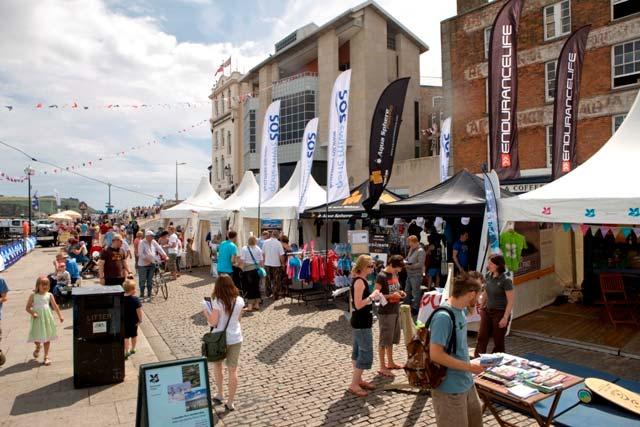
62 Socio-economic Research and Intelligence Observatory 53.
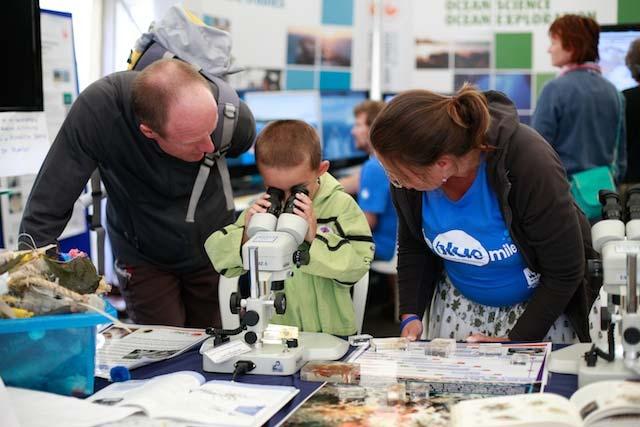
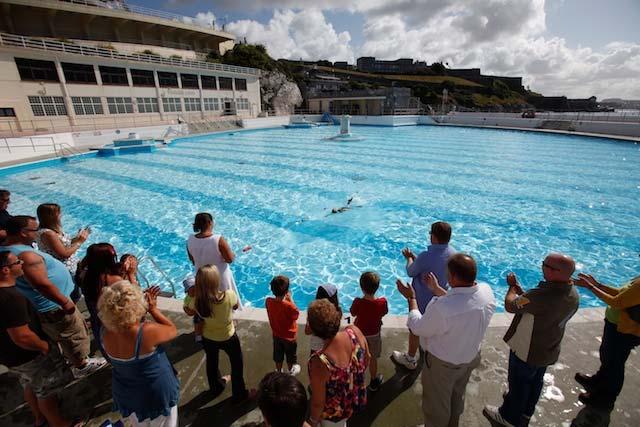
63 Socio-economic Research and Intelligence Observatory 54.
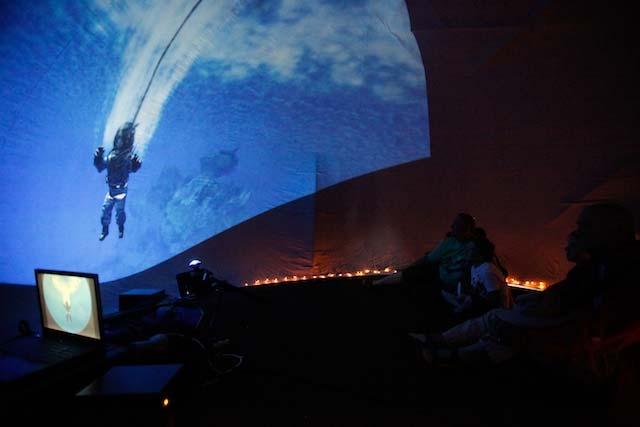
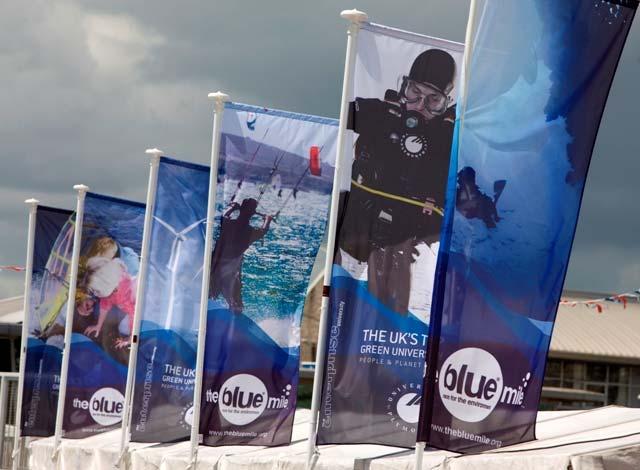
64 Socio-economic Research and Intelligence Observatory 55.
Appendix 22 Sea angling from a private or chartered boat
 Appendix 22 Sea angling from a private or chartered boat LUC SMRTS2015 Final Report 359 March 2016 Appendix 22 Sea angling from a private or chartered boat Table A22.1: Summary of sample confidence levels
Baseline Survey of New Zealanders' Attitudes and Behaviours towards Cycling in Urban Settings
 Baseline Survey of New Zealanders' Attitudes and Behaviours towards Cycling in Urban Settings Highlights 67% of urban New Zealanders, 18 years of age or more own or have access to a bicycle that is in
Appendix 9 SCUBA diving in the sea
 Appendix 9 SCUBA diving in the sea Firth of Clyde Forum SMRTS2015 Final Report 195 March 2016 Appendix 9 SCUBA diving in the sea Table A9.1: Summary of sample confidence levels Responses Spatial data Questionnaire
Appendix 21 Sea angling from the shore
 Appendix 21 Sea angling from the shore LUC SMRTS2015 Final Report 342 March 2016 Appendix 21 Sea angling from the shore Table A21.1: Summary of sample confidence levels Responses Spatial data Questionnaire
School Games EXECUTIVE SUMMARY YEAR 1 August 2012
 School Games EXECUTIVE SUMMARY YEAR 1 August 2012 1 EXECUTIVE SUMMARY Background The School Games is a competitive school sport programme designed to motivate and inspire millions of young people across
Liverpool Lime Street station engineering work. Knowledge and support for October 2017 improvement work November 2017
 Liverpool Lime Street station engineering work Knowledge and support for October 2017 improvement work November 2017 Overview before the engineering work starts On 30 September work began at Liverpool
Ontario Cycling Events & Tourism Impact Project - Cross Event Report -
 Ontario Cycling Events & Tourism Impact Project - Cross Event Report - Cyclists, Tourism Researchers, Strategists Funded in part by Cycling Events in Ontario Background Over the past few years, Ontario
Appendix 13 Rowing and sculling in the sea
 Appendix 13 Rowing and sculling in the sea Steve Thompson SMRTS2015 Final Report 251 March 2016 Appendix 13 Rowing and sculling in the sea Table A13.1: Summary of sample confidence levels Responses Spatial
Conseil de développement économique des Territoires du Nord-Ouest Quebec Travel conversion study 2008 Report May 26, 2009
 Conseil de développement économique des Territoires du Nord-Ouest Quebec Travel conversion study 2008 Report May 26, 2009 226-388 donald street winnipeg manitoba canada R3B 2J4 204.989.8002 fax 204.989.8048
Low Level Cycle Signals used as repeaters of the main traffic signals Appendices
 Low Level Cycle Signals used as repeaters of the main traffic signals Appendices Track trial report This document contains the appendices to accompany the report from the first sub-trial of a larger track
University of Leeds Travel Plan
 University of Leeds Travel Plan 2015-2018 Contents 1: Introduction 1.1 What is a Travel Plan? 1.2 Why do we need one? 1.3 Sustainability Strategy 2: Overview 2.1 The bigger picture 2.2 The City scale 2.3
INTRODUCING GOLF TOURISM TRENDS IN GOLF TOURISM. How much do international golf tourists spend on their trip in New Zealand?
 Tourists INTRODUCING GOLF TOURISM This report provides an overview of golf tourism in New Zealand including trends and characteristics of international golf tourists. is a popular tourist activity. New
Low Level Cycle Signals with an early release Appendices
 Low Level Cycle Signals with an early release Appendices Track trial report This document contains the appendices to accompany the report from the second subtrial of a larger track trial investigating
Wildlife Ad Awareness & Attitudes Survey 2015
 Wildlife Ad Awareness & Attitudes Survey 2015 Contents Executive Summary 3 Key Findings: 2015 Survey 8 Comparison between 2014 and 2015 Findings 27 Methodology Appendix 41 2 Executive Summary and Key Observations
PERSONALISED TRAVEL PLANNING IN MIDLETON, COUNTY CORK
 PERSONALISED TRAVEL PLANNING IN MIDLETON, COUNTY CORK Elaine Brick Principal Transport Planner AECOM Abstract Smarter Travel funding was awarded to the Chartered Institute of Highways and Transportation
2009 New Brunswick Gambling Prevalence Study
 2009 New Brunswick Gambling Prevalence Study Prepared for: Government of New Brunswick Centennial Building P.O. Box 6000 Fredericton, NB E3B 5H1 Prepared by: TABLE OF CONTENTS EXECUTIVE SUMMARY... 1 STUDY
EXPLORING MOTIVATION AND TOURIST TYPOLOGY: THE CASE OF KOREAN GOLF TOURISTS TRAVELLING IN THE ASIA PACIFIC. Jae Hak Kim
 EXPLORING MOTIVATION AND TOURIST TYPOLOGY: THE CASE OF KOREAN GOLF TOURISTS TRAVELLING IN THE ASIA PACIFIC Jae Hak Kim Thesis submitted for the degree of Doctor of Philosophy at the University of Canberra
National Survey for Wales Key Facts for Policy and Practice
 National Survey for Wales 2016-17 Key Facts for Policy and Practice Outdoor Recreation This bulletin describes the main findings of the Outdoor Recreation section of the 2016-2017 National Survey for Wales.
Teaching young people to learn to swim
 Teaching young people to learn to swim A community effort SALLY ROBERTSON KEY POINTS Learning to swim is crucial for water safety. Schools in this survey saw swimming as an important skill for students
Update June 2018 OUR 2017 PUBLIC ENGAGEMENT
 Update June 2018 Hi, Let s Get Wellington Moving (LGWM) is developing a Recommended Programme of Investment (RPI) that meets our programme objectives and supports the city s and region s growth. As part
Consultation on the future management. of the Old Football Pitches, Hyde Park. Consultation Report
 Consultation on the future management of the Old Football Pitches, Hyde Park Consultation Report CFP The Coach House 143-145 Worcester Road Hagley Worcestershire DY9 0NW t: 01562 887884 f: 01562 887087
ROLLER DERBY DEMOGRAPHICS:
 ROLLER DERBY DEMOGRAPHICS: Results from the Third Annual Comprehensive Data Collection on Skaters and Fans Women s Flat Track Derby Association Published March 2012 Methodology Data for this survey were
Sustainable Urban Mobility Plan for Aberdeen, Scotland. Louise Napier Senior Planner Aberdeen City Council
 Sustainable Urban Mobility Plan for Aberdeen, Scotland Louise Napier Senior Planner Aberdeen City Council A bit about me.. Louise Napier Senior Planner (Transport Strategy & Programmes) Aberdeen City Council
Life Transitions and Travel Behaviour Study. Job changes and home moves disrupt established commuting patterns
 Life Transitions and Travel Behaviour Study Evidence Summary 2 Drivers of change to commuting mode Job changes and home moves disrupt established commuting patterns This leaflet summarises new analysis
GD 0043/18 ACTIVE TRAVEL STRATEGY
 GD 0043/18 ACTIVE TRAVEL STRATEGY 2018-2021 May 2018 Minister s Introduction There is strong evidence that regular physical activity reduces the risk of a range of health conditions. The best way to increase
Active Travel Strategy Dumfries and Galloway
 Active Travel Strategy Dumfries and Galloway Our Active Travel Strategy The agreed Interventions for Dumfries and Galloway Council s Local Transport Strategy includes an action to Develop an Active Travel
Welcome to Scotland's Marine Tourism and Recreation Survey
 Welcome to Scotland's Marine Tourism and Recreation Survey The way Scotland's seas and coasts are managed is changing. Marine Scotland, the Scottish Government body with responsibility for managing Scotland's
CONTENTS PREFACE 1.0 INTRODUCTION AND SCOPE 2.0 POLICY AND GOVERNANCE 3.0 SUMMARY OF PROGRESS 4.0 NATURE OF DEMAND 5.0 TRAVEL AND PARKING INITIATIVES
 CONTENTS PREFACE 1.0 INTRODUCTION AND SCOPE 2.0 POLICY AND GOVERNANCE 3.0 SUMMARY OF PROGRESS 4.0 NATURE OF DEMAND 5.0 TRAVEL AND PARKING INITIATIVES 6.0. TARGETS PREFACE The University of St Andrews has
LIKE THE NEW BMX TRACKS?
 LIKE THE NEW BMX TRACKS? 2 March 2018 PROJECT SUMMARY The City of Adelaide s (CoA) 2017/18 asset maintenance and renewal program for recreation facilities in the Park Lands includes the revitalisation
Paper submitted to the Scottish Transport Studies Group (STSG) April 2004
 April 2004") A SURVEY OF TRAVEL BEHAVIOUR IN EDINBURGH Paper submitted to the Scottish Transport Studies Group (STSG) April 2004 Tim Ryley Research Fellow Transport Research Institute Napier University 1. Introduction
A SURVEY OF TRAVEL BEHAVIOUR IN EDINBURGH Paper submitted to the Scottish Transport Studies Group (STSG) April 2004 Tim Ryley Research Fellow Transport Research Institute Napier University 1. Introduction
EAST VILLAGE SHOPPERS STUDY A SNAPSHOT OF TRAVEL AND SPENDING PATTERNS OF RESIDENTS AND VISITORS IN THE EAST VILLAGE
 EAST VILLAGE SHOPPERS STUDY A SNAPSHOT OF TRAVEL AND SPENDING PATTERNS OF RESIDENTS AND VISITORS IN THE EAST VILLAGE CONTENTS 2 4 5 6 7 16 17 19 SUMMARY INTRODUCTION BACKGROUND METHODOLOGY RESULTS CONCLUSION
Swim Active Project: Denbigh Holiday Swim School The Informatics Team Dec 2012
 INTRODUCTION: Denbigh High in Luton, is located in a multi cultural community with a high percentage of pupils from a Muslim background. Denbigh High became a Sport Specialist in 2007 and has since converted
Online research with parents of year olds
 Bikeability Brand Research Online research with parents of 10-12 year olds Report August 2011 Prepared for: Department for Transport Prepared by: Simon Leggett, Jenny Ehren, Rosemary Duff, CHILDWISE Telephone:
Report Subject: Netball participation and social class
 Report Subject: Netball participation and social class briefing paper Background For many years, research has highlighted variations in the levels of sports participation across different socioeconomic
1.0 FOREWORD EXECUTIVE SUMMARY INTRODUCTION CURRENT TRENDS IN TRAVEL FUTURE TRENDS IN TRAVEL...
 Sustainable Travel Plan 2008-2012 1 Contents Page Number 1.0 FOREWORD... 3 2.0 EXECUTIVE SUMMARY... 3 3.0 INTRODUCTION... 4 4.0 CURRENT TRENDS IN TRAVEL... 4 5.0 FUTURE TRENDS IN TRAVEL... 7 6.0 TRAVEL
Route User Intercept Survey Report
 Route User Intercept Survey Report Hills Road, Cambridge Fieldwork: October 2016 Report published: December 2016 1 About Sustrans Sustrans makes smarter travel choices possible, desirable and inevitable.
FINAL REPORT December 2015
 ALTERNATIVE GOLF EXPERIENCES FINAL REPORT December 2015 BACKGROUND There are a wide variety of golf-related experiences that are off-shoots of the traditional game. Their one common thread is that their
Using a Mixed-Method Approach to Evaluate the Behavioural Effects of the Cycling City and Towns Programme
 1 of 25 Using a Mixed-Method Approach to Evaluate the Behavioural Effects of the Cycling City and Towns Programme Kiron Chatterjee (Centre for Transport & Society, UWE) with acknowledgements to research
Tennessee Black Bear Public Opinion Survey
 Tennessee Black Bear Public Opinion Survey Executive Summary 2012 Survey TWRA Technical Report 12 02 This electronic publication was developed by the Tennessee Wildlife Resources Agency s Division of Wildlife
Measuring and growing active modes of transport in Auckland
 AUCKLAND CLIENT TRANSPORT SECTION HEADLINE1 AUCKLAND TRANSPORT JUNE 2017 Measuring and growing active modes of transport in Auckland WAVE 3 1 AUCKLAND TRANSPORT 2 The overall business objective is to:
TOUR DE FRANCE GRAND DÉPART YORKSHIRE
 TOUR DE FRANCE GRAND DÉPART YORKSHIRE Economic Impact Assessment Report for Calderdale Metropolitan Borough Council New Economy www.neweconomymanchester.com 28 September 2012 New Economy 1 1 Introduction
MARKETING SOCIETY STAR AWARDS EVENT MARKETING AND BRAND ACTIVATION
 BANK OF SCOTLAND GREAT SCOTTISH RUN 2012 EVENT NAME: BANK OF SCOTLAND GREAT SCOTTISH RUN SPONSORSHIP FEE: 120,000 incl. VAT BUDGET FOR 2012: 130,000 incl. VAT CLIENT INVOLVED: BANK OF SCOTLAND EVENT ORGANISERS
Evaluation of Swim Safe
 Evaluation of Swim Safe Sponsor: RNLI Community Safety Team and Swim England (previously known as the Amateur Swimming Association) Department: RNLI Operations Research Unit Date started: June 216 Date
BIKEPLUS Public Bike Share Users Survey Results 2017
 BIKEPLUS Public Bike Share Users Survey Results 2017 September 2017 Public Bike Share Users Survey Results 2017 The second annual Bikeplus survey combines robust data, and expert opinion to provide a snapshot
Churn Valley Cycle Group
 Churn Valley Cycle Group Survey of Residents June 2009 Introduction 1. Parish councillors representing parishes in the Churn Valley have expressed an interest in improving facilities for cyclists. The
APPENDIX 2 PROPOSAL FOR REPLACEMENT FOR POOLE (DOLPHIN) LEISURE CENTRE FINAL SPECIFICATION
 LEISURE CENTRE FINAL SPECIFICATION") APPENDIX 2 PROPOSAL FOR REPLACEMENT FOR POOLE (DOLPHIN) LEISURE CENTRE FINAL SPECIFICATION 1 PURPOSE 1.1 To provide the following information and supporting evidence for the Member decision (reference
APPENDIX 2 PROPOSAL FOR REPLACEMENT FOR POOLE (DOLPHIN) LEISURE CENTRE FINAL SPECIFICATION 1 PURPOSE 1.1 To provide the following information and supporting evidence for the Member decision (reference
Summary Report: Built Environment, Health and Obesity
 Research and education Built Environment Edmonton Project Summary Report: Built Environment, Health and Obesity Introduction In 2007 the Canadian Institutes of Health Research and the Heart and Stroke
NATIONAL: SUPPORT FOR CIRCUS ANIMAL BAN
 Please attribute this information to: Monmouth University Poll West Long Branch, NJ 07764 www.monmouth.edu/polling Follow on Twitter: @MonmouthPoll Released: Wednesday, 20, Contacts: PATRICK MURRAY; 732-263-5858
Rider Satisfaction Survey Phoenix Riders 2004
 Rider Satisfaction Survey Riders Prepared For: Valley Metro Spring 2720 E. Thomas Rd. Bldg. A, Arizona 85016-8296 602-707-0050 answers@westgroupresearch.com Valley Metro Rider Satisfaction Survey - Page
Callander Mountain Bike Trails Feasibility Study Executive Summary January 2015
 Callander Mountain Bike Trails Feasibility Study Executive Summary January 2015 Client : Callander Community Development Trust & Callander Mountain Bike Trails Date : 26 January 2015 Status : FINAL Executive
Walking and Cycling Action Plan Summary. A Catalyst for Change The Regional Transport Strategy for the west of Scotland
 Walking and Cycling Action Plan Summary A Catalyst for Change The Regional Transport Strategy for the west of Scotland 2007-2021 Strathclyde Partnership for Transport Contents Purpose...2 Issues, Constraints
1999 On-Board Sacramento Regional Transit District Survey
 SACOG-00-009 1999 On-Board Sacramento Regional Transit District Survey June 2000 Sacramento Area Council of Governments 1999 On-Board Sacramento Regional Transit District Survey June 2000 Table of Contents
The International Coach Federation (ICF) Global Consumer Awareness Study
 Global Consumer Awareness Study") www.pwc.com The International Coach Federation (ICF) Global Consumer Awareness Study Key Results and Main Messages Fort Worth, Texas Presentation Structure 2 Research Overview 3 Research objectives To
www.pwc.com The International Coach Federation (ICF) Global Consumer Awareness Study Key Results and Main Messages Fort Worth, Texas Presentation Structure 2 Research Overview 3 Research objectives To
The 2001 Economic Benefits of Hunting, Fishing and Wildlife Watching in MISSOURI. Prepared by:
 The 2001 Economic Benefits of Hunting, Fishing and Wildlife Watching in MISSOURI Prepared by: Southwick Associates, Inc. PO Box 6435 Fernandina Beach, FL 32035 Ph (904) 277-9765 Fax (904) 261-1145 Email:
10,000 Steps Working Paper Series Paper 2: Audit of 10,000 Steps Providers
 10,000 Steps Working Paper Series Paper 2: Audit of 10,000 Steps Providers Kelly Joyner Research Associate 10,000 Steps Central Queensland University For information on physical activity and 10,000 Steps
The Value of Cycle Tourism
 The Value of Cycle Tourism Opportunities for the Scottish economy SUMMARY REPORT Ivan Zovko June 2013 www.scottishviewpoint.com Executive Summary BACKGROUND, SCOPE AND PURPOSE OF THE REPORT This report
INDEPENDENT EVALUATION GROUP - IFC APPROACH PAPER
 82211 INDEPENDENT EVALUATION GROUP - IFC Evaluation of IFC s Private Enterprise Partnership Technical Assistance Program in the Former Soviet Union (PEP study). APPROACH PAPER A. Introduction 1. This evaluation
INTERNATIONAL GOLF TRAVEL MARKET 2017
 INTERNATIONAL GOLF TRAVEL MARKET 2017 EUROPEAN GOLF TOURISM TRENDS & SPOTLIGHT ON FRANCE ORGANISED BY REED TRAVEL EXHIBITIONS 15/3/1815/3/18 IGTM 2017 EUROPEAN GOLFER SURVEY Background: With the partnership
A STUDY ON EQUESTRIAN TOURISTS MOTIVATION AND INVOLVEMENT
 A STUDY ON EQUESTRIAN TOURISTS MOTIVATION AND INVOLVEMENT Jie Wu (Ph.D. Student) The University of Hull, UK 1 EAAP-64 th Annual Conference, Nantes, France 27 th August, 2013 OUTLINE Introduction 1.Theoretical
Thursday 18 th January Cambridgeshire Travel Survey Presentation to the Greater Cambridge Partnership Joint Assembly
 Thursday 18 th January 2018 Cambridgeshire Travel Survey Presentation to the Greater Cambridge Partnership Joint Assembly Contents 1. Study Background 2. Methodology 3. Key Findings An opportunity for
COPENHAGEN HALF MARATHON 2016 A PARTICIPANT SURVEY
 COPENHAGEN HALF MARATHON 2016 A PARTICIPANT SURVEY 1 CONTENT INTRODUCTION... 3 BACKGROUND... 3 FACTS... 3 PURPOSE... 3 KEY FINDINGS & PERSPECTIVE... 5 GREAT SATISFACTION AMONGST PARTICIPANTS AT CPH HALF...
BRIEFING PAPER 29 FINDINGS SERIES. Children s travel to school are we moving in the right direction?
 BRIEFING PAPER 29 FINDINGS SERIES Children s travel to school are we moving in the right direction? February 2011 FINDINGS SERIES 29 BRIEFING PAPER KEY FINDINGS National surveys show that while the level
Living Streets response to the Draft London Plan
 Living Streets response to the Draft London Plan Contents Living Streets response to the Draft London Plan... 1 About Living Streets... 2 Summary... 2 Consultation response... 3 Chapter 1: Planning London
GOLF TOURISM IN NORTHERN IRELAND Results Presentation February 2017
 GOLF TOURISM IN NORTHERN IRELAND 2016 Results Presentation February 2017 STATE OF GOLF IN THE UK April 5, 2017 ROUNDS PLAYED YEAR TO DATE - NATIONAL Average number of Rounds Played per course in each month
Contents WALKING HOCKEY
 WALKING 1 Contents About This Guide Benefits of Delivering Walking Hockey Preparing for Sessions Club Analysis Area Analysis Financial Analysis Generating Support for the Club Target Group(s) Recruiting
Golfers in Colorado: The Role of Golf in Recreational and Tourism Lifestyles and Expenditures
 Golfers in Colorado: The Role of Golf in Recreational and Tourism Lifestyles and Expenditures by Josh Wilson, Phil Watson, Dawn Thilmany and Steve Davies Graduate Research Assistants, Associate Professor
TYPES OF CYCLING. Figure 1: Types of Cycling by Gender (Actual) Figure 2: Types of Cycling by Gender (%) 65% Chi-squared significance test results 65%
 Figure 2: Types of Cycling by Gender (%) 65% Chi-squared significance test results 65%") TYPES OF CYCLING 1,980 responses were received to this question (multiple answers were allowed), 727 female (41%) and 1,242 (71%) from male respondents. The most common responses for both genders were
TYPES OF CYCLING 1,980 responses were received to this question (multiple answers were allowed), 727 female (41%) and 1,242 (71%) from male respondents. The most common responses for both genders were
A journey of inspiration and opportunity
 Our vision for women s cycling 2013-2020 1 A journey of inspiration and opportunity Our vision for women s cycling 2013-2020 Supported by 2 A Journey of Inspiration and Opportunity Our vision for women
Cycle traffic and the Strategic Road Network. Sandra Brown, Team Leader, Safer Roads- Design
 Cycle traffic and the Strategic Road Network Sandra Brown, Team Leader, Safer Roads- Design Highways England A Government owned Strategic Highways Company Department for Transport Road Investment Strategy
DOE Climate Change Proposals
 DOE Climate Change Proposals Sustrans response to Proposals for Taking Forward NI Climate Change Legislation January 2016 About Sustrans Sustrans makes smarter travel choices possible, desirable and inevitable.
Elm Park Tennis Vision Committee Report
 Elm Park Tennis Vision Committee Report 0 Contents 1. Club Vision and Goals... 2 2. Constituent Parts... 3 3. Survey overview... 4 4. Director of Tennis Role... 6 5. Facilities... 7 6. Membership and Adult
CENTRAL OTAGO DISTRICT COUNCIL
 CENTRAL OTAGO DISTRICT COUNCIL DATE: 1 December, 2008 SUBJECT: Blossom Festival Research Survey Report 2008 (EDT 01-02-11) Purpose The purpose of this report is to summarise the outcomes of a visitor survey
Economic Impact Study: NFL International Series London, 28 October 2012
 LONDON & PARTNERS Economic Impact Study: NFL International Series London, 28 October 2012 December 2012 LONDON & PARTNERS ECONOMIC IMPACT STUDY NFL INTERNATIONAL SERIES LONDON, 28 OCTOBER 2012 DECEMBER
Executive Summary. TUCSON TRANSIT ON BOARD ORIGIN AND DESTINATION SURVEY Conducted October City of Tucson Department of Transportation
 Executive Summary TUCSON TRANSIT ON BOARD ORIGIN AND DESTINATION SURVEY Conducted October 2004 Prepared for: City of Tucson Department of Transportation May 2005 TUCSON TRANSIT ON BOARD ORIGIN AND DESTINATION
A SURVEY OF 1997 COLORADO ANGLERS AND THEIR WILLINGNESS TO PAY INCREASED LICENSE FEES
 Executive Summary of research titled A SURVEY OF 1997 COLORADO ANGLERS AND THEIR WILLINGNESS TO PAY INCREASED LICENSE FEES Conducted by USDA Forest Service Rocky Mountain Research Station Fort Collins,
Determining bicycle infrastructure preferences A case study of Dublin
 *Manuscript Click here to view linked References 1 Determining bicycle infrastructure preferences A case study of Dublin Brian Caulfield 1, Elaine Brick 2, Orla Thérèse McCarthy 1 1 Department of Civil,
Oregon State Lottery Behavior & Attitude Tracking Study
 Oregon State Lottery Behavior & Attitude Tracking Study Presentation of Findings November 2012 Wave Prepared by: Topics Covered Brief Overview of Objectives and Methodology Key Trends Related to: Attitudes
APPENDIX 3: EAGLECREST MASTER PLAN PUBLIC OPINION SURVEYS
 APPENDIX 3: EAGLECREST MASTER PLAN PUBLIC OPINION SURVEYS Eaglecrest Master Plan Public Opinion Surveys Prepared for Eaglecrest Ski Area Board of Directors Prepared by McDowell Group Inc. Eaglecrest Master
Segmentation of Current, Lapsed and Latent Golfers England Golf Annual Conference and Awards Segmentation Workshop
 Segmentation of, Lapsed and Latent Golfers England Golf Annual Conference and Awards Segmentation Workshop Hazel Fletcher April 2015 Contents Why undertake a segmentation? What will the outputs be? How
RESEARCH Massachusetts Recreational Boater Survey. Project Summary
 Coastal and Marine Spatial Planning RESEARCH Project Summary 2010 Massachusetts Recreational Boater Survey The 2010 Massachusetts Recreational Boater Survey gathered spatial and economic data relating
London Organising Committee of the Olympic Games and Paralympic Games. 14 June 2010
 London Organising Committee of the Olympic Games and Paralympic Games 14 June 2010 London 2012 Olympic and Paralympic Games Volunteer Protocol Title This document shall be known as the London 2012 Olympic
Investment in Active Transport Survey
 Investment in Active Transport Survey KEY FINDINGS 3 METHODOLOGY 7 CYCLING INFRASTRUCTURE 8 Riding a bike 9 Reasons for riding a bike 9 Mainly ride on 10 Comfortable riding on 10 Rating of cycling infrastructure
Summary Asset transfer from Oxfordshire County Council to the club to provide a dedicated boxing facility. Oxford Boxing Academy
 Inspired Facilities Oxford Boxing Academy CASE STUDY THEMES Boxing Asset transfer Increasing opportunities for participation Partnership working PROJECT SUMMARY Summary Asset transfer from Oxfordshire
Report Subject: Boxing participation and social class
 Report Subject: Boxing participation and social class briefing paper Background For many years, research has highlighted variations in the levels of sports participation across different socioeconomic
Rural Economy and Connectivity Committee. Restricted Roads (20mph Speed Limit) (Scotland) Bill: Key Themes Arising from the Online Survey
 (Scotland) Bill: Key Themes Arising from the Online Survey") Rural Economy and Connectivity Committee Restricted Roads (20mph Speed Limit) (Scotland) Bill: Key Themes Arising from the Online Survey Introduction On Friday 9 November 2018, the Rural Economy and Connectivity
Rural Economy and Connectivity Committee Restricted Roads (20mph Speed Limit) (Scotland) Bill: Key Themes Arising from the Online Survey Introduction On Friday 9 November 2018, the Rural Economy and Connectivity
STUDY BACKGROUND. Trends in NCAA Student-Athlete Gambling Behaviors and Attitudes. Executive Summary
 STUDY BACKGROUND Trends in NCAA Student-Athlete Gambling Behaviors and Attitudes Executive Summary November 2017 Overall rates of gambling among NCAA men have decreased. Fifty-five percent of men in the
Our journey a 20 year Transport Manifesto for the North East
 Our journey a 20 year Transport Manifesto for the North East Sustrans submission to North East Combined Authority (NECA). March 2016 Summary Sustrans is a leading UK charity enabling people to travel by
U.S. Bicycling Participation Study
 U.S. Bicycling Participation Study Report of findings from the 2016 survey Conducted by Corona Insights Commissioned by PeopleForBikes Released July 2017 Table of Contents Background and Objectives 3 Research
Charity Advertising. and Fundraising Packages. The UK s favourite outdoor swim series
 The UK s favourite outdoor swim series Charity Advertising and Fundraising Packages 2012 1 Table of Contents 1. Background & Information Company Background... 3 Background on Great Swim... 3 British Gas
Cobb Community Transit
 Cobb Community Transit Ridership Survey January 2014 1 Methodology Paper survey of 315 CCT riders 165 on local routes (margin of sampling error: ± 7.6%) 150 on express routes (margin of sampling error:
DEPARTMENT OF FISHERIES. COMMUNITY PERCEPTIONS RESEARCH May 2013
 DEPARTMENT OF FISHERIES COMMUNITY PERCEPTIONS RESEARCH May 2013 This page has been intentionally left blank for double-sided printing. CONTENTS RECAPPING THE OBJECTIVES... 4 METHODOLOGY... 5 TESTS OF STATISTICAL
The Fight for Runners Recreational Dollar
 The Fight for Runners Recreational Dollar Why Your Event Needs to be Different Household Income Flat Entry Fees on the Rise Proliferation of Fitness Activities According to the 2015 National Runner Survey
The 2006 Economic Benefits of Hunting, Fishing and Wildlife Watching in TEXAS. Prepared by:
 The 2006 Economic Benefits of Hunting, Fishing and Wildlife Watching in TEXAS Prepared by: Southwick Associates, Inc. P.O. Box 6435 Fernandina Beach, FL 32035 Ph (904) 277-9765 Fax (904) 261-1145 Email:
Onsite fan research FIFA Marketing Research Onsite fan Research
 6 7 Onsite fan Onsite fan research With hundreds of thousands of football fans from around the world making their way to for the FIFA World Cup it was crucial to gain insights into the fans experiences
Big Blue Adventure Event Analysis UTC Tourism Center October 2016
 A report summarizing Big Blue Adventure events economic impact on the Lake Tahoe region as well as participants assessments of their event experience Big Blue Adventure Event Analysis UTC Tourism Center
Glasgow City Council. Evaluation of Glasgow s School Bus Signage Pilot - Final Report
 Glasgow City Council Evaluation of Glasgow s School Bus Signage Pilot - Final Report September 2015 Contents Executive Summary... i 1. Introduction... 1 2. Driver experiences... 5 3. Bus company experiences...
This objective implies that all population groups should find walking appealing, and that it is made easier for them to walk more on a daily basis.
 Walking for life The Norwegian Walking Strategy Guro Berge Norwegian public Roads Administration "Walking for life" is the slogan for the National Walking Strategy that is now being formulated in Norway.
THE IMPACT OF DOING NOTHING Stewart Darling Non-Executive Director
 THE IMPACT OF DOING NOTHING Stewart Darling Non-Executive Director The golfing landscape is a challenging one The golfing landscape is a challenging one Membership Decline Full Golf Members - Actual Members
Bus and Transit Lane Review Update
 Board Meeting / 25 February 2013 Agenda Item no.8(i) Bus and Transit Lane Review Update Glossary Auckland Transport New Zealand Transport Agency Transit Two Transit Three (AT) (NZTA) (T2) (T3) Executive
Community Development and Recreation Committee. General Manager, Parks, Forestry and Recreation. P:\2015\Cluster A\PFR\CD AFS#22685
 CD10.2 STAFF REPORT ACTION REQUIRED City of Toronto Outdoor Tennis Operations Date: February 19, 2016 To: From: Wards: Reference Number: Community Development and Recreation Committee General Manager,