FHWA-SA September 2004 Technical Report. Pedestrian Safety in Native America
|
|
|
- Lester Parsons
- 6 years ago
- Views:
Transcription
1 FHWA-SA September 2004 Technical Report Pedestrian Safety in Native America
2 This publication is distributed by the U.S. Department of Transportation, Federal Highway Administration. The opinions, findings and conclusions expressed in this publication are those of the author(s) and not necessarily those of the Department of Transportation or the National Highway Traffic Safety Administration. The United States Government assumes no liability for its contents or use thereof. If trade or manufacturers names or products are mentioned, it is only because they are considered essential to the object of the publication and should not be construed as an endorsement. The United States Government does not endorse products or manufacturers.
3 1. Report No. FHWA-SA Technical Report Documentation Page 2. Government Accession No. 3. Recipient's Catalog No. 4. Title and Subtitle Pedestrian Safety in Indian Country 5. Report Date September Performing Organization Code 7. Written By J. LaValley, C.S. Crandall, D. P. Sklar and L. Banks 9. Performing Organization Name and Address Department of Emergency Medicine MSC University of New Mexico School of Medicine Albuquerque, NM Sponsoring Agency Name and Address Federal Highway Administration Office of Safety 400 Seventh Street SW Washington, DC Performing Organization Report No. 10. Work Unit No. 11. Contract or Grant No. 13. Type of Report and Period Covered Research: 14. Sponsoring Agency Code 15. Supplementary Notes AOTR: D. Smith (HSA-30); T. Redmon (HSA-20); 16. Abstract American Indians have the highest rates of pedestrian injury and death per capita of any racial or ethnic group in the United States. Data from the National Highway Traffic Safety Administration, Fatality Analysis and Reporting System and the National Center for Health Statistics, Web-Based Injury Surveillance and Reporting System were analyzed to typify crashes among American Indians in the United States. Contributing factors such as alcohol involvement on the part of the pedestrian or driver, rurality, poverty and lack visibility and traffic control devices were identified. Relative rates of pedestrian injury were calculated as a measure of risk disparity between the American Indian population in each state and all other races. States with elevated disparity between comparison groups also had large percentages of American Indians living below the poverty level. Additionally, gaps in injury surveillance data among American Indians were identified. American Indian communities require community specific injury prevention intervention activities for community specific pedestrian safety problems. Focus groups conducted during the study period identified successful strategies for addressing pedestrian injury among American Indian communities. Successful strategies identified included education and media based interventions, law enforcement interventions, child education, and pedestrian facility improvements. 17. Key Word Crashes, FARS, American Indians, pedestrian, highways, safety 19. Security Classif. (of this report) Unclassified 20. Security Classif. (of this page) Unclassified Form DOT F (8-72) Reproduction of completed page authorized 18. Distribution Statement No restriction. This document is available from the research sponsor No. of Pages Price 1
4 TABLE OF CONTENTS Executive Summary... 1 Introduction... 2 Quantitative Results:...3 Introduction... 3 Methods... 5 Data Limitations... 5 The Typical AI/AN Pedestrian Fatality... 6 The Who, What, When, Where, and Why of AI/AN Pedestrian Crashes... 6 Who... 6 What... 7 When Where Rural and Urban Pedestrian Fatalities Cross-Cutting Issues Conclusion Qualitative Results Introduction Methods Results Conclusion Successful Approaches to Coordinated Pedestrian Safety Programs Introduction Education Enforcement Engineering Community-Based Interventions FHWA/NHTSA Pedestrian Roadmaps to Success Examples of Success i
5 Executive Summary American Indians have the highest rates of pedestrian injury and death per capita of any racial or ethnic group in the United States. Data from the National Highway Traffic Safety Administration, Fatality Analysis and Reporting System and the National Center for Health Statistics, Web-Based Injury Surveillance and Reporting System were analyzed to typify crashes among American Indians in the United States. Contributing factors such as alcohol involvement on the part of the pedestrian or driver, rurality, poverty and lack visibility and traffic control devices were identified. Relative rates of pedestrian injury were calculated as a measure of risk disparity between the American Indian population in each state and all other races. States with elevated disparity between comparison groups also had large percentages of American Indians living below the poverty level. Additionally, gaps in injury surveillance data among American Indians were identified. Gaps included lack of centralized tribal police department reporting, and lack of centralized Office of the Medical Investigator. American Indian communities require community specific injury prevention intervention activities for community specific pedestrian safety problems. Focus groups conducted during the study period identified successful strategies for addressing pedestrian injury among American Indian communities. Successful strategies identified included education and media based interventions, law enforcement interventions, child education, and pedestrian facility improvements. Specific roles in coordinating such interventions were indicated for professionals and community members. Assistance needs were also identified by focus group respondents who were currently engaged in American Indian specific pedestrian safety interventions. These needs included written assistance with injury data and educational materials among others. 1
6 Introduction In the United States motor-vehicle crashes are a major public health concern for American Indian/Alaskan Natives (AI/AN). The leading cause of death for AI/AN between 10 and 64 years is a motor vehicle crash; the fourth leading cause of death for AI/AN is a pedestrian crash. In 2001, the age adjusted-pedestrian crash mortality rate as reported by CDC WISQARS (latest data entry) was 3.9 per 100,000 population for AI/AN, significantly higher than the national age-adjusted mortality rate of States which have the highest percentages of American Indians also have the highest rates of pedestrian death. The most rural American Indian communities have the highest rates of pedestrian death in the United States. As compared to crashes between motor vehicles, crashes involving a pedestrian are more likely to lead to death or severe disability due to the huge disparity in mass between a pedestrian and motor vehicle and the high speeds of the motor vehicles. While less than 3% of motor vehicle crashes result in death for American Indians, nearly 30% of pedestrian crashes are fatal. Unlike motor vehicle crashes, where protection of occupants with seat belts and airbags may reduce the effect of the crash, pedestrians can not be easily protected as they are struck by a motor vehicle. National strategies for reducing both the disproportionate risk among AI/AN pedestrians and at preventing pedestrian crashes have focused on three primary activities: 1) performing basic injury research and surveillance; 2) creating community partnerships to address local pedestrian problems, and 3) increasing the public awareness surrounding this important public health issue. Many of the major improvements to the nation s health have been accomplished using a public health approach. This approach involves identifying risk factors and developing appropriate measures that address the risks. Measures may include institutional changes, education, engineering, and environmental redesign, or legal changes. Examples include the construction of sewers, required immunizations, development of food service regulations, and passive restraint systems in automobiles. The trend in the United States is moving toward preventing health problems, including injury, rather than simply treating them. As the understanding of injuries and their prevention is clarified, it becomes known that injuries can be studied just as diseases are. Hence, by charting their occurrence, identifying those at-risk and developing interventions to prevent injury, we can reduce death and disability from many types of injuries, including pedestrian crashes. Through the course of this document, we describe the epidemiology of American Indian pedestrian injury and then identify possible prevention options and implementation strategies. Finally, we describe known successes and recommend next steps for prevention of pedestrian injuries for American Indian communities. 2
7 Quantitative Results: The Epidemiology of AI/AN Pedestrian Crashes Introduction Understanding the details and characteristics surrounding pedestrian crashes is key to planning effective prevention strategies. Many factors are associated with the risk of being involved in a pedestrian crash. Pedestrian and motorist demographics, pedestrian and motorist behavior, and roadway characteristics all impact the risk to a pedestrian. Increased pedestrian crash risk has been associated with rural areas, areas of low income, reduced levels of education, proximity to bars, alcohol intoxication, roadway speed, selfreported alcohol abuse, and other roadway characteristics such as road design, traffic controls, and lighting (Campos-Outcalt, 1997). Other factors that play a contributory role include roadway type and characteristics, motorist and pedestrian behavior, and protective ordinances and laws pertaining to the pedestrian. Understanding the who, what, when, where and why of pedestrian crashes which involve American Indians should help to target activities and identify at-risk populations for educational and other prevention strategies. For this report, factors contributing to fatal pedestrian crashes obtained from the national injury surveillance data were examined to determine the contributing factors associated with these elevated rates of pedestrian fatalities. These contributing factors can be divided into three principle categories: 1) human behavior, on part of the driver or pedestrian; 2) demographic characteristics, such as alcohol usage patterns and poverty; and 3) roadway design and functionality. Although AI/AN pedestrian fatality rates remain consistently higher than those for all other race and ethnic groups, they have been decreasing over the last decade. Figure 1 illustrates the changes in the age-adjusted fatality rate over time from 1990 to the present (CDC, WISQARS latest data entry). States which have high rates of pedestrian injury and death tend to have AI/AN populations that have elevated rates of injury and death. Nationally, there is a disparity between the age-adjusted pedestrian fatality rates among AI/AN when compared to other races. Table 1 compares the relative rates of AI/AN pedestrian fatality per 100,000 population to all other races by state for States with a high level of racial disparity (elevated relative rates) for pedestrian injury also have elevated measures of poverty (% AI/AN living below poverty) and increased rurality (persons per square mile). 3
8 Figure 1. Age Adjusted Fatality Rate per 100,000 Population, Source: WISQARS Latest Data Entry AI/AN All Races There are many factors that influence pedestrian crash risk. There are issues of roadway design, pedestrian behavior, driver behavior, and environmental conditions that combine to result in a crash. In addition, there are issues of availability of medical care that may impact injury severity and lethality of pedestrian crashes. These factors are both predictable and preventable but also require the investment of resources. Alcohol affects pedestrian behavior and driver behavior and is a co-factor in as many as 56.3% of adult pedestrian deaths of Native Americans. Rurality and low income levels are commonly associated with increased risk of pedestrian injury. Lower income groups tend to drive less and walk more, thus increasing exposure and increasing relative risk. Table 1. U.S. AI/AN Pedestrian Fatality Rate, Source: FARS State Alaska Arizona Colorado Florida Georgia Michigan Minnesota Nebraska Nevada New Mexico North Carolina Oklahoma Oregon South Dakota Tennessee Washington Wyoming Average Rate/100,000 Population
9 Methods Demographic data were obtained from a number of national organizations and institutions to illustrate important characteristics of the AI/AN population in the United States. Data sources included the United States Census Bureau, the Bureau of Indian Affairs, Indian Health Service, and the Substance Abuse and Mental Health Administration. Data elements related to population characteristics were acquired from these agencies for each of the 585 United States American Indian / Alaskan Native Tribes and all 50 states. These data elements included tribal registry, tribal population by both age and gender, poverty rates, unemployment rates, and self-reported rates of alcohol use and abuse. Pedestrian crash data involving AI/ANs that resulted in fatalities were also obtained from a number of sources. AI/AN pedestrian fatalities were obtained from the National Highway Traffic Safety Administration Fatality Analysis and Reporting System (FARS), the Centers for Disease Control National Center for Injury Prevention and Control (WISQARS), and vital statistics death record data which were collected from all 50 states. Data elements collected included crash characteristics, roadway characteristics, and demographic information. Finally, crash data involving AI/AN pedestrian fatalities were obtained from state Departments of Transportation for fatal pedestrian crashes which occurred in the eleven states targeted for investigation by project staff. States for which fatal crash characteristics were collected included: Arizona, New Mexico, Utah, Minnesota, Mississippi, Montana, Oregon, South Dakota, and Wyoming. Data elements included crash characteristics, roadway characteristics, and demographic information. Data Limitations The NHTSA FARS database has limited reporting with regards to pedestrian race. Although the reporting of race has improved phenomenally within the past few years, almost 12% of records still lack information regarding race and ethnic background. For these analyses, these records were removed. In addition, counts of American Indian fatalities by state differ between the FARS records and records retrieved from state vital records. FARS counts and the associated CDC WISQARS counts ranged from 2% - 32% fewer than those counts reported by state vital records. States for which the aforementioned was true included those states which used a centrally-based Office of the Medical Investigator (State Coroner) to produce death certificates. Within the majority of these states, the centralized Office of the Medical Investigator performs autopsies and physical examinations for tribal entities on contract. Sometimes these death investigations are reported and included in national fatality counts, sometimes they are not. Hence, data regarding AI/AN pedestrian fatality is limited and probably undercounts to some degree the incidence of fatality. 5
10 The Typical AI/AN Pedestrian Fatality The typical AI/AN pedestrian fatality in the United States in 2003 occurred in a rural area, in the months of summer on a Saturday between 9:00 PM and 6:00 AM. The road was an undivided two lane major rural collector, at a non-intersection location, without a crosswalk, with no traffic controls (82%) present, no street lights (50%) and vehicle speeds over 50 mph (74%). This incident most frequently involved males 35 to 39 years of age. The top contributing factors in these crashes were pedestrian in roadway (84%) and pedestrian not visible (19%). The pedestrian had consumed alcohol in 56.3% of these crashes. The mean blood alcohol concentration (BAC) of these pedestrian fatalities was 0.23 mg/dl. The Who, What, When, Where, and Why of AI/AN Pedestrian Crashes Who In the United States, the main at-risk group for pedestrian fatalities among American Indians is male adults between the ages of 35 and 49 years (61% of all fatal AI/AN crashes). Figure 2 illustrates the AI/AN pedestrian fatality distribution by age and sex in Differences in age and sex distribution among AI/AN fatalities emerge when comparing these distributions among roadway classifications and among rural and urban locations. AI/AN pedestrian fatalities that occur on an interstate or state highway segment characteristically involve more males with peaks at the and age groups. AI/AN pedestrian fatalities occurring on municipal or county roads tend to follow the national age and sex distribution for pedestrian injury, highlighting the at-risk group. Additionally, Figure 3 illustrates the age and sex distribution of the driver or drivers that were involved in fatal AI/AN pedestrian crashes. Younger drivers tend to be more involved in AI/AN pedestrian crashes than older drivers. Figure 2. AI/AN Pedestrian Fatality Distribution by Age and Sex, Source: FARS Women Men Age Gr oup Age Gr oup
11 Figure 3. Driver Characteristics of AI/AN Fatal Pedestrian Crashes. Source: FARS Women Men Age Group Age Group What Environmental factors such as roadway characteristics also are associated with increased risk. Rural communities are at higher risk and tend to have fewer traffic control devices, fewer lights, higher vehicle speeds, higher vehicle traffic flows, lowered pedestrian traffic flows, and limited pedestrian facilities. These factors all contribute to increased danger for the American Indian pedestrian. Lack of sidewalks or other pedestrian facilities reduce the separation of pedestrians from traffic, putting pedestrians at significant risk both within villages and towns and along rural highways where high speeds guarantee a fatal outcome when a crash occurs. Table 2 shows pedestrian fatalities by roadway characteristics for AI/AN pedestrian, for The urban principal is the roadway class where many fatal AI/AN pedestrian crashes occur, followed by the rural arterial roadway, the rural collector and local rural roads and streets arterial. The urban principal arterial is a roadway designed for the high volumes of people at high speeds for long travel distances which is minimally interrupted. At higher speeds the probability of an AI/AN being killed in a vehicle collision is significantly greater than on local roads. This is reflected in the data which shows that over 50% of all AI/AN pedestrian fatalities occur on roads with speeds limits greater than 50 mph. The route variable depicts who is responsible for the up-keep and functionality of the road. For AI/AN, the most often fatal roadway type (route variable) is a State Highway (for non-ai/an, the most deadly is municipality). 7
12 Table 2. Roadway Characteristics for AI/AN Fatal Pedestrian Crashes (FPC), Source: FARS. Traffic Control Devices No Controls Traffic Control Signal STOP Sign YIELD Sign Other Regulatory or Warning Sign Roadway Profile Level Grade Hillcrest/Sag Lanes of Travel 1-2 Lanes 3.-4 Lanes 5 or More Lanes Traffic Way Flow Undivided (Two way Traffic) Median No Barrier (Divided Highway) Median With Barrier (Divided Highway) Reservation Jurisdiction Yes No Artificial Lighting (Relating to Nighttime Crashes) Present No AI/AN FPC (%) Traffic controls are devices used to control traffic flow and improve roadway safety. These devices can include posted speed limit signs, stop lights, pedestrian warning signs, and other signs with safety information. Most AI/AN and all other ethnic group pedestrian fatalities occur at locations in which there were no traffic controls (81%). This perhaps underscores the importance of such devices in the prevention of pedestrian fatalities. Other roadway characteristics such as the width of the road, or number of lanes, trafficway flow, and lighting are physical components that make the crash location more or less dangerous for pedestrians. During the analyses of FARS data, it was found that undivided, unlit, two lane roads are the most dangerous for AI/AN pedestrians, representing 76% of all AI/AN fatalities. It should be noted that both AI/AN and all other races fatal pedestrian crashes seldom occur in road construction or maintenance zones. Human behaviors which have been previously associated with elevated rates of pedestrian fatality have included alcohol consumption, pedestrian and motorist interactions, risk taking behaviors associated with young adult males, and the inability of children under the age of 10 to make safe and accurate decisions about crossing traffic 8
13 alone. Inter-community transportation choices represent a unique behavior that might also contribute to elevated injury and fatality rates for AI/AN. Patterns associated with drinking such as proximity of pedestrian crashes to bars have also been identified. Alcohol consumption is a variable associated with pedestrian crashes whether it is on the part of the pedestrian or the driver of the motor vehicle. Alcohol-involved pedestrian fatalities occur more frequently among AI/AN than all other races. FARS data suggests that alcohol was involved in 56.3% of AI/AN pedestrian fatalities, while non-ai/an pedestrian fatalities involved alcohol only 31% of the time. More urban AI/AN pedestrian fatalities involved alcohol than rural pedestrian fatalities (75% vs. 68%). In addition, the mean BAC of intoxicated AI/AN pedestrian fatalities remains significantly higher than the mean BAC of intoxication among all other pedestrian fatalities, (0.23 vs ). Certain age- and sex-related groups that emerge as important groups for alcohol related pedestrian crash prevention activities are illustrated in the following figures, which outline the age and sex distribution for those crashes which indicated some level of pedestrian and driver alcohol involvement. These groups include males aged and and females aged years. Figure 4. BAC Levels for Alcohol Involved AI/AN Pedestrian Fatalities, Source: FARS Women Men <4 <4 Age Group Age Group
14 Figure 5. Drinking Driver Characteristics of AI/AN Fatal Pedestrian Crashes. Source: FARS Women Age Group Men Age Group Other factors that contribute to pedestrian injury in Native America include motorist and pedestrian behavior. Motorist behaviors that can contribute to a fatal pedestrian crash include motorist speeding and lack of compliance with traffic laws. Pedestrian behaviors that contribute to pedestrian injury among AI/AN include pedestrian lack of visibility, alcohol use, inattention, and walking within the roadway. Such behaviors contribute to elevated American Indian pedestrian crash rates. Inattention in young children and improper crossing behavior often result in pedestrian injury. Children under the age of eight, who cross streets alone, are more often involved in crashes. Children at this age are unlikely to cross streets safely and correctly. Other pedestrian behaviors that increase the risk of injury include the use of state and federal highways as corridors for intercommunity pedestrian travel, often combined with hitchhiking both on and off reservation. Finally, drinking behavior among American Indian males contributes significantly both to the occurrence and lethality of pedestrian crashes. Large proportions of American Indian males involved in fatal pedestrian crashes were drinking prior to their crash (58.5%). An even larger population of AI/AN females involved in fatal pedestrian crashes were also drinking prior to their crash (72.7%). This appears to be an emerging trend and have significant consequences even outside of the pedestrian safety area. Many fatalities occur near bars in cities and towns, as well as bars located along highways near reservations because of liquor sale restrictions on reservation. Blood Alcohol Concentrations (BAC) of American Indians involved in fatal crashes are quite high. Compared to the national standard BAC for a legally intoxicated driver of 0.08 mg/dl, American Indian pedestrian fatalities in 2003 had a mean BAC of 0.23 mg/dl, suggesting a high level of impairment associated with the pedestrian. 10
15 When Pedestrian crashes among American Indians occur most commonly at night. Early evening and late night pedestrian crashes are usually associated with drinking behaviors and pedestrian visibility, though daytime pedestrian injuries are common among children and the elderly. Table 3 compares the time of day AI/AN pedestrian crashes occurred. Most rural pedestrian fatalities occurred in the dark (73.5%), while the majority of urban pedestrian crashes occurred in the daylight (41%). Lack of visibility of pedestrians often contributes to both frequency and severity of pedestrian injury. The effect of visibility on pedestrian crash risk is compounded in rural areas and along higher speed rural highways. Pedestrian fatalities occur more frequently during the weekends (Friday and Saturday 44.7%) than the normal work week. Table 3. Time of Day, AI/AN Fatal Pedestrian Crashes, AI/AN Crashes (%) Time of Day Dark Dark but Lighted Daylight Dusk/Dawn Where Nationally, American Indian pedestrian crashes occur most frequently in rural areas both on and off tribal lands. States with larger populations of American Indians and Alaskan Natives are also the states which have higher rates of AI/AN pedestrian fatality. These states as shown in Table 4 include: South Dakota, Arizona, North Carolina and Washington. In every comparison, AI/AN crude and age-adjusted fatality rates were higher for AI/AN than other ethnic groups. Rural states with larger AI/AN populations emerged as having higher rates of AI/AN pedestrian fatality. Table 4 U.S. AI/AN Pedestrian Fatality Rate, Source: FARS State Arizona North Carolina South Dakota Tennessee Washington Wyoming Rate/100,000 Population

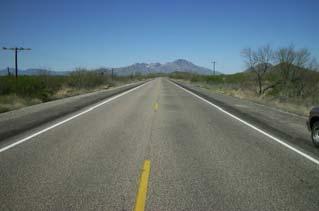
16 Figure 6. Typical High Speed Rural Highways (No signing or other pedestrian facilities) Crash locations within states were analyzed using FARS data. Perhaps most numerous and lethal are the AI/AN pedestrian crashes which occur along one to two lane segments of undivided high-speed urban and rural highways. These urban highway pedestrian crashes account for 35.6% of the American Indian pedestrian fatalities in These crashes often cluster around rural towns and tribal communities that are bisected by these high-speed highways. Similar to pedestrian crashes in urban areas, American Indian pedestrian crashes occur more frequently near bars, in areas that lack pedestrian facilities. The rural highway pedestrian crashes account for 27.5% of the AI/AN pedestrian fatalities in Sidewalks are often absent on the largely rural roadways that are between villages or cities yet lead to important reservation areas. Finally, the locations of these crashes are often distant from medical care leading to delays in emergency treatment. Table 5. Location of Fatal AI/AN Fatal Pedestrian Crashes in US, Source: FARS. AI/AN Crashes (%) Roadway Class Rural Arterial Rural Collector Urban Arterial Rural Local Road/Street Rural Interstate Urban Interstate Urban Collector Urban Local Road/Street Motorist and pedestrian interaction is another important contributing factor in fatal pedestrian crashes. Pedestrian behavioral elements were investigated by analyzing relationship to roadway information found in the FARS data. For AI/AN fatal pedestrian crashes, the location of the vehicle (motorist) involved in the pedestrian crash was most often the roadway - 94% of all fatalities. Similarly, non-ai/an motorists are also primarily on the roadway when they collide with pedestrians (89.8%). The significance of these statistics is that motorists seldom strike AI/ANs who are on the median or sidewalks. It should be noted however that 2.5% of AI/AN pedestrian fatalities occurred on the shoulder or the roadside of a highway. 12
17 Pedestrian location with respect to roadway describes the location where the pedestrian was struck. The most common location in an AI/AN pedestrian fatality is in the roadway, at a non-intersection (67.8%) - a significantly higher percentage than all other pedestrian fatalities. Table 6 compares non-motorist location for AI/AN pedestrian fatalities in relation to roadway and functions. Table 6. Relation to Roadway for AI/AN Fatal Pedestrian Crashes, Source: FARS. AI/AN Crashes (%) Relation to Roadway On Roadway On Shoulder Roadside Other Relation to Junction Non Intersection Intersection Related Interchange Related Unknown Rural and Urban Pedestrian Fatalities Nationally, rural pedestrian crashes are more often fatal than urban crashes. This is often due to higher vehicle speeds associated with rural areas as well as longer travel distances to medical care for those pedestrians who survive their crash. There are more rural pedestrian fatalities among AI/AN than all other race and ethnic groups. Because AI/AN pedestrian fatalities occur in both urban and rural settings at rates that exceed those of other races/ethnicities, it is possible that the high overall AI/AN pedestrian death rates mask important differences in mortality between urban and rural settings, and there might be unique issues in each setting that need to be addressed as possible preventive strategies. Again, FARS data was collected on single and multiple pedestrian crashes for 2003 for which ethnic and race information was available. Analyses were conducted to elicit characteristics of the individuals involved in the crash, driver and pedestrian, as well as characteristics of the environment surrounding the crash. Analyses compared rural to urban crash groups using the FARS definition of rurality. Data collected from the CDC WISQARS system was used to compare urban and rural fatality rates using the Census 2000 definition of rurality. Using data collected from the CDC WISQARS system, the AI/AN pedestrian fatality rate per 100,000 population was calculated for rural and urban groups. Rural locations were found to have a higher AI/AN pedestrian fatality rate per 100,000 population than urban areas (5.9 deaths vs deaths per 100,000 population ). 13
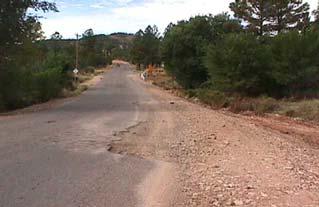
 count through central Whiteriver was 16,307 in There are 1,014 miles of IRR Systems roads on the reservation Demographics of fatal pedestrian crash victims were compared")
18 Figure 7. Typical high speed State route through Reservations. Average Daily Traffic (ADT) count through central Whiteriver was 16,307 in There are 1,014 miles of IRR Systems roads on the reservation Demographics of fatal pedestrian crash victims were compared among rural and urban crash types. Males are equally killed in urban and rural pedestrian crashes, while slightly more females are killed in rural areas than urban areas (16% vs. 10%). Rural AI/AN killed in pedestrian crashes are distributed across age categories from years. In urban areas, primarily males aged are involved in fatal pedestrian crashes. In rural areas, the principal at-risk group for AI/AN pedestrian deaths is males between and years. Figure 8 and 9, compare the pedestrian fatality for AI/AN by age and sex for urban and rural locations. Furthermore, the mean age of an AI/AN pedestrian fatality was lower among rural crashes than urban crashes (32.4 years vs years). Figure 8. Rural AI/AN Pedestrian Fatalities, Source: FARS Women Men Under Age Group Under
19 Figure 9. Urban AI/AN Pedestrian Fatalities, Source: CDC WISQARS Women Men Under 5 Under 5 Age Group Age Group Characteristics surrounding the environment of the pedestrian crash were analyzed. Differences in crash characteristics associated with fatal AI/AN pedestrian crashes in the United States during 2003 are represented in Table 7. Crash characteristics common among urban AI/AN fatalities included their occurrence within the roadway, on municipal roads and major arterials. Urban crashes were also more likely associated with a level roadway profile (85.7%), two lanes of traffic, and a clearly marked median with no barrier. Urban crashes occurred most often outside of reservation jurisdictions, in the dark, with greater alcohol involvement. Urban crashes occurred most frequently on the weekend. Rural AI/AN fatal pedestrian crashes occurred on segments of state highways and interstates, within the roadway. Rural crashes were most likely to be associated with a level roadway profile (64.4%), two lanes of traffic, and an undivided highway segment. Rural crashes tended to occur in the dark, with noted alcohol involvement on the part of either the driver or the pedestrian. Rural crashes also tended to occur most frequently on the week day. A comparison of urban to rural crash characteristics showed qualitative similarities in many categories. However, statistically significant differences in magnitude were observed between rural and urban groups in all crash characteristics except time of day, hit and run designation, and day of the week. Higher percentages of rural deaths occurred on the roadway compared to urban crashes. A higher percentage of urban pedestrian deaths showed alcohol involvement on the part of the either the driver or pedestrian. In addition to comparisons found in Table 2, presence or absence of traffic control devices between urban and rural crash sites was explored. Urban crashes more often involved artificial lighting than rural crashes (46% vs. 5.2%). Traffic control devices related to intersections were also more common among urban AI/AN pedestrian fatalities. Rural AI/AN pedestrian crash locations more often lacked crosswalks, signals, and other pedestrian facilities. 15
20 Table 7. Selected crash characteristics of AI/AN fatal pedestrian crashes, United States, Source: FARS URBAN CRASHES (%) RURAL CRASHES (%) Crash Characteristics Reservation Jurisdiction Yes No Time of Day (Crash) Dark Daylight Dawn/Dusk Dark/Lighted Alcohol Involvement (BAC>0.8) Yes No Day Of Crashes Weekday (M-TH) Weekend (F-S) Roadway Profile Level Grade Hillcrest/Sag Table 8 describes pedestrian characteristics associated with fatal crashes. Male pedestrians are overrepresented in each group (urban 80%, rural 70.4%). There was no significant difference between urban and rural groups with regards to pedestrian alcohol involvement as indicated by blood alcohol content analysis post-mortem. The top contributing factors in the crash attributed to the pedestrian for urban crashes were walking in roadway and improper crossing. The top contributing factors in the crash attributed to the pedestrian for rural pedestrian fatalities were walking in the roadway and not visible to the driver. There were significantly more male drivers involved in rural pedestrian crashes than urban crashes (70% vs.15%). The age distribution of the drivers, the state of residence of the driver, and the frequency of issued citations for the crash were not significantly different between urban and rural groups. No difference in mean age was observed among rural and urban drivers. A top contributing factor in the crash attributed to the driver in both urban and rural crashes was hit-and-run. 16
21 Table 8. Selected AI/AN pedestrian characteristics associated with fatal AI/AN pedestrian crashes, United States, Source: FARS. Pedestrian Characteristics Males Pedestrian Drinking (Males) Yes Top Contributing Factor Walking in Road Improper Crossing Not Visible to Driver Dart/Run into Road Failure to Yield Other URBAN CRASHES (%) RURAL CRASHES (%) Table 9 indicates the mean BAC for the driver and pedestrian involved in fatal AI/AN pedestrian crashes. Mean BAC was calculated using imputed BAC information. Many different BAC tests are administered to drivers, although not all drivers receive the test. Drivers sometimes refuse a BAC test, the test is not administered, or the information is missing from the data. Similarly, pedestrian crash victim BAC is also obtained, often more frequently because of coroner protocol. No significant differences between urban and rural BAC for the driver and pedestrian were observed. In 74% of rural AI/AN fatal pedestrian crashes, the vehicle speed exceeded 50 mph, compared to 22.8% of urban crashes. Table 9. Comparison of mean driver and pedestrian blood alcohol concentration for fatal AI/AN pedestrian crashes, United States, Source: FARS Pedestrian Driver Blood Alcohol Concentration (BAC) URBAN CRASHES (mean) RURAL CRASHES (mean)
22 Table 10. Selected statistics for Rural and Urban AI/AN Pedestrian Fatal Crashes, Source: FARS. Artificial Lighting Yes No (Dark) Crosswalk Present Intersection Related Crash Signalized Intersection No Controls Speed Mean Speed (mph) > 50 mph URBAN CRASHES (%) RURAL CRASHES (%) < < Cross-Cutting Issues Risk factor analyses were performed to identify those environmental characteristics that were commonly associated with fatal AI/AN pedestrian crashes. Risk factors determined as positively correlated with increased risk included population density and poverty. States with the lowest population density (rural states) and with greater than 25% of AI/AN residents reporting living below the poverty level had the highest rates of pedestrian injury. These states included New Mexico, Arizona, South Dakota, North Carolina, Wyoming, Washington, and Tennessee. Increased pedestrian injury risk associated with rurality may be attributed to the emphasis of rural state transportation enhancements on the maintenance and expansion of highways instead of pedestrian travel. Among many communities in rural states, smaller communities and area hubs are often both connected and bisected by state highway. These highways often serve as the main road through these communities hence serve as both a higher speed connection to other communities, and the center of community activities. In addition, AI/AN communities may lack coherent inter- and intra-community transit which leaves only two choices for transportation, walking/cycling along higher traffic volume highways, or driving in an automobile. Adding alcohol consumption to walking or cycling as a means of inter-community travel compounds the danger to the pedestrian. Increased pedestrian risk associated with poverty may be attributed to increased exposure. Individuals who earn lower monthly incomes spend higher percentages of their gross monthly income on transportation. Individuals living below poverty mitigate high transportation costs by using public transit, walking, or cycling. Often, the high cost of automobiles, automobile insurance, and automobile maintenance prohibits individuals from purchasing automobiles. Hence, these same individuals may walk more frequently than individuals who can afford other means of transportation. Increased walking translated into increased exposure to pedestrian crashes. In rural areas, this problem is 18

23 compounded by the lack of organized inter- and intercommunity transit. AI/AN pedestrians frequently walk along state highways as a means of intercommunity transportation both on and off the reservation. Finally, low income populations are at greater risk for all types of unintentional injury (Baker, 1992). In addition, low income populations are also at greater risk for substance abuse (Denny, 2003). As demonstrated in the review of FARS and WISQARS data, alcohol involvement is more prevalent among AI/AN pedestrian fatalities than other races. This high prevalence of alcohol involvement and the associated increased risk to the pedestrian is consistent with the extremely high percentages of AI/AN individuals living below poverty. Figure 10. U.S. Population Density Per Square Mile, Figure 11. Percentage of AI/AN Individuals Living Below Poverty,
24 Conclusion AI/AN have the highest rates of pedestrian injury among all other races in the United States. These high rates of pedestrian injury have been modestly decreasing from the 1990s, but remain over two times the rate of injury for pedestrians of all other races. States with elevated rates of AI/AN pedestrian fatality include Arizona, South Dakota and Wyoming. These states have AI/AN pedestrian fatality rates between 7 and 17 per 100,000 population. These states have certain population characteristics in common. These states are intensely rural, ranking among the lower 25th percentile for persons per square mile, and are also increasingly poor. Bureau of Indian Affairs poverty measures indicated that states with high AI/AN pedestrian fatality rates also had between 35% and 58% of AI/AN residents living below the poverty level. Extreme poverty and rurality contribute greatly to the disparity between AI/AN pedestrian injury rates and all other races. In addition to the negative effects of poverty and rurality, substance abuse and more frequent exposure to potential injury compound the danger to AI/AN. Common crash characteristics involving AI/AN pedestrians were described. Common characteristics included the crash occurring at night, in an unlit area, on a two-lane, undivided, level roadway, and off the reservation. AI/AN pedestrian crashes involved alcohol in 56.3% of fatal crashes, with a mean pedestrian BAC much higher than all other crashes. AI/AN pedestrian injury risk groups were described. Pedestrian crashes occurring among these adult males generally involve alcohol, often with high BACs. Additionally, the site of these crashes is generally along segments of state highway or interstate, at night, often occurring within the roadway. In New Mexico and Arizona, these crashes often occur off-reservation in close proximity to the reservation or off-reservation communities that serve as local centers. Often these crashes are associated with on-foot inter-community travel which occurs frequently between reservations and non-reservation communities. Sometimes, this inter-community foot travel has to do with drinking behaviors because many tribes do not sell alcohol on the reservation. Characteristics of these crashes include lack of pedestrian visibility on the roadway, alcohol involvement on part of the pedestrian or motorist, a near-reservation location, an undivided, unlit two lane high speed highway or interstate. Other identified at-risk groups included primarily male children under 13 and the elderly. Among all risk groups, males in age had the highest pedestrian fatality rates per 100,000 population. Pedestrian crashes among children and the elderly generally occur in on-reservation communities or in off-reservation municipalities. In rural communities and on-reservation communities, these crashes are associated with a lack of pedestrian facilities and other traffic control devices. AI/AN fatal pedestrian crashes which occurred at urban and rural locations were compared using CDC WISAQARS and FARS data for analysis. Using CDC WISQARS data the AI/AN pedestrian fatality rate was calculated among rural and urban groups. Rural locations had higher fatality rates per 100,000 population than urban areas (5.9 deaths vs deaths). At risk groups were compared by age and sex among urban and 20
25 rural AI/AN populations. Rural at risk groups included males years and females years. Urban at-risk groups were slightly older including males from years and females from years. Mean age of rural AI/AN pedestrian fatalities was younger than urban fatalities (32.4 years vs years). Differences in AI/AN pedestrian crash characteristics were observed between urban and rural groups. Rural crashes tended to occur in on rural segments of state highway and interstate, involve alcohol, and had higher incidence of hit-and-run involvement. Urban crashes more frequently occurred on municipal roads, involved less alcohol on part of the driver or pedestrian, had lower hit and run frequency, and more often had a clearly marked division of traffic flow such as a painted line or concrete median. Urban crash locations also more often had artificial lighting (46.2%) than rural crash locations (5.2%) as well as other traffic control devices such as signals and crosswalks. Although differences were observed in the percentage of alcohol involvement between rural and urban groups, no significant difference in rural versus urban BAC for drivers or pedestrians was observed. The top contributing factors of AI/AN fatal pedestrian crashes were compared among rural and urban groups. The top contributing factors of rural crashes were walking in the roadway and pedestrian not being visible to driver. The top contributing factors for urban crashes were improper crossing, walking in the roadway and darting into the road. Among rural crashes, the driver was more often cited as responsible for the crash than among urban crashes. Urban drivers were more likely to have had a previous citation than rural drivers. Factors such as lack of inter-community transit in rural or on-reservation areas, the presence of high speed highways which double as main community roads and alcohol associated behaviors of pedestrians in these areas contribute to the increased risk of rural AI/AN pedestrians compared to their urban counterparts. Furthermore, the impact of rurality on lethality in terms of increased response times for EMS may increase the rift between rural and urban fatal pedestrian crash rates. Finally, poverty, rurality, and poverty-related substance abuse patterns may contribute to the increased pedestrian fatality rates among AI/AN in the United States. 21
26 Qualitative Results: American Indian Community Attitudes on Pedestrian Safety Introduction Community attitudes impact the safe interactions between pedestrian and motorist as well as guide the development and implementation of pedestrian safety intervention activities. An assessment of these attitudes is useful for individuals planning to affect behavior change within communities or for groups wanting community participation and input on pedestrian safety activities. Methods In order to conduct a preliminary assessment for change and of strategies that might be most effective in addressing the high rates of pedestrian injury among AI/AN communities, two series of focus groups were conducted (2002) in nine AI/AN communities distributed across the United States. The first focus group series targeted individuals who worked as service professionals somewhat related to pedestrian injury. The second series of focus groups targeted individuals who were currently engaged in or had completed some kind of pedestrian safety intervention ranging from coordinated enforcement, engineering, and education activities, to holding an annual Walk Our Kids to School Day event. The goal of recruitment of focus group participants was to include an ethnically representative group of people from a variety of occupations. Participants that were identified included state and tribal law enforcement, community health workers, fire department and EMS representatives, safety technicians, safety engineers, city planners, community members, business owners, tribal elders, and educators. Each series of focus groups lasted approximately one and one half hour. Participants were asked to write responses and then discuss questions designed to elicit feedback on topics including: community beliefs and philosophical orientation as to who is responsible for pedestrian safety, strategies to develop public support for pedestrian safety, appropriate safety interventions, and the appropriate functions of key players. The second series of focus groups which targeted AI/AN community members already active in pedestrian safety efforts focused on the reasons behind creating such efforts, the key players involved, details about group dynamics, safety intervention activities, and information needed to complete such interventions. In addition, the second series of focus group participants were asked to evaluate the success of their intervention experience, as well as to identify successes and barriers associated with their intervention efforts. 22
27 Results The first series of focus groups identified community attitudes with regard to pedestrian safety and preferred methods of increasing public awareness and safety interventions. There were 187 respondents from nine communities. During the course of this first series of focus groups, participants were asked to answer the question In your opinion, what is the division of responsibility for pedestrian safety between the individual and the community? As illustrated in Table 10, the majority of participants indicated that individual responsibility for pedestrian safety was equal to community responsibility for pedestrian safety. However, when the question was rephrased to address the safety of the elderly and children, larger percentages of respondents indicated that the community possessed a greater responsibility for pedestrian safety than the individual. Table 10. Focus Group Responses to 'Who Is Responsible for Pedestrian Safety?. % Individual % Community Responses % Responses % 15.5% 5.3% 4.8% 3.2% 1.6% 1.1% 0.5% 0.5% 0.0% 0.0% Table 11. Focus Group Responses to 'Who Is Responsible for Pedestrian Safety?. % Individual % Community Responses % Responses % 17.6% 14.4% 9.6% 7.0% 6.4% 5.3% 1.6% 0.5% 0.0% 0.0% Focus group participants were also asked how they could best develop support for pedestrian safety efforts. Respondents indicated that the best methods for increasing 23
28 public awareness surrounding pedestrian issues included: a pedestrian safety media campaign (38%), meetings with stake holders (14%), and meetings with community leaders (14%). Respondents least frequently indicated driver s education (6%) and meetings with community members (7%) as the best methods for increasing support for pedestrian safety efforts. Focus group participants favored educational and media-based interventions and law enforcement solutions as potential safety interventions. Very few participants were interested in interventions that targeted alcohol-related pedestrian injury. Figure 12 illustrates the number of participants who favored each potential intervention. Figure 12. Interventions Favored by Focus Group Participants. In addition to identifying interventions that might positively impact pedestrian safety among AI/AN communities, participants were asked to comment on roles for community members who work on pedestrian safety issues. Highly recommended solutions from the focus group participants are in bold. Roles for State and Tribal Government Identify pedestrian injury as a health priority with appropriate funding allocations for community interventions and educational efforts. Support the work of a regional pedestrian injury advisory committee and local advocacy groups that support the reduction of pedestrian injury and death. Allocate funding to address safety problems. Fund shelters for intoxicated individuals. Initiate and facilitate the enforcement of applicable laws (e.g. speeding, jay walking, liquor establishment service restrictions) Promote alcohol abuse prevention. 24
29 Provide funds to develop safe pedestrian walkways, lighting, and other needed changes to the physical environment. Roles for Community Develop awareness and education. Identify high risk groups in the community, develop interventions for each group, and evaluate results of these interventions. Create links with appropriate agencies who can offer technical assistance. Involve the community, specifically business, churches, and health promotion groups. Support enforcement of pedestrian laws geared toward both drivers and pedestrians. Promote collaborative work between communities, traffic engineering agencies, and law enforcement. Roles for Medical Service Professionals Give presentations to the community and other sites to increase awareness of pedestrian issues. Provide expedient medical services to rural areas. Teach basic and advanced life support in rural communities to improve level of training of first-responders. Assist with injury surveillance surrounding pedestrian injury. Give patient guidance regarding pedestrian safety and issues of alcohol use. Roles for Educators Train students how to handle pedestrian situations in real-life traffic settings. Driver education with pedestrian safety focus. Train crossing guards. Increase awareness of where young children are when cars are backing out of driveways. Become more involved in pedestrian safety efforts particularly through school. Participate in Walk Our Kids to School Day. Discuss pedestrian safety issues with classes of school children. Roles for Parents Gain awareness regarding pedestrian injury through parenting programs, community meetings. Discuss pedestrian safety issues with their children. Become more involved in safety campaigns (especially in school). Roles for Law Enforcement Enforce current drunk driving, public intoxication, alcohol server training, and speed limit/aggressive driving laws. Teach children the importance of pedestrian safety. Patrol high risk areas for drunken pedestrians. Coordinate collection of pedestrian crash information. 25
30 Enforce community speed limits principally along rural interstate and state highway. Roles for Business Enhance and enforce server training. Stop serving patrons who are seriously impaired in their ability to walk or think clearly. Distribute reflective strips for clothing to intoxicated pedestrians. Close liquor establishments earlier. Provide lighting and safe walkways around business. Roles for Planners and Engineers Work with community groups to evaluate high risk areas for poor road design and to develop positive roadway design changes, including increasing the time allowed for pedestrians to cross the street, painting and improving curbs and curb ramps, installing large signs to alert pedestrians and motorists of high risk areas, installing traffic control devices. Work with community groups to assess areas with high pedestrian flow or areas with multiple mid-block crossings and suggest appropriate engineering countermeasures. Add or enhance lighting along dangerous roads or highway segments. Consider bicycles and pedestrians when making improvements to roadways. Focus groups participants who had been or were currently engaged in pedestrian safety efforts were asked to characterize their efforts, the organization of their pedestrian safety advisory group, and assess the effectiveness of their efforts. Focus group participants cited high rates of pedestrian injury (54%) and community concerns about pedestrian safety (26%) as key reasons why their community had chosen to engage in pedestrian safety efforts. Furthermore, participants noted that law enforcement (29%), private citizens (26%), and medical professionals (15%) were the groups most concerned with pedestrian safety initially. The majority of participant s had an advisory board or group which met primarily on a monthly basis (61%), which was chaired by someone (had a lead person or facilitator 79%) and kept and distributed minutes regularly (84%). Although most groups had a designated leader, the groups made decisions through majority vote (60%) or via consensus (16%). Respondents felt that it was important for the advisory group to have the same ethnic mix as the community in which they were working (74%) and consequently most groups had a similar ethnic mix (65%). Education, public awareness, and community outreach activities were the main activities of safety efforts conducted by focus group respondents (67%). These groups generally collected, analyzed, and reviewed local data on pedestrian injury (84%). The majority of these data was obtained either through local law enforcement (45%) or Indian Health Service (37%). Few participants noted receiving pedestrian safety expertise from outside sources (27%). Focus group participants were then asked to indicate what other information or resources their group might need from outside sources. Participants were asked to indicate whether the assistance would most effectively be conveyed via personal communication or written materials. Figure 14 illustrated focus group participants 26


31 responses about what types of resources and information they might need and how these materials should be presented. Figure 13. Key Players Involved in Pedestrian Safety Efforts, Figure 14. Assistance Needs of Communities for Pedestrian Safety Projects,
Pedestrian Fatalities on Interstate Highways, United States, Saving lives through research and education.
 Saving lives through research and education Pedestrian Fatalities on Interstate Highways, United States, 1993-2012 September 2014 607 14th Street, NW, Suite 201 Washington, DC 20005 AAAFoundation.org 202-638-5944
Traffic Safety Facts 2007 Data
 Traffic Safety Facts 2007 Data Bicyclists and Other Cyclists DOT HS 810 986 Bicyclists and other cyclists include riders of two-wheel nonmotorized vehicles, tricycles, and unicycles powered solely by pedals.
2014 QUICK FACTS ILLINOIS CRASH INFORMATION. Illinois Emergency Medical Services for Children February 2016 Edition
 2014 QUICK FACTS ILLINOIS CRASH INFORMATION February 2016 Edition Illinois Emergency Medical Services for Children www.luhs.org/emsc Illinois Emergency Medical Services for Children TABLE OF CONTENTS
2012 QUICK FACTS ILLINOIS CRASH INFORMATION. Illinois Emergency Medical Services for Children September 2014 Edition
 2012 QUICK FACTS ILLINOIS CRASH INFORMATION September 2014 Edition Illinois Emergency Medical Services for Children www.luhs.org/emsc Illinois Emergency Medical Services for Children TABLE OF CONTENTS
DOT HS September Crash Factors in Intersection-Related Crashes: An On-Scene Perspective
 DOT HS 811 366 September 2010 Crash Factors in Intersection-Related Crashes: An On-Scene Perspective DISCLAIMER This publication is distributed by the U.S. Department of Transportation, National Highway
A Comparison of Highway Construction Costs in the Midwest and Nationally
 A Comparison of Highway Construction Costs in the Midwest and Nationally March 20, 2018 Mary Craighead, AICP 1 INTRODUCTION State Departments of Transportation play a significant role in the construction
Traffic Safety Facts. State Traffic Data Data. Overview
 Traffic Safety Facts 2015 Data June 2017 DOT HS 812 412 State Traffic Data Key Findings Traffic fatalities increased by 7 percent from 2014 to 2015 (32,744 to 35,092) for the United States. The fatality
Bicycle - Motor Vehicle Collisions on Controlled Access Highways in Arizona
 Bicycle - Motor Vehicle Collisions on Controlled Access Highways in Arizona Analysis from January 1, 1991 to June 30, 2002 Richard C. Moeur, PE Traffic Design Manager, Northern Region Michelle N. Bina
Community of Practice on Traumatic Brain Injury
 Community of Practice on Traumatic Brain Injury Second Meeting October 15, 2013, 3:00-4:00 PM ET For audio, please call 866-835-7973. Your phone line is currently muted. Today s Agenda Overview of TBI
Alberta. Traffic Collision Statistics. Office of Traffic Safety Transportation Services Division May 2017
 Traffic Collision Statistics Office of Traffic Safety Transportation Services Division May 217 This page was intentionally left blank. 2 Table of Contents Traffic Collisions... 4 Traffic Collision Rates...
MTCF. Michigan Traffic Crash Facts FACT SHEETS
 FACT SHEETS This page left intentionally blank GENERAL FACTS The driver, the roadway, and the motor vehicle contribute in some measure to every crash. A preponderance of evidence, however, points to driver
There are three major federal data sources that we evaluate in our Bicycle Friendly States ranking:
 Since the landmark Intermodal Surface Transportation Efficiency Act (ISTEA) created the Transportation Enhancements program in 1991 bicycle and pedestrian projects have been eligible for programmatic federal
MTCF. Michigan Traffic Crash Facts FACT SHEETS
 FACT SHEETS This page left intentionally blank GENERAL FACTS The driver, the roadway, and the motor vehicle contribute in some measure to every crash. A preponderance of evidence, however, points to driver
CHAPTER 2 LITERATURE REVIEW
 CHAPTER 2 LITERATURE REVIEW 2.1 Introduction This chapter presents some background information of the available literature related to the development of accident rates, accident models and accident statistic
Access Location, Spacing, Turn Lanes, and Medians
 Design Manual Chapter 5 - Roadway Design 5L - Access Management 5L-3 Access Location, Spacing, Turn Lanes, and Medians This section addresses access location, spacing, turn lane and median needs, including
DOT HS November 2009 Geospatial Analysis of Rural Motor Vehicle Traffic Fatalities
 DOT HS 811 196 November 2009 Geospatial Analysis of Rural Motor Vehicle Traffic Fatalities This document is available to the public from the National Technical Information Service, Springfield, Virginia
Lane Area Transportation Safety and Security Plan Vulnerable Users Focus Group
 Lane Area Transportation Safety and Security Plan Vulnerable Users Focus Group Agenda 1. Planning Process Review 2. What are Emphasis Areas? 3. Your Role Today 4. Data Review 5. Small group discussion
Safety Assessment of Installing Traffic Signals at High-Speed Expressway Intersections
 Safety Assessment of Installing Traffic Signals at High-Speed Expressway Intersections Todd Knox Center for Transportation Research and Education Iowa State University 2901 South Loop Drive, Suite 3100
Figure 1. Indiana fatal collisions by young driver involvement,
 INDIANA TRAFFIC SAFETY FACTS YOUNG DRIVERS 2016 MAY 2017 ISSUE 17-C06 IN 2016: In 2016, 13.4 percent of all drivers involved in Indiana collisions were young drivers. Young drivers were involved in 105
PEDESTRIAN/BICYCLIST CRASH ANALYSIS 2015
 PEDESTRIAN/BICYCLIST CRASH ANALYSIS 2015 Central Arkansas Regional Transportation Study Table of Contents Executive Summary... 3 CARTS Pedestrian/Bicycle Crash Analysis... 3 Report Format... 3 Results...
Truck Tractor Trailer Crash Analysis
 Building Tribal Traffic Safety Capacity Truck Tractor Trailer Crash Analysis Arizona Department of Transportation (ADOT) Motor Vehicle Crash (MVC) Data ITCA, Inc. 04/18/06 Truck Tractor Trailer Crash Analysis
Pedestrian injuries in San Francisco: distribution, causes, and solutions
 Pedestrian injuries in San Francisco: distribution, causes, and solutions Presentation to the San Francisco Health Commission RAJIV BHATIA, MD, MPH DIRECTOR OF OCCUPATIONAL AND ENVIRONMENTAL HEALTH, SAN
HSIS. Association of Selected Intersection Factors With Red-Light-Running Crashes. State Databases Used SUMMARY REPORT
 HSIS HIGHWAY SAFETY INFORMATION SYSTEM The Highway Safety Information Systems (HSIS) is a multi-state safety data base that contains accident, roadway inventory, and traffic volume data for a select group
Safety and Active Transport. Dr. Maureen Carew, Medical Officer of Health Renfrew County and District Health Unit May 30, 2014
 Safety and Active Transport Dr. Maureen Carew, Medical Officer of Health Renfrew County and District Health Unit May 30, 2014 Active Transport Vision Increase levels of walking and cycling Reduce vehicle
Mission: The mission of FARS is to make vehicle crash information accessible and useful so that traffic safety can be improved
 Mission: The mission of FARS is to make vehicle crash information accessible and useful so that traffic safety can be improved NHTSA created FARS in 1975 National Center for Statistics and Analysis (NCSA)
Parks Highway: MP Lucus Road to Big Lake Road
 2 Purpose and Need 2.1 Corridor History The Parks Highway is a 324-mile long Rural Interstate Highway that extends from its intersection with the Glenn Highway north to Fairbanks, Alaska. The Parks Highway
North Carolina. Bicycle Crash Facts Prepared for
 North Carolina Bicycle Crash Facts 2006-2010 Prepared for The North Carolina Department of Transportation Division of Bicycle and Pedestrian Transportation Prepared by The University of North Carolina
Application of Demographic Analysis to Pedestrian Safety. Center for Urban Transportation Research University of South Florida
 Application of Demographic Analysis to Pedestrian Safety BDV25 TWO 977 30 Pei Sung Lin, Ph.D., P.E., PTOE, FITE Program Director Achilleas Kourtellis, Ph.D. Senior Research Associate CUTR, University of
Transportation and Public Works Annual Motor Vehicle Collision Report
 Transportation and Public Works 22 Annual Motor Vehicle Collision Report Table of Contents Table of Contents.. 2 Introduction.. 3 22 Collision Summary. 4 Demographics 5 Collisions by Severity.. 5 Personal
Relationship of Road Lane Width to Safety for Urban and Suburban Arterials
 Relationship of Road Lane Width to Safety for Urban and Suburban Arterials Phd. Alma AFEZOLLI Polytechnic University of Tirana Construction and Infrastructure Department of Civil Engineering Faculty Tirana,
Final Report. Evaluation of Flashing Yellow Right Turn Arrow at Silverbell Rd and Cortaro Rd. FHWA Experimentation #4-329(E)
") Final Report Evaluation of Flashing Yellow Right Turn Arrow at Silverbell Rd and Cortaro Rd FHWA Experimentation #4-329(E) Marana, Arizona January 2009 Submitted To: Submitted By: FINAL REPORT EVALUATION
Final Report Evaluation of Flashing Yellow Right Turn Arrow at Silverbell Rd and Cortaro Rd FHWA Experimentation #4-329(E) Marana, Arizona January 2009 Submitted To: Submitted By: FINAL REPORT EVALUATION
MUTCD Part 6G: Type of Temporary Traffic Control Zone Activities
 MUTCD Part 6G: Type of Temporary Traffic Control Zone Activities 6G.01 Typical Applications Each temporary traffic control (TTC) zone is different. Many variables, such as location of work, highway type,
POLICY AGENDA For Elder Pedestrian Safety
 POLICY AGENDA For Elder Pedestrian Safety Older adults and people with disabilities often have mobility, cognitive, and sensory limitations that affect their behavior as pedestrians and place them at risk
A review of 2015 fatal collision statistics as of 31 December 2015
 A review of fatal collision statistics as of 31 December This report summarises the main trends in road fatalities that have emerged in. This has been prepared by the Road Safety Authority following analysis
APPENDIX C. Systems Performance Report C-1
 APPENDIX C Systems Performance Report C-1 System Performance Report & Requirements According to the FAST Act, a long range transportation plan needs to include a system performance report and subsequent
SLOW DOWN A STUDY OF SPEEDING ON MCGUINNESS BLVD
 SLOW DOWN A STUDY OF SPEEDING ON MCGUINNESS BLVD ACKNOWLEDGEMENTS This report was prepared by Shawn Macias, in consultation with the McGuinness Boulevard Working Group. This report would not have been
Bicycle Helmet Use Among Winnipeg Cyclists January 2012
 Bicycle Helmet Use Among Winnipeg Cyclists January 2012 By: IMPACT, the injury prevention program Winnipeg Regional Health Authority 2 nd Floor, 490 Hargrave Street Winnipeg, Manitoba, R3A 0X7 TEL: 204-940-8300
City of Elizabeth City Neighborhood Traffic Calming Policy and Guidelines
 City of Elizabeth City Neighborhood Traffic Calming Policy and Guidelines I. Purpose: The City of Elizabeth City is committed to ensure the overall safety and livability of residential neighborhoods. One
HSIP Project Selection Criteria
 HSIP Project Selection Criteria The purpose of the Highway Safety Improvement Program (HSIP) is to reduce the number of fatal and injury crashes by targeting high crash locations and causes. Projects,
1999 On-Board Sacramento Regional Transit District Survey
 SACOG-00-009 1999 On-Board Sacramento Regional Transit District Survey June 2000 Sacramento Area Council of Governments 1999 On-Board Sacramento Regional Transit District Survey June 2000 Table of Contents
Pedestrians safety. ROAD SAFETY SEMINAR PIARC/AGEPAR/GRSP Lome, Togo October 2006 Lise Fournier, Canada-Qu
 Pedestrians safety ROAD SAFETY SEMINAR Lome, Togo October 2006 Lise Fournier, Canada-Qu Québec Contents WHO s data Risk factors Pedestrian needs Pedestrian facilities Conclusion Source: WHO WHO reports
Chapter 4 Traffic Analysis
 Chapter 4 Traffic Analysis PURPOSE The traffic analysis component of the K-68 Corridor Management Plan incorporates information on the existing transportation network, such as traffic volumes and intersection
Napier City road trauma for Napier City. Road casualties Estimated social cost of crashes* Major road safety issues.
 ISSN 1176-841X July 25 Land Transport New Zealand has prepared this road safety issues report. It is based on reported crash data and trends for the 2 24 period. The intent of the report is to highlight
Hennepin County Pedestrian Plan Public Comment Report
 Hennepin County Pedestrian Plan Public Comment Report On May 31, 2013, the draft Hennepin County Pedestrian Plan was released for a 45-day public comment period ending July 15, 2013. The county received
MEMORANDUM. Charlotte Fleetwood, Transportation Planner
 MEMORANDUM Date: Updated August 22, 2017 To: Organization: Charlotte Fleetwood, Transportation Planner Boston Transportation Department From: Jason DeGray, P.E., PTOE, Regional Director of Engineering
1 Monash University Accident Research Centre, Monash University, Victoria, RACV, 550 Princes Highway Noble Park, Victoria, 3174.
 Roadside Environment Safety: a statistical analysis of collisions with fixed roadside objects in Victoria Amanda Delaney 1, Stuart Newstead 1, Bruce Corben 1, Jim Langford 1 and Peter Daly 2 1 Monash University
The North Shore Transportation Improvement Strategy and Western Richmond Terrace 1 : The Forgotten Corridor
 Elm Park Civic Association Island Voice Do Me A Faber The North Shore Transportation Improvement Strategy and Western Richmond Terrace 1 : The Forgotten Corridor Introduction Richmond Terrace is the northernmost
Crash Analysis of I-64 Closure in St. Louis County
 Report # MATC-MST: 341 Final Report 25-1121-0001-341 Crash Analysis of I-64 Closure in St. Louis County Ghulam H. Bham, Ph.D. Professor Department of Civil, Architectural, and Environmental Engineering
ADOT Statewide Bicycle and Pedestrian Program Summary of Phase IV Activities APPENDIX B PEDESTRIAN DEMAND INDEX
 ADOT Statewide Bicycle and Pedestrian Program Summary of Activities APPENDIX B PEDESTRIAN DEMAND INDEX May 24, 2009 Pedestrian Demand Index for State Highway Facilities Revised: May 29, 2007 Introduction
PEDESTRIAN ACTION PLAN
 ATTACHMENT 2 CITY OF SANTA MONICA PEDESTRIAN ACTION PLAN CITY OF SANTA MONICA PEDESTRIAN ACTION PLAN This page intentionally left blank EXECUTIVE SUMMARY CHAPTER 1 EXECUTIVE SUMMARY Setting the Stage
1.3.4 CHARACTERISTICS OF CLASSIFICATIONS
 Geometric Design Guide for Canadian Roads 1.3.4 CHARACTERISTICS OF CLASSIFICATIONS The principal characteristics of each of the six groups of road classifications are described by the following figure
CHAPTER 7 ACCESS MANAGEMENT. Background. Principles of Access Management. Hennepin County Transportation Systems Plan (HC-TSP)
") CHAPTER 7 ACCESS MANAGEMENT Background Principles of Access Management Hennepin County Transportation Systems Plan (HC-TSP) Chapter 7 Access Management 7.1 Background Access management has become an important
CHAPTER 7 ACCESS MANAGEMENT Background Principles of Access Management Hennepin County Transportation Systems Plan (HC-TSP) Chapter 7 Access Management 7.1 Background Access management has become an important
Maine Highway Safety Facts 2016
 Maine Highway Safety Facts 216 216 MAINE HIGHWAY SAFETY FACTS The Bureau of Highway Safety and the Maine Department of Transportation are pleased to present the 216 edition of Maine Highway Safety Facts.
BIA INDIAN HIGHWAY SAFETY PROGRAM FY2016 TRAFFIC RECORDS GRANT. SECTION A: General Information. This section must be completed for all applicants.
 SECTION A: General Information. This section must be completed for all applicants. Name of Tribe: Click here to enter text. Address : Click here to enter text. City: Click here to enter text. State: Click
Public Opinion, Traffic Performance, the Environment, and Safety After Construction of Double-Lane Roundabouts
 Public Opinion, Traffic Performance, the Environment, and Safety After Construction of Double-Lane Roundabouts TRB 93 rd Annual Meeting Washington, D.C. January 15, 2014 Wen Hu, Ph.D. Intersection crashes
For Information Only. Pedestrian Collisions (2011 to 2015) Resolution. Presented: Monday, Apr 18, Report Date Tuesday, Apr 05, 2016
 Resolution. Presented: Monday, Apr 18, Report Date Tuesday, Apr 05, 2016") Presented To: Operations Committee For Information Only Pedestrian Collisions (0 to 0) Presented: Monday, Apr 8, 06 Report Date Tuesday, Apr 0, 06 Type: Correspondence for Information Only Resolution For
Presented To: Operations Committee For Information Only Pedestrian Collisions (0 to 0) Presented: Monday, Apr 8, 06 Report Date Tuesday, Apr 0, 06 Type: Correspondence for Information Only Resolution For
2003 road trauma for. Wairoa District. Road casualties Estimated social cost of crashes* Major road safety issues WAIROA DISTRICT JULY 2004
 WAIROA DISTRICT JULY 24 T he Land Transport Safety Authority (LTSA) has prepared this road safety issues report. It is based on reported crash data and trends for the 1999 23 period. The intent of the
2015 Florida Main Street Annual Conference. Complete Streets Equal Stronger Main Streets
 WHAT ARE COMPLETE STREETS? CASE STUDIES COMPLETING YOUR MAIN STREET 2015 Florida Main Street Annual Conference St. Petersburg, Florida August 19, 2015 WHAT ARE COMPLETE STREETS? CASE STUDIES COMPLETING
An Overview of Traffic Records. April 15, 2016 John Riemer
 An Overview of Traffic Records April 15, 2016 John Riemer What is traffic records? The traffic records office is required by state statue to maintain a database of motor vehicle crashes that occur on all
EMS professionals face many risks exposure to infectious diseases, violence, hazardous scenes, and oncoming traffic, to name a few.
 EMS professionals face many risks exposure to infectious diseases, violence, hazardous scenes, and oncoming traffic, to name a few. However, none of these risks compares to the potential for death and
91
 90 91 92 93 94 95 96 97 98 99 100 101 102 103 104 105 106 As previously depicted in Exhibit 4-J, vehicular accidents are shown along Forrester Road. The contributing factors may be due to its current two
Borough of Danville, PA Traffic Calming Program Guidelines
 Borough of Danville, PA Traffic Calming Program Guidelines Adopted by Borough Council on 1 INTRODUCTION Speeding Traffic is a major concern in the Borough of Danville because of its detrimental impacts
Lessons Learned from the Minnesota County Road Safety Plans. Richard Storm CH2M HILL
 Lessons Learned from the Minnesota County Road Safety Plans Richard Storm CH2M HILL May 21, 2014 Overview of the MN CRSP: Why Prepare Safety Plans for Local Systems? MAP-21: Requires states to address
CDRT. Child Death Review Team Dallas County. Brief Report Traffic-related Child Deaths OVERVIEW
 Dallas County CDRT Child Death Review Team 2013 Brief Report Traffic-related Child Deaths 2006-2011 OVERVIEW In Dallas County, traffic-related injury death rates among children are typically less than
County of Spartanburg South Carolina
 County of Spartanburg South Carolina Traffic Calming Program June 2012 (Revised/Program on Hold) PURPOSE The potential negative impacts from vehicular traffic on residential roads have been a longstanding
THE EPIDEMIOLOGY OF TRAUMATIC BRAIN INJURIES IN NEW YORK STATE
 THE EPIDEMIOLOGY OF TRAUMATIC BRAIN INJURIES IN NEW YORK STATE Michael Bauer, Sarah Sperry, Kainan Sun, Susan Hardman New York State Department of Health, Bureau of Injury Prevention What is Traumatic
BIA INDIAN HIGHWAY SAFETY PROGRAM FY2016 LAW ENFORCEMENT OVERTIME GRANT
 SECTION A: General Information. This section must be completed for all applicants. Name of Tribe: Click here to enter text. Address : Click here to enter text. City: Click here to enter text. State: Click
PEDESTRIAN/BICYCLE CRASH STUDY
 PEDESTRIAN/BICYCLE CRASH STUDY This report summarizes an analysis of pedestrian and bicycle crashes that has been conducted by the CRCOG staff. In 2004, CRCOG completed a study of pedestrian crash data
Iragavarapu, Khazraee, Lord, Fitzpatrick PEDESTRIAN FATAL CRASHES ON FREEWAYS IN TEXAS
 Iragavarapu, Khazraee, Lord, Fitzpatrick PEDESTRIAN FATAL CRASHES ON FREEWAYS IN TEXAS By Vichika Iragavarapu, P.E. (Corresponding author) Assistant Research Engineer Texas A&M Transportation Institute,
The Effect of Pavement Marking on Speed. Reduction in Exclusive Motorcycle Lane. in Malaysia
 Contemporary Engineering Sciences, Vol. 3, 2010, no. 3, 149-155 The Effect of Pavement Marking on Speed Reduction in Exclusive Motorcycle Lane in Malaysia Seyed Farzin Faezi PhD student in highway and
Safety Corridors a Synthesis. Charlie Nemmers / Derek Vap University of Missouri
 Safety Corridors a Synthesis Charlie Nemmers / Derek Vap University of Missouri 1 Background: Safety Corridors Study Need grew from a four State Safety Summit Funding from Iowa, Kansas, Missouri DOTs and
PRELIMINARY DRAFT FIRST AMENDMENT TO VISION 2050: A REGIONAL LAND USE AND TRANSPORTATION PLAN FOR SOUTHEASTERN WISCONSIN
 PRELIMINARY DRAFT FIRST AMENDMENT TO VISION 2050: A REGIONAL LAND USE AND TRANSPORTATION PLAN FOR SOUTHEASTERN WISCONSIN ESTABLISHING TARGETS FOR FEDERAL PERFORMANCE MEASURES: HIGHWAY SAFETY SOUTHEASTERN
Potential Factors Affecting Roadway Departure Crashes in Oahu, Hawaii
 Potential Factors Affecting Roadway Departure Crashes in Oahu, Hawaii Pasha Hashemi (1), Adrian Ricardo Archilla(2) (1)Graduate Research Assistant, Department of Civil and Environmental Engineering, University
Lincoln Avenue Road Diet Trial
 Lincoln Avenue Road Diet Trial Data Collection Report June 1, 2015 Department of Transportation Table of Contents I. Introduction...... 3 II. Data Collection Methodology & Results...... 5 A. Traffic Volume
POLICY: TRAFFIC CALMING
 2006 MAY REFERENCE: COUNCIL APPROVED BY COUNCIL MAY 23, 2006 CITY OPERATIONS - NO. 608 POLICY: TRAFFIC CALMING A. All requests for traffic calming within the City shall be considered in accordance with
Chapter 5 DATA COLLECTION FOR TRANSPORTATION SAFETY STUDIES
 Chapter 5 DATA COLLECTION FOR TRANSPORTATION SAFETY STUDIES 5.1 PURPOSE (1) The purpose of the Traffic Safety Studies chapter is to provide guidance on the data collection requirements for conducting a
Pedestrian and Bicycle Crashes
 Pedestrian and Bicycle Crashes Pedestrian and Bicycles Overview Pedestrian-related crashes represent 3.6% of the total reported traffic crashes; however, they account for 11.1% of all traffic crash deaths.
EVALUATION OF A GREEN BIKE LANE WEAVING AREA IN ST. PETERSBURG, FLORIDA. William W. Hunter Senior Research Scientist
 EVALUATION OF A GREEN BIKE LANE WEAVING AREA IN ST. PETERSBURG, FLORIDA William W. Hunter Senior Research Scientist Raghavan Srinivasan Senior Transportation Research Engineer Carol A. Martell Senior Applications
DKS & WASHINGTON COUNTY Washington County Transportation Survey
 PREPARED FOR: DKS & WASHINGTON COUNTY Washington County Transportation Survey April 2013 PREPARED BY: DHM RESEARCH (503) 220-0575 239 NW 13 th Ave., #205, Portland, OR 97209 www.dhmresearch.com 1 INTRODUCTION
PBIC Webinar. How to Create a Bicycle Safety Action Plan: Planning for Safety [IMAGE] Oct. 2, 2014, 2 pm
![PBIC Webinar. How to Create a Bicycle Safety Action Plan: Planning for Safety [IMAGE] Oct. 2, 2014, 2 pm](/thumbs/86/93953441.jpg "PBIC Webinar. How to Create a Bicycle Safety Action Plan: Planning for Safety [IMAGE] Oct. 2, 2014, 2 pm") PBIC Webinar How to Create a Bicycle Safety Action Plan: Planning for Safety [IMAGE] Bill Schultheiss, Vice President, Toole Design Peter Lagerwey, Regional Director, Toole Design Oct. 2, 2014, 2 pm Today
PBIC Webinar How to Create a Bicycle Safety Action Plan: Planning for Safety [IMAGE] Bill Schultheiss, Vice President, Toole Design Peter Lagerwey, Regional Director, Toole Design Oct. 2, 2014, 2 pm Today
MEMORANDUM. City Constituents. Leilani Schwarcz, Vision Zero Surveillance Epidemiologist, SFDPH
 MEMORANDUM TO: FROM: CC: City Constituents Leilani Schwarcz, Vision Zero Surveillance Epidemiologist, SFDPH Megan Wier, Co-Chair, San Francisco Vision Zero Task Force, SFDPH Commander Ann Mannix, Traffic
The Safety Impact of Right Turn on Red: Report to Congress
 The Safety Impact of Right Turn on Red: Report to Congress Number 86 February 1995 U.S. Department of Transportation National Highway Traffic Safety Administration 400 Seventh Street, S.W., Washington,
The 2002 Pedestrian Safety Awareness Campaign
 The 2002 Pedestrian Safety Awareness Campaign From the Metropolitan Washington Council of Governments ABOUT THIS REPORT This report describes the 2002 Street Smart Campaign of the Metropolitan Washington
Pedestrian Accidents in Kentucky
 Transportation Kentucky Transportation Center Research Report University of Kentucky Year 1976 Pedestrian Accidents in Kentucky Charles V. Zegeer Robert C. Deen Kentucky Department of Transportation Kentucky
Truck Climbing Lane Traffic Justification Report
 ROUTE 7 (HARRY BYRD HIGHWAY) WESTBOUND FROM WEST MARKET STREET TO ROUTE 9 (CHARLES TOWN PIKE) Truck Climbing Lane Traffic Justification Report Project No. 6007-053-133, P 101 Ι UPC No. 58599 Prepared by:
Film Guide for Educators. Designing for Safety
 Film Guide for Educators Designing for Safety Designing For Safety Key Concepts Speeding While Driving Speeding is the number one cause of injuries and deaths from driving. The main reasons are because
Designing for Pedestrian Safety
 Designing for Pedestrian Safety Treatments at Unsignalized Pedestrian Crossings Presented by: Charlie Zegeer PBIC Director August 17, 2010 Crossing Crashes Part 1: General Principles 3 2 Why do people
THE DEVELOPMENT OF MALAYSIAN HIGHWAY RAIL LEVEL CROSSING SAFETY SYSTEMS: A PROPOSED RESEARCH FRAMEWORK. Siti Zaharah Ishak
 THE DEVELOPMENT OF MALAYSIAN HIGHWAY RAIL LEVEL CROSSING SAFETY SYSTEMS: A PROPOSED RESEARCH FRAMEWORK Siti Zaharah Ishak Transport System Centre, School of Natural & Built Environments, University Of
Crash Patterns in Western Australia. Kidd B., Main Roads Western Australia Willett P., Traffic Research Services
 Crash Patterns in Western Australia Kidd B., Main Roads Western Australia Willett P., Traffic Research Services Abstract Examination of crash patterns is one way of identifying key factors on which focus
City of Toronto Pedestrian Collision Study. Transportation Services Division Traffic Data Centre and Safety Bureau
 City of Toronto Pedestrian Collision Study Transportation Services Division Traffic Data Centre and Safety Bureau January 2007 EXECUTIVE SUMMARY Pedestrian safety is a primary concern for the city of
Do As I Say Not As I Do: Observed Compliance vs. Stated Understanding of Pedestrian Crossing Laws in Florida
 Do As I Say Not As I Do: Observed Compliance vs. Stated Understanding of Pedestrian Crossing Laws in Florida Achilleas Kourtellis, Ph.D. July 9, 2015 CUTR Webcast Series Center for Urban Transportation
EVALUATION OF HAWK SIGNAL AT GEORGIA AVENUE AND HEMLOCK STREET, NW IN THE DISTRICT OF COLUMBIA FINAL REPORT. August 30, 2010
 EVALUATION OF HAWK SIGNAL AT GEORGIA AVENUE AND HEMLOCK STREET, NW IN THE DISTRICT OF COLUMBIA FINAL REPORT August 30, 2010 Submitted to: Mr. George Branyan Pedestrian Program Manager Policy, Planning
Walkable Communities and Adolescent Weight
 Walkable Communities and Adolescent Weight Sandy Slater, PhD Assistant Professor, University of Illinois at Chicago, School of Public Health Research Scientist, UIC Institute for Health Research and Policy
Toward Zero Deaths. Regional SHSP Road Show Meeting. Virginia Strategic Highway Safety Plan. presented by
 Toward Zero Deaths Regional SHSP Road Show Meeting presented by Virginia Strategic Highway Safety Plan December 1, 2016 1 Welcome & Introductions Purpose of the Meeting Objectives & Key Outcomes Agenda»
Closing Plenary Session
 TRAFFIC SAFETY CONFERENCE Closing Plenary Session June 9, 2017 Las Colinas, TX Order of Report Out June 9, 2017 Las Colinas, TX Distracted Driving Prioritized Countermeasures Countermeasure 4a Systemically
Safer Cycling: How the City of Vancouver is Proactively Improving Cycling Safety
 Safer Cycling: How the City of Vancouver is Proactively Improving Cycling Safety Brian Patterson, MCIP, RPP Urban Systems 2015 Canadian Association of Road Safety Professionals (CARSP) Conference Session
COLLISION STATISTICS May Engineering Services Box 5008, th Avenue Red Deer, AB T4N 3T4
 COLLISION STATISTICS 2016 2016 Red Deer Annual Motor Vehicle Collision Report May 2017 Engineering Services Box 5008, 4914 48th Avenue Red Deer, AB T4N 3T4 engineering@reddeer.ca RCMP GRC Red Deer City
17 th Annual Northwest Tribal Transportation Symposium April 21, 2010 Northwest Region Division of Transportation Bureau of Indian Affairs
 17 th Annual Northwest Tribal Transportation Symposium April 21, 2010 Northwest Region Division of Transportation Bureau of Indian Affairs Strategic t Highway Safety Plan for Indian Lands (SHSP) Washington
Black Homicide Victimization in the Great Lakes States
 APRIL 2018 Victimization in the Great Lakes States An Analysis of 2015 Homicide Data WWW.VPC.ORG BLACK HOMICIDE VICTIMIZATION IN THE GREAT LAKES STATES VIOLENCE POLICY CENTER 1 COPYRIGHT AND ACKNOWLEDGMENTS
Defining Purpose and Need
 Advanced Design Flexibility Pilot Workshop Session 4 Jack Broz, PE, HR Green May 5-6, 2010 Defining Purpose and Need In your agency s project development process, when do design engineers typically get