Chinatown Neighborhood Transportation Plan FINAL REPORT
|
|
|
- Alan Joseph
- 6 years ago
- Views:
Transcription
1 Chinatown Neighborhood Transportation Plan FINAL REPORT JULY, 2015
2 ACKNOWLEDGEMENTS The Chinatown Neighborhood Transportation Plan was prepared by the San Francisco County Transportation Authority, with support from Fehr & Peers Transportation Consultants, D&A Communications, and with support from the Chinatown Community Development Center (CCDC), the CCDC Urban Institute Youth Program, and the Chinatown Transportation Research and Improvement Project (TRIP). The following individuals participated. SAN FRANCISCO COUNTY TRANSPORTATION AUTHORITY Ryan Greene-Roesel, Project Manager; David Uniman, Deputy Director for Planning; Michael Schwartz, Senior Planner, Brigitte Driller, David Weinzimmer, Melanie Curry, Interns TECHNICAL ADVISORS Luis Montoya, Mike Sallaberry, Kenneth Kwong, Oliver Gaida, Laura Stonehill, Jonah Chiarenza, Greg Riessen, Julie Kirschbaum, Peter Gabancho, Nicolas Carr, San Francisco Municipal Transportation Agency Lily Langois, Kay Cheng, San Francisco Planning Department Beth Thomas, Anh Nguyen, David Seriani, Caltrans FUNDING Funding for this plan was generously provided by the Metropolitan Transportation Commission s Community Based Transportation Plan Program and the San Francisco Proposition K half-cent sales tax for transportation. Special thanks to Drennen Shelton, Community Based Transportation Program Coordinator at the MTC CONSULTANT TEAM AND COMMUNITY PARTNERS Chris Mitchell, Dennis Lee, Fehr & Peers; Amanda Moreland, Scott Winter, David Chan, Wesley Chu, Katie Morris, Davis & Associates Chinatown Community Development Center, Chinatown Transportation Research and Improvement Project, and Urban Institute Students Steve Woo, Cindy Wu, Wai Ching Kwan, Roy Chan, Angelina Yu, Wil Din, Landy Dong, Mark Fong, Phil Chin, Debbie Chen, Shirley Tsang, Shirley Yu, Simon Zhang, Kim Liang, Michelle Zhang, Shipei Feng, Carrie Ng, David Trang, Dennis Chen, Eric Wu, Lisa Yu, Sandy Jiang PHOTO CREDITS Uncredited photos are from the Transportation Authority photo library or project sponsors. Unless otherwise noted, the photographers cited below, identified by their screen names, have made their work available for use on flickr Commons: with the license agreements as noted. Cover, top left: viewfinderview 1 Cover, top right: Mark Pritchard 3 Cover, bottom: WaymondC 2 Licensing information: SAN FRANCISCO COUNTY TRANSPORTATION AUTHORITY 1455 Market Street, 22nd Floor, San Francisco, CA tel fax info@sfcta.org web

3 Contents Executive Summary 1 1. Introduction and Study Purpose 1 2. Broadway Street 4 3. Kearny Street 9 4. Next Steps 12 Chinatown Neighborhood Transportation Plan Introduction and Study Overview 13 Broadway St, Van Ness to Columbus Introduction Broadway Existing Conditions Community Outreach Results and Performance Framework Concept Analysis 24 Kearny St., from Bush to Jackson Introduction Kearny Existing Conditions Community Outreach Results Recommendations and Next Steps 39 Appendices Available Upon Request Appendix A: Broadway Van Ness Pilot Operations Analysis Appendix B: Lombard Van Ness Left Turn Capacity Operations Analysis Appendix C: Analysis of Leading Pedestrian Intervals for Broadway and Kearny Appendix D: Broadway Tunnel Morning Peak Period Vehicle Origin and Destination Analysis Appendix E: Memorandum from City Traffic Engineer Left Turn Removal at Broadway and Van Ness Avenue Appendix F: University of California, Berkeley Pedestrian Safety Analysis for San Francisco Appendix G: Signal Timing for Pedestrian Crossings on Kearny street Appendix H: Kearny Street Existing Conditions Graphics Appendix I: Summary of Community Interviews for Kearny Street
4 Figures and Tables Figure ES-1. Study Corridors and Chinatown Neighborhood Table ES-1. Planned Pedestrian Safety Treatments along Broadway Street Table ES-2. Performance Framework Table ES-3. Concept Evaluation Results Table ES-3. Proposed Corridor Concepts and Potential Corridor Issues Addressed Figure 1. Figure 2. Figure 3. Figure 4. Figure 5. Figure 6. Figure 7. Chinatown Demographic Characteristics Chinatown Neighborhood and Study Focus Corridors Chinatown Neighborhood High Injury Corridors Previous and Ongoing Studies along Broadway and Kearny Broadway Traffic Volumes by Time of Day Top Origin Destination Pairs for GPS-Enabled Drivers in the Broadway Tunnel AM Time Period Broadway Collisions including pedestrians, vehicles, and bicyclists Figure 8. Pedestrian Collisions on Broadway ( ) by time of data compared to 2011 traffic volumes Table 1. Table 2. Figure 9. Table 3. Figure 10. Figure th Percentile Speed Survey Results Planned Pedestrian Safety Treatments along Broadway Street Community Meeting Survey Responses Regarding Important and Most Important Transportation Problems in the Chinatown Neighborhood Performance Framework Comparison of Existing and Future Conditions Along Van Ness Avenue after construction of the Van Ness Bus Rapid Transit project Predicted morning peak hour (7:45-8:45 A.M.) eastbound traffic volumes in 2020 in different model scenarios (vehicles per hour) Figure Broadway Traffic Speed (EB AM Peak) - Powell to Columbus Figure 13. Morning Peak Hour Traffic Volume Differences Under Three Scenarios Figure Peak Hour Delay (AM Peak Hour 7:45-8:45 AM), Seconds of delay per vehicle Figure 15. Sample Queue Length Comparison Between Scenarios with a single and double left turn lane on southbound Van Ness at Broadway Table 4. Table 5. Figure 16. Figure 17. Figure 18. Figure 19. Figure 20. Figure 21. Concept Evaluation Results Kearny St. from Jackson to Bush Corridor Overview Kearny Street Peak Hour (5p.m.-6p.m.) Northbound Volumes Inbound/Outbound Vehicle Paths Connecting with US-101 Daily Traffic Volumes on Kearny Street (between Clay and Washington) Transit Routes on Kearny and Surrounding Streets Fall X/8AX/8BX Combined Average Weekday Ridership Pedestrian, Bicycle, and Vehicle Collision Locations Along Kearny St Figure 22. High Injury Corridor Annual Injury Statistics Total Weighted Pedestrian Injuries per 100 Miles per Year ( ) Table 5. Proposed Corridor Concepts and Potential Corridor Issues Addressed

5 Chinatown Urban Insitute students interview seniors about Kearny Street Image credit: CCDC Urban Insitute EXECUTIVE SUMMARY 1. INTRODUCTION AND STUDY PURPOSE 1.1 STUDY OVERVIEW SAN FRANCISCO S CHINATOWN San Francisco s Chinatown is the largest Chinatown outside of Asia and the oldest Chinatown in North America. It is one of the top tourist attractions in San Francisco. In addition to being a vibrant cultural and historic center, Chinatown is home to a unique population. Nearly a third of central Chinatown s population is elderly (75+) and disabled; more than 80 percent are low income, minority, and do not own a vehicle. Because of these characteristics, the neighborhood has been designated a regional Community of Concern by the Bay Area Metropolitan Transportation Commission. The Chinatown Neighborhood Transportation Plan (NTP) is a community-based transportation planning study led by the San Francisco County Transportation Authority (Transportation Authority), in partnership with community organizations in the Chinatown neighborhood. The NTP was funded by San Francisco s Proposition K halfcent sales tax for transportation, and through the Metropolitan Transportation Commission s Community-Based Transportation Planning program, which directs planning funds to low-income and minority communities to help them build consensus on transportation issues and identify solutions to address high-priority needs. 1.2 COMMUNITY INVOLVEMENT Community involvement occurred throughout the study and consisted of: Community meetings convened by the Chinatown Community Development Center (CCDC), a community based organization working to build community and enhance quality of life for San Francisco residents. Interviews, small group discussions, and intercept surveys collected by the CCDC s Urban Institute summer program, focusing on elderly residents in the neighborhood. Meetings with Chinatown Transportation Research and Improvement Project (TRIP), a community volunteer organization with the mission to improve quality of life for residents, shoppers, merchants, workers, city agencies, and tourists. PAGE 1
6 Interviews with community leaders including representatives of the Chinatown Salvation Army, Cathay Post, the Chinatown Neighborhood Association, Chinese New Comers Service Center, Self Help for the Elderly, and management of the Portsmouth Square Garage. This outreach indicated that: Traffic volumes/livability and pedestrian safety on Broadway are a top concern. During outreach events led by the Chinatown CCDC and meetings of Chinatown TRIP, community members expressed concern about high traffic volumes on Broadway, especially traffic exiting the Broadway tunnel during morning peak periods. Many community members expressed that high traffic volumes during Legend peak periods are incompatible with pedestrian safety. Representatives of Self Help for the Elderly also mentioned concerns about the 0.5 side access roads on Broadway, specifically the intersection of Broadway with Mason St. where a fatality occurred at an uncontrolled crossing. Pedestrian safety on Kearny St is also a major concern especially speeding and high volumes of turning vehicles. Several community groups especially the Chinatown Community Development Center, Chinatown TRIP, and Self Help for the Elderly, along with many elderly neighborhood residents, also expressed concerns about pedestrian safety on Kearny St. Specific issues of concern include conflicts between crossing pedestrians and high volumes of turning vehicles, speeding vehicles, and lack of time to cross. However, not all community groups were aware of the history of FIGURE ES-1. STUDY CORRIDORS AND CHINATOWN NEIGHBORHOOD Van Ness Ave Bay St Lombard St Broadway Study Focus Corridors (Outside Main Study Area) Study Focus Corridors (Inside Main Study Area) Main Study Area - Chinatown Neighborhood Miles Taylor St Columbus Ave Bush St pedestrian injuries on Kearny St and some felt that Kearny St. is working well due to uncongested conditions for vehicles. Kearny and Clay stands out as a problematic intersection. Several community groups and community members mentioned pedestrian safety at the intersection of Kearny and Clay Streets as a particular concern, with frequent conflicts occurring between pedestrians and vehicles entering and exiting the Portsmouth Square garage. Tragically, at the time of writing of this report, Ai You Zhou, an elderly woman was struck and killed at this intersection while crossing in the crosswalk. Kearny St Montgomery St L PAGE 2
7 1.3 STUDY FOCUS Based on the community outreach results, the Chinatown NTP focuses on two key community objectives: Reducing traffic volumes and improving pedestrian safety on Broadway. Improving pedestrian safety on Kearny Street. Figure ES.1 illustrates the study corridors and their relationship to the boundaries of the Chinatown neighborhood. Although Stockton St. also came up a concern during outreach, the study team did not pursue study of Stockton Street since the San Francisco Municipal Transportation Agency is currently studying transit and pedestrian safety improvements to Stockton Street as part of the 30 Stockton Transit Priority Project. Both Broadway and Kearny Streets are high injury corridors (HICs) designated through the city s Vision Zero initiative, which seeks to eliminate traffic fatalities in San Francisco by High injury corridors are street segments with very high concentrations of traffic related injuries and fatalities. High injury corridors make up just 12 percent of San Francisco street miles but encompass more than 70 percent of severe and fatal traffic collisions. 1 On Broadway, the study evaluates several concepts for reducing traffic volumes and improving pedestrian safety between Van Ness Avenue and Columbus Street and provides implementation recommendations. On Kearny Street, the study examines existing conditions between Bush and Jackson Streets and recommends spot intersection pedestrian safety improvements as well as several concepts for improving safety throughout the corridor. The following sections describe the approach, analysis, and results for the Broadway and Kearny Street efforts separately. The team followed a different process for each street. On Broadway Street, the team developed and evaluated several concepts for reducing traffic volumes. On Kearny Street, the team evaluated existing conditions and proposed corridor concepts to be evaluated in the next phase of study, which will be led by the San Francisco Municipal Transportation Agency. NEIGHBORHOOD TRANSPORTATION PLANS AND THE NEIGHBORHOOD TRANSPORTATION IMPROVEMENT PROGRAM The Transportation Authority supports community-based transportation improvements by leading and funding neighborhood-focused transportation planning studies. These efforts help address community transportation concerns and engage community leadership in the transportation planning process. Over the last decade, the Transportation Authority has completed several neighborhood transportation plans, working in collaboration with community groups and agency partners such as the Municipal Transportation Agency, the Department of Public Works, the Department of Public Health and other City agencies. The Transportation Authority also manages the Neighborhood Transportation Improvement Program, a Proposition K funded program established to support community-based neighborhood scale planning efforts in San Francisco. The NTIP was developed in response to mobility and equity analysis findings from the San Francisco Transportation Plan (SFTP), the city s 30-year blueprint guiding transportation investment in San Francisco. The NTIP Planning program provides $100,000 in Prop K funding for each supervisorial district to use over the next five years (Fiscal Years 2014/ /19), as well as additional funding to support capital improvements. 1 Source: PAGE 3
 Tunnel in 1952, Broadway St has served as a key conduit for commuter traffic from both inside San Francisco and regionally.")
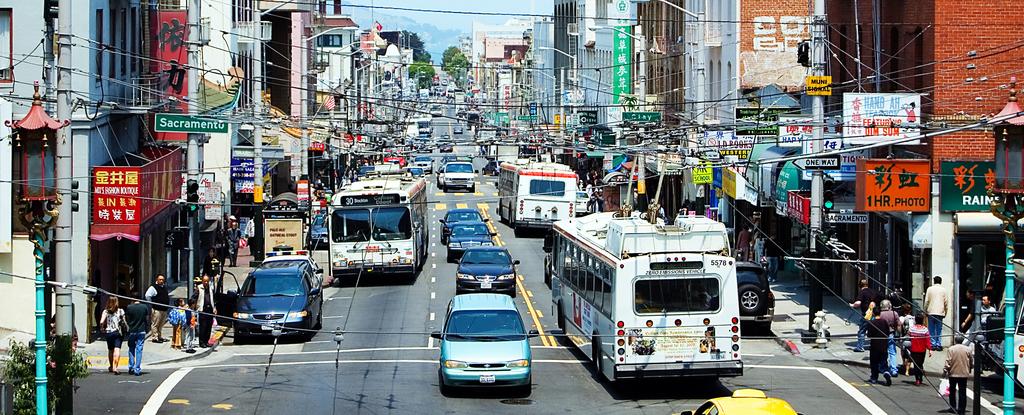
8 Morning traffic exiting the Broadway tunnel while elderly pedestrians cross at Broadway and Columbus 2. BROADWAY STREET 2.1 INTRODUCTION Since the construction of the Robert C. Levy (Broadway) Tunnel in 1952, Broadway St has served as a key conduit for commuter traffic from both inside San Francisco and regionally. Broadway east of the tunnel is also one of Chinatown s main streets, serving several schools and senior centers like the Jean Parker Elementary School and Chinatown Community Development Center s Bayside Elderly Housing. Over the years, through efforts such as the Chinatown- Broadway Street Design (2013), the Chinatown Pedestrian Safety Assessment (2010), and others, the community has worked to transform Broadway Street from a high- traffic arterial roadway to a more pedestrian-friendly environment that reflects the community character and promotes safety for Chinatown s large and vulnerable elderly population. As described above, community outreach revealed that the community remains concerned about high traffic volumes on Broadway, and particularly concerned about the potential impacts of high traffic volumes on pedestrian safety. To address these concerns, the NTP investigated existing conditions on Broadway, focusing on traffic patterns and pedestrian safety; developed several concepts for meeting community goals for reduced traffic volumes and improved pedestrian safety on Broadway; and evaluated them according to an evaluation framework that included both community goals and other technical objectives developed by the study team. PAGE 4
9 2.2 KEY FINDINGS FROM BROADWAY EXISTING CONDITIONS ASSESSMENT Broadway is a major arterial carrying high traffic volumes through a sensitive community. Broadway is a four-lane arterial carrying about 1800 vehicles inbound per hour in the average morning peak hour. During this time, the street carries more traffic than all other major east-west arterials in the northeast quadrant of the city except Bush St. Broadway is also a key main street in San Francisco s Chinatown community, which is home to many elderly and disabled residents who are particularly vulnerable to the effects of high vehicle volumes. TABLE ES-1. PLANNED PEDESTRIAN SAFETY TREATMENTS ALONG BROADWAY STREET. INTERSECTION OF BROADWAY WITH... Columbus Ave Stockton St Powell St Polk St. Van Ness Ave PROJECT (LEAD AGENCY) Columbus Avenue Street Safety Project (SFMTA) Broadway Streetscape Study (SFMTA, Planning) Broadway Streetscape Study (SFMTA, Planning) Polk Street Streetscape Design Project (SFMTA, Planning) Van Ness Bus Rapid Transit Project (SFMTA) PLANNED SAFETY TREATMENTS High visibility crosswalks (all crossings) Bicycle lanes Transit bulbouts Corner bulbouts Bus bulbouts High visibility crosswalks Leading pedestrian intervals CONSTRUCTION SCHEDULE Early Corner bulbouts 2016 Bulbouts Pedestrian countdown signals Continental crosswalks Tow-away lane removal Bicycle lane Leading pedestrian intervals Protected southbound left turn Summer In the morning peak period, the majority of Broadway traffic appears to be generated by San Francisco residents. To explore the travel markets currently using Broadway, the study team purchased data from a company that collects travel information from Geographic Positioning Systems (GPS) devices. The results suggest that nearly three-quarters of vehicles equipped with GPS devices in the Broadway tunnel during the morning peak period have origins in San Francisco. This is consistent with the SFCTA s Mobility Access and Pricing Study (2010), which found that San Francisco travelers, rather than regional travelers, account for the majority of automobile trips in the downtown area and environs during peak travel periods. Broadway is a high pedestrian injury corridor; the main cause of pedestrian collisions are conflicts between pedestrians and turning vehicles. Broadway was identified as a high-injury corridor for pedestrians through the city s WalkFirst and Vision Zero process. According to the WalkFirst analysis, collisions on Broadway disproportionately involve left- and right-turning vehicles at signalized intersections. To a lesser degree, collisions also involve unpredictable or illegal pedestrian or vehicle behavior such as vehicle speeding/drunk driving or pedestrians crossing against the signal or outside the crosswalk. Speed surveys collected by the study team confirm that speeding is occurring on Broadway during the late afternoon and evening. Each high-injury intersection along Broadway has been recently assessed for pedestrian safety and will receive treatments within the next two calendar years. City agencies are planning several improvements along Broadway in the near future, many designed to improve pedestrian safety; improvements are being planned or implemented at every high injury intersection in the study area. Table ES.1 lists the high injury intersections along Broadway between Van Ness and Columbus Avenue, and lists the planned improvements and improvement schedule. SFMTA and partner agencies developed these improvements by evaluating the causes of pedestrian collisions at each intersection and identifying solutions to address them while balancing with funding and environmental review constraints and community input. PAGE 5
10 2.3 KEY FINDINGS FROM THE EVALUATION OF IMPROVEMENT PROPOSALS As summarized above, community members expressed strong interest in reduced traffic volumes and improved pedestrian safety on Broadway. The study team worked with the community to compile ideas for meeting these objectives, and then narrowed them down to four concepts based on engineering judgement regarding their potential to affect traffic volumes on Broadway. These four included: Removal of one of two southbound left turn lanes on Van Ness Ave at Broadway. Approximately 1500 vehicles access Broadway by turning left at this intersection during the morning two-hour peak period. Constraining this turning movement could potentially discourage traffic from using Broadway. Lane removal in the Broadway tunnel as a means of traffic calming, reducing the attractiveness of Broadway relative to other routes, and providing opportunities to repurpose some of the space for other modes. Adding a left turn lane on eastbound Lombard St at Van Ness as a means of increasing the attractiveness of the Lombard/Van Ness Avenue/Bay St. route into downtown/north Beach relative to accessing this area via the Broadway tunnel. Adjusting signal timing on Broadway by implementing leading pedestrian intervals (LPIs) at all crossings and reducing signal time for eastbound through vehicles. Leading pedestrian intervals allow pedestrians to begin crossing a few seconds ahead of turning vehicles, thereby reducing the potential for conflict. Several studies have shown leading pedestrian intervals to be an effective pedestrian safety improvement measure. 2 Working with the community, staff developed a draft technical framework for evaluating the proposed solutions to reducing traffic volumes on Broadway and potentially benefitting pedestrian safety. The framework incorporates not just community interests but also potential tradeoffs with automobile congestion, transit travel time, and effects on the character of nearby streets. Cost was not evaluated, as each of the four proposals would be relatively low-cost to implement (e.g. all involve adjustments to road striping and/or signal timing rather than major capital investments). Table ES.2 presents the final framework, which incorporates community feedback. TABLE ES-2. PERFORMANCE FRAMEWORK EVALUATION QUESTION Would the strategy improve pedestrian safety? Would the strategy reduce traffic volumes on Broadway? Would the strategy reduce traffic speeds on Broadway? Would the strategy change the character of nearby streets? Would the strategy cause a worsening in traffic congestion in Chinatown? Would the strategy result in delays to transit vehicles operating on Broadway or Van Ness Ave? PERFORMANCE MEASURE Pedestrian injuries Traffic volumes on Broadway east of tunnel Traffic speeds eastbound Broadway/segment of east tunnel Traffic volume and congestion on nearby streets Substantial increase in traffic delays, measured in intersection dalay Transit travel times and speeds 2 For example, visit: Fayish A. and Gross, F. Safety Effectiveness of Leading Pedestrian Intervals Evaluated by a Before After Study with Comparison Groups. Transportation Research Record: Journal of the Transportation Research Board, No. 2198, Washington, D.C., 2010, pp PAGE 6
11 EVALUATION SUMMARY Staff evaluated the four proposals using the Transportation Authority s SF-DTA traffic simulation model. Table ES.3 below summarizes the evaluation findings, Comparisons reflect the difference between conditions in 2020 with and without the network change. Chapter 2 contains the full evaluation results. Overall, the results indicate that the Broadway signal timing concept best meets the community s goals for reduced traffic and improved pedestrian safety. Leading pedestrian intervals can directly benefit pedestrian safety by reducing the potential for conflicts between pedestrians and vehicles at intersections. Leading pedestrian intervals also directly address conflicts between pedestrians and left- and right- turning vehicles, which are the main source of pedestrian collisions on Broadway. If implemented systematically along the corridor by reducing signal time available for eastbound vehicles, the changes could also potentially reduce traffic volumes on Broadway during the morning peak period. The Broadway tunnel lane removal could slightly reduce traffic volumes on Broadway by creating congestion that would deter vehicles from using the tunnel. It would not be expected to directly improve pedestrian safety if only implemented within the Broadway tunnel, since pedestrians are protected from vehicles within the tunnel. The Broadway Van Ness left turn removal reduces traffic volumes on Broadway at Van Ness Avenue, but traffic volumes east of the tunnel remain about the same. Vehicles can use other routes to access Broadway if the left turn from Van Ness Avenue to Broadway becomes congested. This approach does not directly affect interactions between vehicles and pedestrians on Broadway and therefore would not be expected to benefit pedestrian safety. 3 The additional left turn lane at Lombard and Van Ness Avenue did not measurably 4 affect traffic volumes on Broadway. Adding a left turn lane was intended to increase the capacity of the intersection for left-turning vehicles and the attractiveness of Lombard/Bay Street as an alternative to Broadway for vehicles headed downtown. However, due to space and signal timing constraints at the intersection, adding an additional left turn lane does not significantly increase left-turning capacity. Appendix A provides more detail. TABLE ES-3. CONCEPT EVALUATION RESULTS Improve pedestrian safety Reduce vehicle volumes on Broadway Reduce traffic speeds on Broadway Avoid changing the character of nearby streets Avoid congestion on Broadway Avoid transit delay on Broadway or Van Ness Avenue LEFT TURN LANE REMOVAL AND VAN NESS AND BROADWAY BROADWAY TUNNEL ROAD DIET ½ ½ BROADWAY SIGNAL TIMING LOMBARD VAN NESS LEFT TURN LAND INCREASE ½ KEY ½ Objective largely met Objective partly met Objective not met Notes: Traffic volume changes based on comparison of morning peak period conditions in See Chapter 2 for more detail. 3 Eliminating one of two left turn lanes at the intersection of Broadway and Van Ness Avenue could benefit pedestrian safety directly by reducing conflicts between pedestrians crossing on the east leg of the intersection and southbound left turning vehicles. However, the potential for these conflicts will be eliminated in the future after implementation of the Van Ness Bus Rapid Transit project, which will provide a protected signal phase for southbound left turning vehicles. Once the protected signal phase is in place, vehicles will no longer be allowed to turn while pedestrians are crossing. 4 A small reduction in traffic volume resulted but was considered to be within the margin of error of the model. PAGE 7
12 2.4 RECOMMENDATIONS FOR BROADWAY As a follow up to the evaluation of corridor concepts for Broadway, the SFCTA team worked collaboratively with the San Francisco Municipal Transportation Agency (SFMTA) to identify locations along Broadway where implementation of leading pedestrian intervals could be considered as part of the city s WalkFirst initiative. The team provided information on which intersections are the best candidates for leading pedestrian intervals based on their collision history (e.g. prevalence of collisions involving pedestrians and turning vehicles), and the volumes of pedestrians and turning vehicles (Appendix B contains this information). SFMTA currently plans to implement LPIs at the intersections of Broadway with Stockton and Polk streets. Note that LPIs are just one of several tools that can be used to improve safety at intersections for pedestrians. As indicated in Table ES.1, SFMTA is implementing safety treatments at all major intersections along Broadway between Van Ness Avenue and Columbus in the next two years. The study team further recommends that the San Francisco Department of Public Health and the San Francisco Municipal Transportation Agency conduct a before-andafter safety evaluation of planned treatments on Broadway to determine how they affect safety on Broadway and to monitor any changes to traffic volumes. PAGE 8

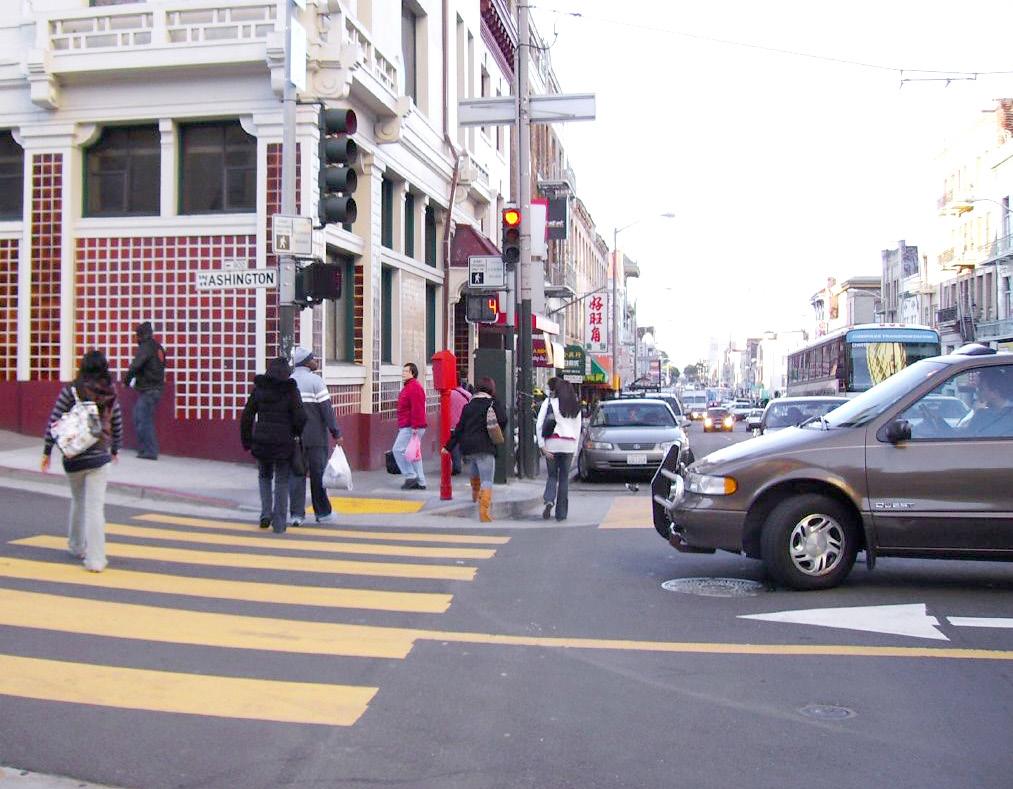
13 An elderly pedestrian crosses Kearny street Image Credit: CCDC Urban Insitute 3. KEARNY STREET Beyond reducing traffic volumes and improving safety on Broadway, Chinatown community members (especially the Chinatown Community Development Center, Chinatown TRIP, and Self Help for the Elderly), indicated a strong interest in improving pedestrian safety on Kearny St. To respond to that interest, the study team reviewed existing conditions on Kearny Street from Bush to Jackson Streets, and prepared short- and long-term improvement recommendations. The short term intersection-specific recommendations will be implemented by the SFMTA as part of the WalkFirst initiative. The long term recommendations will be evaluated further by the SFMTA in the next phase of study. 3.1 KEY FINDINGS EXISTING CONDITIONS SFCTA completed an existing conditions analysis of Kearny St drawing from several sources including field review and counts collected by the project team; data collected as part of the Planning Department s Portsmouth Square Study; data collected by the Urban Institute, a youth empowerment project of the Chinatown Community Development Center; and several other sources. Key findings are as follows: EXISTING CONDITIONS FOR PEDESTRIANS Kearny has the worst pedestrian safety record of any street in Chinatown. The Walkfirst Investment Study identified Kearny as a high injury corridor, along with Broadway and Stockton in Chinatown. However, Kearny s safety record is worse than Chinatown s two other high injury corridors, Stockton and Broadway Streets. Kearny Street from Market to Pacific is in the top ten percent of pedestrian high injury corridors citywide, ranked on the basis of severity-weighted injuries per mile. PAGE 9
14 Top pedestrian safety issues on Kearny are high vehicle speeds, unsafe turning movements (particularly right turns), insufficient pedestrian crossing time, and unsafe pedestrian behavior. In addition to these issues, dual turn lanes at Bush and Pine streets and at the entry and exits to the Portsmouth Square garage may be reducing the visibility of pedestrians to turning vehicles. Additionally, many pedestrians cross against the signal on Kearny. Speed surveys confirmed speeding is occurring on Kearny especially during the morning peak hour (7:30 8:30 a.m.) when the 85th percentile speed was recorded at 32 miles per hour, or seven miles per hour over the default speed limit of 25. The intersections of Kearny with Sacramento and Clay Streets stand out for their poor pedestrian safety records. The intersection of Kearny and Sacramento has seen the most severe injuries, with one severe injury and one fatality between The intersection of Kearny and Clay has seen the highest number of total injuries, including seven pedestrian injuries during the same period. Additionally, several community members mentioned the intersection of Kearny and Clay Street as being of particular concern for pedestrian safety during community outreach. Kearny Street offers few pedestrian amenities. All pedestrian crossings on Kearny Street from Bush to Jackson have striped continental crosswalks, but many are faded; none of the crossings have a complete set of directional curb ramps, and none have pedestrian curb extensions or bulbouts. All intersections do offer pedestrian countdown signals and are timed for slow crossing speeds. EXISTING CONDITIONS FOR PRIVATE VEHICLES, TRANSIT, AND BICYCLISTS Private vehicles and pedestrians are the dominant users of Kearny St during the evening peak period. During the peak travel period on Kearny (5-6 p.m.), private vehicles make up the largest share of overall northbound through-traffic. Northbound pedestrian volumes are also very heavy and exceed vehicle volumes at the intersections of Kearny with Bush and California Streets. Transit riders and bicyclists make up a smaller share of overall through-traffic. Kearny St is relatively uncongested during peak periods indicating excess vehicular capacity and an opportunity to re-balance the street to better achieve safety for all users and improve transit performance. In general, intersections in the study area are relatively uncongested for vehicles. The typical measure of automobile congestion is roadway level of service (LOS), which is designated A (least congested) through F (most congested). The City has a policy of maintaining LOS D or better, where possible. LOS was examined for a sample of three intersections in the study area (Pine, Clay, and Washington St.) 5, which were found to have P.M. peak period scores of LOS B, B, and A, respectively, suggesting that motor vehicle capacity is oversupplied relative to other modes of travel. During interviews with community stakeholders, several expressed that they thought Kearny St. was performing well in accommodating vehicle traffic. Muni operates at slow speeds (6-7 miles per hour on weekdays) due to narrow lane widths, closely-spaced bus stops, and conflicts with turning or parking vehicles, suggesting a need to improve Muni performance on the corridor. Lane widths of less than 10 feet throughout the corridor often require Muni buses to straddle travel lanes. The average bus stop spacing along Kearny Street between Geary Street and Columbus Avenue is about 550 feet, well below the SFMTA s proposed bus spacing guidelines of 800-1,360 feet for streets with grades of less than 10 percent. Peak period tow-away lanes are frequently violated by vehicles performing pickup and drop-off activities, requiring buses to slow down to change lanes. Kearny is a high injury corridor for bicyclists and lacks bicycle facilities. The San Francisco Department of Public Health has identified Kearny St as a high injury corridor for bicyclists. 6 This segment of Kearny St. does not currently have any bicycle facilities and is not indicated as a bicycle route on SFMTA s San Francisco Bikeway Network Map. However, SFM- TA identified Kearny (from Market St. to Columbus) as a priority study corridor as part of implementation of the 2013 SFMTA Bicycle Strategy. 5 LOS values for Kearny & Clay and Kearny and Washington are drawn from the Portsmouth Square Existing Conditions Report (2014) completed by the planning department. 6 Source: San Francisco Department of Public Health, PAGE 10
15 3.2 PRIORITY SHORT TERM SAFETY TREATMENTS The study team developed short-term recommendations for the Kearny Street corridor, focusing on treatments to improve pedestrian safety in support of the city s Vision Zero and WalkFirst initiatives. Safety countermeasures were drawn from the toolbox of short-term, high-impact pedestrian safety countermeasures identified during the city s WalkFirst Investment Study ( The toolbox was refined to address the pedestrian collision history and the conditions that may contribute to collisions in the future. SITE SPECIFIC RECOMMENDATIONS The Sacramento Street and Clay Street intersections are recommended for top priority treatment because they have had the highest frequency of severe and total collisions, respectively, over the last five years, among intersections in the study corridor. As of the time of publication of this report, the SFMTA was moving forward with short-term treatments at the Sacramento Street intersection consisting of re-striped continental crosswalks and extended red no-parking zones around the intersection to improve the visibility of crossing pedestrians to turning vehicles. The SFMTA will be implementing the following additional treatments at the intersection of Clay and Kearny: Leading pedestrian intervals (LPIs) on the east/west crossings (LPIs were already in place on the north and south crossings). Leading pedestrian intervals give crossing pedestrians a head start before vehicles begin to turn, and can reduce collisions involving pedestrians and turning vehicles. Advanced limit line at northbound Kearny Street. Advance limit lines encourage motorists to come to a full stop farther away from the marked crosswalk and can reduce the number of vehicles encroaching on the crosswalk. Extended red no-parking zones and a no left turn on red for eastbound Clay Street. Restricting left turns on red will reduce or eliminate conflicts between leftturning vehicles and crossing pedestrians. Improved pedestrian and vehicular circulation around the Portsmouth Square Garage in order to enhance pedestrian safety and reduce driver confusion regarding garage driveway operations. 3.3 NEXT STEPS SFMTA will be moving forward with a comprehensive analysis of all transportation modes with the goal of developing recommendations to improve conditions for all people using Kearny Street, beginning summer The following three pedestrian safety improvement concepts are recommended for analysis during the next phase. These will need to be considered in conjunction with other corridor issues including slow Muni speeds and high concentrations of bicyclist injuries. SYSTEMATIC SIGNAL TIMING AND STRIPING TREATMENTS One concept would be to systematically implement signal timing and striping treatments along the Kearny corridor. These could include: Re-time signals along the corridor to reduce vehicle speeds. Current signal timing progression is set to promote vehicle speeds of 30 miles per hour. Reducing vehicle speeds could significantly reduce the share of pedestrian collisions that end in serious injury or fatality in the short term. Provide high-visibility continental crosswalks at all crossings to discourage vehicles from violating pedestrian right of way. Continental crosswalks are currently available at all intersections but many have faded over time or are in less visible colors. Convert dual turn lanes to single left turn lanes to eliminate multiple threat conflicts between pedestrians and turning vehicles. Dual turn lanes currently exist at the intersections of Kearny with Pine and Bush Streets as well as at the entry and exit of the Portsmouth Square garage. The dual left turn lane at Pine St., for example, appears appropriate for removal and could potentially be removed without increasing delay for vehicles or transit (Appendix B). One of the two left turn lanes could be removed at this location without substantial adverse impacts on automobile level of service (Appendix B). Implement leading pedestrian intervals where appropriate to reduce conflicts between pedestrians and turning vehicles. Appendix B suggests where LPIs would be most appropriate. Provide temporary painted safety zones where appropriate to slow turning vehicles. These consist of colored pavement in lieu of a pedestrian curb extension. They provide drivers a visual cue to keep their distance from the curb and turn more slowly. 6 Source: San Francisco Department of Public Health, PAGE 11
16 The advantage of the signal timing and striping approach is that it would require little to no new infrastructure and therefore could be implemented quickly at a low cost. By combining systematic implementation of leading pedestrian intervals with slowing signal progression, it would also help address two of the top contributors to pedestrian injuries on the corridor, namely conflicts between pedestrians and turning vehicles, and high vehicle speeds. PEDESTRIAN SCRAMBLES Another concept would be to implement pedestrian scrambles at a series of intersections along the corridor, similar to how portions of Montgomery and Stockton Street are designed today; several community members requested pedestrian scrambles for the corridor during public outreach. Pedestrian scrambles involve creating an exclusive signal phase in which pedestrians can cross in all directions while vehicles wait. If pedestrians and vehicles understand and obey the scramble phase, the scramble can eliminate conflicts between pedestrians and turning vehicles, which are a top contributor to collisions along the corridor. Scrambles can sometimes increase delay for transit and vehicles, but could also reduce delay by eliminating the need for right-turning vehicles to wait for crossing pedestrians. Pedestrians may also need to wait longer to cross, which could increase violations. An intersection operations analysis would be needed to determine whether scrambles would increase intersection delay. Scrambles may require new signal hardware (e.g. signal poles and heads) and may trigger the need for curb ramp upgrades, which can increase the project cost and timeline. ROAD DIET TABLE ES-3. PROPOSED CORRIDOR CONCEPTS AND POTENTIAL CORRIDOR ISSUES ADDRESSED A final corridor concept would be to remove a travel lane and repurpose the space for some other use, such as a protected bicycle lane or transit-only lane. This could improve pedestrian safety by reducing vehicle speeds due to lower vehicle throughput capacity and by reducing pedestrian exposure for pedestrians crossing the street. Depending on how the lane was repurposed, the road diet could provide a protected lane for bicyclists, improve transit performance, or enhance the pedestrian environment. On the other hand, reduced capacity would likely increase delay to vehicles and transit, unless transit were provided with a protected lane or other transit priority features. The delay impacts would need to be quantified through an intersection operations analysis. In addition to these concepts, the potential of converting the street from two-way to one-way was briefly considered but is not recommended for further study at this time. The conversion could potentially reduce speeds, but might also generate additional conflicts between pedestrians and turning vehicles. Additionally, it would trigger a review of traffic circulation in the surrounding area which could extend the timeframe for analysis and implementation of treatments. Table ES.3. provides a summary of the top corridor issues and how they would be addressed by the proposed concepts for further study. CORRIDOR ISSUES SIGNAL TIMING AND STRIPING PEDESTRIAN SCRAMBLES ROAD DIET WITH TRANSIT AND/OR BICYCLE LANE Fast moving vehicles Conflicts between pedestrians and turning vehicles Long crossing distances for elderly pedestrians a a Pedestrian violations/jaywalking a Slow transit speeds b Lack of bicycle facilities c NOTES: a. could emerge as a benefit if project were implemented in conjunction with pedestrian or transit curb extensions or bulbouts. b. Potential benefit if vehicle lane converted to transit-only lane c. Potential benefit if vehicle lane converted to bicycle lane Likely benefit Potential benefit PAGE 12
 is a community-based transportation planning study led by the San Francisco County Transportation Authority")
17 CHINATOWN NEIGHBORHOOD TRANSPORTATION PLAN 1. INTRODUCTION AND STUDY OVERVIEW The Chinatown Neighborhood Transportation Plan (NTP) is a community-based transportation planning study led by the San Francisco County Transportation Authority (Transportation Authority), in partnership with community organizations in the Chinatown neighborhood. The NTP was funded by San Francisco s Proposition K halfcent sales tax for transportation, and through the Metropolitan Transportation Commission s Community-Based Transportation Planning program, which directs planning funds to low-income and minority communities to help them build consensus of transportation issues and identify solutions to address high-priority needs. 1.1 NEIGHBORHOOD TRANSPORTATION PLANNING PROGRAM The Chinatown NTP is part of the Bay Area Community- Based Transportation Planning (CBTP) program, an MTC initiative. The goal of these programs is to build consensus within communities on transportation problems and identify solutions to address high-priority needs. Each NTP study: Works with the community to identify pressing transportation issues and needs; Collaborates with community-based organizations to substantively involve and engage members of the community throughout the study process; Develops high-priority transportation solutions through technical analysis, agency participation, and public outreach; and Builds the capacity of the community for continued involvement to help advance recommendations to implementation. 1.2 SETTING, CONTEXT AND APPROACH CHINATOWN San Francisco s Chinatown is the largest Chinatown outside of Asia and the oldest Chinatown in North America, and is one of the city s top tourist attractions. In addition to being a vibrant cultural and historic center, Chinatown is home to a uniquely vulnerable population, leading the Bay Area Metropolitan Transportation Commission to designate it as a regional Community of Concern (COC) 7. Figure 1 shows the demographic factors and thresholds used to define COCs, and indicates the percentage of these populations as a share of the total population in central Chinatown 8 ; the Chinatown Community of Con- FIGURE 1. CHINATOWN DEMOGRAPHIC CHARACTERISTICS Central Chinatown* Chinatown Community of Concern** Regional Threshold for a Community of Concern Bay Area Average For more information about regional Communities of Concern, visit Concern.pdf 8 Census tract 114. Percent Minority Population Percent Low Income Percent Limited English Proficient Percent Zero-vehicle Households Percent Age 75+ Percent With a Disability Source: Metropolitan Transportation Commission, 2013, One Bay Area Draft Equity Analysis Report. *As represented by Census Tract 114. **Includes parts of downtown San Francisco, North Beach, and Treasure Island. PAGE 13
18 cern (which includes downtown, North Beach, and Treasure Island); as well as the entire Bay Area. Nearly a third of central Chinatown s population is disabled; more than 80 percent are low income, minority, and do not own a vehicle. The concentrations of minority, low-income, limited English proficiency, zero-vehicle, elderly, and disabled populations in Chinatown are among the highest in the Bay Area and well above the thresholds necessary to establish a COC. STUDY FOCUS The Community Based Transportation Program is designed to be flexible, in order to respond to the unique context of individual neighborhoods. Based on community input provided early in the study, the NTP focused on the community s top concern improving pedestrian safety on two of the neighborhood s pedestrian high injury corridors Broadway and Kearny (Figure 2). Although Stockton St. also came up as a concern during outreach, the study team did not pursue study of Stockton Street since the San Francisco Municipal Transportation Agency is currently studying transit and pedestrian safety improvements to Stockton Street as part of the 30 Stockton Transit Priority Project. High injury corridors (HICs) are street segments that have very high concentrations of traffic related injuries and fatalities. High injury corridors make up just 12 percent of San Francisco street miles but encompass more than 70 percent of severe and fatal traffic collisions. 9 Figure 3 illustrates the high injuries corridors in Chinatown. On Broadway, the study evaluates whether several community-proposed ideas for improving pedestrian safety and calming traffic would be beneficial for the corridor. On Kearny, the study examines existing conditions for pedestrians and proposes potential safety improvement concepts for SFMTA to evaluate as the corridor is examined for rollout of Muni Forward, WalkFirst, and the Citywide Bicycle Strategy. The remainder of the report describes the history and conditions, potential treatments, and evaluation results on Broadway and Kearny. 1.3 COMMUNITY INVOLVEMENT The NTP included community involvement at several stages of the project. Outreach activities consisted of: Community meetings convened by the Chinatown Community Development Center (CCDC), a community based organization working to build community and enhance quality of life for San Francisco residents. Interviews, small group discussions, and intercept surveys collected by the CCDC s Urban Institute summer program. Meetings with Chinatown Transportation Research and Improvement Project (TRIP), a community volunteer organization with the mission to improve quality of life for residents, shoppers, merchants, workers, city agencies, and tourists. Interviews with community leaders in including representatives of the Chinatown Salvation Army, Cathay Post, the Chinatown Neighborhood Association, Chinese New Comers, Self Help for the Elderly, and management of the Portsmouth Square garage. 1.4 PREVIOUS STUDIES AND INITIATIVES Chinatown has seen numerous transportation planning studies completed in recent years. The following list highlights a few. CURRENT TRANSPORTATION PROJECTS & STUDIES Chinatown Broadway Street Design. The Planning Department, in collaboration with Public Works, SFMTA, and the Chinatown Community Development Center, developed a streetscape design for Broadway from the Broadway Tunnel to Columbus Avenue. The project builds on the improvements to Broadway east of Columbus Avenue. The project is funded and construction is expected to begin spring/summer of Columbus Avenue Safety Project. The San Francisco Municipal Transportation Agency is proposing safety measures for pedestrians on Columbus Avenue from Green to Broadway Streets. Proposed pedestrian safety improvements are being funded through a combination of SFMTA revenue bonds (approximately $509,000) and Proposition B bonds (approximately $800,000). These improvements are being coordinated with an existing paving project led by San Francisco Department of Public Works. Construction is expected to begin in early Source: San Francisco Department of Public Health, 2015, as indicated on PAGE 14
19 Portsmouth Square Area Project. The Portsmouth Square Area Project is a joint effort of the San Francisco Planning Department and the San Francisco Recreation and Parks Department to re-imagine one of the city s most significant historic, cultural, and civic spaces. An Existing Conditions report has been completed. The next phase of the project will focus on developing a concept design. The Polk Streetscape Project will implement the following improvements at Broadway and Polk: bulbouts into Broadway to reduce the crossing distance and conflicts between turning vehicles and people walking, leading pedestrian interval, transit bulb, removal of peak hour tow-away lane, southbound bike lane, and continental crosswalks. Construction is scheduled to begin in Summer Van Ness Avenue Bus Rapid Transit. The Van Ness Avenue Bus Rapid Transit project will change the southbound left-turn signal phasing from a combination permitted/protected movement to a protected movement (e.g. double-left turn arrows). This will eliminate current conflicts between southbound left-turning vehicles and pedestrians crossing north-south on the east side of Broadway. Construction is expected to start in WalkFirst Investment Study/Vision Zero. The WalkFirst Investment Study identified Broadway and Kearny as high pedestrian injury corridors and provided a menu of short- and medium-term recommendations for improving pedestrian safety at each intersection. One of the intersections in the study area (Kearny and Sacramento) has also been identified as a Vision Zero intersection, meaning the SFMTA has committed to implementing improvements to the intersection by Muni Forward. Muni Forward, led by the SFMTA, aims to make getting around San Francisco safer and more reliable. Several corridors in Chinatown have been identified for improvement, including Kearny St. FIGURE 2. CHINATOWN NEIGHBORHOOD AND STUDY FOCUS CORRIDORS Van Ness Ave Legend Van Ness Ave Bay St Broadway Study Focus Corridors (Outside Main Study Area) Study Focus Corridors (Inside Main Study Area) Main Study Area - Chinatown Neighborhood 0.5 Lombard St Bay St Lombard St Miles Broadway Taylor St Taylor St Columbus Ave Bush St FIGURE 3. CHINATOWN NEIGHBORHOOD HIGH INJURY CORRIDORS Pedestrian and Senior Citizen High Injury Corridors Cyclist High Injury Corridors Vehicle High Injury Corridors Main Study Area - Chinatown Neighborhood 0.5 Miles Columbus Ave Bush St Kearny St Kearny St Montgomery St Montgomery St L Source for Figure 3: San Francisco Department of Public Health, PAGE 15

20 PREVIOUS TRANSPORTATION PROJECTS OR STUDIES Columbus Avenue Neighborhood Transportation Study (2010). Completed by the Transportation Authority in 2010, this study identified narrow sidewalks, long crossing distances, and high on-street parking demand as major concerns on Columbus Avenue, and proposed improved parking management, wider sidewalks, and intersection improvements. The Chinatown Economic Action Plan was spearheaded by the San Francisco Office of Economic and Workforce Development to improve economic conditions in Chinatown. The plan cited crowded, narrow sidewalks, heavy traffic, and high parking demand as key transportation issues of concern. The plan resulted in several improvements to alleyways in Chinatown. Chinatown Community Development Center Pedestrian Safety Assessment. The Chinatown Community Development Center conducted a Pedestrian Safety Assessment in Chinatown to help identify priority areas for pedestrian safety improvement. The team studied 142 intersections in the Chinatown area then narrowed the list to 21 high-priority, high-injury intersections recommended for improvement. Figure 4 illustrates the locations of these previous and ongoing efforts. 1.5 REPORT ORGANIZATION The remainder of this report is organized into two sections corresponding to the two study corridors, Broadway and Kearny. The team followed a different process for each street. On Broadway Street, the team developed and evaluated several concepts for reducing traffic volumes. On Kearny Street, the team evaluated existing conditions for pedestrians and other types of travelers, and proposed corridor concepts to be evaluated in the next phase of study, which will be led by the San Francisco Municipal Transportation Agency. Chapter 2, Broadway St, examines the effectiveness of several community-proposed ideas for improving safety and calming traffic on Broadway and proposes improvement concepts. Chapter 3, Kearny St., describes existing conditions on Kearny St., short-term improvement recommendations, and potential longer-term improvement concepts to be carried forward in the next phase of study, which will be led by the SFMTA. FIGURE 4. PREVIOUS AND ONGOING STUDIES ALONG BROADWAY AND KEARNY Note: all intersections with collisions (all indicated with a red circle) were included in the Walkfirst Investment Study. SFMTA has prepared a menu of possible recommendations for each intersection (not shown). PAGE 16
 Tunnel in 1952, Broadway St has served as key conduit for commuter traffic from both inside San Francisco and regionally.")
21 BROADWAY ST, VAN NESS TO COLUMBUS 1. INTRODUCTION Since the construction of the Robert C. Levy (Broadway) Tunnel in 1952, Broadway St has served as key conduit for commuter traffic from both inside San Francisco and regionally. Broadway east of the tunnel is also one of Chinatown s main streets, serving several schools and senior centers like the Jean Parker Elementary School and Chinatown Community Development Center s Bayside Elderly Housing. Over the years, through efforts such as the Chinatown- Broadway Street Design (2013), the Chinatown Pedestrian Safety Assessment (2010), and others, the community has worked to transform Broadway Street from a hightraffic arterial roadway to a more pedestrian-friendly environment that reflects the community character and promotes safety for Chinatown s large and vulnerable elderly population. Community outreach held in October, 2013 and August, 2014 revealed that the community remains concerned about high traffic volumes on Broadway, and particularly concerned about the potential impacts of high traffic volumes on pedestrian safety. To address these concerns, the NTP investigated travel patterns on the Broadway corridor and evaluated several potential approaches to reduce traffic volumes and improving improving safety. It begins with a summary of existing conditions, focusing on documenting vehicle volumes and traffic patterns, then provides an evaluation of solutions according to a community-approved evaluation framework. 2. BROADWAY EXISTING CONDITIONS 2.1 VEHICLES Broadway is a major east-west arterial in the northeast quadrant of San Francisco. Traffic peaks in the morning, eastbound direction (Figure 5) at about 1800 vehicles per hour. According to analysis of modeled traffic flows, Broadway carriers more morning peak-hour traffic than all other major east-west arterials in the northeast quadrant of the city except Bush St. Broadway is also a key main street in San Francisco s Chinatown community, which is home to many elderly and disabled residents who are particularly vulnerable to the effects of high vehicle volumes. FIGURE 5. BROADWAY TRAFFIC VOLUMES BY TIME OF DAY Eastbound Westbound Vehicles per hour Source: SFCTA Count Dracula database, 2011 traffic counts. Morning traffic exiting the Broadway tunnel while elderly pedestrians cross at Broadway and Columbus PAGE 17
22 In the morning peak period, the majority of Broadway traffic appears to be generated by San Francisco residents To explore the travel markets currently using Broadway, the study team purchased data from a company that collects travel information from Geographic Positioning Systems (GPS) devices. The data purchased provides the origins and destinations of all the GPS-equipped vehicles that used the Broadway tunnel (including west bound and east bound travel) for six sample months between spring and winter 2014/ The data collection sample may not be representative of the population as a whole, since only certain vehicles (likely newer, more expensive) are equipped with GPS. Nevertheless, the data provide a partial picture of the travel patterns of those using the Broadway tunnel. Figure 6 illustrates the top origin-destination pairs for GPS-enabled vehicles using the Broadway tunnel in the morning peak period. Some neighborhoods were grouped into larger areas referred to as superdistricts. The top origins include Marin & Sonoma Counties (22 percent combined), Superdistrict 1 (the Presidio/Marina/Cow Hollow neighborhoods, 22 percent), and Superdistrict 2 (the Richmond/ Western Addition/Hayes Valley/Pacific Heights neighborhoods, 20% combined). Overall, about 74 percent of the vehicles had origins in San Francisco. The top destinations included North Beach (19%), SoMa (17%), and the financial district (13%). Overall, 90 percent of those sampled had destinations in San Francisco. Appendix C provides more detail. FIGURE 6. TOP ORIGIN DESTINATION PAIRS FOR GPS-ENABLED DRIVERS IN THE BROADWAY TUNNEL AM TIME PERIOD Marin-Sonoma Telegraph-Wharf Superdistrict 2 North North Russian Beach-Levis Hill Broadway Tunnel Chinatown South Financial District Tenderloin-Nob Hill SOMA East Superdistrict 2 South SOMA West-Mission Bay AM Time Period defined as 6:00 AM to 10:00 AM Source: Streetlight Data, 2015; Fehr & Peers, Not all origin-destination pairs are shown. Time period defined as 6:00 a.m. to 10:00 a.m. Reflects average travel patterns Not all O-D splits are shown between Source: Streetlight 4/2014 Data, and 2014; Fehr 2/2015. & Peers, Data were collected during April, June, September, November and December 2014 and February PAGE 18
23 Polk St Van Ness Ave CHINATOWN NEIGHBORHOOD TRANSPORTATION PLAN FINAL REPORT The data suggest that a significant share of those using the Broadway have origins and destinations in San Francisco. This is consistent with the SFCTA s Mobility Access and Pricing Study (2010), which found that San Francisco travelers, rather than regional travelers, account for the majority of automobile trips in the downtown area and environs during peak travel periods. Broadway is a high injury corridor for both vehicles and pedestrians. Figure 7 illustrates the locations of pedestrian-vehicle, vehicle-vehicle, and bicycle-vehicle collisions along Broadway Collisions are concentrated at the intersections of Columbus, Stockton, Powell, Polk, and Van Ness Avenue. 2.2 PEDESTRIANS Broadway was identified as a high-injury corridor for pedestrians through the city s Walkfirst and Vision Zero process. According to the Walkfirst analysis, collisions on Broadway disproportionately involve left- and rightturning vehicles at signalized intersections. To a lesser degree, collisions also involve unpredictable or illegal pedestrian or vehicle behavior such as vehicle speeding/ drunk driving or pedestrians crossing against the signal or outside the crosswalk. FIGURE 7. BROADWAY COLLISIONS INCLUDING PEDESTRIANS, VEHICLES, AND BICYCLISTS Powell St Columbus Ave Broadway User Type and Crash Severity Pedestrian, Fatality or Severe Injury Pedestrian, Minor Injury Bicyclist, Fatality or Severe Injury Bicyclist, Minor Injury Vehicles, Fatality or Severe Injury Vehicles, Minor Injury Number of Collisions Mi PAGE 19
 appears to be the riskiest time of day for pedestrians, accounting for about 26 percent of pedestrian collisions but only about 13 percent of daily vehicle volume.")
24 As shown in Figure 8, about a quarter of pedestrian collisions have historically occurred during the morning peak period (defined in the graphic as 7 am 10 am). After taking into account variations in vehicle volume throughout the day, the evening (e.g pm) appears to be the riskiest time of day for pedestrians, accounting for about 26 percent of pedestrian collisions but only about 13 percent of daily vehicle volume. TABLE 1. 85TH PERCENTILE SPEED SURVEY RESULTS POSTED SPEED LIMIT AM PM EVENING 1 EB Tunnel Exit EB Broadway WB Broadway Since speeding was identified as a contributing factor for pedestrian collisions, data on vehicle speeds was collected in three locations along Broadway, including eastbound Broadway at the exit of the Broadway Tunnel, Eastbound Broadway between Powell and Stockton Streets, and Westbound Broadway between Powell and Stockton Streets, 11 during the following time periods: AM Peak (7:30-8:30AM) PM Peak (5:00-6:00PM) Evening Off-peak (8:00-9:00PM) Table 1 presents the results, which indicate that speeding is occurring on Broadway particularly during the lesscongested P.M. and evening periods. FIGURE 8. PEDESTRIAN COLLISIONS ON BROADWAY ( ) BY TIME OF DAY COMPARED TO 2011 TRAFFIC VOLUMES Number of Collissions ( ) Collisions Traffic Volume 10,000 9,000 8,000 7,000 6,000 5,000 4,000 3,000 2,000 1,000 Traffic Volumes for Time Period (2011) 0 AM Peak Mid-Day PM Peak Evening Late Night/ Early Morning 0 Source: Collisions by intersection drawn from the Statewide Traffic Integrated Records System (SWITRS). Traffic volumes by time of day represent 2011 mainline traffic volumes collected on Broadway between Larkin and Hyde Streets. 11 Speed observations were recorded only for vehicles that were neither accelerating nor decelerating from a stop light. Therefore, these speed surveys represent the general speeds of flowing traffic at the mid-block survey locations. Speed observations were collected by a surveyor using a radar gun, which may introduce bias to the driver behavior; drivers may slow down when catching sight of a person monitoring their speed, and thus the results should be used with caution. PAGE 20

25 2.3 TRANSIT Muni route 30X (Marina Express) runs along the Broadway tunnel providing service between the Marina and the financial district during peak periods only. This route is not a Muni Forward corridor. Additionally, Golden Gate Transit routes 27, 92X and the 97 run down Van Ness Avenue and then along Broadway to connect commuters from Marin County with the financial district. 2.4 BICYCLISTS Broadway is a designated city bicycle route (Route 10), but the street currently lacks bicycle facilities such as separated bicycle lanes, shared-use markings, or other accommodations. 2.5 PLANNED IMPROVEMENTS As described previously, city agencies are planning several major improvements along Broadway in the near future, many designed to improve pedestrian safety; improvements are being implemented at every high injury intersection in the study area. Table 2 lists the high injury intersections along Broadway between Van Ness and Columbus Avenue, and lists the planned improvements and improvement schedule. TABLE 2. PLANNED PEDESTRIAN SAFETY TREATMENTS ALONG BROADWAY STREET. INTERSECTION OF BROADWAY WITH... Columbus Ave Stockton St Powell St Polk St. Van Ness Ave PROJECT (LEAD AGENCY) Columbus Avenue Street Safety Project (SFMTA) Broadway Streetscape Study (SFMTA, Planning) Broadway Streetscape Study (SFMTA, Planning) Polk Street Streetscape Design Project (SFMTA, Planning) Van Ness Bus Rapid Transit Project (SFMTA) PLANNED SAFETY TREATMENTS High visibility crosswalks (all crossings) Bicycle lanes Transit bulbouts Corner bulbouts Bus bulbouts High visibility crosswalks Leading pedestrian intervals CONSTRUCTION SCHEDULE Early Corner bulbouts 2016 Bulbouts Pedestrian countdown signals Continental crosswalks Tow-away lane removal Bicycle lane Leading pedestrian intervals Protected southbound left turn Summer A bicyclist mounts the hill rather than entering the Broadway tunnel PAGE 21


26 3. COMMUNITY OUTREACH RESULTS AND PERFORMANCE FRAMEWORK 3.1 COMMUNITY OUTREACH RESULTS Community outreach held in October, 2013 and August, 2014 revealed that in spite of the pedestrian safety investments being made all along Broadway, the community remains concerned about high traffic volumes on Broadway, and particularly that high traffic volumes could be contributing to poor safety outcomes on the corridor. Figure 9 lists the responses to a survey distributed at the outreach meeting which asked attendees what they considered to be the most important transportation problems in the neighborhood- pedestrian safety and heavy traffic emerged as the top two concerns. Community members proposed several ideas for improving pedestrian safety and reducing traffic volumes on Broadway. The top suggestion was to remove one of two southbound left turn lanes on Van Ness Ave at Broadway on a pilot basis. In the morning peak period (7-9 a.m.), approximately 800-1,000 vehicles access Broadway by turning left at this intersection (Appendix D). Dual southbound left turn lane at Broadway and Van Ness Vehicles currently must wait for gaps in traffic to turn at this intersection, as the intersection has a permissive followed by a protective signal phase. The pilot would test whether removal of one southbound left turn lane would discourage some vehicles from using the intersection, thereby reducing the number of vehicles on Broadway and potentially improving pedestrian safety along the corridor by decreasing the potential for vehicle-pedestrian conflicts. FIGURE 9. COMMUNITY MEETING SURVEY RESPONSES REGARDING IMPORTANT AND MOST IMPORTANT TRANSPORTATION PROBLEMS IN THE CHINATOWN NEIGHBORHOOD Lack of on-street parking Other transportation problem (insufficient Muni service) Problems with alleys Important Most important transportation problem in our neighborhood Bicyclist safety Lack of transit shelters and seating Lack of landscaping seating, street trees, and public art Fast-moving traffic Narrow, crowded sidewalks Heavy traffic Pedestrian safety PAGE 22
27 Several other ideas for addressing traffic volumes and pedestrian safety on Broadway were expressed at the meeting or developed by the study team in subsequent discussions with community stakeholder organizations. These were narrowed down to a short list of four ideas based on the study team s judgement regarding which held the most promise for reducing traffic volumes on Broadway. These included: Removal of one of two southbound left turn lanes on Van Ness Ave at Broadway. Approximately 1500 vehicles access Broadway by turning left at this intersection during the morning two-hour peak period. Constraining this turning movement could potentially discourage traffic from using Broadway. Lane removal in the Broadway tunnel as a means of traffic calming, reducing the attractiveness of Broadway relative to other routes, and providing opportunities to repurpose some of the space for other modes. Adding a left turn lane on eastbound Lombard St at Van Ness as a means of increasing the attractiveness of the Lombard/Van Ness Avenue/Bay St. route into downtown/north Beach relative to accessing this area via the Broadway tunnel. Adjusting signal timing on Broadway to by implementing leading pedestrian intervals (LPIs) at all crossings and reducing signal time for eastbound through vehicles. Leading pedestrian intervals allow pedestrians to begin crossing a few seconds ahead of turning vehicles, thereby reducing the potential for conflict. Several studies have shown leading pedestrian intervals to be an effective pedestrian safety improvement measure PERFORMANCE FRAMEWORK In response to community interests and concerns, staff developed a draft framework for evaluating the proposed solutions to improving pedestrian safety and reducing traffic volumes on Broadway. The framework incorporates not just community interests but also potential tradeoffs with automobile congestion, transit travel time, and affects to the character of nearby streets. The final framework (Table 3) incorporated input collected at a subsequent community meeting. TABLE 3. PERFORMANCE FRAMEWORK EVALUATION QUESTION Would the strategy improve pedestrian safety? Would the strategy reduce traffic volumes on Broadway? Would the strategy reduce traffic speeds on Broadway? Would the strategy change the character of nearby streets? Would the strategy cause a worsening in traffic congestion in Chinatown? Would the strategy result in delays to transit vehicles operating on Broadway or Van Ness Ave? PERFORMANCE MEASURE Pedestrian injuries Traffic volumes on Broadway east of tunnel Traffic speeds eastbound Broadway/segment of east tunnel Traffic volume and congestion on nearby streets Substantial increase in traffic delays, measured in intersection dalay Transit travel times and speeds 12 For example, visit: Fayish A. and Gross, F. Safety Effectiveness of Leading Pedestrian Intervals Evaluated by a Before After Study with Comparison Groups. Transportation Research Record: Journal of the Transportation Research Board, No. 2198, Washington, D.C., 2010, pp PAGE 23


28 4. CONCEPT ANALYSIS 4.1 ANALYSIS ASSUMPTIONS The study team initially investigated whether the leftturn removal at Broadway and Van Ness could be evaluated through a pilot project, and prepared supporting traffic analysis projections for Caltrans review and approval (Appendix D), which would be required for a pilot project on Van Ness Avenue, a state highway. Ultimately, the technical team recommended that the concept be evaluated using a traffic simulation model, rather than a real-world pilot, to better capture how the lane removal would perform in conjunction with the Van Ness Bus Rapid Transit Project. The Van Ness Bus Rapid Transit project will begin construction in early 2017, and will result in the conversion of one general-purpose lane in each direction into a transit only lane along Van Ness Avenue from Lombard to Mission Streets. Figure 10 compares today s conditions with a proposed rendering of the corridor after BRT construction. The SFCTA s SF-DTA traffic simulation model (SF-DTA) can simulate how the lane removal and other proposals would affect travel patterns after the roadway has been reconfigured for the Van Ness Bus Rapid Transit project. The SF-DTA model is a temporally dynamic, mesoscopic traffic simulation model that contains a highly detailed representation of San Francisco s street network, including lane configurations, turn restrictions, and signal timing at every intersection in San Francisco. The SF-DTA Model also represents all surface-running transit routes including frequencies and vehicle types. The model simulates all motorized vehicle (e.g. cars, trucks, and transit vehicles) travel occurring on surface streets in San Francisco, using travel forecasts produced by the authority s regional travel demand model (SF-CHAMP) which ultimately derive from regional and state household travel surveys and traffic counts collected on city streets. The SF-DTA model allows comparison of two scenarios with different network inputs shows how network changes such as signal timing changes, roadway capacity increases or decreases, and other street changes could affect driver routes, traffic volumes, and the operational performance of city streets. The model does not predict how travelers would change their modes of travel (e.g. switch from driving to transit, for example) in response to changes in the transportation network. For the purpose of this study, the Transportation Authority developed a version of the DTA model for the morning peak commute traffic period, which is the peak travel period on Broadway (see Figure 2). The model was validated for reasonableness and calibrated where necessary through comparison to actual traffic counts collected on city streets. The analysis scenarios simulate a hybrid 2015/2020 scenario. 13 The following describes the assumptions made in modeling the strategies: Van Ness Broadway Lane Removal: One of the two planned southbound left turn lanes on Van Ness Avenue at Broadway was removed and minor signal timing adjustments were incorporated to provide more green time for the southbound left turn and slightly less for the northbound through movement. Broadway Tunnel Road Diet: One of two lanes in each direction (eastbound and westbound) of the Broadway tunnel was converted into a transit-only lane. No signal timing adjustments were made. Broadway Signal Timing: A four-second leading pedestrian interval was added to each pedestrian crossing at each intersection from Van Ness Avenue and Columbus Avenue. The green signal time was decreased commensurately for eastbound vehicles at each intersection. No other signal timing adjustments were made. FIGURE 10. COMPARISON OF EXISTING AND FUTURE CONDITIONS ALONG VAN NESS AVENUE AFTER CONSTRUCTION OF THE VAN NESS BUS RAPID TRANSIT PROJECT 13 The land use assumptions reflect Association of Bay Area Governments (ABAG) land use projections for 2015 (ABAG JHC p2013 land use), and the transportation network reflects projects PAGE 24


29 Van Ness-Lombard Capacity Increase: The eastbound approach of Lombard Street at the intersection with Van Ness Avenue was converted from one sharedthrough-left turn lane and two right turn-only lanes to one left-turn only lane, one shared-through-left-right lane, and one right-turn only lane, thus increasing the number of left-turn lanes from one to two. Appendix A provides more detail on why this configuration was chosen for modeling. 4.2 EVALUATION RESULTS This section compares the evaluation results for the four scenarios tested according to the performance framework defined in Table 3. All results reflect the difference between a 2020 baseline scenario and a 2020 project scenario (e.g. one in which the specific network change is made). TRAFFIC VOLUMES Figure 11 illustrates the predicted morning peak hour (7:45-8:45 AM) traffic volumes along Broadway at major cross streets under the four modeled scenarios. It shows that the Broadway/Van Ness southbound left turn reduction reduces traffic volumes at the intersection of Broadway and Van Ness, but travelers find their way back onto Broadway via alternate routes and traffic volumes remain largely unchanged east of the Broadway tunnel. The left turn capacity increase at Lombard and Van Ness does not measurably 14 change traffic volumes anywhere along Broadway. The remaining two scenarios (tunnel road diet and signal timing changes) reduce eastbound morning peak hour traffic volumes on Broadway by about 10 and 20 percent, respectively, at the tunnel exit relative to baseline conditions. The signal timing changes reduce peak hour traffic volumes by creating delay for eastbound vehicles. TRAFFIC SPEEDS Forecasted traffic speeds along Broadway (from Powell to Columbus) generally were not altered significantly by any of the proposals, since modeled speeds in the morning peak period in 2020 are predicted to be quite low (16 miles per hour) and remain relatively low for each scenario (Figure 12). The Broadway tunnel road diet proposal appears to increase speeds slightly, which can be explained by the fact that capacity is constrained only within the tunnel and then opens up again at the tunnel exit. Overall, the signal timing approach appeared to reduce speeds the most relative to other approaches. FIGURE BROADWAY TRAFFIC SPEED (EB AM PEAK), POWELL TO COLUMBUS Speed (miles per hour) Baseline NEARBY STREETS 16.5 SBL Removal 18.6 Tunnel Diet 15.8 Signal Timing 17.1 Lombard EBLT The effects of the proposals on traffic volumes on nearby streets was evaluated by creating volume differential maps that compare the difference in traffic volumes on each roadway segment between the 2020 baseline and the 2020 project scenarios. Segments with a significant (e.g. greater than 100 vehicles per hour) difference in traffic volume are highlighted in dark red (for increases) and dark blue (for decreases). All scenarios caused some FIGURE 11. PREDICTED MORNING PEAK HOUR (7:45-8:45 AM) EASTBOUND TRAFFIC VOLUMES IN 2020 IN DIFFERENT MODEL SCENARIOS (VEHICLES PER HOUR) Baseline SBL Removal Tunnel Diet LPIs Lombard EBLT 14 Note that anything less than 5 percent change is considered to be within the margin of error of the model and should be ignored. PAGE 25


30 FIGURE 13. MORNING PEAK HOUR TRAFFIC VOLUME DIFFERENCES UNDER THREE SCENARIOS traffic diversion to other streets. Figure 13 illustrates the trafffic diversion predicted under three of the four scenarios. Two of three scenarios (soutbound left turn removal and tunnel road diet) appear to cause some traffic volume increases on Polk Street, which is a neighborhood commercial corridor. The signal timing scenario appears to cause traffic volume increases primarily on other major arterials including Bay Street and O'Farrell. The traffic diversion effects of the fourth scenario (Lombard left turn capacity increase) were not analyzed as the scenario appeared to have little impact on traffic volumes. TRAFFIC & TRANSIT DELAY Traffic delays were evaluated by reviewing the cumulative seconds of delay per vehicle during the morning peak period (7:45 to 8:45) in 2020 on two segments of roadway: Van Ness Avenue between Lombard and Broadway and Broadway from the tunnel exit to Columbus Avenue. The results (Figure 14) indicate that all scenarios increase traffic delay on one or both of these segments, but delay increases are most significant for the southbound left turn removal at Broadway and Van Ness Avenue and the left turn capacity increase at Lombard and Van Ness Avenue. Both these scenarios cause substantial increases in traffic delay on Van Ness Avenue. The model also predicts that the southbound left turn removal scenario will result in increased queue lengths and increased instances of queues that spill back for multiple blocks, as illustrated by Figure 15. This result is supported by past analysis see Appendix E for relevant memorandum prepared by the SFMTA traffic engineer. Because transit will have a protected travel lane in the future on Van Ness Avenue, it should be insulated from most of the traffic delay resulting from these scenarios. Transit vehicles that use Broadway (including the 30X and several Golden Gate Transit lines) would be affected by the delay unless a dedicated transit lane is provided. FIGURE PEAK HOUR-DELAY (AM PEAK HOUR 7:45-8:45 AM, SECONDS OF DELAY PER VEHICLE) Baseline SBL Removal Tunnel Diet LPIs Lombard EBLT PAGE 26

31 FIGURE 15. SAMPLE QUEUE LENGTH COMPARISON BETWEEN SCENARIOS WITH A SINGLE AND DOUBLE LEFT TURN LANE ON SOUTHBOUND VAN NESS AT BROADWAY PEDESTRIAN SAFETY The SF-DTA Model does not predict traffic-related injuries and fatalities, but does predict changes in traffic volume and speed, which can impact the number of traffic injuries and fatalities that occur. The team reviewed relevant research that has attempted to quantify the relationship between traffic volumes and pedestrian injuries, including one developed by the San Francisco Department of Public Health in 2014, 15 and another developed by researchers in Canada. 16 These two models predict changes in pedestrian injuries associated with reductions in daily automobile traffic volumes. The models suggest that the change in daily traffic volumes on Broadway associated with any of the scenarios appear to be too small to measurably reduce pedestrian injuries and fatalities on Broadway. One reason for this is that the scenarios are primarily focused on reducing morning, peak period traffic, which is a small share (about 20 percent) of overall daily traffic on Broadway. Any changes to morning peak period traffic volumes have a small overall effect on daily traffic volumes, and therefore are predicted to have a small effect on pedestrian collisions which occur throughout the day. As shown in Figure 7, only about 26 percent of pedestrian collisions occur in the morning peak period on Broadway. Measures to reduce morning peak period traffic are also less effective in improving pedestrian safety because morning traffic travels at low speeds in congested conditions. Speed surveys indicate that morning peak period traffic on Broadway generally travels at the speed limit, whereas evening traffic is above the speed limit, making this a more hazardous time for pedestrians. As many pedestrian collision occur in the evening (7-10 p.m.) as the morning peak period, although the evening traffic volumes are about 40 percent lower (Figure 7). A further complication is that the strategies all result in some traffic diversion to other streets. This traffic diversion could simply shift the location of pedestrian injuries from Broadway to other locations. For these reasons, the 15 San Francisco Department of Public Health, Modeling Vehicle Pedestrian Injury Colisions at Signalized Intersections DRAFT FOR PEER REVIEW. 16 Miranda-Moreno LF1, Morency P, El-Geneidy AM.. Accid Anal Prev Sep;43(5): The link between built environment, pedestrian activity and pedestrian-vehicle collision occurrence at signalized intersections. PAGE 27
32 study team concluded that the traffic volume changes seen in the modeled scenarios would not be expected to improve pedestrian safety. The team also considered whether any of the strategies would improve pedestrian safety by directly addressing the source of pedestrian collisions, as follows: Van Ness Broadway Lane Removal: Removing one of two-left turn lanes at the intersection of Broadway and Van Ness would not be expected to have any direct implications for pedestrian safety at the intersection because vehicles would be turning on a protected signal phase that is separated from the pedestrian crossing phase. Broadway Tunnel Road Diet: Removing roadway capacity within the Broadway tunnel itself would not directly address pedestrian safety because pedestrians in the tunnel travel on a separated pathway that is elevated from vehicular traffic. Van Ness-Lombard Capacity Increase: Increasing left-turn capacity at this intersection would not directly affect pedestrian safety at the intersection or elsewhere, unless it was implemented in conjunction with a protected signal phase. Changing the signal phase from today s conditions (permissive) to a protected phase could reduce conflicts between pedestrians and vehicles at this intersection, but would not impact safety along Broadway. Broadway Signal Timing: Implementing leading pedestrian intervals (LPIs) at Broadway intersections would be expected to improve pedestrian safety. As stated previously, turning vehicles are a top contributor to pedestrian collisions on Broadway, and LPIs directly reduce conflicts between pedestrians and turning vehicles by providing pedestrians with a few seconds of lead time to cross before vehicles start turning. Several studies have demonstrated leading pedestrian intervals to be an effective pedestrian safety countermeasure at signalized intersections. 17 They are particularly appropriate at locations with high volumes of crossing pedestrians and turning vehicles. EVALUATION SUMMARY Table 4 below summarizes the evaluation findings, Comparisons reflect the difference between conditions in 2020 with and without the network change. TABLE 4. CONCEPT EVALUATION RESULTS Improve pedestrian safety Reduce vehicle volumes on Broadway Reduce traffic speeds on Broadway Avoid changing the character of nearby streets Avoid congestion on Broadway Avoid transit delay on Broadway or Van Ness Avenue LEFT TURN LANE REMOVAL AND VAN NESS AND BROADWAY BROADWAY TUNNEL ROAD DIET ½ ½ BROADWAY SIGNAL TIMING LOMBARD VAN NESS LEFT TURN LANE INCREASE ½ KEY ½ Objective largely met Objective partly met Objective not met 17 Fayish, Aaron C., and Frank Gross. "Safety Effectiveness of Leading Pedestrian Intervals Evaluated by a Before-After Study with Comparison Groups." Transportation Research Record: Journal of the Transportation Research Board 2198 (2010): (1), PAGE 28
33 Overall, the results indicate that the Broadway signal timing concept best meets the community s goals for reduced traffic and improved pedestrian safety. Leading pedestrian intervals can directly benefit pedestrian safety by reducing the potential for conflicts between pedestrians and vehicles at intersections. Leading pedestrian intervals also directly address conflicts between pedestrians and left- and right- turning vehicles, which are the main source of pedestrian collisions on Broadway. If implemented systematically along the corridor by reducing signal time available for eastbound vehicles, the changes could also potentially reduce traffic volumes on Broadway during the morning peak period. Note, however, that leading pedestrian intervals are typically designed to minimize delay effects for vehicles, so in practice, these traffic volume reductions are unlikely. The Broadway tunnel lane removal could slightly reduce traffic volumes on Broadway by creating vehicle delay that would deter vehicles from using the tunnel. It would not be expected to directly improve pedestrian safety if only implemented within the Broadway tunnel, since pedestrians are protected from vehicles within the tunnel. The Broadway Van Ness left turn removal reduces traffic volumes on Broadway at Van Ness Avenue, but traffic volumes east of the tunnel remain about the same. Vehicles can use other routes to access Broadway if the left turn from Van Ness Avenue to Broadway becomes congested. This approach does not directly affect interactions between vehicles and pedestrians on Broadway and therefore would not be expected to benefit pedestrian safety. 18 The additional left turn lane at Lombard and Van Ness Avenue did not measurably 19 affect traffic volumes on Broadway. Adding a left turn lane was intended to increase the capacity of the intersection for left-turning vehicles and the attractiveness of Lombard/Bay Street as an alternative to Broadway for vehicles headed downtown. However, due to space and signal timing constraints at the intersection, adding an additional left turn lane does not significantly increase left-turning capacity. Appendix A provides more detail. 4.4 RECOMMENDATIONS FOR BROADWAY As a follow up to the evaluation of corridor concepts for Broadway, the SFCTA team worked collaboratively with the San Francisco Municipal Transportation Agency (SFMTA) to identify locations along Broadway where implementation of leading pedestrian intervals could be considered as part of the city s WalkFirst initiative. The team provided information on which intersections are the best candidates for leading pedestrian intervals based on their collision history (e.g. prevalence of collisions involving pedestrians and turning vehicles), and the volumes of pedestrians and turning vehicles (see Appendix B). SFMTA currently plans to implement LPIs at the intersections of Broadway with Stockton and Polk Streets. Note that LPIs are just one of several tools that can be used to improve safety at intersections for pedestrians. As indicated in Table ES.1, SFMTA is implementing safety treatments at all major intersections along Broadway between Van Ness Avenue and Columbus in the next two years. The study team further recommends that the San Francisco Department of Public Health and the San Francisco Municipal Transportation Agency conduct a before-andafter safety evaluation of planned treatments on Broadway to determine how they affect safety on Broadway and to monitor any changes to traffic volumes. 18 Eliminating one of two left turn lanes at the intersection of Broadway and Van Ness Avenue could benefit pedestrian safety directly by reducing conflicts between pedestrians crossing on the east leg of the intersection and southbound left turning vehicles. However, the potential for these conflicts will be eliminated in the future after implementation of the Van Ness Bus Rapid Transit project, which will provide a protected signal phase for southbound left turning vehicles. Once the protected signal phase is in place, vehicles will no longer be allowed to turn while pedestrians are crossing. 19 A small reduction in traffic volume resulted but was considered to be within the margin of error of the model. PAGE 29
34 KEARNY ST., FROM BUSH TO JACKSON 1. INTRODUCTION Beyond reducing traffic volumes and improving safety on Broadway, Chinatown community members (especially the Chinatown Community Development Center, Chinatown TRIP, and Self Help for the Elderly), indicated a strong interest in improving pedestrian safety on Kearny Street. To respond to that interest, the study team reviewed existing conditions on Kearny Street from Bush to Jackson Streets, and prepared spot improvement recommendations and corridor safety improvement concepts. The short term intersection-specific recommendations will be implemented by the SFMTA as part of the WalkFirst initiative. The corridor concepts will be evaluated further by the SFMTA in the next phase of study. Information in this section draws from several sources including: Field review, traffic counts, speed surveys, and video recordings collected by the study team A walk audit prepared by the UC Berkeley Institute of Transportation Studies with Fehr & Peers transportation consultants on May 13, 2013 and documented as part of the City of San Francisco Pedestrian Safety Assessment, (Appendix F). Data collected by students at the Chinatown Urban Institute, a youth empowerment and professional development program offered by the Chinatown Community Development Center in San Francisco during summer This included interviews with onstreet pedestrians as well as senior residents at the International Hotel and Clayton Hotel. Interviews with several community stakeholder organizations 2. KEARNY EXISTING CONDITIONS 2.1 OVERVIEW Kearny St. from Jackson to Bush is a 0.4 mile long, oneway (northbound) major arterial with six intersecting cross streets (Bush, Pine, California, Sacramento, Clay, Washington, and Jackson). It has active street front retail, including restaurants, cafes, and banks, with several major destinations along Kearny including Portsmouth Square, the Hilton Hotel, the Saint Mary School (K-8), and City College of San Francisco. Table 5 provides an overview of Kearny s characteristics. More detail on existing conditions for each mode of travel is provided below. Because pedestrian safety was identified early on as a top community concern, the existing conditions analysis emphasizes pedestrian safety. Figure 16 provides an overview of northbound traffic volumes at each intersection on Kearny, including northbound vehicles, pedestrians, bicyclists, and transit riders. It illustrates that during the P.M. peak period, private vehicles make up the largest share of overall through-traffic. Pedestrian volumes are also very heavy and exceed vehicle volumes at the intersections of Kearny with Bush and California Streets. Transit riders and bicyclists make up a smaller share of overall through-traffic. TABLE 5. KEARNY ST. FROM JACKSON TO BUSH CORRIDOR OVERVIEW FEATURE Number of travel lanes Intersection characteristics and signal equipment Crossing distances and speeds Curb ramps Transit DESCRIPTION Three main one-way travel lanes plus two (east and west side) combined parking / tow-away lanes. Portions of the tow-away lane are operative during both a.m. and p.m. peak periods; portions operative only in the p.m. peak, and some portions (such as the east-side tow-away lane between Washington and Jackson) have been removed and are used only for parking or loading/ unloading. All intersections are signalized. Intersection signal equipment was recently updated to allow signal connectivity as part of SFMTA implementation of transit signal priority technology. Three intersections (Clay, Pine, and Bush) have dual turn lanes that create multiple-threat situations with crossing pedestrians. Crossing distances (as recorded from Google StreetView) vary from a low of approximately 28 feet at Kearny and Jackson St. to a high of 52 feet at Kearny and California. Crossing speeds are timed at a maximum of 2.9 feet per second for the combined walk and flashing don t walk phases. None of the intersections have a complete set of directional curb ramps. Kearny has several sub-floor basements that make certain ramp upgrades technically and financially challenging to complete. The MUNI 8X, 8A/BX use this portion of Kearny. Bus stops are on the right-hand (eastern) side of the street at Bush (northeast corner), California (northeast corner), Clay (northeast corner), and Jackson (southeast corner). The California Street cable car crosses at California St., and the 1 bus line crosses at Sacramento and Clay Streets. Several express lines (1, 31, 38, AX, BX) cross at Bush and Pine. PAGE 30

, pedestrian volumes (s Sum of peak hour crossing volumes in East + West")
35 FIGURE 16. KEARNY STREET PEAK HOUR (5P.M.-6P.M.) NORTHBOUND/SOUTHBOUND VOLUMES Vehicles Pedestrians Transit Riders Bicyclists Kearny and Bush Kearny and Pine Kearny and California Kearny and Sacramento Kearny and Clay Kearny and Washington Kearny and Jackson Notes: Vehicle volumes (sum of peak hour NBLeft + NBThru + NBRight), pedestrian volumes (s Sum of peak hour crossing volumes in East + West crosswalks), and bicycle volumes (sum of peak hour NBLeft + NBThru + NBRight) are drawn from peak hour (5-6 p.m.) traffic counts collected December 9th, Transit volumes are from SFMTA s Automatic Passenger Count data, and represent the average load of bus during peak hour at closest bus stop south of intersection multiplied by the number of buses in the schedule during the peak hour (9 buses). 2.3 VEHICLES Kearny provides a connection to the Financial District and Chinatown for vehicles headed north from 3rd Street, which is also a one-way arterial connecting to I-280 and I-80. Vehicles may also use Kearny to access Montgomery and head south on I-80 or US 101. Figure 17 illustrates the inbound/outbound paths of vehicles. Hourly traffic counts for a full 24-hour period were collected using an automatic traffic recorder on Thursday, May 29th and Saturday, May 31st 2014 on Kearny between Clay and Washington St. indicate that the highest volumes of automobile traffic on Kearny occur during the peak hour from 4:45 to 5:45 p.m (Figure 18). In general, intersections in the study area are relatively uncongested for vehicles. The typical measure of automobile congestion is roadway level of service (LOS). LOS is designated A through F from least congestion to most congestion, respectively. LOS was examined for a sample of three intersections in the study area (Pine, Clay, and Washington St.) 20, which were found to have P.M. peak period scores of LOS B, B, and A, respectively, based on P.M. peak period traffic counts collected in FIGURE 17. INBOUND/OUTBOUND VEHICLE PATHS CONNECTING WITH US-101 Source: San Francisco Planning Department, Portsmouth Square Area Project Existing Conditions Report LOS values for Kearny & Clay and Kearny and Washington are drawn from the Portsmouth Square Existing Conditions Report (2014) completed by the planning department. PAGE 31
 Thursday Sunday 1200 1028 1025 1009 1105 1000 800 600 400 200 0 Source: San Francisco Planning Department, Portsmouth Square Area")
36 Hourly Traffic Volume FIGURE 18. DAILY TRAFFIC VOLUMES ON KEARNY STREET (BETWEEN CLAY AND WASHINGTON) Thursday Sunday Source: San Francisco Planning Department, Portsmouth Square Area Project Existing Conditions Report 2014 This section of Kearny Street lacks posted speed signs; the default speed on San Francisco streets is 25 miles per hour unless otherwise posted. Vehicle speeds in the study area were collected on northbound Kearny St. between Jackson Street and Pacific Avenue during the following periods with the following results for the 85th percentile speeds: AM Peak (7:30-8:30AM) - 32 miles per hour. PM Peak (5:00-6:00PM) - 28 miles per hour. Evening Off-peak (8:00-9:00PM) - 28 miles per hour. TRANSIT Muni operates numerous routes in the study area, including the 8 Bayshore and 8AX/8BX Bayshore Expresses which runs northbound on Kearny St. through the full extent of the study corridor. Transit operates on most of the cross streets as well. The California Street cable car crosses at California St., and the 1 bus line crosses at Sacramento and Clay Streets. Several express lines (1, 31, 38, AX, BX) cross at Bush and Pine. Figure 19 illustrates the transit routes in the study area. Demand: Together the 8/8AX/8BX routes carry over 16,000 customers on an average weekday. Most of the 8/8AX/8BX stops within the project area north of Bush Street are primarily drop-off locations, with the highestuse stop located at Clay Street as shown in Figure 20. Facilities: Bus stops are on the right-hand (eastern) side of the street at Bush (northeast corner), California (northeast corner), Clay (northeast corner), and Jackson (southeast corner). Transit performance: The 8/8AX/8BX bus routes average 6-7 miles per hour on weekdays along Kearny Street between Geary Street and Columbus Avenue. Several factors contribute to slow transit operations, including narrow lane widths, closely-spaced bus stops, and conflicts with other vehicles making turns or parking maneuvers. Muni operates at slow speeds (6-7 miles per hour on weekdays) due to narrow lane widths, closely-spaced bus stops, and conflicts with turning or parking vehicles Lane widths of less than 10 feet throughout the corridor often require Muni buses to straddle travel lanes. The average bus stop spacing along Kearny Street between Geary Street and Columbus Avenue is about 550 feet, well below the SFMTA s proposed bus spacing guidelines of 800-1,360 feet for streets with grades of less than 10 percent. The placement of some bus stops at intersections also contributes to delays. For example, the bus stops located at the nearside of signalized intersections at Sutter and Jackson streets decrease the effectiveness of transit signal priority, and the high volume of right-turning vehicles at Jackson Street makes it difficult for bus operators to exit the nearside bus stop at this intersection. During peak periods, traffic congestion on cross-streets results in vehicle queues blocking Kearny Street and slowing bus operations, particularly at Post Street. Peak period tow-away lanes are frequently violated by vehicles performing pickup and drop-off activities, requiring buses to slow down to change lanes. South of the project area, 30 Stockton and 45 Union- Stockton bus operators must merge across three lanes of traffic to turn left onto Sutter Street. At the northern end of the project area, 8X/BX bus operators must merge across two lanes of traffic to turn left onto Columbus Avenue. Muni riders waiting for the bus along Kearny Street Image Credit: CCDC Urban Insitute PAGE 32


37 FIGURE 19. TRANSIT ROUTES ON KEARNY AND SURROUNDING STREETS FIGURE 20. FALL X/8AX/8BX COMBINED AVERAGE WEEKDAY RIDERSHIP Kearney and Geary Kearney and Sutter Kearney and Bush Kearney and California Kearney and Clay Alightings Boardings Kearney and Jackson Columbus and Kearney BICYCLES Demand: As was shown in Figure 16, between northbound bicyclists pass each intersection on Kearny during the P.M. peak hour (5-6 p.m.). Bicycle volumes are higher on the southern part of the corridor near Bush St., and lower toward the north. Safety: The San Francisco Department of Public Health has identified Kearny St as a high injury corridor for bicyclists. 21 Approximately seven bicyclist collisions occurred on Kearny between (Figure 21), including one severe injury collision at Sacramento St. Facilities: Kearny St. does not currently have any bicycle facilities and is not indicated as a bicycle route on SFMTA s San Francisco Bikeway Network Map. However, SFMTA identified Kearny (from Market St. to Columbus) as a corridor to be analyzed for improvement as part of implementation of the SFMTA s 2013 Bicycle Strategy. 21 Source: San Francisco Department of Public Health, PAGE 33
38 FIGURE 21. PEDESTRIAN, BICYCLE, AND VEHICLE COLLISION LOCATIONS ALONG KEARNY ST. Pedestrian safety: Columbus Ave Clay St California St User Type and Crash Severity Pedestrian, Fatality or Severe Injury Pedestrian, Minor Injury Bicyclist, Fatality or Severe Injury Bicyclist, Minor Injury Vehicles, Fatality or Severe Injury Vehicles, Minor Injury Number of Collisions Mi Pedestrian safety is a major problem along Kearny St. The WalkFirst Investment Study identified Kearny as a high injury corridor, along with Broadway and Stockton in Chinatown. However, Kearny s safety record is worse than either Stockton or Broadway Streets. Figure 22 illustrates analysis performed by the Department of Public Health to identify pedestrian high injury corridors for San Francisco. It shows that Kearny (analyzed by DPH from Pacific to Market), has a higher number of severity-weighted pedestrian injuries per mile than either Stockton or Broadway (based on segments defined for the analysis), and a far higher number than all other high injury corridors on average. Source: SWITRS, Some overlapping collisions were moved slightly to improve legibility. PEDESTRIANS Bush St Demand: As was shown in Figure 16, Kearny currently experiences high pedestrian volumes, with between pedestrians crossing in the north/south direction at each intersection during the evening peak hour (5-6p.m.) The highest volumes are in the southern portion of the corridor at Bush, Pine, and California Streets. Between , 26 pedestrian minor injuries, two severe injuries and 2 fatalities (at Washington and Sacramento Streets) occurred on Kearny between Bush and Jackson. Figure 21 illustrates pedestrian collision locations along with bicycle and motor vehicle only collisions. The intersection of Kearny and Sacramento has seen the most severe injuries, with 1 severe injury and 1 fatality. The intersection of Kearny and Clay has seen the highest number of total injuries, including 7 pedestrians. Among all collisions on Kearny, 5 involved senior pedestrians. 22 The Walkfirst Investment Study ( was a multi-agency effort to prioritize corridors for safety improvement. PAGE 34
 2500 2000 Observations of vehicle yielding behavior compiled by the San Francisco")


39 FIGURE 22. HIGH-INJURY CORRIDOR ANNUAL INJURY STATISTICS WEIGHTED PEDESTRIAN INJURIES PER 100 MILES PER YEAR ( ) Observations of vehicle yielding behavior compiled by the San Francisco Department of Public Health while measuring vehicle yielding behavior on Kearny St as part of the San Francisco Safe Streets Campaign. Field review and data analysis compiled by the project team All San Francisco All high-injury corridors Broadway from Front to Powell Stockton from Greenwich to Market Kearny from Pacific to Market Source: San Francisco Department of Public Health, Identifying High Pedestrian Injury Corridors for Targeted Safety Improvements A Methodology for San Francisco, California 2013 Update. Top contributors to pedestrian injuries were identified using several sources including: The WalkFirst Investment Study 22, which classified all pedestrian corridors into a typology based on the types of pedestrian collisions occurring there. A 2014 summer research project undertaken by the Chinatown Urban Institute. Students at the Chinatown Urban Institute, a youth empowerment and professional development program offered by the Chinatown Community Development Center in San Francisco analyzed pedestrian safety conditions on Kearny as part of their summer 2014 class project. They presented results from their analysis at an August 6, 2014 community meeting. A research project completed by the U.C. Berkeley Institute for Transportation Studies. The City of San Francisco Pedestrian Safety Assessment (2013), prepared by the UC Berkeley Institute of Transportation Studies evaluated pedestrian safety and walkability at key locations in San Francisco (Appendix F). As part of this effort, walking audits were conducted at three focus areas, including one at Kearny Street between Columbus Avenue and Sutter Street. In a walking audit, a team carefully observes the pedestrian environment, identifying challenges to pedestrian safety and comfort as well as opportunities for improvement. The walking audit on Kearny Street was conducted on May 13, Turning vehicles conflicting with crossing pedestrians at Kearny and Jackson Street Image Credit: CCDC Urban Institute Elderly pedestrian waiting to cross at Kearny and Jackson Image Credit: CCDC Urban Insitute PAGE 35
, insufficient pedestrian crossing time/lack of understanding of crossing constraints, and unsafe pedestrian behavior.")


40 Pedestrians crossing during a don't walk phase at Kearny and Clay Image Credit: CCDC Urban Insitute Top pedestrian safety issues on Kearny are high vehicle speeds, unsafe turning movements (particularly right turns), insufficient pedestrian crossing time/lack of understanding of crossing constraints, and unsafe pedestrian behavior. High vehicle speeds: The WalkFirst Investment Study identified high-speed, high-volume collisions as a pedestrian collision profile represented on Kearny Street, and a speed survey confirmed that speeding is occurring on the street especially in the morning peak period. In addition, speeding was identified as a top concern during community outreach. Unsafe turning movements, particularly right turns: The WalkFirst Investment Study identified right turns at signalized intersections as a top pedestrian collision profile represented on Kearny. Researchers at the UC Berkeley Institute of Transportation study noted conflicts throughout the Kearny corridor between pedestrians and turning vehicles, particularly at locations with double-left and double-right turn lanes. The San Francisco Department of Public Health found that one in ten turning vehicles on Kearny St. do not yield to crossing pedestrians. Insufficient pedestrian crossing time / lack of understanding of crossing time constraints. Students at the Chinatown Urban Institute identified insufficient pedestrian crossing time as a top-cited concern at three intersections on Kearny Street. Students recorded between ten and twenty instances per hour of individuals running out of time to cross the street during three observation periods each at the intersections of Jackson, Washington, and Clay. The insufficient crossing time is likely related to the high concentrations of elderly individuals in the area, who require more time to cross the street. However, some community residents also pointed out that elderly individuals may not understand how to cross safely with a countdown signal, and may start crossing too late. Note that corridor signals are already timed for slow crossing speeds (See Appendix G). Unsafe pedestrian behavior (e.g. jaywalking). The Walk-First Investment Study identified pedestrians crossing outside the crosswalk and unpredictable pedestrian behavior as pedestrian collision profiles represented on Kearny. Students at the Urban Institute also recorded between instances per hour of individuals crossing outside the crosswalk at the intersection of Kearny and Washington, and instances per hour at Kearny and Clay. An elderly pedestrian violates the signal at Kearny at Clay PAGE 36
41 Other pedestrian safety challenges include spot issues at the Hilton Hotel and Portsmouth Square garage. Researchers at the UC Berkeley Institute of Transportation Studies observed taxis routinely blocking the sidewalk while trying to enter the hotel driveway on the east side of Kearny Street just south of Washington. They also noted some confusion between drivers and pedestrians at the entrance/exit of the parking garage on the west side of Kearny Street between Washington and Clay Streets. In order to walk past the parking garage, pedestrians must cross two entrance lanes and two exit lanes separated by a median. Existing Pedestrian Safety Infrastructure: Kearny currently features the following pedestrian infrastructure/ safety treatments: Sidewalks are approximately 12 feet in width, and sidewalk crowding does not appear to be an issue based on field review. Continental crosswalks are available on all crossings, although many are faded/less visible. No pedestrian curb extensions or refuge islands exist at any intersection along the corridor. The presence of sub-floor basements along the corridor (see Appendix F) may complicate the creation of curb extensions. Signals are currently timed to support slow pedestrian crossing speeds, and all are within SFMTA s guidelines 23 of 2.5 feet per second for the full pedestrian phase. Appendix G lists the crossing speeds at each intersection. The signal at Kearny and Clay currently is programmed with a leading pedestrian interval on the north and south legs of the intersection. None of the intersections have a complete set of directional, ADA-compliant curb ramps. Appendix H contains a conceptual depiction of existing conditions at each intersection, including the position and direction of curb ramps; pedestrian, vehicle, and bicycle volumes; collision history; frequency of violations; location of transit stops; loading/unloading zones; towaway zones; and presence of obstructions that could make curb adjustments difficult such as fire hydrants and drainage basins. Appendix F shows the locations of sub-floor basements. 3. COMMUNITY OUTREACH RESULTS On Kearny St., the approach to public outreach involved interviews with community stakeholders. This outreach was conducted in two stages. One stage involved interviews and on-street outreach conducted by the CCDC s Urban Institute. The other involved interviews with key community stakeholders. 3.1 URBAN INSTITUTE COFFEE HOUR INTERVIEWS Students at the Chinatown Urban Institute, a youth empowerment and professional development program offered by the Chinatown Community Development Center in San Francisco analyzed pedestrian safety conditions on Kearny as part of their summer 2014 class project. Their project included interviews with senior residents of the International Hotel and the Clayton Hotel, as well as interviews with pedestrians on the street. Issues that came up most frequently in their interviews included: Vehicle speeding. Many community members feel unsafe because of vehicles moving at high speeds along the corridor. Unsafe right turns. Several individuals mentioned feeling unsafe crossing against high volumes of rightturning vehicles. Insufficient pedestrian crossing time. Several elderly individuals expressed that pedestrian crossing times are insufficient. The cars go really fast. When the light changes, the cars have to brake really hard to stop. Andy, 20, CCSF student I would step down from the sidewalk before the light turns green because I m scared I can t make it across, especially when my leg isn t good. Mrs. Li When we walk with canes, we get stuck in the middle. Ms. Wong, 75 The cars are going too fast. Ms. Liang, Clayton Hotel resident 3.2 COMMUNITY STAKEHOLDER INTERVIEWS To more fully assess community perspectives on transportation needs and issues on Kearny Street, the study team conducted seven interviews with eleven key stakeholders in Chinatown. Interviews were held between May 6-11, 2015 unless otherwise noted. 23 Source: SFMTA Pedestrian Signal Guidelines Memorandum, PAGE 37


42 and November of 2014, and in April of During these meanings, concerns about pedestrian safety on Kearny Street routinely came up and key concerns/observations from these meetings are included in the summary below. Chinatown Urban Insitute students interview seniors about Kearny Street Image credit: CCDC Urban Insitute General interview questions used to prompt and guide each discussion included: What do you think is working well about transportation on Kearny St. today? What do you think is not working well? What would you most like to see change on this street? What would you like to remain same in the future? Interviewees were: Major Thomas Mui, Commanding Officer, The Salvation Army San Francisco Chinatown Corps Pius Lee, Chairman, Chinatown Neighborhood Association Richard Ow, Chinatown Resident & Chaplain, American Legion, Cathay Post 384 Rita G. Mah, Esq., Executive Director, Chinese Newcomers Service Center, plus four of her employees Peter H. Lee, Executive Corporate Manager, Portsmouth Plaza Parking Corporation Anni Chung, Executive Director, Self Help for the Elderly, and Winnie Yu, Assistant Director of Employment Training and Economic Development, Self Help for the Elderly. 24 Appendix I contains a full record of these interviews. Additionally, SFCTA staff presented project updates at meetings of the Chinatown Community Development Center s Chinatown Transportation Research and Improvement Project (TRIP) group throughout the course of the project, including in September 2013, April, June, August, 3.3 SUMMARY FINDINGS Most interviewees felt that pedestrian safety in Chinatown is a top concern in general. More than half the organizations expressed specific concern about pedestrian safety on Kearny Street. In particular, members of Self Help for the Elderly and Chinatown TRIP expressed strong concerns about the history of pedestrian injuries and fatalities on Kearny Street, citing speeding vehicles and high volumes of turning vehicles conflicting with crossing pedestrians as top contributing factors. One interviewee expressed frustration with the slow pace of the city s response to pedestrian safety problems on Kearny St. Three interviewees/organizations cited the intersection at Clay as among the worst along Kearny in terms of traffic safety issues particularly clashes between vehicles and pedestrians that sometimes result in altercations. Vehicles entering/exiting the Portsmouth Square garage were seen as contributing to the problem. Two interviewees/organizations did not immediately recognize a pedestrian safety problem on Kearny Street. Instead, they felt that sidewalk crowding and pedestrian safety on Stockton Street represented the more pressing transportation problems facing the community. A vehicle turning into the Portsmouth square garage not yielding to crossing pedestrians Image Credit: CCDC Urban Insitute 24 These were more informal conversations held earlier in the study process (in November 2013 and January 2014). PAGE 38
43 Most interviewees expressed that vehicular traffic flows smoothly on Kearny north of Sutter, and several seemed positive about the fact that traffic congestion is not an issue (although a few noted that, by contrast, traffic congestion is often a problem south of Sutter and onto Third St.). Several interviewees cited jaywalking as an issue throughout Chinatown and voiced support for more pedestrian education and enforcement efforts. At least two interviewees specifically acknowledged that cultural differences in traffic laws, customs and enforcement between San Francisco and China likely contribute to the problem for newer immigrants. Some expressed that they felt the only way to address the pedestrian safety problem in Chinatown was through education. When asked by the study team whether they would like to see any changes on Kearny St., several interviewees mentioned wanting pedestrian scrambles as a means to limit potential conflict between pedestrians and vehicles; traffic signal timing to slow speeds; and use of crossing guards to protect crossing pedestrians. Several interviewees indicated that pedestrian safety should be the top priority for improvement even at the expense of tradeoffs such as vehicle congestion. One interviewee mentioned that she wanted to see the street kept open for vehicle traffic and didn t want to see lanes dedicated to transit or bicycles. 4 RECOMMENDATIONS AND NEXT STEPS 4.1 SUMMARY OF ISSUES The Chinatown NTP identified several issues affecting Kearny St. Most significantly, the corridor has had a history of severe and fatal pedestrian collisions. As described above, these collisions have been primarily resulting from: Vehicles moving at high speeds through a street with large numbers of elderly and disabled pedestrians High volumes of right- and left- turning vehicles conflicting with crossing pedestrians High numbers of pedestrian violations Insufficient crossing time for elderly pedestrians, in spite of signals timed for slow crossing speeds; this may be also related to lack of understanding of countdown signals/crossing constraints. Issues affecting other modes include: Slow-moving transit vehicles Lack of bicycle facilities The next section presents short- and long-term recommendations for addressing these issues. 4.2 PRIORITY SHORT TERM SAFETY TREATMENTS The study team developed short-term recommendations for the Kearny Street corridor, focusing on treatments to improve pedestrian safety in support of the city s Vision Zero and WalkFirst initiatives. Safety countermeasures were drawn from the toolbox of short-term, high-impact pedestrian safety countermeasures identified during the city s WalkFirst Investment Study ( The toolbox was refined to address the pedestrian collision history and the conditions that may contribute to collisions in the future. The Sacramento Street and Clay Street intersections are recommended for top priority treatment because they have had the highest frequency of severe and total collisions, respectively, over the last five years, among intersections in the study corridor. As of the time of publication of this report, the SFMTA is moving forward with short-term treatments at the Sacramento Street intersection consisting of re-striped continental crosswalks and extended red no-parking zones around the intersection to improve the visibility of crossing pedestrians to turning vehicles. The following additional treatments are recommended for the Clay Street intersection: Leading pedestrian intervals (LPIs) on the east/west crossings (LPIs were already in place on the north and south crossings). Leading pedestrian intervals give crossing pedestrians a head start before vehicles begin to turn, and can reduce collisions involving pedestrians and turning vehicles. Advanced limit line at northbound Kearny Street. Advance limit lines encourage motorists to come to a full stop farther away from the marked crosswalk and can reduce the number of vehicles encroaching on the crosswalk. Extended red no-parking zones and a no left turn on red for eastbound Clay Street. Restricting left turns on red will reduce or eliminate conflicts between leftturning vehicles and crossing pedestrians. Improved pedestrian and vehicular circulation around the Portsmouth Square Garage in order to enhance pedestrian safety and reduce driver confusion regarding garage driveway operations. PAGE 39
44 4.3 CORRIDOR CONCEPTS FOR FURTHER STUDY Whereas the improvements described above could address some immediate concerns in the near-term, changing travel patterns and evolving priorities suggest that a larger-scale re-thinking of the entire corridor may be warranted. This should not delay implementation of the near-term recommendations described above; rather, this presents a unique opportunity to achieve multiple objectives, such as implementation of Muni Forward, Vision Zero, and the SFMTA s 2013 Bicycle Strategy, through a single coordinated effort. The following section proposes corridor concepts for further study that would address the top corridor issues but require more planning and analysis to fully define. The following three corridor concepts each have the potential to significantly improve pedestrian safety on the street and some could address other corridor issues as well: Implementing a series of pedestrian scrambles Removing vehicular traffic from one or more lanes (e.g. road diet), potentially to create space for a transit or bicycle lane Systematic implementation of signal striping and timing treatments Each of these concepts is discussed below including: Potential benefits/ corridor issues addressed Potential tradeoffs Key questions to be explored during further study PEDESTRIAN SCRAMBLES One corridor concept would be to implement a series of pedestrian scrambles at a series of intersections along the corridor, similar to how portions of Montgomery and Stockton Street are designed today. A pedestrian scramble involves holding vehicle traffic while pedestrians are allowed to cross in all directions, including diagonally across the street. Corridor issues addressed: Would likely decrease pedestrian conflicts with turning vehicles by creating separated signal phasing for pedestrians and vehicular green time. Vehicles would be prohibited from turning on red and pedestrians would be prohibited from crossing during vehicular green time. A University of California, Berkeley study from 2003 assessed pedestrian safety before and after the implementation of a pedestrian scramble in Chinatown, Oakland and concluded that the scramble reduced the number of pedestrian-vehicle conflicts at the intersection. Implementing a series of scrambles along the corridor could allow for better comprehension /understanding as opposed to a single scramble at one location. Could potentially slow traffic speeds as a result of vehicles having to wait longer to proceed through each intersection. Potential Tradeoffs Could increase delay/wait time for all road users (e.g. vehicles, pedestrians, transit, bicyclists), although at intersections with high volume of turning vehicles, the pedestrian scramble may reduce delay for turning vehicles that would otherwise have had to yield to crossing pedestrians. Increasing wait time for pedestrians could increase the number of pedestrian violations, potentially offsetting some of the safety benefits of scrambles. 25 Several intersections along Kearny are already experiencing a high number of pedestrian violations. A series of scrambles may be inconsistent with the desire for high performing transit on this Muni Forward corridor, both in terms of available transit green signal time and complicating the possibility of transit improvements such as transit signal priority. May be implemented in conjunction with pedestrian bulbouts, reducing crossing distances and in turn, the minimum length of the pedestrian phase. This would increase green time for vehicles, which may offset intersection delay caused by the scrambles. The feasibility of bulbouts would be determined by further study on street utility infrastructure and future lane configurations. Case Study Four pedestrian scrambles were implemented on Stockton Street in 2002 at the intersections of Stockton and Pacific, Jackson, Washington, and Clay. SFMTA staff have compared the number of pedestrian collisions at each intersection in the seven years prior to implementation of the scrambles and the seven years following, and found that the absolute number of collisions remained the same before and after. Further analysis would be needed to determine whether the scrambles have had a safety benefit, including analysis of background changes in vehicle and pedestrian volumes as well as any changes in the severity or type of pedestrian collisions before and after. PAGE 40


45 ROAD DIET Another corridor concept would be to remove a travel lane and repurpose the space for some other use, such as a protected bicycle lane, transit-only lane, or sidewalk. Corridor issues addressed Could improve pedestrian safety by reducing vehicle speeds due to lower vehicle throughput capacity. Depending on how the lane was repurposed, the road diet could provide a protected lane for bicyclists, improve transit performance, or enhance the pedestrian environment. If implemented in conjunction with pedestrian or transit bulbouts, could potentially reduce pedestrian crossing distances across Kearny Street, not only enhancing the pedestrian experience but also providing more green time to the vehicular phase along Kearny Street. crossings to discourage vehicles from violating pedestrian right of way. Continental crosswalks are currently available at all intersections but many have faded over time or are in less visible colors. Convert dual turn lanes to single left turn lanes to eliminate multiple threat conflicts between pedestrians and turning vehicles. Dual turn lanes currently exist at the intersections of Kearny with Pine and Bush Streets as well as at the entry and exit of the Portsmouth Square garage. The dual left turn lane at Pine St., for example, appears appropriate for removal and could potentially be removed without increasing delay for vehicles or transit (Appendix B). One of the two left turn lanes could be removed at this location without substantial adverse impacts on automobile level of service (Appendix B). Implement leading pedestrian intervals where appropriate to reduce conflicts between pedestrians and turning vehicles. Appendix B suggests where LPIs would be most appropriate. Potential Tradeoffs Reduced capacity would likely increase delay to vehicles and transit, unless transit were provided with a protected lane. Case study Valencia Street in San Francisco has become a national model for road diets. In 1999, the road was converted from two-lanes in each direction to one-lane with bicycle lanes in each direction. Since the conversion, total bicycle and pedestrian collisions have declined, along with triple-digit percentage increase in bicycle use. Furthermore, vehicular volumes dipped only slightly and diversion was not concentrated on any single parallel route. This is the configuration of Valencia Street prior to and after the road diet. SYSTEMATIC SIGNAL TIMING AND STRIPING TREATMENTS A final corridor concept would be to systematically implement signal timing and striping treatments along the Kearny corridor. These could include: Re-time signals along the corridor to reduce vehicle speeds. Current signal timing progression is set to promote vehicle speeds of 30 miles per hour. Reducing vehicle speeds could significantly reduce the share of pedestrian collisions that end in serious injury or fatality in the short term. Provide high-visibility continental crosswalks at all 25 The Berkeley study cited above also concluded that there were more pedestrian violations after the scramble was implemented. Images courtesy of February-2015/Road-Diets-Make-Streets-Leaner-Safer-and-More- Efficient PAGE 41
SAN FRANCISCO MUNICIPAL TRANSPORTATION AGENCY
 THIS PRINT COVERS CALENDAR ITEM NO. : 10.2 DIVISION: Sustainable Streets BRIEF DESCRIPTION: SAN FRANCISCO MUNICIPAL TRANSPORTATION AGENCY Adopting Conceptual Proposal for Streetscape Improvements to Broadway,
Polk Streetscape Project
 What is this project? The Polk Streetscape Project is an effort to improve safety for everyone traveling on Polk Street between Union and McAllister streets. Also included in this project are paving, sewer
Outreach Approach RENEW SF served as the primary liaison with the North Beach community; the Chinatown. Executive Summary
 Executive Summary Executive Summary The Columbus Avenue Neighborhood Transportation Study s objective is to identify changes to transportation infrastructure and policies that could enhance the livability
Project Goal and Description. Why Broadway? Broadway SFMTA.COM/BROADWAY. The goal of the Broadway Safety Improvement
 PROJECT OVERVIEW Project Goal and Description The goal of the Broadway Safety Improvement d St Van Ness Ave Project is to improve safety and comfort for all who Franklin St Hyde St Octavia St Gough St
San Francisco Pedestrian Safety Capital Improvement Program: A Step Towards Vision Zero
 San Francisco Safety Capital Improvement Program: A Step Towards Vision Zero March 5, 2014 The First Steps In April 2013, Mayor Lee issued the Strategy which directed City departments to implement solutions
Data Analysis February to March Identified safety needs from reported collisions and existing travel patterns.
 Welcome! Thank you for participating in today s Valencia Bikeway Improvements workshop. Data Analysis February to March Identified safety needs from reported collisions and existing travel patterns. Initial
BD RESOLUTION NO RESOLUTION ADOPTING THE VISION ZERO RAMP INTERSECTION STUDY PHASE 1
 BD00 RESOLUTION NO. - RESOLUTION ADOPTING THE VISION ZERO RAMP INTERSECTION STUDY PHASE [NTIP PLANNING] FINAL REPORT WHEREAS, The Vision Zero Ramp Intersection Study Phase was recommended by Commissioner
Data Analysis February to March Identified safety needs from reported collisions and existing travel patterns.
 Welcome! Thank you for participating in today s Valencia Bikeway Improvements workshop. Data Analysis February to March Identified safety needs from reported collisions and existing travel patterns. Initial
Welcome! San Jose Avenue Open House August 25, 2015
 Welcome! San Jose Avenue Open House August 25, 2015 Vision Zero The City and County of San Francisco adopted Vision Zero San Francisco Vision Zero High Injury Network as a policy in 2014, committing an
Agenda. Overview PRINCE GEORGE S PLAZA METRO AREA PEDESTRIAN PLAN
 PRINCE GEORGE S PLAZA METRO AREA PEDESTRIAN PLAN May 28, 2008 Agenda Welcome and introductions Project overview and issue identification Planning context and strengths Design challenges and initial recommendations
Welcome! Thank you for joining us today for a Geary Rapid project open house. Geary Rapid Project. SFMTA.com/GearyRapid
 Welcome! Thank you for joining us today for a Geary Rapid project open house. Get the most out of this event: 1. Sign in and get your feedback sheet 2. Visit project information stations hosted by project
PEDESTRIAN ACTION PLAN
 ATTACHMENT 2 CITY OF SANTA MONICA PEDESTRIAN ACTION PLAN CITY OF SANTA MONICA PEDESTRIAN ACTION PLAN This page intentionally left blank EXECUTIVE SUMMARY CHAPTER 1 EXECUTIVE SUMMARY Setting the Stage
Purpose and Need. Chapter Introduction. 2.2 Project Purpose and Need Project Purpose Project Need
 Chapter 2 Purpose and Need 2.1 Introduction The El Camino Real Bus Rapid Transit (BRT) Project (Project) would make transit and other transportation improvements along a 17.6-mile segment of the El Camino
Caltrans Sloat Boulevard Pedestrian Safety Project Response to Community Questions, Comments & Concerns
 Caltrans Sloat Boulevard Pedestrian Safety Project Response to Community Questions, Comments & Concerns Revised: May 10, 2016 The California Department of Transportation (Caltrans) is planning various
Better Market Street. Engineering, Maintenance & Safety Committee (EMSC) February 28, 2018
 February 28, 2018") Better Market Street Engineering, Maintenance & Safety Committee (EMSC) February 28, 2018 1 Market Street Market Street - San Francisco by rulenumberone2 2 Market Street is the... City s busiest pedestrian
Better Market Street Engineering, Maintenance & Safety Committee (EMSC) February 28, 2018 1 Market Street Market Street - San Francisco by rulenumberone2 2 Market Street is the... City s busiest pedestrian
Northbound San Jose Avenue & I-280 Off-Ramp Road Diet Pilot Project
 Project Overview Fed by a two-lane Interstate-280 (I-280) off-ramp, high vehicular volumes and speeds are longstanding issues along San Jose Avenue. Residents in the surrounding neighborhoods have expressed
Oakland Pedestrian Master Plan Oakland Pedestrian Plan Draft Recommendations Chapter Outline
 EISEN LETUNIC T R A N S P O R T A T I O N, ENVIRO N M E N TA L A N D URBAN PLANNIN G MEMORANDUM To Oakland Pedestrian Plan Technical Advisory Committee & Pedestrian Advisory Group From Victoria Eisen Date
PRINCE GEORGE S PLAZA METRO AREA PEDESTRIAN PLAN
 PRINCE GEORGE S PLAZA METRO AREA PEDESTRIAN PLAN May 28, 2008 Agenda Welcome and introductions Project overview and issue identification Planning context and strengths Design challenges and initial recommendations
PEDALING FORWARD. A Glance at the SFMTA s Bike Program for SFMTA.COM
 PEDALING FORWARD A Glance at the SFMTA s Bike Program for 2017-2021 SFMTA.COM INTRODUCTION About This Booklet More people from all walks of life see their bicycle as a more convenient way to get where
Living Streets Policy
 Living Streets Policy Introduction Living streets balance the needs of motorists, bicyclists, pedestrians and transit riders in ways that promote safety and convenience, enhance community identity, create
Central Freeway and Octavia Circulation Study
 Central Freeway and Octavia Circulation Study Final Report Plans and Programs Committee San Francisco County Transportation Authority September 18, 2012 Presentation Outline Background and Study Purpose
Bicycle Master Plan Goals, Strategies, and Policies
 Bicycle Master Plan Goals, Strategies, and Policies Mobilizing 5 This chapter outlines the overarching goals, action statements, and action items Long Beach will take in order to achieve its vision of
SAN FRANCISCO MUNICIPAL TRANSPORTATION AGENCY
 THIS PRINT COVERS CALENDAR ITEM NO. : 12 DIVISION: Sustainable Streets BRIEF DESCRIPTION: SAN FRANCISCO MUNICIPAL TRANSPORTATION AGENCY Approving various bicycle improvements and traffic modifications
2/25/2015. The Best of Pro Walk Pro Bike Pro Place Continuing Education. Today s presenters
 The Best of Pro Walk Pro Bike Pro Place 2014 For technical assistance during the webinar, call 1 800 263 6317 Choose these audio prompts: 2, 1 February 25, 2015 Continuing Education To document Professional
Pedestrian Safety Workshop SAN FRANCISCO, CALIFORNIA
 Pedestrian Safety Workshop 02 15 2011 SAN FRANCISCO, CALIFORNIA 1 Agenda Walking in San Francisco Accomplishments and Current Pedestrian Activities Mayor s Pedestrian Safety Executive Directive Next Steps
SAN FRANCISCO MUNICIPAL TRANSPORTATION AGENCY
 THIS PRINT COVERS CALENDAR ITEM NO.: 10.3 DIVISION: Sustainable Streets BRIEF DESCRIPTION: SAN FRANCISCO MUNICIPAL TRANSPORTATION AGENCY Approving various traffic and parking modifications on Bay Street
CITY OF LOS ANGELES INTER-DEPARTMENTAL MEMORANDUM
 CITY OF LOS ANGELES INTER-DEPARTMENTAL MEMORANDUM Date: April 1, 219 To: Honorable City Council c/o City Clerk, Room 395, City Hall Attention: Honorable Mike Bonin, Chair, Transportation Committee From:
Appendix A: Crosswalk Policy
 Appendix A: Crosswalk Policy Appendix A: Crosswalk Policy Introduction This citywide Crosswalk Policy is aimed at improving pedestrian safety and enhancing pedestrian mobility by providing a framework
EXECUTIVE SUMMARY. Vision
 Vision Walking and bicycling in Salt Lake City will be safe, convenient, comfortable, and viable transportation options that connect people to places, foster recreational and economic development opportunities,
ABOUT THIS STUDY The Tenderloin-Little Saigon Community-Based Transportation Plan
 ABOUT THIS STUDY The Tenderloin-Little Saigon Community-Based Transportation Plan The Greater Tenderloin Community Study Milestones October Community based organizations (Tenderloin Housing Clinic and
Chapter 14 PARLIER RELATIONSHIP TO CITY PLANS AND POLICIES. Recommendations to Improve Pedestrian Safety in the City of Parlier (2014)
") Chapter 14 PARLIER This chapter describes the current status and future plans for biking and walking in the City of Parlier. RELATIONSHIP TO CITY PLANS AND POLICIES The Parlier General Plan is the primary
Chapter 14 PARLIER This chapter describes the current status and future plans for biking and walking in the City of Parlier. RELATIONSHIP TO CITY PLANS AND POLICIES The Parlier General Plan is the primary
Vision Zero Priority Projects (March 2017)
") Key in 201 or of Key Potrero Ave., from Division to Cesar Chavez Begin Construction Spring 201 Winter 201 Achieved Safety measures include dedicated transit lane, sidewalk widening, buffers for existing
Key in 201 or of Key Potrero Ave., from Division to Cesar Chavez Begin Construction Spring 201 Winter 201 Achieved Safety measures include dedicated transit lane, sidewalk widening, buffers for existing
SAN FRANCISCO MUNICIPAL TRANSPORTATION AGENCY
 THIS PRINT COVERS CALENDAR ITEM NO. : 11 DIVISION: Sustainable Streets BRIEF DESCRIPTION: SAN FRANCISCO MUNICIPAL TRANSPORTATION AGENCY Approving traffic modifications on Twin Peaks Boulevard between Christmas
The Wiggle Route in Context
 The Wiggle Route in Context In a city of hills, the Wiggle is an important route because it winds its way along the flattest streets from Market to the Panhandle, bringing residents to local parks and
CITY OF COCOA BEACH 2025 COMPREHENSIVE PLAN. Section VIII Mobility Element Goals, Objectives, and Policies
 CITY OF COCOA BEACH 2025 COMPREHENSIVE PLAN Section VIII Mobility Element Goals, Objectives, and Policies Adopted August 6, 2015 by Ordinance No. 1591 VIII MOBILITY ELEMENT Table of Contents Page Number
Proposed. City of Grand Junction Complete Streets Policy. Exhibit 10
 Proposed City of Grand Junction Complete Streets Policy Exhibit 10 1 City of Grand Junction Complete Streets Policy Vision: The Complete Streets Vision is to develop a safe, efficient, and reliable travel
Mission Bay Loop (MBL) Public Meeting
 Public Meeting") Mission Bay Loop (MBL) Public Meeting La Scuola Internazionale di San Francisco, November 18, 2014 Frequently Asked Questions 1. When would construction have to start before the SFMTA loses TIGER funds?
Mission Bay Loop (MBL) Public Meeting La Scuola Internazionale di San Francisco, November 18, 2014 Frequently Asked Questions 1. When would construction have to start before the SFMTA loses TIGER funds?
25th Avenue Road Diet Project A One Year Evaluation. Transportation Fund for Clean Air Project #05R07
 25th Avenue Road Diet Project A One Year Evaluation Transportation Fund for Clean Air Project #05R07 Submitted by: The San Francisco Municipal Transportation Agency Dan Provence May 22, 2009 EXECUTIVE
CHAPTER 7.0 IMPLEMENTATION
 CHAPTER 7.0 IMPLEMENTATION Achieving the vision of the Better Streets Plan will rely on the ability to effectively fund, build and maintain improvements, and to sustain improvements over time. CHAPTER
Telegraph Avenue Complete Streets DRAFT Recommendations. Oakland Public Works Department September 11 and 13, 2014 Open Houses
 Telegraph Avenue Complete Streets DRAFT Recommendations Oakland Public Works Department September 11 and 13, 2014 Open Houses Presentation Overview What are complete streets? What problem are we trying
Simulation Analysis of Intersection Treatments for Cycle Tracks
 Abstract Simulation Analysis of Intersection Treatments for Cycle Tracks The increased use of cycle tracks also known as protected bike lanes has led to investigations of how to accommodate them at intersections.
SAN FRANCISCO MUNICIPAL TRANSPORTATION AGENCY
 THIS PRINT COVERS CALENDAR ITEM NO.: 11 DIVISION: Transit Services BRIEF DESCRIPTION: SAN FRANCISCO MUNICIPAL TRANSPORTATION AGENCY Approving the installation of traffic and parking modifications along
Memorandum. Fund Allocation Fund Programming Policy/Legislation Plan/Study Capital Project Oversight/Delivery Budget/Finance Contract/Agreement Other:
 Memorandum Date: November 20, 2017 To: Transportation Authority Board From: Eric Cordoba Deputy Director Capital Projects Subject: 12/5/17 Board Meeting: San Francisco Freeway Corridor Management Study
Van Ness Avenue Bus Rapid Transit (BRT) San Francisco Environment Commission Policy Committee
 San Francisco Environment Commission Policy Committee") Van Ness Avenue Bus Rapid Transit (BRT) San Francisco Environment Commission Policy Committee 04.30.12 Van Ness Avenue BRT Project Background Key north-south link in San Francisco s Rapid Transit network
Van Ness Avenue Bus Rapid Transit (BRT) San Francisco Environment Commission Policy Committee 04.30.12 Van Ness Avenue BRT Project Background Key north-south link in San Francisco s Rapid Transit network
TRAFFIC ACTION PLAN. Laurie Meadows Neighborhood CITY OF SAN MATEO
 TRAFFIC ACTION PLAN Laurie Meadows Neighborhood CITY OF SAN MATEO Draft January 2017 Table of Contents Introduction... 2 The Traffic Forum Process... 5 Neighborhood Traffic Issues... 7 Neighborhood Recommendations
REGIONAL BICYCLE AND PEDESTRIAN DESIGN GUIDELINES
 REGIONAL BICYCLE AND PEDESTRIAN DESIGN GUIDELINES November 16, 2011 Deb Humphreys North Central Texas Council of Governments Bicycle and Pedestrian Advisory Committee Snapshot of the Guide 1. Introduction
WELCOME Mission-Geneva Transportation Study
 WELCOME Mission-Geneva Transportation Study Study Process and Schedule 2005 2006 Oct Nov Dec Jan Feb Mar Apr May Jun Jul Aug Sept Oct Task 2 Develop Outreach Plan Task 3 Document Existing Conditions/ Prioritize
ALTERNATIVES SCREENING REPORT
 VAN NESS AVENUE BUS RAPID TRANSIT (BRT) ALTERNATIVES SCREENING REPORT Revised Draft, 3/28/08 San Francisco County Transportation Authority 1 Introduction The San Francisco County Transportation Authority
Memorandum. Sunday, July 13, Saturday, July 19, 2014
 Memorandum To: David Lowin, Brooklyn Bridge Park Corporation From: Daniel Schack, AICP, PTP Date: Re: Brooklyn Bridge Park Pier 5/6 Loop Road Traffic Study Project No: 14-01-2407 At the request of Brooklyn
City of Novi Non-Motorized Master Plan 2011 Executive Summary
 City of Novi Non-Motorized Master Plan 2011 Executive Summary Prepared by: February 28, 2011 Why Plan? Encouraging healthy, active lifestyles through pathway and sidewalk connectivity has been a focus
FOLSOM-HOWARD STREETSCAPE OVERVIEW
 FOLSOM-HOWARD STREETSCAPE OVERVIEW SoMa residents should have the same kinds of amenities that other neighborhoods have. The Folsom- Howard Streetscape Project will make SoMa more livable by making it
Bellevue Downtown Association Downtown Bike Series
 Bellevue Downtown Association Downtown Bike Series Meeting 2 Franz Loewenherz Andreas Piller Kyle Potuzak Chris Long October 26, 2017 Today s Agenda: 1) Meeting Purpose 2) 9/28 Meeting Recap 3) Candidate
FEDERAL HIGHWAY ADMINISTRATION APPLICATION
 FEDERAL HIGHWAY ADMINISTRATION APPLICATION REQUEST FOR PERMISSION TO EXPERIMENT WITH A BICYCLE BOX INTERSECTION TREATMENT Submitted by: City of Columbus Department of Public Service Date: June 26, 2009
MASONIC AVENUE STREET DESIGN STUDY Community Workshop 2. Masonic Ave Street Design Study Community Workshop 2 August 10, 2010
 Masonic Ave Street Design Study Community Workshop 2 August 10, 2010 Introduction MASONIC AVENUE STREET DESIGN STUDY Community Workshop 2 SF Municipal Transportation Agency Javad Mirabdal, Project Manager
Van Ness Avenue BRT Overview and Scoping Process. Geary BRT CAC January 8, 2009
 Van Ness Avenue BRT Overview and Scoping Process Geary BRT CAC January 8, 2009 VAN NESS AVENUE S ROLE Identified in Prop K for BRT treatment Muni 47 and 49; 19 operates on Polk 20,000 daily riders on Van
C/CAG. Sunnybrae Elementary School Walking and Bicycling Audit. San Mateo-Foster City School District JUNE 2013
 Sunnybrae Elementary School Walking and Bicycling Audit JUNE 2013 San Mateo-Foster City School District C/CAG City/County Association of Governments of San Mateo County SUNNYBRAE ELEMENTARY SCHOOL WALKING
Winnipeg Walk Bike Projects Downtown Tire Talk - Summary
 Winnipeg Walk Bike Projects Downtown Tire Talk - Summary Downtown Projected Bike Lane System Connecting The Forks to the Exchange District (Fort Street, Garry Street & The Forks to Assiniboine Connection)
Moving Ahead. (Community Engagement) Chapter Three
 Chapter Three") 3 Community Chapter Three Moving Ahead (Community Engagement) engagement provided an exciting opportunity to engage Redwood City residents, workers, and business owners people who walk, bike, take transit,
3 Community Chapter Three Moving Ahead (Community Engagement) engagement provided an exciting opportunity to engage Redwood City residents, workers, and business owners people who walk, bike, take transit,
Bikeway action plan. Bicycle Friendly Community Workshop March 5, 2007 Rochester, MN
 Bikeway action plan Summary The was held on March 5, 2007 at the Rochester Mayo Civic Center. The workshop was hosted by Rochester-Olmsted County Planning Department in collaboration with the League of
Berkeley Strategic Transportation Plan A-76
 Berkeley Strategic Transportation Plan A-76 Appendices 1. A Team Effort 2. Where We ve Been A-11 Berkeley Strategic Transportation Plan Alameda County Transportation Plan Alameda County will be served
FINAL REPORT DECEMBER 2011
 FINAL REPORT DECEMBER 2011 AKNOWLEDGEMENTS SFMTA Staff Erin Miller, Project Manager Timothy Papandreou Jerry Robbins Pamela Stone Mike Sallaberry Chris Dimeling Emily Drennen Suzanne Chen-Harding San
CONNECTING PEOPLE TO PLACES
 CONNECTING PEOPLE TO PLACES 82 EAST BENCH MASTER PLAN 07 Introduction The East Bench transportation system is a collection of slow moving, treelined residential streets and major arteries that are the
Environment and Public Works Committee Presentation
 Mixed Use Centers Complete Streets Guidelines Project Environment and Public Works Committee Presentation December 10, 2008 Project Objectives: Conduct an inter-departmental and agency process to study
2014/2015 BIKE ROUTE PLAN 83 AVENUE PROTECTED BIKE LANE
 About the Project 2014/2015 BIKE ROUTE PLAN The City of Edmonton is planning a major bike route on the south side of Edmonton. This bike route is one part of a plan to provide citizens with transportation
FINAL PLAN APPENDIX D CITY OF BERKELEY BIKE PLAN D-1
 CITY OF BERKELEY BIKE PLAN D-1 . Proposed Programs D.1. EDUCATION This appendix presents the recommended bicycle-related programs for the City of Berkeley. The recommendations are organized in four E s:
MEMORANDUM. Charlotte Fleetwood, Transportation Planner
 MEMORANDUM Date: Updated August 22, 2017 To: Organization: Charlotte Fleetwood, Transportation Planner Boston Transportation Department From: Jason DeGray, P.E., PTOE, Regional Director of Engineering
modes, the increased roadway capacity is the implied solution, which, in turn, has been shown to lead to more driving (induced demand).
.") CONGESTION MANAGEMEN T PROGRAM DECEMBER, 201 7 EXECUTIVE SUMMARY A. Introduction Every two years, the San Francisco County Transportation Authority (SFCTA) prepares the San Francisco Congestion Management
CONGESTION MANAGEMEN T PROGRAM DECEMBER, 201 7 EXECUTIVE SUMMARY A. Introduction Every two years, the San Francisco County Transportation Authority (SFCTA) prepares the San Francisco Congestion Management
SFMTA SAN FRANCISCO MUNICIPAL TRANSPORTATION AGENCY
 SFMTA SAN FRANCISCO MUNICIPAL TRANSPORTATION AGENCY VAN NESS BUS RAPID TRANSIT PROJECT UPDATE PRESENTATION TO SFMTA BOARD OF DIRECTORS RELEASE OF DRAFT ENVIRONMENTAL IMPACT STATEMENT / REPORT 10 18 2011
HARRISON STREET/OAKLAND AVENUE COMMUNITY TRANSPORTATION PLAN
 HARRISON STREET/OAKLAND AVENUE Community Workshop #4: Draft Plan Review December 3, 2009 D E S I G N, C O M M U N I T Y & E N V I R O N M E N T INTRODUCTIONS Key Project Staff: Alisa Shen, Project Manager,
Data Analysis February to March 2018 Identified safety needs from reported collisions and existing travel patterns. SFMTA Board of
 Welcome! Thank you for participating in today s Valencia Data Analysis February to March 2018 Identified safety needs from reported collisions and existing travel patterns. First Community Event(s) July
CITY OF LOMITA CITY COUNCIL REPORT
 CITY OF LOMITA CITY COUNCIL REPORT TO: FROM: City Council Ryan Smoot, City Manager Item No. SCH 12 PREPARED BY: Mark A. McAvoy, P.E., Public Works Director/City Engineer MEETING DATE: August 1, 2017 SUBJECT:
Chapter 2. Bellingham Bicycle Master Plan Chapter 2: Policies and Actions
 Chapter 2 Bellingham Bicycle Master Plan Chapter 2: Policies and Actions Chapter 2: Policies and Actions The Bicycle Master Plan provides a road map for making bicycling in Bellingham a viable transportation
Existing Pedestrian Conditions. PSAC February 8, 2011
 Existing Pedestrian Conditions PSAC February 8, 2011 Contents 1. Project Background & Goals 2. Pedestrian Activity: Where people walk 3. Pedestrian Safety: The conditions people face Project Background
Project Kickoff Meeting February 15, 2018
 Project Kickoff Meeting February 15, 2018 Scope of Work: Study Area Project Goals Develop traffic calming alternatives to the Vine Street local right of way, to mitigate speeding. Develop concept plans
Geary Bus Rapid Transit Project
 Geary Bus Rapid Transit Project Outreach Update SAN FRANCISCO COUNTY TRANSPORTATION AUTHORITY SAN FRANCISCO MUNICIPAL TRANSPORTATION AGENCY April 28, 2016 Project Activities Since January Meeting Continued
SAFE ROUTES TO SCHOOL (SR2S)
") SAFE ROUTES TO SCHOOL (SR2S) In partnership with Burbank Unified School District (BUSD) & City of Burbank George Washington Elementary School Thomas Jefferson Elementary School John Muir Middle School
SAFE ROUTES TO SCHOOL (SR2S) In partnership with Burbank Unified School District (BUSD) & City of Burbank George Washington Elementary School Thomas Jefferson Elementary School John Muir Middle School
Item No. 14 Town of Atherton
 Item No. 14 Town of Atherton CITY COUNCIL STAFF REPORT CONSENT AGENDA TO: THROUGH: FROM: HONORABLE MAYOR AND CITY COUNCIL GEORGE RODERICKS, CITY MANAGER MICHAEL KASHIWAGI, COMMUNITY SERVICES DIRECTOR MARTY
Pedestrian injuries in San Francisco: distribution, causes, and solutions
 Pedestrian injuries in San Francisco: distribution, causes, and solutions Presentation to the San Francisco Health Commission RAJIV BHATIA, MD, MPH DIRECTOR OF OCCUPATIONAL AND ENVIRONMENTAL HEALTH, SAN
ABOUT THIS OPEN HOUSE
 ABOUT THIS OPEN HOUSE Welcome, and thanks for joining us today for the Folsom-Howard Near-Term Project! The purpose of today s open house is to: Understand how the near-term project ties into the larger
MAG Town of Cave Creek Bike Study Task 6 Executive Summary and Regional Significance Report
 Page 1 MAG Town of Cave Creek Bike Study Task 6 Executive Summary and Regional Significance Report August 1, 2012 MAG Project #481 Page 2 Task 6 Executive Summary and Regional Significance Report Introduction
APPENDIX A: Complete Streets Checklist DRAFT NOVEMBER 2016
 APPENDIX A: Complete Streets Checklist DRAFT NOVEMBER 2016 Complete Streets Checklist MetroPlan Orlando s Complete Streets Checklist is an internal planning tool for staff to further implementation of
Better Market Street Project Update. Urban Forestry Council September 17, 2014
 Better Market Street Project Update Urban Forestry Council September 17, 2014 Project Area Limits Better Market Street Schedule Market Street City s busiest transit corridor Over 85 buses per hour 14 surface
Moving Cambridge. City of Cambridge Transportation Master Plan Public Consultation Centre. March 7, :00 8:00 PM.
 City of Cambridge Transportation Master Plan Public Consultation Centre March 7, 2018 5:00 8:00 PM Region of Waterloo City of Cambridge Transportation Master Plan Public Consultation Centre March 7, 2018
Broad Street Bicycle Boulevard City Council Study Session Summary
 Broad Street Bicycle Boulevard City Council Study Session Summary Overview: On August 15 th, 2017, a City Council Study Session was held to invite community input and request City Council guidance on a
TRAFFIC CALMING PLANNER S PORTFOLIO
 TRAFFIC CALMING PLANNER S PORTFOLIO ISSUE 8 January 2017 PLANNER S PORTFOLIO TRAFFIC CALMING 1 OVERVIEW 2 3 4 ENGINEERED TRAFFIC CALMING MEASURES SIGNS AND PAVEMENT MARKINGS EMERGENCY RESPONSE DELAYS 5
RED COLORED TRANSIT-ONLY LANES REQUEST TO EXPERIMENT
 RED COLORED TRANSIT-ONLY LANES REQUEST TO EXPERIMENT Submitted to: California Traffic Control Devices Committee Federal Highway Administration, Office of Traffic Operations Submitted by: San Francisco
Paoli Road Improvement Feasibility Study
 Paoli Road Improvement Feasibility Study & Public Participation Project March 24, 2015 Prepared for: Tredyffrin Township Prepared by: McMahon Associates, Inc. with Town Planning Partnership, LLC Glackin
Active Transportation Facility Glossary
 Active Transportation Facility Glossary This document defines different active transportation facilities and suggests appropriate corridor types. Click on a facility type to jump to its definition. Bike
San Francisco 2009 Collisions Report April 21, 2011
 San Francisco 29 Collisions Report April 21, 211 City and County of San Francisco San Francisco Municipal Transportation Agency 1 South Van Ness Avenue, 7 th Floor San Francisco CA 9413 CONTENTS About
Protected Bike Lanes in San Francisco Mike Sallaberry SFMTA NACTO Workshop - Chicago IL
 Protected Bike Lanes in San Francisco Mike Sallaberry SFMTA 10 14 2011 NACTO Workshop - Chicago IL San Francisco 2 nd Highest Density in the U.S. 47 square miles Mild Climate Market Population ~810,000
Tonight is for you. Learn everything you can. Share all your ideas.
 Strathcona Neighbourhood Renewal Draft Concept Design Tonight is for you. Learn everything you can. Share all your ideas. What is Neighbourhood Renewal? Creating a design with you for your neighbourhood.
Public Information Centre
 WELCOME Public Information Centre Father Tobin Road Lougheed Middle School - Library Wednesday November 7, 2012 7:00 p.m.to 9:00 p.m. Please sign in Neighbourhood Traffic Calming Guide Background The City
Lee s Summit Road Improvement Study Public Open House June 7, 2007 Summary of Comment Card Responses
 Lee s Summit Road Improvement Study Public Open House June 7, 2007 Summary of Comment Card Responses Introduction At the Lee s Summit Road Improvement Study Public Open House held Thursday, June 7, 2007
Arterial Transitway Corridors Study. Ave
 Arterial Transitway Corridors Study Ave January 2012 Arterial Transitway Corridors Study Overview Corridor Features and Demographics 11 study corridors, 95 route miles 86,000 daily rides and half of existing
Geary Corridor Bus Rapid Transit SFMTA Citizens Advisory Committee
 Geary Corridor Bus Rapid Transit SFMTA Citizens Advisory Committee Project Update SAN FRANCISCO COUNTY TRANSPORTATION AUTHORITY SAN FRANCISCO MUNICIPAL TRANSPORTATION AGENCY August 6, 2015 Project Overview
TABLE OF CONTENTS. Executive Summary
 Executive Summary Background... ES-1 Pedestrian Network... ES-2 Bikeway Network... ES-2 Collision History... ES-2 Public Input... ES-4 Conclusions and Recommendations... ES-4 1. Introduction and Setting
San Francisco s Capital Plan & the Mayor s Transportation Task Force 2030: Funding the next steps for transportation
 San Francisco s Capital Plan & the Mayor s Transportation Task Force 2030: Funding the next steps for transportation San Francisco Capital Needs In 2006, the Mayor and Board of Supervisors approved San
North Shore Transportation Improvement Strategy
 North Shore Transportation Improvement Strategy Preliminary, Near-term Recommendation 2016 April Transportation Improvement Strategy (TIS) Comprehensive and Analytical A multi-modal transportation strategy
Complete Street Analysis of a Road Diet: Orange Grove Boulevard, Pasadena, CA
 Complete Street Analysis of a Road Diet: Orange Grove Boulevard, Pasadena, CA Aaron Elias, Bill Cisco Abstract As part of evaluating the feasibility of a road diet on Orange Grove Boulevard in Pasadena,
Dr. M.L. King, Jr. Street North Complete Streets Resurfacing Opportunities HOUSING, LAND USE, AND TRANSPORTATION COMMITTEE MARCH 22, 2018
 Dr. M.L. King, Jr. Street North Complete Streets Resurfacing Opportunities HOUSING, LAND USE, AND TRANSPORTATION COMMITTEE MARCH 22, 2018 What s Happening The City plans to mill and resurface Dr. M.L.