Plantar Fasciitis: Biomechanics, Atrophy and Muscle Energetics
|
|
|
- Russell Wheeler
- 6 years ago
- Views:
Transcription

1 University of Massachusetts - Amherst ScholarWorks@UMass Amherst Dissertations Plantar Fasciitis: Biomechanics, Atrophy and Muscle Energetics Ryan Chang University of Massachusetts - Amherst Follow this and additional works at: Part of the Kinesiology Commons Recommended Citation Chang, Ryan, "Plantar Fasciitis: Biomechanics, Atrophy and Muscle Energetics" (2010). Dissertations This Open Access Dissertation is brought to you for free and open access by ScholarWorks@UMass Amherst. It has been accepted for inclusion in Dissertations by an authorized administrator of ScholarWorks@UMass Amherst. For more information, please contact scholarworks@library.umass.edu.
2 PLANTAR FASCIITIS: BIOMECHANICS, ATROPHY AND MUSCLE ENERGETICS A Dissertation Presented by RYAN CHANG Submitted to the Graduate School of the University of Massachusetts Amherst in partial fulfillment of the requirements for the degree of DOCTOR OF PHILOSOPHY May 2010 Department of Kinesiology
3 Copyright by Ryan Chang 2010 All Rights Reserved
4 PLANTAR FASCIITIS: BIOMECHANICS, ATROPHY AND MUSCLE ENERGETICS A Dissertation Presented by RYAN CHANG Approved as to style and content by: Joseph Hamill, Chair Richard Van Emmerik, Member Jane Kent-Braun, Member Sundar Krishnamurty, Member Irene Davis, Consultant Patty Freedson, Department Chair Kinesiology
5 DEDICATION I dedicate this work to my grandparents and my family for supporting me every step of the way. iv
6 ACKNOWLEDGEMENTS First and foremost, I thank my mentor and advisor Dr. Joseph Hamill, the Director of the Biomechanics Laboratory. Or, as he put it from the very first day just Joe. From him I have learned so many things, for instance, biomechanics, stick-to-itiveness, appropriate usage of a comma, and the right timing of things. Thank you for your insight, support and for giving me the opportunity to work with you in your world-class laboratory. I thank my dissertation committee. A series of spontaneous stop-ins to Richard Van Emmerik s office lead to the formulation of this dissertation. He could always find patterns in the random words which I uttered. This dissertation would not have been possible without Jane Kent-Braun s willingness to take a huge risk on me. Her expertise and generosity with her time and resources were invaluable with the magnetic resonance studies. Her enthusiasm and curiosity towards research and foosball is highly contagious and motivating. I thank Sundar Krishnamurty for keeping my research honest from a scientific and an engineering standpoint. I also extend my thanks to Irene Davis whom I have had colo(u)rful discussions about topics like foot modeling and whom I admire for so effectively wearing the hats of a clinician and biomechanist. For designing and sharing MRI processing code, I thank Graham Caldwell, Scuba Steve Foulis and Christopher CJ Hasson. I also thank Graham Caldwell for making such a significant impact on my learning of biomechanics. I would like to thank all of the faculty, students and staff at the Department of Kinesiology. Thanks to Pistol Pete Rodrigues. In the early stages of the project, he and I worked relentlessly to capture only hints of multi-segment foot data with the older v
7 0.3 Megapixel cameras. It was a joyful day when the 1.3 Megapixel Oqus cameras arrived in November The MRS work would not have been possible without the hard work, input, and sense of humo(u)r of Ryan Hydro Larsen. He continues to be my ATP tutor, and all things related. The following individuals assisted me in some way (e.g. brainstorms, calculations, data collection, pilot studies, revisions, marker assembly, were magnetized, administrative issues, etc ), and therefore, should be recognized: Brian Umberger, William McDermott, Jebb Remelius, Ross Miller, Trampas Tenbroek, Alan Tomasko, Elizabeth Russell, Allison Gruber, Ian Lanza, Mike Tevald, Damien Callahan, Christopher MacLean, Joe Seay, Ryan Crews, Jeff Haddad, Florrie Blackbird and Colleen O Callaghan. I must also acknowledge individuals and organizations outside the University of Massachusetts. First, Dr. Douglas Rothman and Dr. Douglas Befroy of the Yale Magnetic Resonance Research Center. Second, William McBride and Joe Cristoforo of the Cooley Dickinson Hospital Amherst MRI clinic. Third, I thank the study subjects for volunteering their time. Fourth, I thank Mark McColman, President of Kintec Footlabs Incorporated. He has given me unwavering support for my pursuit of scholarship as my boss and as my friend. I also thank Kintec Footlabs Incorporated for providing the plantar fasciitis subjects with custom foot orthoses. Last, I acknowledge funding by the International Society of Biomechanics Dissertation Grant. Finally, I thank Linda LBC Chung, Anita ABC Christie, and Amy Claxton for making a PhD much more fun than it is supposed to be. vi
8 ABSTRACT PLANTAR FASCIITIS: BIOMECHANICS, ATROPHY AND MUSCLE ENERGETICS MAY 2010 RYAN CHANG, B.H.K., UNIVERSITY OF BRITISH COLUMBIA M.Sc., McGILL UNIVERSITY Ph.D. CANDIDATE, UNIVERSITY OF MASSACHUSETTS AMHERST Directed by: Professor Joseph Hamill Purpose: The purpose of this dissertation was to determine the effects of chronic plantar fasciitis on intrinsic foot structures with respect to biomechanics, muscle atrophy and muscle energetics. This was accomplished in three parts. Methods: In Part I, a three-dimensional motion capture system with a synchronized force platform quantified multi-segment foot model kinematics and ground reaction forces associated with walking. Healthy individuals were compared to individuals with chronic plantar fasciitis feet. Typical kinematic variables, measures of coupling, phase and variability were examined in rearfoot, forefoot and hallux segments. In Part II, foot and leg magnetic resonance images were taken in subjects with unilateral plantar fasciitis so that within each subject, the healthy limb could be compared to the plantar fasciitis limb. Cross sectional areas (CSA) of the plantar intrinsic foot muscles (PIFM) and tibialis posterior muscle were computed from user-digitized images. In Part III, the metabolic demands of the PIFM were evaluated using phosphorous magnetic resonance spectroscopy at rest and after barefoot walking. Muscle ph and the ratio of inorganic vii
9 phosphate to phosphocreatine (Pi/PCr) were compared in healthy and plantar fasciitis feet. Results: In comparison to healthy feet, plantar fasciitis feet exhibited significantly (p < 0.05): 1) greater rearfoot motion, 2) greater sagittal plane forefoot motion, 3) fewer rearfoot-forefoot frontal anti-phase movements, 4) reduced rearfoot-forefoot transverse coordinative variability, 5) greater first metatarsophalangeal (FMPJ) joint dorsiflexion, 6) greater FMPJ-medial longitudinal arch (MLA) coupling variability, and 7) decreased vertical ground reaction forces at propulsion. Also, plantar fasciitis feet had 5.2% smaller PIFM CSA at the forefoot compared to contralateral healthy feet. No CSA differences were seen in the rearfoot PIFM or at the tibialis posterior muscle. The PIFM of healthy and PF feet were not significantly different in resting intracellular levels of ph or Pi/PCr, and there were no significant differences in the increase of Pi/PCr from rest to postwalking. Conclusions: In Part I, it was concluded that plantar fasciitis feet exhibit kinematics which are consistent with theoretical causation of the plantar fasciitis injury, that is, the plantar fasciitis foot exhibits excessive motion. Fewer number of anti-phase movements exhibited by plantar fasciitis feet may be an indication of pathology. The ground reaction force results suggested a compensatory pain response. In Part II, it was concluded that atrophy of the forefoot PIFM may destabilize the medial longitudinal arch and prolong the healing process. Lastly in Part III, it was concluded that resting energetics were consistent with muscle free of systemic disease or neuromuscular pathology. The presence of plantar fasciitis did not elicit systematic asymmetries in the metabolic response in comparison to healthy feet. viii
10 Clinical Relevance: These kinematic results provided some evidence to support the clinical assertion that excessive motion is related to plantar fasciitis. These results also support treatment modalities which clinicians currently use to reduce rearfoot eversion, flattening of the medial longitudinal arch and dorsiflexion of the FMPJ (e.g. foot orthoses, insoles, taping, rocker soles). When treating plantar fasciitis patients, clinicians should assess for PIFM and tibialis posterior muscle atrophy and prescribe targeted exercises when appropriate. ix
11 TABLE OF CONTENTS DEDICATION...iv ACKNOWLEDGEMENTS... v ABSTRACT...vii LIST OF TABLES...xiv LIST OF FIGURES...xviii CHAPTER I. DEVELOPMENT OF THE PROBLEM... 1 Introduction... 1 Statement of the Problem... 8 Significance of the Studies... 9 Assumptions Abbreviations Hypotheses Summary References II. LITERATURE REVIEW Introduction Functional Anatomy of the Foot Structural Organization The Medial Longitudinal Arch Subtalar Joint Midtarsal Joint The Plantar Fascia Role of Muscles in Arch Support Kinematic Modeling of Foot Motion Three Dimensional Foot Modeling Rearfoot Motion Progress in Multi-Segment Foot Modeling Results Obtained Using Multi-Segment Models Plantar Fasciitis Clinical Presentation Management Aetiology and the Pes Planus Foot Page x
12 Dynamical Systems Approach to Coordination Approach to Pathology Magnetic Resonance Imaging and Biomechanics Phosphorous Magnetic Resonance Spectroscopy and Muscle Metabolic Activity Summary References III. PROPOSED METHODOLOGY General Introduction Part I Biomechanics Introduction Subjects Experimental Set-Up Kinematic Model Protocol Data Reduction Statistical Analysis Part II Atrophy Introduction Subjects Experimental Set-up Protocol Data Reduction Statistical Analysis Part III Muscle Energetics Introduction Subjects Experimental Set-up Protocol Data Reduction Statistical Analysis References IV. PART I A MULTI-SEGMENT FOOT ANALYSIS OF THE AMBULATING PLANTAR FASCIITIS FOOT Abstract Introduction Hypotheses xi
13 Methods Subjects Protocol Variables and Statistical Analyses Results Rearfoot Motion Forefoot Motion Rearfoot-Forefoot Coupling and Variability FMPJ Motion, FMPJ-MLA Coupling and Variability Ground Reaction Forces Discussion Rearfoot Motion Forefoot Motion Rearfoot-Forefoot Coupling and Variability FMPJ Motion, FMPJ - MLA Coupling and Variability Ground Reaction Forces (GRF) Limitations Overall Summary and Conclusion References V. PART II IS THERE MUSCLE ATROPHY OF THE PLANTAR INTRINSIC FOOT MUSCLES AND TIBIALIS POSTERIOR WITH CHRONIC PLANTAR FASCIITIS? Abstract Introduction Methods Subjects Protocol Data Reduction Plantar Intrinsic Foot Muscles (PIFM) Tibialis Posterior Muscle Variables and Statistical Analysis Results Plantar Intrinsic Foot Muscles Tibialis Posterior Muscle Discussion References VI. PART III ESTIMATIONS OF PLANTAR INTRINSIC FOOT MUSCLE ENERGETICS IN INDIVIDUALS WITH UNILATERAL PLANTAR FASCIITIS. 162 xii
14 Abstract Introduction Methods Subjects Muscle Energetics Mechanical Energy Statistical Analysis Results Muscle Energetics: ph and Pi/PCr MTPJ Joint Moments and Energy Discussion References VII. SUMMARY AND RECOMMENDATIONS FOR FUTURE STUDY Introduction Traditional Perspective A Summary of Relevant Findings Directions for Further Research References APPENDICES A. INFORMED CONSENT: PART I & II B. INFORMED CONSENT: PART III C. MAGNETIC MATERIALS SAFETY QUESTIONNAIRE D. SUBJECT QUESTIONNAIRES E. REVISED FOOT FUNCTION INDEX F. QUANTIFYING REARFOOT FOREFOOT COORDINATION IN HUMAN WALKING G. GENERALIZED FOREFOOT MODEL SEGMENT RESULTS BIBLIOGRAPHY xiii
15 LIST OF TABLES Table Page Table 1. List of abbreviations by type Table 2. Kinematics of 1 st MTP joint and plantar fascia length in the stance phase of gait (Valmassy, 1995) Table 3. Estimates of sample size for t-tests (α = 0.05, β = 0.80) of EV max based on mean differences to be detected and standard deviations (sd) from the literature (Hamill et al., 1992; McClay and Manal, 1997; Chang et al., 2007) Table 4. Segment and marker configurations Table 5. Summary of rotational references for model variables Table 6. Coordination categorization scheme for coupling angles Table 7. Sample size estimations for t-tests (α = 0.05, β = 0.80) of muscle CSA. Mean differences and the expected standard deviations (sd) based on (Kent-Braun et al. 2000) Table 8. Sample size estimations for PCr t-tests (α = 0.05, β = 0.80). Mean differences and standard deviations (sd) based on Lanza et al. (2006) and pilot work Table 9. Sample size estimations for Pi t-tests (α = 0.05, β = 0.80). Mean differences and standard deviations (sd) based on Lanza et al. (2006) and pilot work Table 10. Descriptive statistics for subject (means ± sd). The p-values are provided for t-tests Table 11. Group mean total scores (sd) for each section of the Revised Foot Function Index. p-values provided for a t-test Table 12. Segments, marker names and marker position adapted from Leardini et al. (2007) Table 13. Rearfoot motion results in the frontal plane for control (CON) and plantar fasciitis (PF) individuals. The p-values are presented for a t- test xiv
16 Table 14. Mean (sd) values for kinematic variables of the forefoot relative to the rearfoot and comparison across control (CON) and plantar fasciitis (PF) groups. (PFx: plantarflexion, TD: touchdown, Max: maximum, Total: total motion, vel: velocity) Table 15. Rearfoot-forefoot coupling angles. p-values reported for a Watson- William test (*: data did not meet Watson-Williams test criteria of circular distribution) Table 16. Mean (sd) coordination variability for sagittal, frontal and transverse planes. Three stance periods were considered: early (1-33%), mid (34-66) and late (67-99%). p-values are provided for a group by stance and interaction (G*S) ANOVA Table 17. Group mean (sd) hallux and medial longitudinal arch-hallux coupling data for late stance. P-values reported for a t-test Table 18. Mean (sd) peak vertical ground reaction forces normalized to body weight (%BW) associated with loading (GRF1) and push-off (GRF2) of walking gait. p-values and effects sizes provided for t-tests between groups Table 19. Mean anthropometric measures of the healthy and plantar fasciitis feet, (standard deviation). The p-values are provided for a paired t- test Table 20. Number of images digitized for each subject s healthy and plantar fasciitis (PF) foot. p value and effect size (ES) indicated for a twotailed paired t-test on the number of images analyzed healthy versus PF Table 21. Subject and group mean data for total muscle cross sectional areas (CSA) in the forefoot derived by MRI (healthy feet: H, plantar fasciitis: PF, percentage difference with respect to H: %H). A p value for a one-tailed dependent t-test and effect size (ES) are provided Table 22. Subject and group mean data for total muscle cross sectional areas (CSA) in the rearfoot derived by MRI (healthy feet: H, plantar fasciitis: PF, percentage difference with respect to H: %H). A p value for a one-tailed dependent t-test and effect size (ES) are provided Table 23. Subject and mean data for total muscle cross sectional areas (CSA) summed over the entire series of foot images (plantar fasciitis: PF, percentage difference with respect to healthy feet: %H). A p value for a one-tailed dependent t-test and effect size (ES) are provided xv
17 Table 24. Individual subject data for peak cross sectional areas (CSA) across entire foot (plantar fasciitis: PF, percentage difference with respect to healthy group: %H). p-value for a one-tailed dependent t-test between groups. ES: effect size Table 25. Individual subject and mean data for image containing the peak cross sectional area (CSA) for tibialis posterior (healthy feet: H, plantar fasciitis: PF, percentage difference with respect to H: %H). P- value for a one-tailed dependent t-test between groups and effect size (ES) are provided Table 26. Individual subject and group mean data for muscle cross sectional area (CSA) of a sum of the five images for the tibialis posterior muscle with the greatest CSA (healthy feet: H, plantar fasciitis: PF, percentage difference with respect to H: %H). A p-value for a one-tailed dependent t-test between groups and effect size (ES) are provided Table 27. Group mean (sd) scores totaled for each section of the Revised Foot Function Index Table 28. Individual and mean (sd) ph values at rest. A p value and effect size (ES) estimate is provided for a dependent t-test of the means Table 29. Individual and mean (sd) Pi/PCr values at rest. A p and effect size (ES) estimate are provided for a dependent t-test of the means Table 30. Individual and mean (sd) Pi/PCr values following seven minutes of treadmill walking. A p value and effect size (ES) estimate is provided for a paired t-test of the means Table 31. Individual and mean relative increases in Pi/PCr from rest (PRE) to following seven minutes of treadmill walking (POST). A p and effect size (ES) estimate is provided for a dependent t-test of the means Table 32. Individual and mean (sd) ph values post-walking. A p value and effect size (ES) estimate is provided for a dependent t-test of the means Table 33. Mean (sd) peak vertical ground reaction forces, metatarsophalangeal joint (MTPJ) moments and energy. Peak ground reaction forces associated with loading (GRF1) and push-off (GRF2) of walking gait were normalized to body weight (BW). p values and effects sizes are for t-tests between feet Table 34. Summary of findings for healthy feet in the early, mid- and late periods of stance phase (RF: rearfoot; FF: forefoot; FMPJ: first xvi
18 metatarsophalangeal joint; MLA: medial longitudinal arch, MTPJ: metatarsophalangeal joint, PIFM: plantar intrinsic foot muscles) xvii
19 LIST OF FIGURES Figure Page Figure 1. Bones (italicized) and segments (bolded) of the healthy human foot (adapted from Gray, 1918)... 2 Figure 2. A kinematic plot based on the qualitative descriptions of Bojsen- Moller (1979) for rearfoot (RF) and forefoot (FF) pronation- (Pro) supination (Sup) during stance. From the perspective of phase, coordination of the RF and FF coupling are considered in-phase in early stance and anti-phase in late stance (Chang et al., 2008)... 2 Figure 3. Frontal plane kinematics of the forefoot relative to rearfoot (FF:RF). Rotations were decomposed by a Cardan sequence using a distal relative to proximal segment convention (Hunt et al., 2001). Although the resulting angle between the forefoot and rearfoot is provided, coordination of the individual rearfoot and forefoot segments is not communicated... 6 Figure 4. The bones of the medial longitudinal arch (Gray, 1918) Figure 5. The position of the subtalar joint axis in the transverse plane (left) and sagittal plane (right) (Inman, 1976) Figure 6. The longitudinal axis (a) and the oblique axis (b) of the midtarsal joint. The orientation of each axis is shown in the sagittal plane (top row) and transverse plane (bottom row) (Manter, 1941) Figure 7. The plantar fascia (Young et al., 2001) Figure 8. The windlass mechanism (Hicks, 1954) Figure 9. The tibialis posterior muscle from a posterior view of the leg (Marieb and Hoehn, 2006) Figure 10. The plantar layers of the intrinsic muscles of the foot, first layer though fourth (a-d) (Gray, 1918) Figure 11. A multi-segment model proposed by the Bologna research group for rearfoot, midfoot, forefoot and hallux segments (Leardini et al., 1999) Figure 12. A stack plot of 31 P MRS spectra acquired over approximately two minutes for a human performing intermittent maximal contractions of xviii
20 the tibialis anterior. The spectra illustrate the rise in muscular concentrations of inorganic phosphate (Pi), decline of phosphocreatine (PCr) and stability of adenosine triphosphate (ATP) (Lanza et al., 2006) Figure 13. Apparatus configuration for kinematic and kinetic data collection. A personal computer (PC) operates eight cameras and a force platform. Two photo gates are setup near the start and end of the walkway (shaded). The axes and position of the global coordinate system are shown Figure 14. Segment definitions and marker positions for the multi-segment foot model (Leardini et al., 2007) Figure 15. Planar angles as defined by line segments of the medial longitudinal arch (MLA) and first metatarso-phalangeal joint (FMTPJ) Figure 16. An angle-angle diagram of rearfoot-forefoot movement in the frontal plane. The data are overlaid with a polar plot to illustrate coordination types: in-phase, anti-phase, rearfoot and forefoot). The box on the left presents an expanded view of the data points of three coupling angles (γ) Figure 17. Pixel intensity histogram for a portion of a T-1 weighted image of the leg. The sharp peak on the left is related to muscle pixels and the broad peak is related to fat pixels (Kent-Braun et al., 2000) Figure 18. Segment and global coordinate systems for the rearfoot and forefoot based on the model proposed by Leardini et al. (2007). Colored circles indicate tracking markers and dotted circles indicate location of coordinate system origins. Half-filled circles indicated markers not used in the medial forefoot model. See Table 12 for marker name and details Figure 19. Planar angles as defined by line segments of the medial longitudinal arch (MLA) and first metatarso-phalangeal joint (FMPJ) Figure 20. Rearfoot motion in the frontal plane. Plantar fasciitis (PF): solid line with dark standard deviation bands (sd); Control (CON): dotted with light standard deviation bands Figure 21. Forefoot kinematic time series during stance period in plantar fasciitis (PF) and healthy control subjects (CON). Data are means the a) sagittal, b) frontal and c) transverse planes. Bands indicate standard deviations (CON: light/grey and PF: dark/orange) xix
21 Figure 22. The angle-angle diagrams and respective coupling angle time graphs for the rearfoot (RF) -forefoot (FF) couple in the sagittal (a,d), frontal (b,e) and transverse planes (c,f). Insets provide a guide to the coordination mode associated with the orientation of the coupling angles. The + indicates touchdown of the stance phase Figure 23. Coordination histograms for healthy and plantar fasciitis individuals which summarize the frequency of four coordination patterns: anti-phase, in-phase, rearfoot phase and forefoot phase Figure 24. Frequency of anti-phase movements in the sagittal (a), frontal (b), and transverse (c) between healthy control (CON) and plantar fasciitis (PF) individuals. No group by stance period interaction effects were found ( p > 0.05) P-values are reported for the main group effects for a repeated measures ANOVA. Asterisks indicate significant main effect (p <0.05) for period, *: different from early stance, **: different from midstance Figure 25. Mean rearfoot-forefoot coupling variability in the sagittal (a), frontal (b), transverse (c) planes. Solid line PF, dotted CON Figure 26. Mean first metatarsal-phalangeal joint angle in the sagittal plane during stance Figure 27. First metatarsal-phalangeal joint (FMPJ) medial longitudinal arch (MLA) angle-angle diagram normalized to total range of motion (left). Corresponding coupling angles are provided on the right Figure 28. Mean first metatarso-phalangeal medial longitudinal arch coupling variability observed in the sagittal plane Figure 29. Group mean ground reaction force profiles reported in percentage body weight (%BW) in the medio-lateral (a), antero-posterior (b), and vertical (c) directions for healthy controls (CON) and individuals with plantar fasciitis (PF) Figure 30. Screen shot of custom muscle digitization program. The userdigitized muscle contour is shown in red. The lower panel indicates the distribution of the pixels by pixel intensity with low intensity (darker) to the left. Vertical blue lines indicate user-selected thresholds set to 295 and Figure 31. T1 weighted magnetic resonance image with user-outlined intrinsic foot muscle group (left). Same image on the right viewed in three colors; pixels below the low signal intensity threshold were xx
22 coded blue; red pixels coded for between low and high threshold, and light-green coded pixels are above high threshold Figure 32. T1 weighted magnetic resonance image of a subject s leg at the proximal one-third of the leg length. Tibialis posterior muscle is outlined Figure 33. Mean muscle cross sectional areas across the foot length for healthy (H) and plantar fasciitis (PF) feet, from sesamoids (0% foot length) to calcaneal tuberosity (100%) Figure 34. The toe and foot segments modeled as cones as a subject walked from right to left across the surface of the force platform. At this moment, the ground reaction force (GRF) vector is acting at the toe segment. The fixed laboratory coordinate system (XYZ) is indicated on the right-side Figure P MRS spectra from one subject at rest (PRE) and after seven minutes of barefoot treadmill walking (POST). Peaks for inorganic phosphate (Pi), phosphocreatine (PCr), and the three phosphate groups (α, β, γ) of adenosine triphosphate (ATP) are indicated Figure 36. Mean and standard deviation bands for the vertical ground reaction forces in individuals with unilateral plantar fasciitis (healthy foot (H) and plantar fasciitis foot (PF)) Figure 37. Mean metatarsophalangeal joint (MTPJ) moment (a) and power curves (b) with standard deviation bands for healthy (H) and plantar fasciitis feet (PF) Figure 38. Forefoot kinematic time series during stance period in plantar fasciitis (PF) and healthy control subjects (CON). Data are means the a) sagittal, b) frontal and c) transverse planes. Bands indicate standard deviations (CON: light/grey and PF: dark/orange) Figure 39. The angle-angle diagrams and respective coupling angle time graphs for the rearfoot (RF) -forefoot (FF) couple in the sagittal (a,d), frontal (b,e) and transverse planes (c,f). Insets provide a guide to the coordination mode associated with the orientation of the coupling angles. (+) indicates touchdown of the stance phase Figure 40. Mean rearfoot-forefoot coupling variability the sagittal (a), frontal (b), transverse (c) planes. Solid line PF, dotted CON xxi
23 CHAPTER I DEVELOPMENT OF THE PROBLEM Introduction The framework for how biomechanists currently view the human foot is heavily influenced by the early work of anatomists, orthopaedic surgeons and podiatrists. From the 1940s onward, dissections and cadaver experiments of the foot focused on two fundamental research goals: first, to describe the morphological details of the numerous anatomical structures of the foot (i.e., 28 bones, 33 joints and over 100 soft tissue elements); and second, to infer from the anatomy the mechanical interactions between these structures during static and dynamic tasks. One particularly intriguing mechanical aspect of the foot is its coordinated transition from a compliant structure in early stance to a rigid structure during push-off. This aspect was realized in early research and continues to be heavily discussed in the literature. Mechanical models based on the medial longitudinal arch, the midtarsal joint, and intrinsic foot muscles, were put forth to explain this phenomenon (Manter, 1941; Hicks, 1953; Elftman, 1960; Mann and Inman, 1964; Bojsen-Moller, 1979). These models qualitatively described the foot in terms of three functional units: rearfoot, forefoot and hallux (Figure 1). For instance, in the model regarding locking of the midtarsal joint, Bojsen-Moller (1979) discussed the coordination of the rearfoot and forefoot segments and proposed that the relative positions of these two segments dictated the overall stiffness of the foot. It is believed that the midtarsal joint locks when there is forefoot pronation coupled with rearfoot supination. Presumably important for an 1
24 effective push-off, forefoot pronation and rearfoot supination occurs in late stance of gait (Figure 2) (Bojsen-Moller, 1979) Figure 1. Bones (italicized) and segments (bolded) of the healthy human foot (adapted from Gray, 1918). Figure 2. A kinematic plot based on the qualitative descriptions of Bojsen-Moller (1979) for rearfoot (RF) and forefoot (FF) pronation- (Pro) supination (Sup) during stance. From the perspective of phase, coordination of the RF and FF coupling are considered in-phase in early stance and anti-phase in late stance (Chang et al., 2008). 2
25 The realization that the foot is both compliant and rigid significantly influenced the understanding of foot function and medical practice. The influence of compliantrigid models can be seen in clinical podiatric and foot orthotic literature (Root et al., 1977; Valmassy, 1995). They are also seen in the designs of the solid-ankle cushion-heel (SACH) foot prosthetic in which a combination of compliant and rigid materials were incorporated (Inman, 1976; Inman et al., 1981). Although the application of these compliant-rigid models is widespread, their underlying mechanics have not been observed in vivo using modern day quantitative biomechanical techniques. Consequently, there is limited quantitative information on mechanics that unfold within the foot during gait. Traditionally, in vivo human joint kinematics are analyzed using a link-segment model with the foot modeled as a single rigid segment (White et al., 1989; Areblad et al., 1990; Robertson et al., 2004). While this technique has provided substantial insight into the movements at the hip, knee and ankle (Cavanagh, 1987; Winter et al., 1990; Vaughan, 1996; Sutherland, 2002), a significant limitation of this approach is that kinematic solutions cannot be derived for the intrinsic foot structures (Kidder et al., 1996). Therefore, use of the traditional link segment model has not improved the understanding of intrinsic foot segmental coordination. In addition to intrinsic segment kinematics, examination of intrinsic foot muscles has been equally problematic and has received little attention in the literature. Little is known about these muscles force-producing capabilities and their activation patterns during gait. Many intrinsic muscles span numerous articulations and are deep to the skin, 3
26 making them difficult to study in vivo. Notwithstanding the limitations of interpreting dynamic electromyograms, only one study has investigated intrinsic foot muscle activity during gait (Mann and Inman, 1964). As a result, there is little quantitative data that is necessary for the development of theoretical and clinical knowledge of healthy foot muscle function. Even less is known about how muscle size and muscle activity are affected when the foot is injured. The aetiology of chronic plantar fasciitis is a closely related topic that necessitates information on the intrinsic foot structures. The plantar fascia is an aponeurotic tissue that provides stability to the medial longitudinal arch of the foot (Huang et al., 1993). Plantar fasciitis is a debilitating disorder of the foot that affects more than two million Americans per year (Pfeffer et al., 1999). It is believed that plantar fasciitis is a deterioration of the plantar fascia, which manifests from excessive and/or repetitive loading (Warren, 1990; Wearing et al., 2006). The most cited cause of this excessive load is the pes planus (flat) foot (synonymous with subtalar joint overpronation in many reports) (Subotnick, 1981; Taunton et al., 1982; Shama et al., 1983; Kwong et al., 1988; Prichasuk and Subhadrabandhu, 1994). Excessive flattening of the medial arch and excessive rearfoot eversion are qualities of the pes planus foot that are believed to increase loading on the plantar fascia. However, studies that have measured these mechanical features in healthy individuals and plantar fasciitis individuals have not found an association between plantar fasciitis and excessive mechanics (Warren, 1984; Messier and Pittala, 1988; Rome et al., 2001; Wearing et al., 2004). To this end, the aetiology of plantar fasciitis is not well understood. 4
27 The majority of studies on plantar fasciitis have focused on aspects of joint kinematics, while aspects of muscle size and activation have not been explored. It has been shown that pain associated with plantar fasciitis negatively impacts function in daily living (Roos et al., 2006). Therefore, it is possible that activity is curtailed resulting in muscle atrophy. However, it is not known whether plantar fasciitis is accompanied by muscle atrophy of the intrinsic foot muscles, or changes in muscle activation. The proposed injury mechanisms for plantar fasciitis are based primarily on kinematics and it is unclear what muscular changes might play a role. There is a general lack of understanding of the fundamental mechanics of the intrinsic foot structures in the context of gait. Furthermore, previous studies have not been able to discriminate plantar fasciitis sufferers from the unimpaired, nor have they been able to elucidate the aetiological process for plantar fasciitis. Various tools have emerged that will facilitate the study of small and complex structures contained within the foot: multi-segment foot models, dynamical systems techniques, and magnetic resonance technology. This dissertation will examine the effects of plantar fasciitis on the dynamics of intrinsic structures of the foot. The focus is on aspects of inter-segmental coordination, muscle atrophy and muscle activation. Advancements in biomechanical measurement might facilitate research on the theoretical foundation of the intrinsic foot structures and plantar fasciitis. Owing to improved camera and computer technology, kinematic models of the foot have been developed beyond the single-segment model. A variety of multi-segment foot models have been proposed and it is possible to use them in a typical clinical gait laboratory setup (Kidder et al., 1996; Leardini et al., 1999; Carson et al., 2001; Stebbins et al., 2006; 5
28 Leardini et al., 2007). These models provide an opportunity to examine the theories concerning coordination of the rearfoot, forefoot and hallux segments. To date, methods for reporting rearfoot and forefoot kinematics are not conducive for comparison to previous qualitative descriptions of foot function. Most models have adopted the typical distal-to-proximal segment Cardan reporting convention (Figure 3) (Hunt et al., 2001; Stebbins et al., 2006; Leardini et al., 2007). When this method is used, attention is focused on the resultant angle between the two segments. The main limitation in this approach is that the individual movements of the segments that contributed to this resultant angle cannot be determined. Individual rearfoot and forefoot segment motion was a significant portion of the discussion in the compliant-rigid models. Therefore, it has been challenging to determine whether forefoot to rearfoot motion reported using a typical Cardan reporting convention, either support or refute the compliant-rigid models. Figure 3. Frontal plane kinematics of the forefoot relative to rearfoot (FF:RF). Rotations were decomposed by a Cardan sequence using a distal relative to proximal segment convention (Hunt et al., 2001). Although the resulting angle between the forefoot and rearfoot is provided, coordination of the individual rearfoot and forefoot segments is not communicated. We recently examined the inter-segmental coordination of the foot from the perspective of phase (Chang et al., 2007). This method incorporates vector coding 6
29 (Sparrow et al., 1987; Heiderscheit, 2000; Heiderscheit et al., 2002) and then classifies movements according to phase coordination. For example, if one were to refer to the descriptions of Bojsen-Moller (1979) in phase terms (Figure 2), the coordination of the rearfoot and forefoot coupling would be considered in-phase in early stance and antiphase in late stance. In early stance, there was pronation at the forefoot and rearfoot. This is in contrast to late stance when forefoot pronation was countered by rearfoot supination. By emphasizing segmental coordination rather than the resultant angle, phase analysis could potentially provide results that are more suitable than previous methodologies for describing inter-segmental foot kinematics. In addition, phase analysis may offer insight into the nature of the deformation of the plantar fascia and mechanisms of injury (Chang et al., 2007). Anti-phase coordination across planes might suggest bending, twisting and torsion along the length of the plantar fascia. The introduction of dynamical systems approaches to the study of coordination, joint kinematics and overuse injuries has challenged the traditional view that performance variability indicates disability (Hamill et al., 1999; Van Emmerik and van Wegen, 2000; Heiderscheit et al., 2002). Dynamical systems exhibit variability near transition points. It is believed that variability is an essential ingredient for the ensuing transition and that it is an indicator of adaptability (Kelso, 1984; Kelso, 1995). It has been shown that humans in pathological states (e.g. Parkinson s disease) have difficulty transitioning from one coordinative mode to another (Van Emmerik and van Wegen, 2000). Using two measures of coordination variability, vector coding and continuous relative phase, individuals with patellofemoral pain have exhibited decreased variability in knee coordination in the coupling angle, and decreased continuous relative phase variability at 7
30 a kinematic transition point (Hamill et al., 1999; Heiderscheit et al., 1999; Heiderscheit, 2000; Heiderscheit et al., 2002). In the foot, there is a major transition point at midstance at which the foot transitions from a compliant structure into a rigid structure for push-off (Manter, 1941; Hicks, 1953; Elftman, 1960; Mann and Inman, 1964; Bojsen-Moller, 1979). Therefore, there is potential for the use of dynamical systems tools, such as vector coding, to interpret foot function and for characterizing the presence of plantar fasciitis. Magnetic resonance techniques have offered a new avenue to study muscle size and muscle activity in vivo. Magnetic resonance imaging (MRI) provides cross sectional images of body segments so that the area of contractile tissue can be quantified (Kent- Braun et al., 2000). Phosphorous magnetic resonance spectroscopy ( 31 P MRS) may be used to quantify concentrations of phosphorus-containing metabolites (i.e. inorganic phosphate (Pi), phosphocreatine (PCr) and adenosine triphosphate (ATP)) during rest, exercise and recovery (Chance et al., 1980; Chance et al., 1985). Resting levels of the Pi/PCr ratio can indicate pathology (McCully et al., 1988; Kent-Braun et al., 1995). During sub-maximal exercise, the Pi/PCr ratio is linearly related to muscle mechanical work and this ratio has been used as an indicator of muscle metabolic activity (Chance et al., 1985; McCully et al., 1991). Magnetic resonance can potentially provide information regarding the size of the intrinsic foot muscles and its muscle activity so that plantar fasciitis may be characterized quantitatively. Statement of the Problem It is believed that the foot is a compliant structure in early stance, and later rigid at push-off. There are several models that describe how the compliant-rigid transition is coordinated via the mechanics of the medial arch, the midtarsal joint and the intrinsic foot 8
31 muscles (Manter, 1941; Hicks, 1953; Elftman, 1960; Mann and Inman, 1964; Bojsen- Moller, 1979). These models have remained dominant in both medical and research arenas. However, there is little in vivo quantitative biomechanical evidence to support these models; therefore, they remain speculative. Medical doctrine concerning the development of plantar fasciitis has relied directly on the same models. The mechanics of plantar fasciitis feet are believed to be an excessive kinematic version of normal foot mechanics. The basic premise is that excessive joint kinematics lead to high tissue loads. However, there is a lack of scientific evidence to support this premise in individuals with plantar fasciitis. The aetiology of plantar fasciitis remains unclear. Although the importance of intrinsic foot muscles in normal healthy foot function has been gleaned from cadavers and qualitative joint kinematic analysis, there is very little quantitative information on intrinsic foot muscles. In general, research has focused on joint kinematics. Consequently, the study of intrinsic foot muscles has been neglected. The effects of plantar fasciitis on muscle size and activation are not known. The goal of this dissertation is to characterize chronic plantar fasciitis in regards to segmental coordination, muscle size and muscle activity. This goal will be accomplished in three separate studies. Significance of the Studies It is important to understand the fundamentals of intrinsic foot mechanics. There are several theories on how the foot functions mechanically in gait, but they have not been validated. The present studies aim to contribute to the base of knowledge by providing quantitative information on the dynamics of intrinsic foot structures. 9
32 Segmental coordination, intrinsic foot muscle size and intrinsic foot muscle activation will be examined. Plantar fasciitis is a debilitating injury (Roos et al., 2006) that affects two million Americans every year (Pfeffer et al., 1999), and therefore characterizing this pathology is clinically important. These studies may elucidate a mechanism that perpetuates chronic plantar fasciitis and improve clinical intervention strategies. For example, if certain muscles are atrophied in chronic plantar fasciitis, exercises may be prescribed to train these specific muscles. In regards to foot orthoses and footwear, innovative designs may be incorporated to address rearfoot and forefoot coordination. Assumptions The assumptions of a rigid body hold true. Movements of the reflective markers accurately represent the movements of the underlying skeleton. Relative movements of the rearfoot and forefoot reflect movements of the plantar fascia. The level of plantar fasciitis pathology in the PF subjects will not change significantly from one test day to the next. 10
33 Table 1. List of abbreviations by type. Abbreviations Type Abbreviation Groups PF CON Muscle PIFM CSA Compounds Pi PCr ph Description Chronic plantar fasciitis Healthy control group Plantar intrinsic foot muscle Cross sectional area Intracellular concentration of inorganic phosphate Intracellular concentration of phosphocreatine Intracellular concentration of hydrogen Hypotheses Study 1 Specific Aim #1: Determine changes in kinematics with chronic plantar fasciitis. Hypotheses related to kinematic measures. H1.1: PF will exhibit significantly greater rearfoot joint motion than CON in stance phase: H1.1.1: maximum rearfoot eversion H1.1.2: total rearfoot eversion H1.1.3: maximum rearfoot eversion velocity PF feet are reported to exhibit greater levels of rearfoot eversion in comparison to normal arched feet (Franco, 1987; Valmassy, 1995). H1.2: In stance, there will be greater forefoot to rearfoot motion in PF as compared to CON in the three planes: H1.2.1: maximum joint angle 11
34 H1.2.2: total joint motion H1.2.3: maximum angular velocity It is believed that PF feet exhibit pronation at the midfoot (Wearing et al., 2006). Hypotheses related to measures of coordination measured by an expanded vector coding technique (Chang et al., 2008). H1.3: At midstance, PF will exhibit significantly more anti-phase coordination in the rearfoot-forefoot coupling than CON. Chronic plantar fasciitis may be perpetuated by excessive strain in the plantar fascia as a result of anti-phase coordination in the rearfoot and forefoot coupling. For instance in the frontal plane, forefoot inversion with concomitant rearfoot eversion, an anti-phase movement, would suggest greater torsional stress of the plantar fascia. 1.4: PF will exhibit less coordinative variability in the rearfoot-forefoot coupling than CON. Dynamical systems exhibit necessary variability near the transition point between coordination modes (Kelso, 1995). The foot exhibits a transition point at midstance between compliancy in early stance and rigidity in late stance (Mann and Inman, 1964). These two modes are characteristic of the low dimensional qualitative states that define an order parameter. Studies of the lower extremity using a dynamical systems approach have shown that a pathological state exhibits reduced coordinative variability (Hamill et al., 1999; Heiderscheit et al., 2000; Heiderscheit et al., 2002). 12
35 H1.5: During late stance, coupling of hallux angle and the medial longitudinal arch angle (windlass mechanism) in PF will be less in-phase than CON. A damaged plantar fascia might result in a dysfunctional windlass mechanism (Hicks, 1954). H1.6: The windlass mechanism of PF will exhibit less coordinative variability than CON (Hamill et al., 1999; Heiderscheit et al., 2000; Heiderscheit et al., 2002). Study 2 Specific Aim: Determine whether there is atrophy of muscles that support the medial longitudinal arch in chronic plantar fasciitis. H2.1: There will be a significantly less PIFM CSA in the plantar fasciitis foot as compared to the contralateral healthy foot: H2.1.1: H2.1.2: H2.1.3: H2.1.3: total PIFM CSA forefoot PIFM CSA rearfoot PIFM CSA peak PIFM CSA The heel pain associated with plantar fasciitis negatively impacts function in daily living (Roos et al., 2006). Therefore, it is possible that activity is curtailed resulting in muscle atrophy. H2.2: There will be a significantly less muscle CSA of tibialis posterior muscle in the plantar fasciitis foot in comparison to the healthy foot. The tibialis posterior muscle supports the medial longitudinal arch (Funk et al., 1986; Thordarson et al., 1995; Dyal et al., 1997; Sharkey et al., 1998), and 13
36 therefore an atrophied tibialis posterior may give insight to the aetiology of chronic plantar fasciitis. Study 3 Specific Aim: Determine whether there are changes in metabolic activity of the PIFM associated with chronic plantar fasciitis. Hypotheses related to muscle activity of intrinsic foot musculature in PF. H3.1: In comparison to the contralateral healthy foot, the plantar fasciitis foot will not differ in resting levels of intracellular: H3.1.1: ph H3.1.2: Pi/PCr It has been shown that diseased muscles exhibit changes in resting levels of ph and Pi/PCr (McCully et al., 10988, Kent-Braun et al., 1995), however, there is no data to show that there are changes in these concentration levels with overuse injuries. H3.2: Increases in Pi/PCr from rest to after a walking exercise will be greater on the plantar fasciitis foot as compared to the contralateral healthy foot. A combination of a pathological plantar fascia and atrophy could relatively increase the relative demand of intrinsic foot muscle work in walking. This increase in muscle mechanical work muscle would be reflected in Pi/PCr, an indicator of muscle metabolic activity (Chance et al., 1985; McCully et al., 1991). Summary To understand what perpetuates chronic plantar fasciitis, intrinsic foot dynamics must be considered. These studies will compare healthy individuals to individuals with 14
37 chronic plantar fasciitis in regards to intersegmental coordination, muscle size and muscle energetics. A multi-segment foot model and a dynamical systems approach will be used to study intrinsic foot coordination in vivo. Also, data concerning size and metabolic activity of the small intrinsic foot muscles will be collected using magnetic resonance technology. References Areblad, M., Nigg, B. M., Ekstrand, J., Olsson, K. O., & Ekstrom, H., Threedimensional measurement of rearfoot motion during running. Journal of Biomechanics 23, Bojsen-Moller, F., Calcaneocuboid joint and stability of the longitudinal arch of the foot at high and low gear push off. Journal of Anatomy 129, Carson, M. C., Harrington, M. E., Thompson, N., O'Connor, J. J., & Theologis, T. N., Kinematic analysis of a multi-segment foot model for research and clinical applications: a repeatability analysis. Journal of Biomechanics 34, Cavanagh, P. R., The biomechanics of lower-extremity action in distance running. Foot & Ankle. 7, Chance, B., Eleff, S., & Leigh, J. S., Jr., Noninvasive, nondestructive approaches to cell bioenergetics. Proceedings of the National Academy of Sciences of the United States of America U S A 77, Chance, B., Leigh, J. S., Jr., Clark, B. J., Maris, J., Kent, J., Nioka, S., & Smith, D., Control of oxidative metabolism and oxygen delivery in human skeletal muscle: a steady-state analysis of the work/energy cost transfer function. Proceedings of the National Academy of Sciences of the United States of America U S A 82, Chang, R., Van Emmerik, R. E. A., & Hamill, J., Coordination of the rearfoot and forefoot during walking. Journal of Biomechanics 40, S179-S179. Elftman, H., The transverse tarsal joint and its control. Clinical Orthopaedics. 16, Gray, H Anatomy of the human body. 20 edn, Lewis, W. H. (ed.), Lea & Febiger, Philadelphia. 15
38 Franco, A. H., Pes cavus and pes planus. Analyses and treatment. Physical Therapy 67, Hamill, J., Van Emmerik, R. E., Heiderscheit, B. C., & Li, L., A dynamical systems approach to lower extremity running injuries. Clinical Biomechanics 14, Heiderscheit, B. C., Movement variability as a clinical measure for locomotion. Journal of Applied Biomechanics 16, Heiderscheit, B. C., Hamill, J., & Caldwell, G. E., Influence of Q-angle on lowerextremity running kinematics. The Journal of Orthopaedic and Sports Physical Therapy 30, Heiderscheit, B. C., Hamill, J., & Van Emmerik, R. E., Q-angle influences on the variability of lower extremity coordination during running. Medicine and Science in Sports and Exercise 31, Heiderscheit, B. C., Hamill, J., & Van Emmerik, R. E. A., Variability of stride characteristics and joint coordination among individuals with unilateral patellofemoral pain. Journal of Applied Biomechanics 18, Hicks, J. H., The mechanics of the foot. I. The joints. Journal of Anatomy 87, Hicks, J. H., The mechanics of the foot II. The plantar aponeurosis and the arch. Journal of Anatomy 88, Hunt, A. E., Smith, R. M., Torode, M., & Keenan, A. M., Inter-segment foot motion and ground reaction forces over the stance phase of walking. Clinical Biomechanics 16, Inman, V. T.,1976. The joints of the ankle. The Williams & Wilkins Co., Baltimore, MD. Inman, V. T., Ralston, H. J., & Todd, F.,1981. Human Walking. Williams & Wilkins, Baltimore, MD. Kelso, J. A. S., Phase-transitions and critical-behavior in human bimanual coordination. American Journal of Physiology. 246, Kelso, J. A. S., Dynamic Patterns - The Self-Organization of Brain and Behavior MIT Press, Cambridge, MA. Kent-Braun, J. A., Miller, R. G., & Weiner, M. W., Human skeletal muscle metabolism in health and disease: utility of magnetic resonance spectroscopy. Exercise and Sport Sciences Reviews 23,
39 Kent-Braun, J. A., Ng, A. V., & Young, K., Skeletal muscle contractile and noncontractile components in young and older women and men. Journal of Applied Physiology 88, Kidder, S. M., Abuzzahab, F. S., Jr., Harris, G. F., & Johnson, J. E., A system for the analysis of foot and ankle kinematics during gait. IEEE Transactions on Rehabilitation Engineering 4, Kwong, P. K., Kay, D., Voner, R. T., & White, M. W., Plantar fasciitis - mechanics and pathomechanics of treatment. Clinics in Sports Medicine. 7, Leardini, A., Benedetti, M. G., Berti, L., Bettinelli, D., Nativo, R., & Giannini, S., Rear-foot, mid-foot and fore-foot motion during the stance phase of gait. Gait & Posture 25, Leardini, A., Benedetti, M. G., Catani, F., Simoncini, L., & Giannini, S., An anatomically based protocol for the description of foot segment kinematics during gait. Clinical Biomechanics 14, Mann, R. & Inman, V. T., Phasic activity of intrinsic muscles of the foot. The Journal of bone and joint surgery. American Volume 46, Manter, J. T., Movements of the subtalar and transverse tarsal joints. Anatomical Record. 80, McCully, K. K., Argov, Z., Boden, B. P., Brown, R. L., Bank, W. J., & Chance, B., Detection of muscle injury in humans with 31-P magnetic resonance spectroscopy. Muscle Nerve. 11, McCully, K. K., Kakihira, H., Vandenborne, K., & Kent-Braun, J., Noninvasive measurements of activity-induced changes in muscle metabolism. Journal of Biomechanics 24 Suppl 1, Messier, S. P. & Pittala, K. A., Etiologic factors associated with selected running injuries. Medicine and Science in Sports and Exercise 20, Pfeffer, G., Bacchetti, P., Deland, J., Lewis, A., Anderson, R., Davis, W., Alvarez, R., Brodsky, J., Cooper, P., Frey, C., Herrick, R., Myerson, M., Sammarco, J., Janecki, C., Ross, S., Bowman, M., & Smith, R., Comparison of custom and prefabricated orthoses in the initial treatment of proximal plantar fasciitis. Foot & Ankle International 20, Prichasuk, S. & Subhadrabandhu, T., The Relationship of Pes Planus and Calcaneal Spur to Plantar Heel Pain. Clinical Orthopaedics and Related Research
40 Robertson, D. G. E., Caldwell, G. E., Hamill, J., Kamen, G., & Whittlesey, S. N., Research methods in biomechanics. Human Kinetics, Champaign, IL. Rome, K., Howe, T., & Haslock, I., Risk factors associated with the development of plantar heel pain in athletes. The Foot 11, Roos, E., Engstrom, M., & Soderberg, B., Foot orthoses for the treatment of plantar fasciitis. Foot & Ankle International 27, Root, M. L., Orien, W. P., & Weed, J. H.,1977. Normal and abnormal function of the foot. Clinical Biomechanics Corporation, Los Angeles. Shama, S. S., Kominsky, S. J., & Lemont, H., Prevalence of non-painful heel spur and its relation to postural foot position. Journal of the American Podiatry Association 73, Sparrow, W. A., Donovan, E., Van Emmerik, R. E. A., & Barry, E. B., Using Relative Motion Plots to Measure Changes in Intra-Limb and Inter-Limb Coordination. Journal of Motor Behavior 19, Stebbins, J., Harrington, M., Thompson, N., Zavatsky, A., & Theologis, T., Repeatability of a model for measuring multi-segment foot kinematics in children. Gait & Posture 23, Subotnick, S. I., The flat foot. The Physician and Sportsmedicine 9, Sutherland, D. H., The evolution of clinical gait analysis - Part II - Kinematics. Gait & Posture 16, Taunton, J. E., Clement, D. B., & McNicol, K., Plantar fasciitis in runners. Canadian Journal of Applied Sport Sciences 7, Valmassy, R. L.,1995. Clinical Biomechanics of the Lower Extremities. Mosby Inc., St. Louis. Van Emmerik, R. E. A. & van Wegen, E. E. H., On variability and stability in human movement. Journal of Applied Biomechanics 16, Vaughan, C. L., Are joint torques the Holy Grail of human gait analysis? Human Movement Science. 15, Warren, B. L., Anatomical factors associated with predicting plantar fasciitis in long-distance runners. Medicine and Science in Sports and Exercise16, Warren, B. L., Plantar fasciitis in runners. Treatment and prevention. Sports Medicine 10,
41 Wearing, S. C., Smeathers, J. E., Urry, S. R., Hennig, E. M., & Hills, A. P., The pathomechanics of plantar fasciitis. Sports Medicine 36, Wearing, S. C., Smeathers, J. E., Yates, B., Sullivan, P. M., Urry, S. R., & Dubois, P., Sagittal movement of the medial longitudinal arch is unchanged in plantar fasciitis. Medicine and Science in Sports and Exercise 36, White, S. C., Yack, H. J., & Winter, D. A., A three-dimensional musculoskeletal model for gait analysis. Anatomical variability estimates. Journal of Biomechanics 22, Winter, D. A., Patla, A. E., & Frank, J. S., Assessment of balance control in humans. Medical Progress Through Technology 16,
42 CHAPTER II LITERATURE REVIEW Introduction The following section provides a review of the literature concerning foot coordination (bone and muscle) as it relates to plantar fasciitis. The section begins with a brief introduction to the structure of the foot and is followed by a more in-depth examination of kinematic foot models, plantar fasciitis, the application of dynamical systems to biological components, and magnetic resonance techniques. Functional Anatomy of the Foot Structural Organization The healthy human foot is composed of 28 bones and 33 articulations (Figure 1). In practice, clinicians organize these structures into three or four functional segments: 1) rearfoot (tarsus); 2) midfoot (lesser tarsus)), 3) forefoot (metatarsus), and 4) phalanges (Root et al., 1971; Caillet, 1996). In the three segment approach, the forefoot and the phalanges are grouped together. Alternatively, anatomical structures are organized into the three arches: the medial longitudinal arch, the lateral arch, and the transverse metatarsal arch. The medial longitudinal arch is the largest and most functionally important of the three foot arches. Bones that compose the medial longitudinal arch include the calcaneus, talus, navicular, three cuneiforms, and three medial metatarsals. 20

43 Figure 4. The bones of the medial longitudinal arch (Gray, 1918). The Medial Longitudinal Arch The medial longitudinal arch is a major structure of the foot that is a collective of many anatomical components. Therefore, the task of maintaining the arch is shared across several passive and active structures. It has been challenging for researchers to determine their relative contribution to medial arch support in vivo. The magnitude of support offered by a given structure is dependent upon segmental foot kinematics, and is therefore complicated. Active and passive structures of the medial longitudinal arch, namely the subtalar joint, midtarsal joint, the plantar fascia, and intrinsic and extrinsic muscles will be discussed in more detail. It is not uncommon for clinicians to classify the overall nature of a patient s foot by the morphology of the medial longitudinal arch. For instance, pes planus and pes cavus are clinical terms that are used to describe abnormally low and high arched feet, respectively. The pes planus foot is characterized by a hindfoot valgus, forefoot abduction, a low medial longitudinal arch and is relatively more flexible. Its opposite, the pes cavus foot, is characterized by a hindfoot varus, forefoot adduction, a high medial longitudinal arch and is relatively more rigid (Valmassy, 1995). 21
44 Based on clinical experience, associations between arch morphology, biomechanics and injury have been made (James et al., 1978; Subotnick, 1980; Subotnick, 1981; Franco, 1987). Since the terms planus and cavus lack formal quantitative definitions, an arch score based solely on visual observation is typically noted in the medical report. However, a study has shown that clinicians are inconsistent in their scoring for even the most extreme arch shapes (Cowan et al., 1994). Nevertheless, these clinical terms are viewed as a satisfactory way of communicating clinical and biomechanical presentation. Subtalar Joint In the subtalar joint, three inferior facets of the talus articulate with three superior facets of the calcaneus. However, large individual differences in facet configuration have been reported (Bunning and Barnett, 1965). The orientation of the subtalar joint has been estimated by several researchers with similar results (Manter, 1941; Root et al., 1971; Inman, 1976) (Figure 5). Inman (1976) reported orientations on average 42 and 23 from the sagittal and transverse planes respectively. Given that the joint axis bisects all three anatomical planes, pronation and supination are suitable to describe its tri-planar movements. In pronation, the calcaneus everts, as the head of the talus internally rotates and plantarflexes. The reverse occurs in supination. The medial longitudinal arch lowers in pronation and rises in supination. Consequently, the relative positions of the talar head and calcaneus in the frontal plane has a significant influence on the midtarsal joint. 22

45 Figure 5. The position of the subtalar joint axis in the transverse plane (left) and sagittal plane (right) (Inman, 1976). Midtarsal Joint The function of the midtarsal joint, also known as the transverse tarsal joint, is believed to play a significant role in the foot s ability to transition from a compliant structure to a rigid lever. Changes in the medial longitudinal arch height, and relative motion between the rearfoot and forefoot is thought to occur at the midtarsal joint (Bojsen-Moller, 1979). Motion at the midtarsal joint is attributed to the articulations of the talo-navicular joint and calcaneo-cuboid joint. Movements occurring between the navicular and cuboid are negligible (Elftman, 1960). The resulting midtarsal joint axis is a sum of two distinct axes: the longitudinal axis and the oblique axis (Figure 6). These have been reported by several authors, with some discrepancies in location (Manter, 1941; Hicks, 1953; Elftman, 1960). 23
46 Figure 6. The longitudinal axis (a) and the oblique axis (b) of the midtarsal joint. The orientation of each axis is shown in the sagittal plane (top row) and transverse plane (bottom row) (Manter, 1941). Elftman s work (1960) on the concept of midtarsal joint locking is considered to be pioneering in the field of foot mechanics. Although measurements were not taken, Elftman proposed that midtarsal joint stability was dictated by the relative positioning of the talo-navicular joint axis and the calcaneo-cuboid joint axis. He concluded that in subtalar joint pronation, the two axes are parallel, which offers a higher range of motion at the midtarsal joint. In supination, however, the axes intersect and rotational freedom is reduced. Bojsen-Moller (1979) elaborated on the notion of joint interdependence and range of motion by incorporating the kinematics of the forefoot segment. He found that when the forefoot was neutrally positioned or supinated relative to the rearfoot, the midtarsal joint had a higher degree of rotational freedom. This freedom was attributed to the balland-socket-like configuration of the talo-navicular joint. However, when the forefoot was pronated relative to the rearfoot, rotational freedom was diminished considerably. His study of cadavers indicated that forefoot pronation aligned the highly congruent 24
47 surfaces of the calcaneo-cuboid joint, tightened the surrounding joint ligaments and engaged the plantar fascia. The studies of Elftman (1960) and Bojsen-Moller (1979) highlight the concept that the midtarsal joint plays a key role in the overall stability of the foot during gait. A locked midtarsal joint is believed to be necessary for an effective push-off. An unlocked midtarsal joint is associated with flattening of the medial arch, excess pronation and reduced propulsion at push-off (Bojsen-Moller, 1979). Figure 2 summarizes the rotations that are believed to occur in the rearfoot and forefoot segment of the midtarsal joint during stance phase of gait. The Plantar Fascia The plantar fascia is a dense aponeurotic connective tissue that spans the underside of the foot. The plantar fascia originates at the medial calcaneal tuberosity and extends toward the digits in three distinct bands: medial, central and lateral. Structurally and functionally, the central band is the most dominant of the three (Kwong et al., 1988). At the distal portion of the plantar fascia, there are five tracts that run towards each phalanx. The tracts bifurcate, which results in a complex network. There are superficial tracts that terminate into the skin and there are also deep tracts that attach to the proximal phalanx through the flexor sheath (Sarrafian, 1983) (Figure 7). Studies have shown that the plantar fascia is a significant contributor of passive support to the medial longitudinal arch. Surgical release of plantar fascia has resulted in lowering of the medial arch in patients and in cadavers (Hicks, 1954; Daly et al., 1992; Thordarson et al., 1997; Sharkey et al., 1998). At least two in vitro experiments have 25
.")
48 concluded that the plantar fascia was the most important support structure (Huang et al., 1993; Thordarson et al., 1995). Figure 7. The plantar fascia (Young et al., 2001). The windlass model is the predominant theory on the relationship between the plantar fascia, toe dorsiflexion are medial arch kinematics (Hicks, 1954). In this model, the foot is represented by two rigid beam segments resembling the rearfoot and forefoot (Figure 8). The plantar fascia, metatarsal head and proximal phalanx were modeled as a cable, a windlass drum and a drum handle, respectively. Toe dorsiflexion was likened to cranking the drum handle. This action causes the cable to wind around the drum thereby pulling the end of the beams together. Hicks speculated that a higher arch allowed for a more stable foot, although no data was given to support this claim. Sarrafian (1987) expanded on Hicks idea and specified that the plantar fascia was tensioned when the windlass was engaged, when loaded vertically, or with anterior leg flexion. This phenomenon is functionally significant at push-off, when there is toe extension and the benefits of a stable foot are appropriate. Qualitative kinematics of the 1 st metatarsophalangeal joint (MTPJ) and plantar fascia in the stance phase of gait are summarized in 26
49 Table 2. Figure 8. The windlass mechanism (Hicks, 1954). Hicks (1954) briefly discussed the relationship between the plantar fascia and the rearfoot. He observed rearfoot inversion when the windlass mechanism was engaged. Dynamic walking cadaver models have supported the relationship between the plantar fascia and subtalar joint kinematics. For example, in a study by Ward et al. (2003), partial release of the plantar fascia prevented re-supination of the subtalar joint at pushoff. Table 2. Kinematics of 1 st MTP joint and plantar fascia length in the stance phase of gait (Valmassy, 1995). Arch Height 1 st MTPJ Stance Phase Sagittal Sagittal Early Decreasing Little change Mid Decreasing/Increasing Dorsiflexion begins Late Increasing Dorsiflexion Role of Muscles in Arch Support Anatomy and pathology of the posterior tibialis muscle suggests that it is the most important extrinsic foot muscle that supports the medial arch. The posterior tibialis muscle originates at the superior and posterior aspects of the tibia and fibula, and the interosseous membrane between them. This muscle terminates in a fan-like fashion under the bones that compose the medial arch. Its tendon passes medial to the subtalar joint axis resulting in a long moment arm with respect to the subtalar joint axis. The 27
.")
50 medial longitudinal arch is adversely affected when the tibialis posterior muscle is dysfunctional or ruptured (Funk et al., 1986; Thordarson et al., 1995; Dyal et al., 1997; Sharkey et al., 1998). Figure 9. The tibialis posterior muscle from a posterior view of the leg (Marieb and Hoehn, 2006). Although specific actions have been reported for the various intrinsic foot muscles (Figure 10), their general role is to support the medial arch. Based on fine wire electromyograms, Mann and Inman (1964) concluded that intrinsic foot muscles are activated to achieve a rigid foot at push-off by plantar flexing the forefoot relative to the rearfoot. The importance of stabilizing the medial arch by locking the midtarsal joint was discussed using the terms stability and rigid foot, despite any associated metrics. More recent studies have also shown a significant decrease in medial arch height when 28
51 intrinsic muscles were fatigued (Headlee et al., 2008) and when efferent foot muscle activation was blocked (Fiolkowski et al., 2003). 29


52 a) b) c) d) Figure 10. The plantar layers of the intrinsic muscles of the foot, first layer though fourth (a-d) (Gray, 1918). 30
53 Kinematic Modeling of Foot Motion Three Dimensional Foot Modeling It would be ideal if three dimensional (3D) stereophotogrammetry were used to acquire six degrees of freedom motion for the 28 foot bones. However, technical and ethical obstacles restrict in vivo modeling. Three dimensional analyses require that each bone segment be fixed with three non-collinear markers. This amounts to a marker set of at least 78 pieces. Considering the small size of bones and the magnitude of trauma for the human subject, this is a difficult arrangement (Davis, 2004). Such a lengthy and traumatic setup carries little clinical utility. Moreover, it is challenging to discriminate multiple markers that are in close proximity with the current standard Video Graphics Array (VGA; 640 x 480) resolution. Therefore, there is a prerequisite for higher resolution hardware for more elaborate foot models. Finally, there are challenges in having all markers visible by at least two cameras at a given time. Due to these technical and ethical limitations, it has been common practice in the biomechanical analysis of human locomotion to model the foot as a single rigid segment (White et al., 1989; Areblad et al., 1990; Robertson et al., 2004). This approach has provided much insight in numerous fields, including the study of clinical gait (Vaughan, 1996; Sutherland, 2002), sports biomechanics (Cavanagh, 1987) and motor control (Winter et al., 1990). Purveyors of this method have justified the approach by assuming that the majority of localized motion is attributable to the rearfoot. A major limitation of the single segment foot paradigm is that no insight is gained on mechanics that are intrinsic to the foot. This model is inadequate for characterizing the windlass mechanism, midtarsal joint motion, plantar fasciitis, club foot etc. The 31
54 limitations of the single segment approach have been exposed by several researchers (Lundberg et al., 1989b; Kidder et al., 1996; Leardini et al., 1999; Carson et al., 2001; Simon et al., 2006; Arndt et al., 2007). Rearfoot Motion There is abundant research that has used the single segment model to study rearfoot motion and running. Interest in rearfoot motion and the notion of excessive motion has escalated since the late 1970s (Bates et al., 1978; Taunton et al., 1982; Clarke et al., 1984). At that time, American culture saw a huge rise in the popularity of recreational running and a concomitant rise in running related injuries (James et al., 1978; Taunton et al., 1982). Since the knee has been the most frequently injured body part in runners (Clement et al., 1981; Taunton et al., 2003), much attention was paid to skeletal alignment (James et al., 1978; Tiberio, 1988) and the kinematic coupling relationship of the rearfoot and knee (Hamill et al., 1992; McClay and Manal, 1997). Other topics related to rearfoot motion that have been explored include injury prevention by means of footwear design (Frederick, 1984; Nigg, 1986) and treatment by foot orthoses (Smith et al., 1986; Mundermann et al., 2003; MacLean et al., 2006). Despite a great deal of progress in the study of rearfoot motion, quantitative kinematic analysis of the remaining joints of the foot has not been fully explored. Progress in Multi-Segment Foot Modeling Early contributions in kinematic modeling of the foot were made by Lundberg and colleagues in the 1980s (Lundberg, 1989; Lundberg et al., 1989a; Lundberg et al., 1989b; Lundberg et al., 1989c). Roentgen stereophotogrammetry (RS) was used to capture images of markers that were surgically implanted into foot bones. Individual 32
55 bone movements were interpolated between successive static positions to obtain a sense of how joints interacted. The results from these studies challenged the assumptions of the single rigid segment approach. It was found that many joints, not only the rearfoot segment, participated in frontal and sagittal plane motion. In fact, the magnitude of motion at the midtarsal joint exceeded that of the subtalar joint. Also, it was shown that the position of the ankle joint axis was not static. Unfortunately, the RS method is an invasive technique and therefore its applicability has been limited. With improvements in camera technology, it is increasingly possible to track markers that are close to each other. Marker discrimination has improved with higher resolution cameras (e.g. Qualisys Oqus 3 SVGA Cameras at 1280 x 1024 resolution). Now that it is not uncommon to have a motion capture system with more than six cameras, the issue of marker visibility is no longer universal. Although it is still very difficult to track all 28 bones, foot models have evolved from single segment models into models with multiple functional units. Researchers interested in quantifying kinematics intrinsic to the foot are confronted with the task of proposing an appropriate multisegment foot model (Davis, 2004). In vivo non-invasive multi-segment foot models are currently in their third generation. Since the first model was developed by Kidder et al. (1996), several other multi-segment models have been proposed (Hunt et al., 2001; Simon et al., 2006). Research groups in Bologna and at Oxford University have distinguished themselves in the field since they have each contributed two more models with marked improvements (Leardini et al., 1999; Carson et al., 2001; Stebbins et al., 2006; Leardini et al., 2007). Segment definitions seem to be inspired by clinically-relevant segments. The majority of 33
56 these models define rearfoot, forefoot and hallux segments, while a minority define an additional midfoot segment (Leardini et al., 1999; Simon et al., 2006; Leardini et al., 2007). Marker locations were initially very different between the Bologna and Oxford models. Originally, the Bologna group proposed a daunting marker set that combined rigid cluster markers with anatomical markers (Leardini et al., 1999) (Figure 11). They expressed concerns in a follow-up paper that movements of the rigid clusters may not be representative of the underlying segments (Leardini et al., 2007). However, no data were associated with these concerns. They also admitted that the original marker set was uncomfortable, restricted motion and had a lengthy calibration process. Consequently, rigid cluster markers were abandoned in favor of independent skin markers (Figure 14). The Bologna model is unique in that marker positions avoid the course of tendons, and therefore may reduce movement artefact. The Oxford foot model has since progressed towards independent skin markers. Wand makers at the hallux and heel were used in the original Oxford foot model (Carson et al., 2001). However, it was found that wands were susceptible to movement and toe strike artefact. With the removal of the wands came a reduction in measurement variability at the hallux and heel segments (Stebbins et al., 2006). 34
57 Figure 11. A multi-segment model proposed by the Bologna research group for rearfoot, midfoot, forefoot and hallux segments (Leardini et al., 1999). To date, test-retest experiments by the Oxford group have been the mainstay for multi-segment foot model validation. Kinematic repeatability was examined betweentrial, between-day and between-tester (Carson et al., 2001). Results were favorable with the exception of the hallux segment mentioned previously. The between-trial standard deviations for the rearfoot joint and movements of the forefoot relative to hindfoot were less than 0.7. In addition, kinematic curves between-day and between-tester were similar in shape, but were shifted systematically in absolute magnitude. It was concluded that skin movement artefact was systematic and repeatable, and that absolute differences were due to marker placement variability. Absolute differences could be minimized by normalizing joint angles to a reference such as the standing position (Leardini et al., 1999; Leardini et al., 2007). However, an objective of the Oxford group has been to develop a model that can report joint angles that reflect joint malalignment (e.g. calcaneal varum). As such, the Oxford group has abstained from normalizing to reference angles insisting that normalization would offset the joint angles inappropriately and would therefore reduce the clinical applicability of the model. 35
58 If the gold standard for model validation necessitates invasive bone pin techniques, multi-segment foot models are far from being validated. Only recently has the validity of the traditional knee and foot segments been examined with this level of rigor (Reinschmidt et al., 1997a; Reinschmidt et al., 1997b). These studies have shown that external shoe markers only grossly approximate the movements of the calcaneus. For this reason, researchers have been motivated to place markers directly on the skin surface of the calcaneus (Mundermann et al., 2003; Ferber et al., 2005; MacLean et al., 2006). A comparison of skin and bone markers at the foot has not yet been published. Although segment nomenclature is somewhat similar between a variety of foot models, there are differences in anatomical frame definitions and rotation computations. For example when defining the forefoot anatomical frame, the Oxford model utilizes a virtual marker while the Bologna model utilizes anatomical markers only. In regards to rotation computations, these two models are similar in that Cardan rotations are made. Other models, such as the Heidelberg model, compute projection angles exclusively (Simon et al., 2006). Consequently, comparison of kinematic results across the different models is severely hindered. Results Obtained Using Multi-Segment Models Multi-segment foot models (Carson et al., 2001; Hunt et al., 2001; Leardini et al., 2007; Stebbins et al., 2006) have quantified aspects of the windlass mechanism described by Hicks (1954). Results from these studies agree that there is a rapid increase in medial longitudinal arch height during late stance. However, there are some discrepancies in early stance. Some authors have shown that the arch height is bimodal during stance with lengthening also occurring in early stance (Stebbins et al., 2006; Leardini et al., 2007). 36
59 Other studies did not observe lengthening early in stance (Carson et al., 2001; Hunt et al., 2001). Although rearfoot and forefoot kinematics have been reported using multisegment models (Hunt et al., 2001; Carson et al., 2001; Leardini et al., 2007) some results cannot be compared to fundamental work. Early descriptions of midtarsal joint motion in gait describe the rearfoot and forefoot segments individually relative to the floor, and relative to one another (Bojsen-Moller, 1979). Multi-segment foot models, however, typically report the resultant angle between the forefoot and rearfoot. Therefore, it has not been possible to infer coordination of the individual segments and how they individually contribute to the resultant angle. Plantar Fasciitis Clinical Presentation Plantar fasciitis (synonymous with heel spur/pain syndrome, and subcalcaneal pain), is the most common cause of heel pain (Young et al., 2001). Yearly, more than two million Americans are treated for plantar fasciitis (Pfeffer et al., 1999), and it is estimated that 10% of the population will be affected in their lifetime (Crawford and Thomson, 2003). Plantar fasciitis has been shown to negatively impact several aspects of an individual s life: function in daily living, foot and ankle-related quality-of-life, and function in sport and recreation (Roos et al., 2006). Patients are typically very frustrated with pain and the healing process since their symptoms may last six to 18 months (Young et al., 2001). They report pain in the heel pad and/or into the medial longitudinal arch that is exacerbated with prolonged weightbearing (Taunton et al., 1982; Kwong et al., 1988). A characteristic symptom of more 37
60 advanced plantar fasciitis is knife-like startup pain (Cornwall and McPoil, 1999). This presents when the patient rises onto their feet after a prolonged non-weightbearing state (e.g. getting out of bed in the morning). Management There is no consensus on the most effective treatment for plantar fasciitis (Ross, 2002). In general, the approach is conservative and aims to address pain and mechanical overloading of the fascia. Short term treatment includes: rest, icing, stretching, strengthening of intrinsic foot muscles, oral non-steroidal drugs, ultrasonic therapy, and steroid injection (Cornwall and McPoil, 1999; Ross, 2002). Foot orthoses are used in long term treatment with good patient compliance (Subotnick, 1981; Donatelli, 1987; Kwong et al., 1988). In chronic cases where conservative treatments have failed, a partial plantar fasciotomy may be performed (Cornwall and McPoil, 1999). Aetiology and the Pes Planus Foot The most widely cited aetiological explanation for plantar fasciitis is excessive and/or repetitive loading of the plantar fascia (Warren, 1990; Wearing et al., 2006). It is believed that the level of fascial deterioration ranges from microtears to complete rupture. As with other cumulative micro trauma injuries in its class, this aetiological process is largely speculative, and its development is probably multi-factorial (Cornwall and McPoil, 1999; Wearing et al., 2006). Abnormal mechanics, specifically the pes planus foot and subtalar joint overpronation, is the most cited cause for excessive loading of the plantar fascia (Subotnick, 1981; Taunton et al., 1982; Shama et al., 1983; Donatelli, 1987; Kwong et al., 1988; Warren, 1990; Prichasuk and Subhadrabandhu, 1994). Many reports freely 38
61 interchange the terms pes planus and subtalar joint overpronation even though they are not necessarily equivalent. Nevertheless, it is believed that under vertical load such as in stance, the pes planus foot excessively pronates and subsequently, unlocks the midtarsal joint. In this position, there is forefoot abduction and dorsiflexion resulting in a flatter medial longitudinal arch (Manter, 1941). In accordance with the windlass mechanism, excessive flattening of the arch results in undue tension across the plantar fascia. At push-off of stance, tension is further increased if arch flattening rather than arch rising is combined with simultaneous toe dorsiflexion (Sarrafian, 1983). Despite several anecdotal reports on the association between plantar fasciitis and abnormal mechanics, scientific inquiry has yielded conflicting results. It has been difficult to characterize plantar fasciitis biomechanically. Several studies have found that measures of arch height and rearfoot eversion are not robust variables in discriminating individuals with plantar fasciitis from the unimpaired (Warren, 1984; Messier and Pittala, 1988); Rome et al., 2001). At best, a non-significant trend between the presence of plantar fasciitis and rearfoot eversion has been reported (Messier and Pittala, 1988). In a more recent study of medial longitudinal arch mechanics using digital fluoroscopy, arch height and changes in arch height were not different between plantar fasciitis sufferers and healthy controls (Wearing et al., 2004). External force measurements have also been inconclusive in discriminating plantar fasciitis from unimpaired individuals. Katoh et al. (1983) reported that sufferers exhibited relatively flatter peaks in the vertical ground reaction forces in stance. Others have not supported these findings (Liddle et al., 2000; Wearing et al., 2003), and have suggested instead that ground reaction force differences may be specific to the regions of 39
62 the rearfoot, midfoot and forefoot (Bedi and Love, 1998; Wearing et al., 2003). It is unclear whether static foot measures are related to quantifiable gait kinematics in a healthy population. Some results have supported the relation (Williams et al., 2001), while others have not (Hamill et al., 1989). The relationship between measurable biomechanical variables and plantar fasciitis is still unclear. Dynamical Systems Approach to Coordination Scientists such as Kelso, Turvey and Newell have incorporated the paradigms of dynamical systems for understanding human coordination (Turvey, 1990; Kelso, 1995; Deutsch and Newell, 2004). Kelso views brain function and its expression channeled through coordinated pattern, as a dynamical system (Kelso, 1995). Coordinated patterns emerge and evolve from cooperation and self-organization of elements. Haken et al. (1985) presented a mathematical representation for a bimanual task that supported a dynamical systems approach to coordination. The model considered inphase and anti-phase as the behavioral modes available to the system. It was found that as the frequency of oscillation increased, subjects would exhibit a non-linearity; they spontaneously switched from an anti-phase to an in-phase pattern. Switching was also observed in the solution to their mathematical model for two oscillators. A key finding was the increased variability in the continuous relative phase (CRP) near the transition point. The spontaneous switches were interpreted as the self-organizing process that is characteristic of dynamical systems. Furthermore, the variability (critical fluctuations) was regarded as increasing instability of the current mode and an indication of competition between all available modes (Kelso, 1995). 40
63 Haken et al. (1985) expressed that this model may be directly applied to the study of gait transitions. The intra-limb relative phase variability for the leg and thigh has been examined from a walk to run transition speeds (Diedrich and Warren, Jr., 1995; Seay et al., 2006). However, results are conflicting as to whether there is increased coupling variability at the transition speed. Approach to Pathology In the study of gait and biomechanics, it was generally believed that performance variability is indicative of pathology and motor control deterioration (Heiderscheit, 2000). For example, an elderly patient exhibiting a high step-to-step variability has a greater tendency to fall. The traditional views of variability and pathology have been contested by dynamical systems theorists (Van Emmerik and van Wegen, 2000; Davids et al., 2003). From the perspective of dynamical systems theory, variability and noise are omnipresent - they are functional, required for transitions, and an emergent property of multiple degrees of freedom (Kelso, 1995). Furthermore, it has been proposed that the nature of the behavioral mode should be understood prior to assessing variability so as to have an appropriate point of reference (Van Emmerik and van Wegen, 2000). The dynamical systems point of view on variability has been used in the study of joint kinematics and overuse injuries (Hamill et al., 1999; Heiderscheit et al., 1999; Heiderscheit, 2000). Hamill et al. (1999) speculated that some degree of CRP variability in lower extremity couplings could potentially distribute impact forces across more anatomical structures to reduce repetitive stress upon a localized area. Also, it was speculated that increased variability signified adaptability to the ground perturbations at 41
64 heel strike. In another study by Heiderscheit and colleagues (2000), coupling variability measured by a vector coding technique peaked when joint movements underwent changes in directions. The authors proposed that the increased variability was purposeful for the ensuing transitions. Hamill et al. (1999) observed that subjects experiencing patellofemoral pain exhibited less CRP variability than healthy subjects, suggesting that a reduced CRP variability could indicate reduced adaptability and pathology. The application of dynamical systems concepts to the study of lower extremity injuries is relatively new. Plantar fasciitis has not yet been studied using dynamical systems approaches. Magnetic Resonance Imaging and Biomechanics Magnetic resonance imaging (MRI) is a non-invasive tool that can produce detailed visuals of the anatomy in planes unrestricted in orientation. In comparison to computed tomography, which also offers relatively high resolution images, MRI is thought to be safer because it uses low radio frequency pulses and no ionizing radiation. As such, MRI has become a standard clinical diagnostic tool and its use in biomechanics research is increasing rapidly. Magnetic resonance imaging has provided a means for studying the morphological details of anatomical structures in three dimensions (3D). Prior to the development of modern imaging techniques, morphological estimations have been difficult to perform in vivo. Muscle volumes can be constructed from a series of userdigitized images of known dimensions in a non-invasive manner using MRI. Estimates of muscle physiological cross sectional area (PCSA) have been ascertained when muscle 42
65 volumes are combined with fiber length data and pennation angle (Fukunaga et al., 1992). The ability to acquire cross-sectional images of body segments with MRI has also been useful in studies of muscle atrophy in the diabetic foot (Bus et al., 2002), in aging (Kent- Braun et al., 2000), and in anterior cruciate ligament injury (Binder-Macleod and Buchanan, 2006). The application of MRI to the study of joint kinematics is in its developmental stages. Currently, the approach is considered quasi-static rather than truly dynamic. Movements have been interpolated between successive static positions. Pertaining to the foot, issues regarding methodology and reporting standards have been discussed (Hirsch et al., 1996). Rotations of tarsal joints have been reported in foot pronation and supination (Udupa et al., 1998), but these initial descriptions are not yet palatable for clinical applications (Mattingly et al., 2006). Muscle functional MRI is a variant imaging technique that has been used to quantify skeletal muscle metabolic activity. Following exercise, transverse (T2) weighted images enhances signal intensity in regions of the muscle tissue with increased metabolic activity. Thus, signal intensity and T2 relaxation times increase in accordance with exercise intensity (Fisher et al., 1990; Adams et al., 1992; Saab et al., 2000; Meyer and Prior, 2000; Patten et al., 2003). Muscle functional MRI has been used to study activation of extrinsic foot muscles that are normally difficult to measure with EMG. It has been shown that foot orthoses increased T2 relaxation times in the tibialis posterior (TP) muscle, which indicate improved selective activation of the TP muscle (Kulig et al., 2005). However, wedged footwear did not produce changes in muscle activation in a running protocol despite increased rearfoot eversion (O'Connor and Hamill, 2004). 43
66 Phosphorous Magnetic Resonance Spectroscopy and Muscle Metabolic Activity The direct relationship between external work performed by skeletal muscle and concentrations of inorganic phosphate (Pi) and phosphocreatine (PCr) has been well documented using in vitro animal models (Cain et al., 1962; Infante et al., 1965; Spande and Schottelius, 1970). Phosphorous ( 31 P) magnetic resonance spectroscopy (MRS) allows for the non-invasive quantitation of phosphorus-containing metabolites (i.e. Pi, PCr and ATP) within the muscle at rest, during exercise, and in recovery (Chance et al., 1980; Chance et al., 1985). After a Fourier transformation of the free induction decay, metabolite concentrations can be derived by integrating the peak corresponding to each of the phosphorus-containing metabolites based on the specific resonance frequency. A benefit of using 31 P MRS is the acquisition of real-time changes in intramuscular PCr, Pi and ATP concentrations during the course of an exercise protocol and recovery (Chance et al., 1980; Chance et al., 1985; Kent-Braun et al., 1995; Lanza et al., 2006) (Figure 12). The Pi/PCr ratio can be used as an indicator of muscle work and disease. At rest, skeletal muscle that is diseased and/or damaged (e.g. peripheral vascular disease, chronic muscle necrosis and muscular dystrophy) has exhibited an increased Pi/PCr compared to healthy subjects (McCully et al., 1988; Kent-Braun et al., 1995). Studies of human steady-state wrist flexion using 31 P MRS combined with ergometry, have shown that there is a repeatable linear relationship between the Pi/PCr ratio and work rate (Chance et al., 1985; McCully et al., 1991). Furthermore, various diseased patients exhibited a decline in work rate for a given Pi/PCr ratio compared to healthy subjects during submaximal exercise (Kent-Braun et al., 1995). The effects of chronic plantar fasciitis on the activity of intrinsic foot muscles using Pi/PCr has not been explored. 44
, decline of phosphocreatine (PCr) and stability of adenosine triphosphate (ATP) (Lanza et al., 2006).")
67 Figure 12. A stack plot of 31 P MRS spectra acquired over approximately two minutes for a human performing intermittent maximal contractions of the tibialis anterior. The spectra illustrate the rise in muscular concentrations of inorganic phosphate (Pi), decline of phosphocreatine (PCr) and stability of adenosine triphosphate (ATP) (Lanza et al., 2006). Summary The previous sections showed that there is a lack of fundamental knowledge with regard to the coordination of the skeletal and muscular components of both the normal and pathological foot. The complex musculoskeletal organization of the foot and reporting inconsistencies have made it difficult to isolate key components affecting the structural response of the foot and its subsequent effect on plantar fasciitis. Previous investigations have generally been limited in their ability to effectively characterize intrinsic foot kinematics and muscle activity. Treatments of plantar fasciitis have shown inconsistent results and may be optimized in the future given the potential insights provided in this project. A complete understanding of the biomechanical characteristics of the foot construct would help in developing preventative measures and treatment guidelines for clinicians. 45
68 References Adams, G. R., Duvoisin, M. R., & Dudley, G. A., Magnetic-Resonance-Imaging and electromyography as indexes of muscle function. Journal of Applied Physiology 73, Areblad, M., Nigg, B. M., Ekstrand, J., Olsson, K. O., & Ekstrom, H., Threedimensional measurement of rearfoot motion during running. Journal of Biomechanics 23, Arndt, A., Wolf, P., Liu, A., Nester, C., Stacoff, A., Jones, R., Lundgren, P., & Lundberg, A., Intrinsic foot kinematics measured in vivo during the stance phase of slow running. Journal of Biomechanics 40, Bates, B. T., Osternig, L. R., Mason, B., & James, S. L., Lower extremity function during the support phase of running, in: E. Asmussen & K. Jorgensen, eds. Biomechanics VI-B, University Park, Baltimore, pp Bedi, H. S. & Love, B. R., Differences in impulse distribution in patients with plantar fasciitis. Foot & Ankle International 19, Binder-Macleod, B. I. & Buchanan, T. S., Tibialis anterior volumes and areas in ACL-injured limbs compared with unimpaired. Medicine and Science in Sports and Exercise 38, Bojsen-Moller, F., Calcaneocuboid joint and stability of the longitudinal arch of the foot at high and low gear push off. Journal of Anatomy 129, Bunning, P. S. & Barnett, C. H., A comparison of adult and foetal talocalcaneal articulations. Journal of Anatomy 99, Bus, S. A., Yang, Q. X., Wang, J. H., Smith, M. B., Wunderlich, R., & Cavanagh, P. R., Intrinsic muscle atrophy and toe deformity in the diabetic neuropathic foot: a magnetic resonance imaging study. Diabetes Care 25, Caillet, R.,1996. Foot & Ankle Pain., 3rd edn, F. A. Davis Company, Philadelphia, PA. Cain, D. F., Infante, A. A., & Davies, R. E., Chemistry of muscle contraction. Adenosine triphosphate and phosphorylcreatine as energy supplies for single contractions of working muscle. Nature 196, Carson, M. C., Harrington, M. E., Thompson, N., O'Connor, J. J., & Theologis, T. N., Kinematic analysis of a multi-segment foot model for research and clinical applications: a repeatability analysis. Journal of Biomechanics 34,
69 Cavanagh, P. R., The biomechanics of lower-extremity action in distance running. Foot & Ankle 7, Chance, B., Eleff, S., & Leigh, J. S., Jr., Noninvasive, nondestructive approaches to cell bioenergetics. Proceedings of the National Academy of Sciences of the United States of America 77, Chance, B., Leigh, J. S., Jr., Clark, B. J., Maris, J., Kent, J., Nioka, S., & Smith, D., Control of oxidative metabolism and oxygen delivery in human skeletal muscle: a steady-state analysis of the work/energy cost transfer function. Proceedings of the National Academy of Sciences of the United States of America 82, Clarke, T. E., Frederick, E. C., & Hamill, C. L., The study of rearfoot movement in running, in: E. C. Frederick, ed. Sport Shoes and Playing Surfaces, Human Kinetics Publishers, Inc., Champaign, Illinois, pp Clement, D. B., Taunton, J. E., Smart, G. W., & Nicol, K. L., A survey of overuse running injuries. The Physician and Sportsmedicine 9, Cornwall, M. W. & McPoil, T. G., Plantar fasciitis: etiology and treatment. Journal of Orthopaedic & Sports Physical Therapy. 29, Cowan, D. N., Robinson, J. R., Jones, B. H., Polly, D. W., Jr., & Berrey, B. H., Consistency of visual assessments of arch height among clinicians. Foot & Ankle International 15, Crawford, F. & Thomson, C., Interventions for treating plantar heel pain. Cochrane Database Syst RevCD Daly, P. J., Kitaoka, H. B., & Chao, E. Y., Plantar fasciotomy for intractable plantar fasciitis: clinical results and biomechanical evaluation. Foot & Ankle. 13, Davids, K., Glazier, P., Araujo, D., & Bartlett, R., Movement systems as dynamical systems: the functional role of variability and its implications for sports medicine. Sports Medicine 33, Davis, I. S., How do we accurately measure foot motion? The Journal of Orthopaedic and Sports Physical Therapy 34, Deutsch, K. M. & Newell, K. M., Intra-limb segmental influences on random-like movements in humans. Neuroscience letters 367, Diedrich, F. J. & Warren, W. H., Jr., Why change gaits? Dynamics of the walk-run transition. Journal of experimental psychology. Human perception and performance 21,
70 Donatelli, R., Abnormal biomechanics of the foot and ankle. Journal of Orthopaedic & Sports Physical Therapy. 9, Dyal, C. M., Feder, J., Deland, J. T., & Thompson, F. M., Pes planus in patients with posterior tibial tendon insufficiency: asymptomatic versus symptomatic foot. Foot & Ankle International 18, Elftman, H., The transverse tarsal joint and its control. Clinical Orthopaedics 16, Ferber, R., Davis, I. M., & Williams, D. S., III, Effect of foot orthotics on rearfoot and tibia joint coupling patterns and variability. Journal of Biomechanics 38, Fiolkowski, P., Brunt, D., Bishop, M., Woo, R., & Horodyski, M., Intrinsic pedal musculature support of the medial longitudinal arch: an electromyography study. The Journal of Foot and Ankle Surgery 42, Fisher, M. J., Meyer, R. A., Adams, G. R., Foley, J. M., & Potchen, E. J., Direct relationship between proton T2 and exercise intensity in skeletal muscle MR images. Investigative Radiology 25, Franco, A. H., Pes cavus and pes planus. Analyses and treatment. Physical Therapy 67, Frederick, E. C. (ed.) Sport Shoes and Playing Surfaces: Their Biomechanical Properties. Human Kinetics Publishers, Champaign, Illinois. Fukunaga, T., Roy, R. R., Shellock, F. G., Hodgson, J. A., Day, M. K., Lee, P. L., Kwong-Fu, H., & Edgerton, V. R., Physiological cross-sectional area of human leg muscles based on magnetic resonance imaging. Journal of Orthopaedic Research 10, Funk, D. A., Cass, J. R., & Johnson, K. A., Acquired adult flat foot secondary to posterior tibial-tendon pathology. The Journal of Bone and Joint Surgery. American Volume 68, Gray, H Anatomy of the human body. 20 edn, Lewis, W. H. (ed.), Lea & Febiger, Philadelphia. Haken, H., Kelso, J. A., & Bunz, H., A theoretical model of phase transitions in human hand movements. Biological Cybernetics 51,
71 Hamill, J., Bates, B. T., & Holt, K. G., Timing of lower extremity joint actions during treadmill running. Medicine and Science in Sports and Exercise 24, Hamill, J., Bates, B. T., Knutzen, K. M., & Kirkpatrick, G. M., Relationship between selected static and dynamic lower extremity measures. Clinical Biomechanics 4, Hamill, J., Van Emmerik, R. E., Heiderscheit, B. C., & Li, L., A dynamical systems approach to lower extremity running injuries. Clinical Biomechanics 14, Headlee, D. L., Leonard, J. L., Hart, J. M., Ingersoll, C. D., & Hertel, J., Fatigue of the plantar intrinsic foot muscles increases navicular drop. Journal of Electromyography and Kinesiology 18, Heiderscheit, B. C., Movement variability as a clinical measure for locomotion. Journal of Applied Biomechanics 16, Heiderscheit, B. C., Hamill, J., & Van Emmerik, R. E., Q-angle influences on the variability of lower extremity coordination during running. Medicine and Science in Sports and Exercise 31, Hicks, J. H., The mechanics of the foot I. The joints. Journal of Anatomy 87, Hicks, J. H., The mechanics of the foot II. The plantar aponeurosis and the arch. Journal of Anatomy 88, Hirsch, B. E., Udupa, J. K., & Samarasekera, S., New method of studying joint kinematics from three-dimensional reconstructions of MRI data. Journal of the American Podiatric Medical Association 86, Huang, C. K., Kitaoka, H. B., An, K. N., & Chao, E. Y., Biomechanical evaluation of longitudinal arch stability. Foot & Ankle. 14, Hunt, A. E., Smith, R. M., Torode, M., & Keenan, A. M., Inter-segment foot motion and ground reaction forces over the stance phase of walking. Clinical Biomechanics 16, Infante, A. A., Klaupiks, D., & Davies, R. E., Phosphorylcreatine consumption during single-working contractions of isolated muscle. Biochimica et Biophysica Acta 94, Inman, V. T.,1976. The joints of the ankle. The Williams & Wilkins Co., Baltimore, MD. 49
72 James, S. L., Bates, B. T., & Osternig, L. R., Injuries to runners. American Journal of Sports Medicine 6, Katoh, Y., Chao, E. Y., Morrey, B. F., & Laughman, R. K., Objective technique for evaluating painful heel syndrome and its treatment. Foot & Ankle. 3, Kelso, J. A. S.,1995. Dynamic Patterns - The Self-Organization of Brain and Behavior MIT Press, Cambridge, MA. Kent-Braun, J. A., Miller, R. G., & Weiner, M. W., Human skeletal muscle metabolism in health and disease: utility of magnetic resonance spectroscopy. Exercise and Sport Sciences Reviews. 23, Kent-Braun, J. A., Ng, A. V., & Young, K., Skeletal muscle contractile and noncontractile components in young and older women and men. Journal of Applied Physiology 88, Kidder, S. M., Abuzzahab, F. S., Jr., Harris, G. F., & Johnson, J. E., A system for the analysis of foot and ankle kinematics during gait. IEEE Transactions on Rehabilitation Engineering 4, Kulig, K., Burnfield, J. M., Reischl, S., Requejo, S. M., Blanco, C. E., & Thordarson, D. B., Effect of foot orthoses on tibialis posterior activation in persons with pes planus. Medicine and Science in Sports and Exercise37, Kwong, P. K., Kay, D., Voner, R. T., & White, M. W., Plantar Fasciitis - Mechanics and Pathomechanics of Treatment. Clinics in Sports Medicine. 7, Lanza, I. R., Wigmore, D. M., Befroy, D. E., & Kent-Braun, J. A., In vivo ATP production during free-flow and ischaemic muscle contractions in humans. Journal of physiology 577, Leardini, A., Benedetti, M. G., Berti, L., Bettinelli, D., Nativo, R., & Giannini, S., Rear-foot, mid-foot and fore-foot motion during the stance phase of gait. Gait & Posture 25, Leardini, A., Benedetti, M. G., Catani, F., Simoncini, L., & Giannini, S., An anatomically based protocol for the description of foot segment kinematics during gait. Clinical Biomechanics 14, Liddle, D., Rome, K., & Howe, T., Vertical ground reaction forces in patients with unilateral plantar heel pain - a pilot study. Gait & Posture 11, Lundberg, A., Kinematics of the ankle and foot invivo roentgen stereophotogrammetry - introduction. Acta Orthopaedica Scandinavica. 60,
73 Lundberg, A., Goldie, I., Kalin, B., & Selvik, G., 1989a. Kinematics of the ankle/foot complex: plantarflexion and dorsiflexion. Foot & Ankle. 9, Lundberg, A., Svensson, O. K., Bylund, C., Goldie, I., & Selvik, G., 1989b. Kinematics of the ankle/foot complex--part 2: Pronation and supination. Foot & Ankle. 9, Lundberg, A., Svensson, O. K., Bylund, C., & Selvik, G., 1989c. Kinematics of the ankle/foot complex--part 3: Influence of leg rotation. Foot & Ankle. 9, MacLean, C., Davis, I. M., & Hamill, J., Influence of a custom foot orthotic intervention on lower extremity dynamics in healthy runners. Clinical Biomechanics 21, Manter, J. T., Movements of the subtalar and transverse tarsal joints. Anatomical Record. 80, Marieb, E. N. & Hoehn, K., Marieb Media Manager - Human Anatomy & Physiology., 7th edn, Benjamin Cummings, San Francisco, CA. Mattingly, B., Talwalkar, V., Tylkowski, C., Stevens, D. B., Hardy, P. A., & Pienkowski, D., Three-dimensional in vivo motion of adult hind foot bones. Journal of Biomechanics 39, McClay, I. & Manal, K., Coupling parameters in runners with normal and excessive pronation. Journal of Applied Biomechanics 13, McCully, K. K., Argov, Z., Boden, B. P., Brown, R. L., Bank, W. J., & Chance, B., Detection of muscle injury in humans with 31-P magnetic resonance spectroscopy. Muscle Nerve. 11, McCully, K. K., Kakihira, H., Vandenborne, K., & Kent-Braun, J., Noninvasive measurements of activity-induced changes in muscle metabolism. Journal of Biomechanics 24 Suppl 1, Messier, S. P. & Pittala, K. A., Etiologic factors associated with selected running injuries. Medicine and Science in Sports and Exercise 20, Meyer, R. A. & Prior, B. M., Functional magnetic resonance imaging of muscle. Exercise and Sport Sciences Reviews 28, Mundermann, A., Nigg, B. M., Humble, R. N., & Stefanyshyn, D. J., Foot orthotics affect lower extremity kinematics and kinetics during running. Clinical Biomechanics 18,
74 Nigg, B. M. (ed.) Biomechanics of running shoes. Human Kinetics Publishers, Champaign, Illinois. O'Connor, K. M. & Hamill, J., The role of selected extrinsic foot muscles during running. Clinical Biomechanics 19, Patten, C., Meyer, R. A., & Fleckenstein, J. L., T2 mapping of muscle. Seminars in musculoskeletal radiology 7, Pfeffer, G., Bacchetti, P., Deland, J., Lewis, A., Anderson, R., Davis, W., Alvarez, R., Brodsky, J., Cooper, P., Frey, C., Herrick, R., Myerson, M., Sammarco, J., Janecki, C., Ross, S., Bowman, M., & Smith, R., Comparison of custom and prefabricated orthoses in the initial treatment of proximal plantar fasciitis. Foot & Ankle International 20, Prichasuk, S. & Subhadrabandhu, T., The relationship of pes planus and calcaneal spur to plantar heel pain. Clinical Orthopaedics and Related Research Reinschmidt, C., van den Bogert, A. J., Lundberg, A., Nigg, B. M., Murphy, N., Stacoff, A., & Stano, A., 1997a. Tibiofemoral and tibiocalcaneal motion during walking: external vs. skeletal markers. Gait & Posture. 62, Reinschmidt, C., vandenbogert, A. J., Murphy, N., Lundberg, A., & Nigg, B. M., 1997b. Tibiocalcaneal motion during running, measured with external and bone markers. Clinical Biomechanics 12, Robertson, D. G. E., Caldwell, G. E., Hamill, J., Kamen, G., & Whittlesey, S. N., Research methods in biomechanics Human Kinetics, Champaign, IL. Rome, K., Howe, T., & Haslock, I., Risk factors associated with the development of plantar heel pain in athletes. The Foot 11, Roos, E., Engstrom, M., & Soderberg, B., Foot orthoses for the treatment of plantar fasciitis. Foot & Ankle International 27, Root, M. L., Orien, W. P., Weed, J. H., & Hughes, R. J.,1971. Biomechanical Examination of the Foot. Clinical Biomechanics Corp., Los Angeles, CA. Ross, M., Use of the tissue stress model as a paradigm for developing an examination and management plan for a patient with plantar fasciitis. Journal of the American Podiatric Medical Association 92, Saab, G., Thompson, R. T., & Marsh, G. D., Effects of exercise on muscle transverse relaxation determined by MR imaging and in vivo relaxometry. Journal of Applied Physiology 88,
75 Sarrafian, S. K., Anatomy of the Foot and Ankle. Descriptive, Topographic, Functional., 2nd edn, J.B. Lippincott Co., Philadelphia, PA. Sarrafian, S. K., Functional characteristics of the foot and plantar aponeurosis under tibiotalar loading. Foot & Ankle. 8, Seay, J. F., Haddad, J. M., Van Emmerik, R. E., & Hamill, J., Coordination variability around the walk to run transition during human locomotion. Motor Control. 10, Shama, S. S., Kominsky, S. J., & Lemont, H., Prevalence of non-painful heel spur and its relation to postural foot position. Journal of the American Podiatry Association 73, Sharkey, N. A., Ferris, L., & Donahue, S. W., Biomechanical consequences of plantar fascial release or rupture during gait: part I--disruptions in longitudinal arch conformation. Foot & Ankle International 19, Simon, J., Doederlein, L., McIntosh, A. S., Metaxiotis, D., Bock, H. G., & Wolf, S. I., The Heidelberg foot measurement method: Development, description and assessment. Gait & Posture. 23, Smith, L. S., Clarke, T. E., Hamill, C. L., & Santopietro, F., The effects of soft and semi-rigid orthoses upon rearfoot movement in running. Journal of the American Podiatric Medical Association 76, Spande, J. I. & Schottelius, B. A., Chemical basis of fatigue in isolated mouse soleus muscle. The American Journal of Physiology 219, Stebbins, J., Harrington, M., Thompson, N., Zavatsky, A., & Theologis, T., Repeatability of a model for measuring multi-segment foot kinematics in children. Gait & Posture. 23, Subotnick, S. I., The cavus foot. The Physician and Sportsmedicine. 8, Subotnick, S. I., The flat foot. The Physician and Sportsmedicine. 9, Sutherland, D. H., The evolution of clinical gait analysis - Part II - Kinematics. Gait & Posture. 16, Taunton, J. E., Clement, D. B., & McNicol, K., Plantar fasciitis in runners. Canadian Journal of Applied Sport Sciences 7, Taunton, J. E., Ryan, M. B., Clement, D. B., McKenzie, D. C., Lloyd-Smith, D. R., & Zumbo, B. D., A prospective study of running injuries: the Vancouver Sun Run "In Training" clinics. British Journal of Sports Medicine 37,
76 Thordarson, D. B., Kumar, P. J., Hedman, T. P., & Ebramzadeh, E., Effect of partial versus complete plantar fasciotomy on the windlass mechanism. Foot & Ankle International 18, Thordarson, D. B., Schmotzer, H., Chon, J., & Peters, J., Dynamic support of the human longitudinal arch. A biomechanical evaluation. Clinical Orthopaedics and Related Research 316, Tiberio, D., Pathomechanics of structural foot deformities. Physical Therapy 68, Turvey, M. T., Coordination. American Psychologist. 45, Udupa, J. K., Hirsch, B. E., Hillstrom, H. J., Bauer, G. R., & Kneeland, J. B., Analysis of in vivo 3-D internal kinematics of the joints of the foot. IEEE Trans Biomed Eng. 45, Valmassy, R. L.,1995. Clinical Biomechanics of the Lower Extremities. Mosby Inc., St. Louis. Van Emmerik, R. E. A. & van Wegen, E. E. H., On variability and stability in human movement. Journal of Applied Biomechanics. 16, Vaughan, C. L., Are joint torques the Holy Grail of human gait analysis? Human Movement Science 15, Ward, E. D., Smith, K. M., Cocheba, J. R., Patterson, P. E., & Phillips, R. D., William J. Stickel Gold Award. In vivo forces in the plantar fascia during the stance phase of gait: sequential release of the plantar fascia. Journal of the American Podiatric Medical Association 93, Warren, B. L., Anatomical factors associated with predicting plantar fasciitis in long-distance runners. Medicine and Science in Sports and Exercise 16, Warren, B. L., Plantar fasciitis in runners. Treatment and prevention. Sports Medicine 10, Wearing, S. C., Smeathers, J. E., & Urry, S. R., The effect of plantar fasciitis on vertical foot-ground reaction force. Clinical Orthopaedics and Related Research Wearing, S. C., Smeathers, J. E., Urry, S. R., Hennig, E. M., & Hills, A. P., The pathomechanics of plantar fasciitis. Sports Medicine 36,
77 Wearing, S. C., Smeathers, J. E., Yates, B., Sullivan, P. M., Urry, S. R., & Dubois, P., Sagittal movement of the medial longitudinal arch is unchanged in plantar fasciitis. Medicine and Science in Sports and Exercise 36, White, S. C., Yack, H. J., & Winter, D. A., A three-dimensional musculoskeletal model for gait analysis. Anatomical variability estimates. Journal of Biomechanics 22, Williams, D. S., McClay, I. S., Hamill, J., & Buchanan, T. S., Lower extremity kinematic and kinetic differences in runners with high and low arches. Journal of Applied Biomechanics 17, Winter, D. A., Patla, A. E., & Frank, J. S., Assessment of balance control in humans. Medical Progress Through Technology. 16, Young, C. C., Rutherford, D. S., & Niedfeldt, M. W., Treatment of plantar fasciitis. American family physician 63,
78 CHAPTER III PROPOSED METHODOLOGY General Introduction The goal of this dissertation was to characterize chronic plantar fasciitis in regards to biomechanics, size of muscles, and bioenergetics. This chapter contains the methodologies that were proposed to accomplish this goal. Ultimately, some methodological changes were made in the final outcome of this dissertation. The final version of methodologies is presented in subsequent chapters. Part I Biomechanics Introduction The traditional link-segment model used for gait analysis assumes that the foot is a single rigid segment (Robertson et al., 2004). This model s inability to solve for kinematic solutions within the foot has been exposed (Lundberg et al., 1989b; Kidder et al., 1996; Leardini et al., 1999; Carson et al., 2001; Simon et al., 2006). A multi-segment foot model can be used to group bones into functional subunits to study intrinsic foot kinematics (Leardini et al., 2007). Kinematic models for quantitative biomechanical analysis are typically computed using a distal-to-proximal segment Cardan convention. A limitation of this convention is that individual segment kinematics cannot be determined. We have proposed to examine foot segment coordination using vector coding which provides kinematic information for the individual segments and their phase relationship (Chang et al., 2007). This application of vector coding has provided conducive for interpreting rearfoot-forefoot movements in a manner that is more similar to previous descriptions (Hicks, 1954; 56
79 Bojsen-Moller, 1979). Also, the addition of phase information might provide insight to plantar fascia deformations, and therefore an injury mechanism. For example, rearfoot eversion countered by forefoot inversion, an anti-phase movement, may indicate twisting along the long axis of the plantar fascia. The purpose of this study is to determine whether there are differences in the intersegmental kinematics and phase coordination using a multi-segment foot model between healthy and a pes planus chronic plantar fasciitis foot. Subjects Rearfoot motion data from the literature (Hamill et al., 1992; McClay and Manal, 1997; Chang et al., 2007) were used to estimate sample size for independent and dependent T-tests (α = 0.05, β = 0.80). Using statistical software (Primer of Biostatistics version 3.01, McGraw-Hill, 1992), it was determined that a minimum of 17 subjects per group was sufficient. Table 3. Estimates of sample size for t-tests (α = 0.05, β = 0.80) of EV max based on mean differences to be detected and standard deviations (sd) from the literature (Hamill et al., 1992; McClay and Manal, 1997; Chang et al., 2007). Difference of Expected sd Sample T-Test Means ( ) within group ( ) Size Independent Independent Dependent The plantar fasciitis group (PF) will be composed of 17 individuals having a pes planus foot type and chronic unilateral plantar fasciitis. Subjects must be 30 to 55 years of age. Symptoms must be persistent at minimum the three months leading up to the study. There will be no upper time limit for symptoms. Subjects must have pain upon 57
80 palpation of the plantar fascia and have had first step pain at least five times. Subjects must not have had a local steroid injection within the last 2 months. Other than steroid injection, individuals will be included whether or not they have sought home or professional care (e.g., ice, rest, heel cups, orthotics, and physical therapy). Individuals presenting with secondary injuries associated with the pes planus foot (e.g., Achilles tendonitis, patellofemoral pain, metatarsalgia, tibialis posterior pain, and hallux valgus pain) may be included with discretion. Secondary injuries must be perceived by the individual to be inferior in symptoms and interference of daily activities than the plantar fasciitis symptoms. We chose to define a pes planus foot as one with a medial longitudinal arch ratio that is more than 1.5 standard deviations below the reported norm (< ) (Williams and McClay, 2000). It has been shown that an arch ratio based on dorsum foot height and truncated foot length at 90% of weight bearing is a valid and reliable measure of arch height (Williams and McClay, 2000). Exclusion criteria will be based on self-report and will include: arthritis, neurological disorders, myopathies, local cardiovascular disorder, local infections and tumors, pregnancy and a body mass index (BMI) greater than 30. A control group (CON) of 17 healthy age-, weight- and gender-matched individuals will be used. These subjects will have arch ratios that are within one standard deviation from the norm (range: ). They will have no history of plantar fasciitis or any musculoskeletal injury in the last year that would affect their gait. They will meet the exclusion criteria as did the PF group and considered healthy as per a modified Physical Activity Readiness Questionnaire (PAR-Q). 58
81 To quantify each subject s foot health-related function, the revised Foot Function Index (FFI-R) will be completed (Budiman-Mak et al., 2006). The FFI-R is a self-report questionnaire consisting of 34 unique visual analog scales that measures issues related to pain, stiffness, disability, activity limitation, and psychosocial stress. The questionnaire is a result of revisions addressing the limitations of the widely used Foot Function Index (FFI) (Budiman-Mak et al., 1991). Study methods will be approved by the university IRB and subject consent documented. Experimental Set-Up Kinematic and kinetic data will be collected using a 3D movement analysis system (Qualisys Medical AB, Gothenburg, Sweden) and force plate (Advanced Mechanical Technologies, Inc., Watertown, MA, USA) that are operated by a microcomputer. Eight high-speed infrared cameras (Oqus 3) will be set up in a circular fashion around a walkway with the force plate at the centre (Figure 13). The analog force plate signal will be amplified then converted to a digital signal (PCI-DAS6402/16, Measurement Computing Corp., Norton, MA, USA,). An orthogonal global coordinate system will be used: X (medio-lateral), Y (antero-postero) and Z (vertical axis). The movement analysis system will be calibrated by wand and L-frame with a non-linear transformation. Two photo gates located at the opposite ends of the walkway will start and stop a timer when triggered by a passer-by. 59
. The axes and position of the global coordinate system are shown.")
82 Figure 13. Apparatus configuration for kinematic and kinetic data collection. A personal computer (PC) operates eight cameras and a force platform. Two photo gates are setup near the start and end of the walkway (shaded). The axes and position of the global coordinate system are shown. Kinematic Model Multi-Segment Foot Model The non-invasive multi-segment foot model proposed by Leardini et al. (2007) will be implemented to acquire 3D movements of the rearfoot (tarsus), forefoot (metatarsus), and planar motions of the big toe (hallux) and medial arch angle (Figure 14). This model was chosen over other multi-segment foot models (e.g. Leardini et al., 1999; Carson et al., 2001; Simon et al., 2006) because: 1) recommended marker positions minimize skin movement artefact by avoiding the path of tendons, 2) external wands or fixtures are not used in this model, 3) special calibration devices are not needed, and 4) segments are clinically relevant. Model construction is described in detail elsewhere 60
83 (Leardini et al., 2007), therefore an overview of segment definitions and marker placement is provided. Note that the mid-foot segment will not be examined here. Figure 14. Segment definitions and marker positions for the multi-segment foot model (Leardini et al., 2007). 61
84 Table 4. Segment and marker configurations. Rearfoot Segment Type: 3D CA: Achilles tendon attachment. PT: Peroneal tubercle. ST: Sustentaculum tali. IC: Virtual marker at the mid point between ST and PT. Origin: CA. Tracking Markers: CA, PT, ST Forefoot Segment Type: 3D FMB: Dorso-medial aspect of the base of the first metatarsal. FMH: Dorso-medial aspect of first metatarsophalangeal head. SMB Dorso-medial aspect of the base of the second metatarsal. SMH Dorso-medial aspect of the second metatarsophalangeal head. VMB Dorso-lateral aspect of the fifth metatarso-cuboid base. VMH Dorso-lateral aspect of the fifth metatarsophalangeal head. Origin: SMB Tracking Markers: FMB, FMH, SMB, SMH, VMB and VMH. Hallux Segment Type: Line 2D PM: Most distal and dorsal point of the head of the proximal phalanx of the hallux. FMH: Dorso-medial aspect of first metatarsophalangeal head. Tracking Markers: PM and FMH. First Metatarsal Segment Type: Line 2D FMB: Dorso-medial aspect of the base of the first metatarsal. FMH: Dorso-medial aspect of first metatarsophalangeal head. Figure 15. Planar angles as defined by line segments of the medial longitudinal arch (MLA) and first metatarso-phalangeal joint (FMTPJ). 62
85 Leg Segment The leg segment will be defined using four anatomical calibration markers: lateral femoral epicondyle, medial femoral epicondyle, lateral malleolus and medial malleolus. Four markers mounted on a rigid plate will be located at the distal lateral leg to track the shank (Manal et al., 2000). Protocol After signing an informed consent, retroreflective markers (diameter 8.0 mm) will be placed on the right leg and foot according to the kinematic model. One tester will position markers for all subjects to reduce the variability of marker placement (Della Croce et al., 1999). Subjects will perform standing calibration and walking trials. Kinematic and kinetic data will be synchronized and collected at 400 Hz and 2000 Hz respectively (Qualisys Track Manager, Qualisys Medical A B, Gothenburg, Sweden). In calibration trials, subjects are to stand quietly with feet, hips and torso in line with the Y axis of the global coordinate system. Leg calibration markers will be removed after calibration trials. In walking trials, subjects will walk across the walkway at a constant speed (1.35 ms -1 ±5%). Time elapsed and walking speed will be assessed by the timer. Ample number of trials (> 15) will be saved for digitization because it is anticipated that some motion captures files may not have a complete marker set. Data Reduction Marker positions for a calibration trial and ten stance periods will be digitized and their locations reconstructed in 3D for each subject (Qualisys Track Manager, Qualisys 63
86 Medical AB, Gothenburg, Sweden). These data will be exported in C3D file format for analysis. Data will be processed in Visual 3D TM software (C-Motion, Inc., Rockville, MD, USA). A fourth-order low-pass Butterworth filter will smooth marker histories. Segment and joint kinematics will be computed allowing six degrees of freedom. All joint and segment angles will be distal relative to proximal and decomposed using a Cardan Xyz sequence (Cole et al., 1993). Joint angles will be normalized to positions in the standing trial and time normalized to 100% stance. To limit the potential of masking differences by averaging over 100% stance (AS), three sub-phases will be considered: early stance (ES; 1-33%), midstance (MS; 34-66%) and late stance (LS; 67-99%). Kinematic Measures Rearfoot joint kinematics (RF jt ) will be reported as the rearfoot relative to the leg. Rearfoot motion kinematic variables of interest include: inversion angle at touchdown (Inv TD ), maximum eversion angle (EV max ) and total rearfoot inversion-eversion excursion (EV tot ) ((Bates et al., 1978); (Hamill et al., 1992); (McClay and Manal, 1998)). The excursion of the forefoot relative to the rearfoot (minimum-maximum) will also be reported (FF:RF) in each anatomical plane. Line segments will be used to calculate 2D kinematics (Figure 15). The first metatarso-phalangeal joint angle (FMTPJ) is the angle of the hallux relative to the first metatarsal line segment. The medial longitudinal arch angle (MLA) is as the line projected from CA to ST relative to ST to FMH. 64
87 Table 5. Summary of rotational references for model variables. Variable RF jt FF:RF RF seg FF seg Rotational Reference Rearfoot segment relative to shank. Forefoot segment relative to the rearfoot segment. Rearfoot segment relative to global coordinate system. Forefoot segment relative to global coordinate system Coordination Measures A vector coding method will be used (Sparrow et al., 1987; Hamill et al., 2000; Heiderscheit et al., 2002) and coordination will be classified according to the coupling angle (Chang et al., 2007). The coordination of two couplings will be examined: 1) rearfoot - forefoot couple, and 2) MLA-FMTPJ couple (windlass mechanism). Coordination measures will be based on segment angles of the rearfoot (RF seg ), forefoot (FF seg ) and the planar angles MLA and FMTPJ. Segment rotations will be computed relative to the global coordinate system. Angle-angle diagrams will be constructed with the distal segment relative to proximal segment, and a right-hand positive convention. For example, in the rearfoot-forefoot coupling, inversion will be considered positive (Figure 16). The coupling angle γ, that is, the angle subtended from a vector adjoining two successive time points (i) to the right horizontal, is calculated: tan i 1 y i 1 y i x i 1 x i where 0 γ 360 and i is a percent stance. The value of the coupling angle in degrees (or radians), can provide insight as to how two joints are coordinated (Figure 16) (Sparrow et al., 1987; Hamill et al., 2000; Heiderscheit et al., 2002). Phase angles that lie along the positive diagonal, 45 and 225, indicate that both segments are rotating in the same direction in a given plane. 65
88 Therefore, the couple is in phase (e.g. rearfoot eversion and concurrent forefoot eversion). Anti-phase coordination, on the other hand is indicated by coupling angles that lie along the negative diagonal, 135 and 315. In this circumstance, segments are rotating in opposite directions (e.g. rearfoot eversion countered by forefoot inversion). Additionally, two other types of coordination may be inferred using the phase angle. Coupling angles that lie on the vertical (90 and 270 ) or horizontal axis (0, 180 and 360 ) indicate that one segment is changing while the other is not. Phase angles along the horizontal indicate that movements occurred in the proximal segment but not in the distal. Conversely, 90 and 270 indicate distal segment rotations only. Due to the redundancy of movement categories in quadrants that are diagonal to one another, we can constrain the coupling angles to the top two quadrants by subtracting 180 from phase angles greater than 180: 180 where γ i > 180 i i 66
89 Figure 16. An angle-angle diagram of rearfoot-forefoot movement in the frontal plane. The data are overlaid with a polar plot to illustrate coordination types: in-phase, anti-phase, rearfoot and forefoot). The box on the left presents an expanded view of the data points of three coupling angles (γ). Phase coordination will be categorized based on the coupling angle. Four types of coordination will be considered: 1) Anti-phase (ANTI); 2) in-phase (IN); 3) a leading proximal segment (PROX); 4) a leading distal segment (DIST). Each type of coordination will have a 45 bin size for categorization (Table 6). Table 6. Coordination categorization scheme for coupling angles Phase Coordination Coupling Angle Boundaries Anti-Phase < γ In-Phase 22.5 < γ < 67.5 Proximal Segment < γ or, γ 22.5 Distal Segment 67.5 < γ
90 Coordinative variability will be quantified by the standard deviation in γ at i. Since γ is directional (oscillates between 0 and 360 ), circular statistics are necessary. First, the mean x and y components at time i are calculated. x y i i 1 n 1 n n i 1 n i 1 cos sin i i The mean coupling angle ( ) at i is then calculated. 1 y i i tan, if y i 0 x i 1 y i i 180 tan, if y 0 x i The length of the mean vector ( r i ) is derived from the mean x and y components. The deviation of r i from unity indicates the directional concentration of i. r i 2 2 i ( x y ) 0 < r 1 i The standard deviation (s 2 ) of i provides a measure of variability. s 2 is a transformation of the mean vector into a variance score in degree units (Batschelet, 1981). s 2 i 2(1 r i )
91 Statistical Analysis Kinematic Measures Inv TD, EV max, EV tot will be averaged for within a subject and by group. Dependent and independent T-tests (α=0.05) of the group means will be used to determine kinematic differences between PF A and PF U, and PF A and CON respectively. Coordination Measures Occurrence frequency for a coordination type will be noted for each stance and averaged within each subject. Group (PF and CON) means by movements (ANTI, IN, DIST and PROX) for a given phase of stance (ES, MS, LS) will computed. Independent T-tests (α=0.05) of the means will be used to determine differences in coordination type between PF A and CON during early stance, midstance, and late stance. Coordinative variability will be averaged for a stance phase of interest (AS, ES, MS and LS). Independent T-tests (α=0.05) will be used to determine whether there are differences in mean coordination variability between PF A and CON during those phases. Part II Atrophy Introduction It is possible that atrophy occurs during the course of chronic plantar fasciitis as an individual s activity is curtailed. The burden of chronic heel pain has shown to negatively impact function in daily living, function in sport and recreation, and foot and quality-of-life (Roos et al., 2006). Intrinsic foot muscles and the posterior tibialis muscle are believed to play an important role in providing support to the medial longitudinal arch (Mann and Inman, 1964; Fiolkowski et al., 2003; Headlee et al., 2007). A reduced participation by these muscles could prolong the healing process by putting added stress 69
92 onto the already compromised plantar fascia. The purpose of this study is to determine whether pes planus chronic plantar fasciitis is accompanied by atrophy of foot muscles. Subjects Plantar fasciitis and CON subjects described in Study 1 will be studied. Muscle CSA data from Kent-Braun et al. (2000) were used to estimate sample size for T-tests (α = 0.05, β = 0.80). Six subjects per group will be recruited (Primer of Biostatistics version 3.01, McGraw-Hill, 1992). Table 7. Sample size estimations for t-tests (α = 0.05, β = 0.80) of muscle CSA. Mean differences and the expected standard deviations (sd) based on (Kent- Braun et al. 2000). Difference of Expected sd Sample T-Test Means (cm 2 ) within group (cm 2 ) Size Independent Dependent Experimental Set-up We will use a 1.5 Tesla Signa Excite (GE Medical Systems, Milwaukee, WI) MR system and a quad-knee volume coil for the foot. Protocol Axial images of the foot and leg will be taken bilaterally using magnetic resonance imaging. Subjects will lie on the bed and a bird-cage coil will be secured to the foot. The coil will aid in positioning the ankle at 90 to reduce movement artefacts. Scout images will be used to guide the foot and leg to the magnet isocenter. A spin-echo sequence will be used to capture T1 weighted images (TR=550ms, TE=9 ms; matrix=512x 512). DICOM image files will be saved onto transportable media for analysis. 70
93 Data Reduction Custom software (Hasson, Caldwell, Foulis and Kent-Braun) written in Matlab (Mathworks Inc., Natick, USA) will be used to determine muscle CSA for MR images. Muscle cross sectional areas can be grossly approximated by summing all pixels within a carefully digitized muscle contour. However, this may be an over approximation of muscle content since non-contractile tissues, such as fascia and fat, are contained within the perimeter of muscle. A better approximation of muscle area within a contour is obtained by differentiating muscle pixels according to pixel intensity (Kent-Braun et al., 2000). Due to the magnetic gradient along the long axis of the bore, signal and pixel intensity will also be graded across a series of images. Therefore, the range of intensities that relates to muscle tissue will require calibration for each image. To do so, a portion of the image that contains a sample of the darker muscle pixels and the lighter fat pixels will be selected by the user. The distribution of pixel intensities within this sample image will be examined and a range of intensities associated with muscle will be specified (Figure 17). Once the muscle contour for a give slice is digitized by the user, the threshold rule will be applied to subtract pixels that are not muscle. Figure 17. Pixel intensity histogram for a portion of a T-1 weighted image of the leg. The sharp peak on the left is related to muscle pixels and the broad peak is related to fat pixels (Kent-Braun et al., 2000). 71
94 The tibialis posterior muscle and all intrinsic foot muscles will be digitized as a group for a series of leg and foot images. Within each series, the image with the largest muscle CSA will be identified. For each slice, the following variables will be examined: total CSA, contractile CSA, non-contractile CSA, percent contractile, percent noncontractile. Six axial MRI slices will be analyzed in the foot. Two representative slices will be taken at three regions of the foot: rearfoot, midfoot, and forefoot. The contractile CSA will be summed for these six slices (CSA 6 ). Statistical Analysis Independent and dependent T-tests (α=0.05) of group means will be used to determine the differences between CON and PF. Part III Muscle Energetics Introduction It is believed that intrinsic foot muscles and the plantar fascia together play an important role in dynamic support of the medial arch (Mann and Inman, 1964; Fiolkowski et al., 2003). A combination of a compromised plantar fascia and atrophy could increase the relative demand on the intrinsic foot muscles during a given task. However, the measurement of muscle activity within the foot is problematic. Only a few intrinsic muscles lie sufficiently near the surface for use of EMG, while the remaining muscles are deep and out of detectable range. 31 P MRS on the other hand, allows the user to measure muscle activity in a region of interest. The technique can be used to quantify changes in phosphocreatine (PCr) concentration that are due to muscle (metabolic) activity (Kemp and Radda, 1994). This study represents a first-step in 72
95 quantifying intrinsic foot muscle activity via 31 P MRS and the effects of chronic plantar fasciitis. Our pilot studies have shown that this non-invasive technique is sensitive enough to reveal differences in metabolic activity of the intrinsic foot muscles during rest versus walking. The purpose of this study is to determine whether after a walking protocol, there is increased activity of the intrinsic foot muscles on the affected side in comparison to the unaffected side, in pes planus chronic plantar fasciitis. The interpretation of these results will be guided by the findings on kinematic and the muscle size. Subjects This study will examine the PF subjects of Study 1 and 2. An estimate of sample size was performed for PCr (Table 8) and Pi (Table 9) for a dependent T-test (α = 0.05, β = 0.80) using millimolar concentrations of Pi and PCr data from pilot work and literature (Lanza et al., 2006). Eight subjects will be measured at minimum (Primer of Biostatistics version 3.01, McGraw-Hill, 1992). Table 8. Sample size estimations for PCr t-tests (α = 0.05, β = 0.80). Mean differences and standard deviations (sd) based on Lanza et al. (2006) and pilot work. Difference of Expected sd Sample T-Test Means (mm) within group (mm) Size Dependent Dependent Table 9. Sample size estimations for Pi t-tests (α = 0.05, β = 0.80). Mean differences and standard deviations (sd) based on Lanza et al. (2006) and pilot work. Difference of Expected sd Sample T-Test Means (mm) within group (mm) Size Dependent Dependent
96 Experimental Set-up A 4-Tesla MRS system (Bruker Biospin, Rheinstetten, Germany) will be used to measure changes in intramuscular metabolites within the foot. The surface coil consists of a coplanar 1 H coil (d= 6cm) and an elliptical 31 P coil (3 x 5cm). Protocol Intramuscular concentrations of [PCr] and [Pi] will be measured using a pre- and post-walking experimental design. Since only one foot may be measured at a time, the experiment sequence will be performed twice per subject. The order of the foot to be measured will be randomized by a coin toss. To obtain resting PCr and Pi prior to walking (PRE), subjects will be positioned supine with their knee flexed inside the bore of the superconducting magnet. The surface coil will be positioned under the medial arch of the foot. Adjustments to the subject s foot position will be made until scout images confirm that the foot is in the magnet s isocenter. Homogeneity of the magnetic field will be optimized using fast automatic shimming techniques (FASTMAP). 31 P free induction decays (FIDs) will be captured for 3 minutes (100μs, 60 nominal flip angle, TR=2s, 2048 data points, spectrum width=8000hz). Once PRE measurements are complete, subjects will be removed from the magnet and the position of the coil will be outlined on the foot by ink. Subjects will be transported by wheelchair to the treadmill room (approx 50 feet) where they will rest in a seated position for 5 minutes. Subjects will be asked to walk barefoot on a treadmill for 7 min at 1.5 ms -1. To preserve the metabolic disturbance as a result of barefoot walking within the intrinsic muscles of the foot, a blood pressure cuff around an ankle will be inflated within approximately 30 seconds to supra-systolic 74
97 pressure (> 220mmHg) within the last step. The cuff will impede the flow of oxygen to the muscle and therefore prevent oxidative recovery of PCr. In less than four minutes, subjects will be wheeled to the MR unit and repositioned in the superconducting magnet as in PRE. The collection of POST 31 P FIDs will begin five minutes after the end of the treadmill protocol. The collection parameters for PST will be the same as PRE. The cuff will be deflated once the FIDs are collected. This protocol will be performed twice for each subject with sufficient rest in between (> 20 min) so that both the affected and unaffected side are measured. Data Reduction Concentrations of PCr and Pi will be quantified using NUTS software (Acorn NMR Inc., Livermore, CA, USA). A series of FIDs obtained within a condition will be averaged then multiplied with a 10Hz line function to improve the signal to noise ratio. The resulting FID will be transformed from the time to the frequency domain using a Fourier transformation. Frequency signals will be corrected for phase distortions. The spectral baseline will be fit to a 5 th order polynomial, then subtracted. PCr and Pi peaks will be identified by their distinct resonant frequencies. Relative concentrations of PCr and Pi will be quantified by integrating the Lorentzian curve that will be fit to the peak using a least squares fit algorithm. Millimolar concentrations, [PCr] and [Pi], will be determined by assuming [PCr] + [Pi] = 42.5 mm (Harris et al., 1974). Statistical Analysis The difference in PRE and POST in [Pi], [PCR] and Pi / PCr will be compared between the affected and the unaffected foot with a paired T-test (α=0.05) for each subject. 75
98 References Bates, B. T., Osternig, L. R., Mason, B., & James, S. L., Lower extremity function during the support phase of running, in: E. Asmussen & K. Jorgensen, eds. Biomechanics VI-B, University Park, Baltimore, pp Batschelet, E., Circular statistics in biology. Academic Press, London. Bojsen-Moller, F., Calcaneocuboid joint and stability of the longitudinal arch of the foot at high and low gear push off. Journal of Anatomy 129, Budiman-Mak, E., Conrad, K., Stuck, R., & Matters, M., Theoretical model and Rasch analysis to develop a revised Foot Function Index. Foot & Ankle International. 27, Budiman-Mak, E., Conrad, K. J., & Roach, K. E., The Foot Function Index: a measure of foot pain and disability. Journal of Clinical Epidemiology 44, Carson, M. C., Harrington, M. E., Thompson, N., O'Connor, J. J., & Theologis, T. N., Kinematic analysis of a multi-segment foot model for research and clinical applications: a repeatability analysis. Journal of Biomechanics 34, Chang, R., Davis, I. S., & Hamill, J., Rearfoot norms in a young, healthy population. Journal of Biomechanics 40, S492-S492. Cole, G. K., Nigg, B. M., Ronsky, J. L., & Yeadon, M. R., Application of the joint coordinate system to 3-dimensional joint attitude and movement representation - a standardization proposal. Journal of Biomechanical Engineering 115, Della Croce, U., Cappozzo, A., & Kerrigan, D. C., Pelvis and lower limb anatomical landmark calibration precision and its propagation to bone geometry and joint angles. Medical & Biological Engineering & Computing 37, Fiolkowski, P., Brunt, D., Bishop, M., Woo, R., & Horodyski, M., Intrinsic pedal musculature support of the medial longitudinal arch: an electromyography study. The Journal of Foot and Ankle Surgery 42, Hamill, J., Bates, B. T., & Holt, K. G., Timing of lower extremity joint actions during treadmill running. Medicine and Science in Sports and Exercise24, Hamill, J., Haddad, J. M., & McDermott, W. J., Issues in quantifying variability from a dynamical systems perspective. Journal of Applied Biomechanics 16,
99 Harris, R. C., Hultman, E., & Nordesjo, L. O., Glycogen, glycolytic intermediates and high-energy phosphates determined in biopsy samples of musculus quadriceps femoris of man at rest. Methods and variance of values. Scandinavian Journal of Clinical and Laboratory Investigation 33, Headlee, D. L., Leonard, J. L., Hart, J. M., Ingersoll, C. D., & Hertel, J., Fatigue of the plantar intrinsic foot muscles increases navicular drop. Journal of Electromyography and Kinesiology18, Heiderscheit, B. C., Hamill, J., & Van Emmerik, R. E. A., Variability of stride characteristics and joint coordination among individuals with unilateral patellofemoral pain. Journal of Applied Biomechanics 18, Hicks, J. H., The mechanics of the foot II. The plantar aponeurosis and the arch. Journal of Anatomy 88, Kemp, G. J. & Radda, G. K., Quantitative Interpretation of Bioenergetic Data from P-31 and H-1 Magnetic-Resonance Spectroscopic Studies of Skeletal-Muscle - An Analytical Review. Magnetic Resonance Quarterly. 10, Kent-Braun, J. A., Ng, A. V., & Young, K., Skeletal muscle contractile and noncontractile components in young and older women and men. Journal of Applied Physiology 88, Kidder, S. M., Abuzzahab, F. S., Jr., Harris, G. F., & Johnson, J. E., A system for the analysis of foot and ankle kinematics during gait. IEEE Transactions on Rehabilitation Engineering 4, Lanza, I. R., Wigmore, D. M., Befroy, D. E., & Kent-Braun, J. A., In vivo ATP production during free-flow and ischaemic muscle contractions in humans. Journal of Physiology. 577, Leardini, A., Benedetti, M. G., Berti, L., Bettinelli, D., Nativo, R., & Giannini, S., Rear-foot, mid-foot and fore-foot motion during the stance phase of gait. Gait & Posture 25, Leardini, A., Benedetti, M. G., Catani, F., Simoncini, L., & Giannini, S., An anatomically based protocol for the description of foot segment kinematics during gait. Clinical Biomechanics 14, Lundberg, A., Svensson, O. K., Bylund, C., Goldie, I., & Selvik, G., Kinematics of the ankle/foot complex--part 2: Pronation and supination. Foot & Ankle. 9,
100 Manal, K., McClay, I., Stanhope, S., Richards, J., & Galinat, B., Comparison of surface mounted markers and attachment methods in estimating tibial rotations during walking: an in vivo study. Gait & Posture 11, Mann, R. & Inman, V. T., Phasic activity of intrinsic muscles of the foot. The Journal of bone and joint surgery. American volume 46, McClay, I. & Manal, K., Coupling parameters in runners with normal and excessive pronation. Journal of Applied Biomechanics 13, McClay, I. & Manal, K., A comparison of three-dimensional lower extremity kinematics during running between excessive pronators and normals. Clinical Biomechanics 13, Robertson, D. G. E., Caldwell, G. E., Hamill, J., Kamen, G., & Whittlesey, S. N., Research methods in biomechanics. Human Kinetics. Champaign, IL. Roos, E., Engstrom, M., & Soderberg, B., Foot orthoses for the treatment of plantar fasciitis. Foot & Ankle International. 27, Sarrafian, S. K.,1983. Anatomy of the Foot and Ankle. Descriptive, Topographic, Functional., 2nd edn, J.B. Lippincott Co., Philadelphia, PA. Simon, J., Doederlein, L., McIntosh, A. S., Metaxiotis, D., Bock, H. G., & Wolf, S. I., The Heidelberg foot measurement method: Development, description and assessment. Gait & Posture 23, Sparrow, W. A., Donovan, E., Van Emmerik, R. E. A., & Barry, E. B., Using relative motion plots to measure changes in intra-limb and inter-limb coordination. Journal of Motor Behavior 19, Williams, D. S. & McClay, I. S., Measurements used to characterize the foot and the medial longitudinal arch: reliability and validity. Physical Therapy 80,
101 CHAPTER IV PART I A MULTI-SEGMENT FOOT ANALYSIS OF THE AMBULATING PLANTAR FASCIITIS FOOT Abstract Six aspects of the foot have been identified which were believed to be important in the biomechanical characterization of plantar fasciitis (PF) feet: 1) rearfoot motion, 2) forefoot motion, 3) rearfoot-forefoot coupling and variability, 4) first metatarsophalangeal joint (FMPJ) motion, 5) FMPJ - medial longitudinal arch (MLA) coupling and variability, and 6) ground reaction forces. The purpose of this study was to determine whether PF feet are different from healthy feet in regards to these six aspects. Retroreflective skin markers were fixed to subjects according to a multi-segment foot model and leg model. Ground reaction forces and three dimensional (3D) kinematics of the leg, rearfoot, forefoot and hallux segment were captured as individuals walked at 1.35 ms -1. With respect to healthy individuals, PF feet exhibited: 1) greater rearfoot motion, 2) greater sagittal plane forefoot motion, 3) fewer frontal anti-phase movements, and less transverse coordinative variability, 4) greater FMPJ dorsiflexion, 5) greater coupling variability, and 6) decreased vertical ground reaction forces during second peak. It was concluded that PF feet exhibit excessive kinematics which would put undue strain on the plantar fascia, a mechanism which is consistent with the theoretical causation of PF. Coordinative variability results were consistent with dynamical systems theory for the rearfoot-forefoot couple, but contrary to in the FMPJ-MLA couple. Ground reaction forces suggested a compensatory response. 79
102 Introduction Anatomists, clinicians and scientists agree that the foot is complex both in anatomy and in biomechanics. Foot architecture is a conglomerate of layered connective tissues, small muscles, irregularly shaped bones and numerous articulations (i.e., over 100 soft tissue elements, 28 bones and 33 joints). While the anatomy and morphology of the foot has been described in great detail (e.g. Sarrafian, 1983), the biomechanical theories surrounding the foot have been much more difficult to quantify and validate in vivo. Towards a common goal of understanding the mechanical capabilities of the foot in loading and propulsion, several individuals have proposed and described the most likely biomechanical events at the medial longitudinal arch, the midtarsal joint, and intrinsic foot muscles (Manter, 1941; Hicks, 1953a; Elftman, 1960; Mann and Inman, 1964; Bojsen-Moller, 1979). Yet, these fundamental ideas of intrinsic foot mechanics have for the most part, evaded quantitative confirmation. The manner in which the foot is modeled in human biomechanics has been a major obstacle to the quantification of intrinsic foot mechanics. Traditionally, in vivo human joint kinematics are analyzed using a link-segment model with the foot modeled as a single rigid segment (White et al., 1989; Areblad et al., 1990; Robertson et al., 2004). While this technique has provided substantial insight into the movements at the hip, knee and ankle (Cavanagh, 1987; Winter et al., 1990b; Vaughan, 1996; Sutherland, 2002), it is a technique which cannot solve for kinematic solutions for the intrinsic foot structures (Kidder et al., 1996). Therefore, use of the traditional link segment model, which continues to be the most commonly used method for clinical gait analysis, has not improved the understanding of intrinsic foot segmental coordination. Thus, 80
103 biomechanical modeling for the purposes of advancing knowledge of injuries within the foot, such as plantar fasciitis, has been obstructed. The study of plantar fasciitis from a biomechanics standpoint necessitates information regarding the intrinsic foot structures. An investigation of plantar fasciitis is clinically important because it is a debilitating disorder of the foot (Roos et al., 2006) that affects more than two million Americans every year (Pfeffer et al., 1999). The plantar fascia is an aponeurotic tissue which spans the length of the foot from the rearfoot to forefoot and it provides stability to the medial longitudinal arch (Huang et al., 1993). It is believed that plantar fasciitis is a deterioration of the plantar fascia, which manifests from excessive and/or repetitive loading (Wearing et al., 2003; Warren, 1990). Clinical doctrine indicates that excessive tensile loads result directly from midtarsal joint pronation, medial longitudinal arch flattening and/or pronounced rearfoot eversion (Subotnick, 1981; Taunton et al., 1982; Shama et al., 1983b; Kwong et al., 1988; Prichasuk and Subhadrabandhu, 1994). However, studies that have measured rearfoot motion (Warren and Jones, 1987; Messier and Pittala, 1988), arch kinematics (Wearing et al., 2004) and arch height (Warren, 1984; Rome et al., 2001) have not found an association between plantar fasciitis and excessive mechanics. These studies have been significantly limited by the shortcomings of the single rigid segment foot model and errors associated with two dimensional (2D) measurement. Moreover, there is disagreement in the literature in regards to what extent ground reaction forces are different in plantar fasciitis feet from healthy feet (Katoh et al., 1983a; Liddle et al., 2000). 81
104 In more recent years, a variety of multi-segment foot models have been proposed (Kidder et al., 1996; Leardini et al., 1999; Carson et al., 2001; MacWilliams et al., 2003; Stebbins et al., 2006; Leardini et al., 2007). Owing to improved camera and computer technology, it is possible to put these models into practice in a typical clinical gait laboratory setup. These models provide an opportunity to examine the long-standing theories concerning coordination of the rearfoot, forefoot and hallux segments. While relatively new and so far sparingly practiced, valuable contributions to the body of literature on foot mechanics research have been made (Scott and Winter, 1990; Hunt et al., 2001; MacWilliams et al., 2003; Buczek et al., 2006; Rao et al., 2007; Pohl and Buckley, 2008). One further problem in the validation of mechanical foot theories is the mismatch in which kinematics are described conceptually in comparison to the way in which they are reported. In qualitative foot mechanics literature, there is an emphasis on the coordination of segment couples. One prominent theory is that in late stance, the forefoot counter-rotates upon the rearfoot (forefoot pronation coupled with rearfoot supination). Instead of reporting coupled motion, most quantitative techniques report the resultant angle between the two segments (Stebbins et al., 2006; Leardini et al., 2007). Therefore, it is unclear whether previous data (Hunt et al., 2001) support or refute the notion of a counter-rotation in the foot. We have expanded a vector coding technique to facilitate interpretation of rearfoot-forefoot movements in a manner that is more conducive for comparison with previous descriptions (Chang et al., 2008). The technique summarizes coordination patterns into four phase terms. It has been suggested that rearfoot-forefoot anti-phase would result in deformation of the plantar fascia both distally and proximally. 82
105 As such, they may be a deleterious movement pattern for the plantar fascia. Moreover, the vector coding technique allows for dynamical systems theories to be explored in the context of characterizing healthy and pathological foot function. Dynamical systems theory has shed new light on the interpretation of coordination variability in overuse injuries (Hamill et al., 1999), and these theories have yet to be explored in the study of plantar fasciitis. Coordination and performance variability has been traditionally viewed as a measure of disability. On the other hand in dynamical systems analyses, variability is a measure of functional flexibility which rises and facilitates the transition between two modes (Kelso, 1984; Kelso, 1995). There has been some proof of concept in human systems. For example, individuals with Parkinson s disease have reduced relative phase variability and greater difficulty transitioning from one coordinative mode to another (Van Emmerik et al., 2000). In regards to overuse injuries, individuals with patellofemoral pain have exhibited reduced knee coordination variability (Heiderscheit, 2000; Hamill et al., 1999; Heiderscheit et al., 1999; Heiderscheit et al., 2002). In the foot, there is a major transition from loading to propulsion in which the foot changes from a compliant structure to a rigid structure (Manter, 1941; Hicks, 1953; Elftman, 1960; Mann and Inman, 1964; Bojsen-Moller, 1979). Conceptually, there is potential to interpret coordination variability for the purposes of characterizing the presence of plantar fasciitis from a dynamical systems perspective. It is likely that there is a window of functional variability. Too much or too little variability may be detrimental and dynamical systems approaches can assist in the interpretation of variability. Coordination variability is expected to increase as the 83
106 foot transitions from a compliant structure to a rigid structure, and presence of plantar fasciitis is expected suppress the magnitude of variability. It is not clear whether individuals with plantar fasciitis exhibit changes in their ground reaction force profiles. When subjects are allowed to walk at a self-selected speed, some researchers have shown that vertical ground reaction forces are unchanged with plantar fasciitis (Wearing et al., 2003; Liddle et al., 2000), while others have shown reductions in the peak magnitudes (Katoh et al., 1983). Experimental control of walking speed, however, may bring some clarity to this issue. For instance in the study by Katoh et al. 1983), the plantar fasciitis individuals walked slower than the healthy controls. It is well know that peak ground reaction forces are directly related to walking speed (Andriacchi et al., 1977), and therefore, differences were confounded by walking speed. Due to the discrepancy in the literature, our aim was to compare the ground reaction force profiles of healthy and plantar fasciitis feet at the same walking speed. Therefore, the purpose of this study was to characterize healthy and chronic plantar fasciitis feet via a multi-segment model in regards to kinematics, coordination, coordinative variability and ground reaction forces. Hypotheses Hypotheses were made for rearfoot motion, forefoot motion, rearfoot-forefoot coupling and variability, FMPJ medial longitudinal arch (MLA) coupling and variability, and ground reaction forces. Compared to healthy subjects, we hypothesized that PF feet would exhibit greater maximum rearfoot eversion, total inversion-eversion and maximum eversion velocity. In forefoot motion, the overall hypothesis was that plantar fasciitis feet would exhibit pronounced forefoot kinematics that are consistent 84
107 with overpronation. More specifically in each anatomical plane (sagittal, frontal and transverse), we hypothesized that PF feet would demonstrate greater maximum, total motion, and peak velocities. With rearfoot-forefoot coupling and variability, we hypothesized that the coupling angles would differ between healthy and plantar fasciitis feet; that plantar fasciitis feet would exhibit more frequent anti-phase movements than healthy feet; and that plantar fasciitis feet would exhibit reduced levels of coordinative variability. We hypothesized that presence of plantar fasciitis would alter the coupling angles of the FMPJ and MLA in late stance and that the plantar fasciitis individuals would exhibit reduced coordinative variability consistent with dynamical systems theory. Concerning ground reaction forces, we hypothesized that the peak vertical ground reaction forces at loading and at propulsion would differ between PF and CON. These ground reaction force hypotheses were not directional given the disagreement in the literature. Methods Subjects Twenty-two healthy controls (CON) and twenty-two individuals with plantar fasciitis (PF) gave their informed consent to participate in this study. Individuals qualified if they were 30 to 60 years of age. In PF subjects, symptoms were persistent at minimum the three months leading up to the study. Also, PF subjects had pain upon palpation of the plantar fascia and had experienced first step pain that is characteristic of plantar fasciitis at least five times. Foot posture was quantified via the standing arch ratio (Williams and McClay, 2000) and the foot posture index (Redmond et al., 2006.) Due to the purported difference of injury mechanism, individuals with a high arch foot type were 85
108 excluded. A high arch foot was defined as a standing arch ratio greater than 0.357, one standard deviation above the University of Massachusetts Biomechanics laboratory present mean value. Exclusion criteria included a history of: a local steroid injection within the last 2 months, arthritis in the lower extremities, local traumatic injury, neurological disorders, myopathies, local cardiovascular disorder, local infections and tumors, pregnancy and a body mass index greater than 35. The mean duration of symptoms in PF subjects reported at the time of inclusion in the study was 4.5 years (ranging from years). The two groups did not differ in height, body mass, standing arch ratio and foot posture index (Table 10). Table 10. Descriptive statistics for subject (means ± sd). The p-values are provided for t-tests. Variable Control Plantar Fasciitis p-value Age (years) 44.0 (10.0) 42.9 (7.6) 0.69 Height (m) (7.2) (7.2) 0.47 Mass (Kg) 72.5 (13.0) 74.5 (11.8) 0.62 Standing Arch Ratio (0.019) (0.022) 0.15 Foot Posture Index 2.6 (3.0) 4.0 (3.8) 0.20 Preferred Walking Speed (ms -1 ) 1.31 (0.17) 1.28 (0.16) 0.60 According to subjects responses to a Revised Foot Function Index (Appendix E) (Budiman-Mak et al., 2006), in comparison to CON, PF subjects reported significantly more: pain, stiffness, disability, activity limitation and social/emotional issues (Table 11). Table 11. Group mean total scores (sd) for each section of the Revised Foot Function Index. p-values provided for a t-test. 86
109 Section Control Plantar Fasciitis p Pain 0.2 (0.4) 6.6 (3.6) <0.001 Stiffness 1.6 (1.2) 5.1 (5.0) <0.001 Disability 0.3 (0.8) 9.5 (9.0) <0.001 Activity Limitation 0.0 (0.0) 3.4 (4.6) <0.001 Social Issues 0.0 (0.0) 2.8 (4.6) <0.001 Protocol Kinematic and kinetic gait data were collected using a three-dimensional (3D) motion capture system and force platform. The leg was defined proximally by markers at the medial and lateral femoral epicondyles, and distally at medial and lateral malleoli. Leg segments were each tracked with rigid cluster of four markers. A non-invasive multi-segment foot marker set (Leardini et al., 2007) was implemented to track the rearfoot (tarsus) forefoot (metatarsus), hallux and medial longitudinal arch. Due to recent findings which indicate that the fifth metatarsal behaves kinematically different from the medial aspect of the forefoot (Wolf et al., 2008; Arndt et al., 2007; Lundgren et al., 2008), the forefoot model was modified to track four markers on the medial side (i.e. metatarsals I and II) and excluded the two markers on metatarsal V originally proposed by Leardini et al. (2007). The forefoot segment was modified in light of research which indicates that the major joints on the medial side are morphologically and functionally different than those on the lateral side (Wolf et al., 2008). For the purposes of our research questions, not only is the medial forefoot segment an acknowledgement to the deformable characteristics of the forefoot, but the medial forefoot is also more relevant when examining plantar fascia function (Hicks, 1954; Cheng et al., 2008). The Leardini et al. (2007) foot model was chosen over other models (e.g. Leardini et al., 1999; Carson et al., 2001; Simon et al., 2006) because: 1) recommended marker positions minimize 87

110 skin movement artefact by avoiding the path of tendons; 2) external wands or fixtures are not used; 3) special calibration devices are not needed; and 4) segments are clinically relevant. Coordinate system configuration is described in detail elsewhere (Leardini et al., 2007), therefore an overview of segment definitions and marker placement is provided (Figure 18, Figure 19, Table 12). PM Hallux SMH FMH Forefoot VMH Y FMB SMB X VMB ST Rearfoot PT Y Y Z X CA X 88
111 Figure 18. Segment and global coordinate systems for the rearfoot and forefoot based on the model proposed by Leardini et al. (2007). Colored circles indicate tracking markers and dotted circles indicate location of coordinate system origins. Half-filled circles indicated markers not used in the medial forefoot model. See Table 12 for marker name and details. Table 12. Segments, marker names and marker position adapted from Leardini et al. (2007). Segment Type Marker Names: Details Rearfoot 3D CA: Achilles tendon attachment PT: peroneal tubercle ST: sustentaculum tali Forefoot 3D FMB: dorso-medial aspect of the base of first metatarsal FMH: dorso-medial aspect of first metatarsal head SMB: dorso-medial aspect of the base of the second metatarsal. SMH: dorso-medial aspect of the second metatarsal head VMB: dorso-lateral aspect of base of the fifth metatarsal, (tracked only in generalized forefoot model) VMH: dorso-lateral aspect of the fifth metatarsal head (used for defining forefoot coordinate system, only tracked in generalized forefoot model) Hallux 2D PM: most distal and dorsal point of the head of the proximal phalanx of the hallux. FMH: dorso-medial aspect of first metatarsal head First Metatarsal 2D FMB: dorso-medial aspect of the base of first metatarsal FMH: dorso-medial aspect of first metataral head Preferred walking speed was determined. Subjects were asked to walk barefoot straight along a 10 meter walkway and to walk at a comfortable pace as if you re going somewhere, but you re not in a hurry to get there (Norris et al., 2007). Photocells timed their 6 meter walking time. Individual means were based upon 5 trials. Kinematic and kinetic data were collected synchronously for standing calibration and walking trials on a straight 10 meter walkway. Walking speed was set at 1.35 ms -1 ± 89
112 5%. The data collection system consisted of eight circularly positioned 1.3 megapixel cameras (Oqus 3-series, Qualisys AB, Gothenburg, Sweden) sampling at 240 Hz and a force platform (BP , AMTI Inc., Watertown, USA) sampling at 1920 Hz. Due to the high number of markers for each limb, datasets were collected for one limb then the other. Data processing and model building were performed in Visual 3D TM (C-Motion Inc., Germantown, USA). Five trials from a selected limb (right or left) for each subject were processed. In bilaterally symptomatic PF subjects, data for the more symptomatic limb was selected for processing. If a PF subject was affected equally on both limbs, selection was based on a block randomization process. In CON, limb selection was randomized and the number of right and left data sets was matched to PF. Marker histories and analog signals were smoothed with a 4 th order, low-pass Butterworth filter at 8 Hz and at 70 Hz, respectively. Joint angles were calculated with six degrees of freedom, distal relative to the proximal using a right-handed orthogonal Cardan Xyz sequence of rotations (Cole et al., 1993). As such, the rearfoot joint angle was calculated rearfoot to leg segment, and the forefoot joint angle was calculated forefoot to rearfoot. In addition, forefoot and rearfoot segment angles were computed with each segment relative to a fixed laboratory coordinate system (LCS) (X-medio-lateral; Y-line of walking progression; Z-vertical). Stance was identified according to the vertical ground reaction force at a 15 N threshold. In accordance to the protocol described by Leardini et al. (2007), joint and segment angles were normalized to the standing position and time scaled to 100% of stance. Kinematic data were averaged across five trials for each subject, and these means were used to calculate group means. 90
113 FMB FMB MLA PM CA FMH FMPJ Figure 19. Planar angles as defined by line segments of the medial longitudinal arch (MLA) and first metatarso-phalangeal joint (FMPJ). Variables and Statistical Analyses Discrete kinematic variables were identified for each trial, averaged for that subject, and then averaged across the group. Regarding rearfoot motion, variables of interest were limited to the frontal plane: inversion angle at touchdown (InvTD), maximum eversion angle (EVMax), total rearfoot inversion-eversion in stance, and maximum eversion velocity (EVMaxVel). In forefoot kinematics, equivalent frontal plane variables were examined with the addition of sagittal and transverse plane motion variables: plantarflexion angle at touchdown (PFx TD), maximum dorsiflexion angle (Dorsi Max), total plantar-dorsiflexion motion in stance, maximum dorsiflexion velocity between 0% and 66% stance (Dorsi Max Vel), adduction angle at touchdown (Add TD), maximum abduction angle (Abd Max), total adduction-abduction motion in stance, and maximum abduction velocity between 0% and 66% stance. Kinematic hypotheses were directional (i.e. PF parameters were expected to be greater than CON), and therefore one-tailed independent t-tests (α = 0.05) were used to identify significant mean differences between PF and CON. Ground reaction forces were 91
114 examined with two-tailed independent t-tests. Effect sizes (ES) were computed to infer the importance of mean differences according to Cohen s guidelines for small (ES=0.2), medium (ES=0.5), and large effects (ES=0.8) (Cohen, 1988). Coordinative patterns of the rearfoot-forefoot couple were examined with an elaborated vector coding technique across three equally long stance periods: early (1-33% stance), mid- (34-66%) and late stance (67-99%). A detailed description of the technique for computing coupling angles and categorizing anti-phase, in-phase, rearfoot-phase and forefoot phase coordination patterns can be found in Appendix F (Chang et al. 2008). For each subject, and then respective group, means and standard deviations for coupling angles were derived with statistical approaches for circular data (Batschelet, 1981). The Watson-Williams test for circular data was used (α = 0.05) to determine difference between the group mean coupling angles (Batschelet, 1981). The mean frequency of rearfoot-forefoot anti-phase movements and coordination variability was averaged across the three stance periods of interest. A group (2) by period (3) analysis of variance technique (α=0.05) was used to determine significant main and interaction effects. Significant differences were examined post-hoc with Tukey s test. Results Rearfoot Motion Group differences in discrete rearfoot motion variables were noted in the expected direction (Table 13). Plantar fasciitis individuals had a greater total rearfoot motion than CON (p=0.05, ES=0.51) and had a greater maximum eversion velocity (p=0.08, ES=0.44). In overall movement patterns, healthy and PF individuals were similar (Figure 20). The rearfoot touched down in an inverted position, then everted into mid-stance. 92
115 Upon reaching maximum eversion at approximately 60% of stance, the rearfoot inverted towards push-off. Table 13. Rearfoot motion results in the frontal plane for control (CON) and plantar fasciitis (PF) individuals. The p-values are presented for a t-test. Variable CON PF p-value Effect Size Inv TD ( ) 2.7 (1.9) 3.6 (2.5) EV Max ( ) 3.5 (1.4) 3.8 (1.8) Total ( ) 6.2 (1.4) 7.4 (2.9) EV Max Vel ( s -1 ) 43.3 (20.0) 56.7 (38.0) Degrees (+Inv) CON PF %Stance Figure 20. Rearfoot motion in the frontal plane. Plantar fasciitis (PF): solid line with dark standard deviation bands (sd); Control (CON): dotted with light standard deviation bands. Forefoot Motion Total sagittal and frontal plane motion results were in the expected direction (Table 14). PF subjects demonstrated greater total plantar-dorsiflexion motion p = 0.05, ES = 0.50) and tended towards greater total inversion-eversion forefoot motion (p = 0.14, ES = 0.33). At touchdown, the forefoot of plantar fasciitis subjects was more plantar 93
116 flexed than CON (p = 0.04, ES = 0.55). No group mean differences were found in maximum forefoot dorsiflexion and maximum eversion. While the largest total ranges of motion were seen in sagittal plane (9.4 and 10.3 in CON and PF, respectively), the smallest were seen in the transverse plane (5.0 and 4.3, respectively). No group differences were found in maximum abduction angle (p = 0.17, ES = 0.29). The PF group tended towards less total abduction motion, however, the effect sizes were small and not statistically significant (p = 0.22, ES= 0.23). A visual inspection of forefoot motion time-series did not yield any remarkable differences in the movement patterns of PF and CON individuals (Figure 21). From touchdown to mid- and late stance, motion was greater in the sagittal plane in comparison to the frontal and transverse planes. The forefoot was pronated; namely, it was dorsiflexed, everted and abducted. Into late stance, reversals in posture were seen in the sagittal and transverse plane evidenced by forefoot plantarflexion and adduction, meanwhile the forefoot continued to evert. The reader is referred to Appendix F for results using a generalized forefoot model which made use of tracking markers on metatarsals I, II and V. 94
117 Table 14. Mean (sd) values for kinematic variables of the forefoot relative to the rearfoot and comparison across control (CON) and plantar fasciitis (PF) groups. (PFx: plantarflexion, TD: touchdown, Max: maximum, Total: total motion, vel: velocity). Effect Variable CON PF p-value Size Sagittal PFx TD ( ) 2.7 (1.7) 3.7 (2.0) Dorsi Max ( ) 6.7 (1.4) 6.6 (2.6) Total ( ) 9.4 (1.9) 10.3 (1.9) Dorsi Max vel ( s -1 ) 75.7 (30.1) 75.1 (27.0) Frontal In TD ( ) 1.6 (2.5) 0.9 (2.2) EV Max ( ) 8.8 (3.4) 9.1 (3.2) Total ( ) 7.3 (3.0) 8.2 (2.4) EV Max vel ( s -1 ) 41.0 (27.4) 43.6 (24.3) Transverse Add TD ( ) 1.4 (2.1) 0.9 (1.7) Abd Max ( ) 3.4 (2.0) 2.9 (1.5) Total ( ) 5.0 (3.8) 4.3 (2.5) Abd Max vel ( s -1 ) 35.3 (15.2) 35.3 (17.4)
118 a) 10 5 Sagittal CON PF Degrees (+Dorsi) b) 5 Frontal Degrees (+Inv) c) Transverse Degrees (+Add) %Stance Figure 21. Forefoot kinematic time series during stance period in plantar fasciitis (PF) and healthy control subjects (CON). Data are means the a) sagittal, b) frontal and c) transverse planes. Bands indicate standard deviations (CON: light/grey and PF: dark/orange). 96
119 Rearfoot-Forefoot Coupling and Variability Coordination data of the rearfoot and forefoot segments based on vector coding analysis are presented in Figure 22 and Figure 23. No group differences were found in the coupling angles of PF and CON (Table 15). The angle-angle profiles for CON and PF were similar in the sagittal plane (Figure 22 a), however on average, PF movement patterns were anti-phase (coupling angle = 135 ) at ~20% stance (Figure 22 d). From 30 to 60%, both groups frequently demonstrated a rearfoot plantar flexion movement (coupling angle = 180 ) then transitioned to an in-phase pattern in late stance for propulsion (Figure 23 a, d). At touchdown, the rearfoot and forefoot segments of plantar fasciitis subjects were more inverted and adducted than their healthy counter parts (Figure 22 b and c). Coupling angles were least similar from 20 to 30% stance in the sagittal, frontal and transverse planes (Figure 22 d, e and f). In the frontal plane, movements were in-phase then forefoot dominated at early stance, later with frequent in-phase and rearfoot dominated. In the transverse plane, there were notable in-phase movements in early stance, followed by in-phase/forefoot abduction movements into mid-stance. 97
120 a) FF (+Dorsi) b) FF (+Inv) FF (+Add) RF (+Dorsi) c) RF (+Inv) Rearfoot 180 Plantar flexion RF (+Add) In- Phase Rearfoot Eversion 180 In- Phase Forefoot Eversion Rearfoot 180 Abduction In- Phase 270 Forefoot Plantar flexion Forefoot Abduction In- Phase 45 0 d) e) In- Phase 45 0 Forefoot Anti- Inversion Phase Anti- Phase In- Phase 45 0 Rearfoot Dorsiflexion Forefoot Anti- Dorsiflexion Phase Anti- Phase Forefoot Anti- Adduction Phase Anti- Phase Rearfoot Inversion f) Rearfoot Adduction Sagittal Coupling Angle Frontal Coupling Angle Transverse Coupling Angle CON PF %Stance Figure 22. The angle-angle diagrams and respective coupling angle time graphs for the rearfoot (RF) -forefoot (FF) couple in the sagittal (a,d), frontal (b,e) and transverse planes (c,f). Insets provide a guide to the coordination mode associated with the orientation of the coupling angles. The + indicates touchdown of the stance phase. 98
121 a) Sagittal Frequency Control d) Frequency Plantar Fasciitis IN ANTI RF FF Early Mid Late 0 Early Mid Late b) e) Frontal Frequency Frequency Early Mid Late 0 Early Mid Late c) f) Transverse Frequency Frequency Early Mid Late 0 Early Mid Late Figure 23. Coordination histograms for healthy and plantar fasciitis individuals which summarize the frequency of four coordination patterns: anti-phase, in-phase, rearfoot phase and forefoot phase. 99
122 Table 15. Rearfoot-forefoot coupling angles. p-values reported for a Watson- William test (*: data did not meet Watson-Williams test criteria of circular distribution). Means (sd) Plane Stance CON PF p-values Sagittal Early ( ) (15.8) (13.1) 0.38 Mid ( ) (9.8) (12.8) 0.09 Late ( ) (1.7) (2.1) 0.22 Frontal Early ( ) (48.8) (38.1) 0.98 Mid ( ) (50.4) (53.5) * Late ( ) 18.2 (25.6) 21.6 (22.2) 0.65 Sagittal Early ( ) 36.4 (37.1) 40.4 (46.4) 0.78 Mid ( ) (26.9) (36.5) 0.91 Late ( ) (19.6) (20.2) 0.11 There were no significant group by stance period interaction effects in the frequency of anti-phase movements (p > 0.05, Figure 24). Unexpectedly, CON demonstrated more anti-phase movements than PF in the frontal plane (p = 0.003). No group differences were found in the sagittal or transverse planes (Figure 24). As an indication of the changes in distribution of anti-phase motion across the stance, differences were found between the three stance periods in all planes (p < 0.05, Figure 24). In the sagittal plane, there were more anti-phase movements in early stance than mid- and late-stance (p < 0.05). In the frontal plane, there were more anti-phase movements in mid-stance(p < 0.05). Lastly, in the transverse plane there were more antiphase movements in late-stance in comparison to mid-stance (p < 0.05). 100
123 a) Sagittal Frequency of Anti-Phase p = 0.77 CON PF b) Frontal Frequency of Anti-Phase * *,** CON p = 0.04 PF c) * ** Transverse Frequency of Anti-Phase CON PF p = Early Mid Late ** Figure 24. Frequency of anti-phase movements in the sagittal (a), frontal (b), and transverse (c) between healthy control (CON) and plantar fasciitis (PF) individuals. No group by stance period interaction effects were found ( p > 0.05) P-values are reported for the main group effects for a repeated measures ANOVA. Asterisks indicate significant main effect (p <0.05) for period, *: different from early stance, **: different from midstance. The significant interaction of the transverse plane indicated that healthy and plantar fasciitis subjects were different in their variability across that stance periods (p < 101
124 0.0001, Table 16). Three peaks in transverse plane coordination variability were noted in healthy subjects with the second peak being the largest in magnitude; first at 0% stance, second at ~30% stance, and third at ~70% stance (Figure 25 c). The third peak was diminished in the plantar fasciitis group. Post-hoc analyses revealed that the magnitude of variability in PF and CON was similar for early and late stance (p = 0.89 and 0.99, respectively), but in midstance, CON demonstrated greater variability than PF (p <0.0001). Furthermore, CON increased in variability from early (29.4 ) to midstance (41.6, p <0.0001), while PF had a slight reduction in variability from early (26.3 ) to midstance (23.5, p=0.86). The group effect was significant indicating that healthy subjects demonstrated greater variability than plantar fasciitis subjects in the transverse plane (p < , Table 16). There were no significant interaction or group effects in the frontal and sagittal plane. In the sagittal plane, variability peaked in both healthy and plantar fasciitis individuals at around 30% stance (Figure 25 a). In late stance, variability was very low. In the frontal plane, variability remained relatively high between 30 to 70% stance (Figure 25 b). Changes in variability magnitude from one stance period to the next were significant for both the frontal and sagittal planes (p < 0.001, Table 16). 102
125 a) b) c) Coupling Variability (Degrees) Coupling Variability (Degrees) Coupling Variability (Degrees) Sagittal Frontal Transverse CON PF %Stance Figure 25. Mean rearfoot-forefoot coupling variability in the sagittal (a), frontal (b), transverse (c) planes. Solid line PF, dotted CON. 103
126 Table 16. Mean (sd) coordination variability for sagittal, frontal and transverse planes. Three stance periods were considered: early (1-33%), mid (34-66) and late (67-99%). p-values are provided for a group by stance and interaction (G*S) ANOVA. Means p-values Plane Stance CON PF Group Stance G*S Sagittal Early ( ) 13.4 (6.0) 13.0 (7.3) 0.83 < Mid ( ) 10.1 (4.2) 10.8 (4.8) Late ( ) 1.1 (0.3) 1.3 (0.5) Frontal Early ( ) 29.4 (9.7) 26.3 (7.2) 0.33 < Mid ( ) 41.6 (13.1) 39.7 (10.6) Late ( ) 15.3 (7.7) 14.6 (6.5) Transverse Early ( ) 29.4 (9.7) 26.3 (7.2) <0.001 <.0001 <.0001 Mid ( ) 41.6 (13.1) 23.5 (10.3) Late ( ) 15.3 (7.7) 14.1 (4.7) FMPJ Motion, FMPJ-MLA Coupling and Variability During the late stance period, there were group differences in FMPJ kinematics (Table 17). Plantar fasciitis individuals exhibited significantly greater maximum FMPJ dorsiflexion (p = 0.04, ES= 0.56). Touchdown was associated with approximately 18 of FMPJ dorsiflexion, which then approached the neutral position into mid-stance period (Figure 26). After a peak in dorsiflexion towards 95% of stance, there was slight plantar flexion. Differences were found in FMPJ-MLA coupling variability (Figure 28, Table 17). No differences were found in FMPJ-MLA coupling angles and frequency of anti-phase motions (Figure 27). Plantar fasciitis individuals exhibited greater magnitude of FMPJ- MLA coupling variability than CON in late stance. 104
127 Degrees (+Dorsi) CON PF %Stance Figure 26. Mean first metatarsal-phalangeal joint angle in the sagittal plane during stance. FMPJ (+Dorsi) MLA 180 Plantar flexion In- Phase MLA (+Dorsi) FMPJ Plantar flexion In- Phase 45 0 MLA Dorsiflexion FMPJ Anti- Dorsiflexion Phase Anti- Phase Sagittal Coupling Angle %Stance Figure 27. First metatarsal-phalangeal joint (FMPJ) medial longitudinal arch (MLA) angle-angle diagram normalized to total range of motion (left). Corresponding coupling angles are provided on the right. Table 17. Group mean (sd) hallux and medial longitudinal arch-hallux coupling data for late stance (Dorsi: dorsiflexion). P-values reported for a t-test. Mean (sd) Variable CON PF p-values Hallux Dorsi Max 49.0 (7.3) 53.3 (8.0) 0.04 Coupling Angle ( ) (9.2) (8.9) 0.74 Variability ( ) 5.5 (1.9) 13.6 (6.3) < Anti-Phase 13.3 (3.2) 12.9 (3.3)
128 Coupling Variability (Degrees) CON PF %Stance Figure 28. Mean first metatarso-phalangeal medial longitudinal arch coupling variability observed in the sagittal plane. Ground Reaction Forces In the vertical direction, PF demonstrated lower peak forces during loading (p = 0.12, ES = 0.35) and propulsion (p = 0.05, ES = 0.64) than CON (Table 18). Otherwise, healthy and plantar fasciitis individuals were in general similar in their ground reaction force (GRF) patterns (Figure 29 a-c). In the medio-lateral direction, there was initially a short lateral peak associated with heel strike and loading, followed by a long medially directed GRF for the remainder of stance. GRFs in the antero-posterior direction were trough and valley shaped indicating braking and propulsion forces in stance. 106
129 a) Medio-Lateral (%BW) CON PF b) Antero-Posterior (%BW) c) Vertical (%BW) %Stance Figure 29. Group mean ground reaction force profiles reported in percentage body weight (%BW) in the medio-lateral (a), antero-posterior (b), and vertical (c) directions for healthy controls (CON) and individuals with plantar fasciitis (PF). Table 18. Mean (sd) peak vertical ground reaction forces normalized to body weight (%BW) associated with loading (GRF1) and push-off (GRF2) of walking gait. p-values and effects sizes provided for t-tests between groups. Means p-values Effect Var CON PF Group Size GRF1 (%BW) (0.07) (0.063) GRF2 (%BW) (0.06) (0.077)
130 Discussion Clinicians have believed that plantar fasciitis is an overuse injury of the plantar fascia, and biomechanical factors are thought to play a significant role in its development. However, difficulties in characterizing the various biomechanics that are associated with plantar fasciitis feet have resulted in a lack of in vivo data to support this clinical opinion. The purpose of this study was to determine whether plantar fasciitis feet are different than healthy feet with regard to in their kinematics, coordination, and ground reaction forces. Rearfoot Motion One purpose of this study was to determine whether plantar fasciitis feet exhibit pronounced rearfoot motion in gait. Compared to healthy subjects, we hypothesized that plantar fasciitis individuals would exhibit pronounced: maximum eversion, total inversion-eversion and maximum eversion velocity. Retro-reflective markers were fixed to the leg and rearfoot (i.e. calcaneus) and their motions in three dimensions were tracked using an optoelectric system. Rearfoot motion was computed as rearfoot segment with respect to the leg segment. The results in part supported the overall hypothesis that plantar fasciitis feet exhibit pronounced rearfoot motion. Rearfoot motion was significantly greater in PF individuals with a medium effect size. Although the mean difference in total inversioneversion motion was only 1.2, such a magnitude represents 16.6% to 19.3% of the total motion exhibited by the control and plantar fasciitis group, respectively. Maximum eversion velocity and maximum eversion were also greater in PF as expected, but the data did not meet the a priori level of significance. Subsequently, these respective hypotheses were rejected. Nevertheless, maximum eversion velocity was 23.6 to 30.9% 108
131 greater in PF and was associated with a notable effect size; therefore, we have rejected its specific hypothesis with some reservation. Rearfoot motion measurements, a proxy to subtalar joint motion, can provide some insight into the aetiology and predisposition of plantar fasciitis. It has long been shown that flattening of the medial longitudinal arch is a product of subtalar joint and mid-tarsal joint motion (Manter, 1941). Subtalar joint motion is related to the mechanics of the medial longitudinal arch, strain and strain rate of the plantar fascia during walking gait. Rearfoot motion, while not a direct measure of midfoot or plantar fascia mechanics, is intimately related to the overall motions of the foot. Computer simulations have shown that five degrees of subtalar joint pronation leads to forefoot eversion and a pes planus (flat) foot type (Arangio et al., 2000). With this simulation, loading shifts from the lateral column to the medial column, which leads to a 22% increase in loading of the medial longitudinal arch. Ultimately, direct measurement would be ideal in order to record the loading at the plantar fascia, but this is not possible in vivo without causing significant pain and injury to participants. Alternatively, the current study demonstrates that some differences may be observed in the rearfoot. Despite an abundance of clinical papers which have identified a relationship between subtalar joint overpronation and plantar fasciitis, to our knowledge, the experimental support for this relationship has been less than definitive. Warren and Jones (1987) concluded that a discriminant functional analysis of a collection of anatomical and biomechanical variables, which included dynamic measures of rearfoot eversion, was also not useful for identifying healthy from plantar fasciitis feet. Similarly, Messier and Pittala (1988) also concluded that several rearfoot motion variables did not have 109
132 significant predictive value in discriminating plantar fasciitis from healthy individuals. However, supplementary t-tests and effect size calculations of their data performed by the present authors suggested that there was significantly greater maximum eversion, total inversion-eversion and maximum eversion velocity in PF individuals (p < 0.001, ES > 1.4). Therefore, these supplementary calculations revealed that our results are in fact in agreement with Messier and Pittala (1988). The data from the present data provide further evidence that plantar fasciitis individuals are different in their rearfoot motion patterns, a finding which has not been confirmed in the past. Because the current study was the first to apply a three dimensional biomechanical analysis of rearfoot motion in the study of plantar fasciitis, commonalities with previous 3D studies and differences with 2D analyses were expected and observed. The rearfoot motion patterns and total inversion-eversion magnitudes are in accord with other studies that have collected rearfoot motion in walking gait using skin markers (Moseley et al., 1996; Liu et al., 1997; Rattanaprasert et al., 1999; Hunt et al., 2001) and bone-pinned markers (Nester et al., 2007). As expected, Messier and Pittala (1988) report less total rearfoot inversion-eversion motion magnitudes from 2D analyses (i.e. group means: 6.8 versus the present value of 21.6 ) which is likely due to the susceptibility of 2D to kinematic overestimation (Areblad et al., 1990). One other difference from Messier and Pittala (1988) that may have also contributed to the smaller magnitudes in the present study may be the differences in studying walking gait versus running gait. The results of the present study provide some support for the clinical association between foot over-pronation and plantar fasciitis (Subotnick, 1981; Taunton et al., 110
133 1982; Shama et al., 1983; Donatelli, 1987; Kwong et al., 1988; Warren, 1990; Prichasuk and Subhadrabandhu, 1994). Because significant differences were detected, these results also indicate that it is both useful and worthwhile for clinicians and researchers to examine rearfoot motion experimentally and in the clinic. To date, rearfoot motion measures are the most commonly used method for clinical gait analysis, and thus have also been used in studies of plantar fasciitis. While valid, there are still several drawbacks to using this method for studying plantar fasciitis. Because the plantar fascia spans the rearfoot and forefoot, rearfoot measures may only indirectly measure the impact of the plantar fascia (Manter, 1941; Elftman, 1960; Bojsen- Moller, 1979; Arangio et al., 1998; Arangio et al., 2000). Recently, several advances in the field have made it possible to measure the foot in segments. Forefoot Motion This study also characterized medial forefoot motion in individuals with plantar fasciitis and in healthy individuals to gain insight into the mechanics of the plantar fascia and aetiology of plantar fasciitis. The overall hypothesis was that the plantar fasciitis foot would exhibit pronounced forefoot kinematics that are consistent with overpronation. A series of more specific kinematic hypotheses were made for pronounced maximum, total motion, and peak velocities within each anatomical plane. The kinematic data for healthy individuals was examined for evidence of the purported high gear movement patterns of the foot. Based on his observations, Bojsen- Moller (1979) described the high gear push-off as a coordinated forefoot pronation and windlass effect occurring in late stance. He suggested that these particular movements produced a rigid foot for efficient push-off. Due to this prior work, a high gear type 111
134 push-off was expected of the control group given their healthy feet and the relatively high walking speed. Specifically, we expected forefoot pronation, that is, dorsiflexion, eversion and abduction in late stance. Contrary to this expectation, there was no evidence of high or low gear push-off kinematics. Subjects instead exhibited forefoot plantarflexion, eversion and adduction in late stance. Closer consideration of Bojsen- Moller s (1979) paper reveals some contradictions. The central idea of his argument was that plantar loading under the metatarsophalangeal joints I and II indicated the high gear push-off, and loading under the metatarsophalangeal joints III, IV and V indicated a low gear push-off. However, a forefoot in high gear cannot exhibit the three aspects of pronation, specifically dorsiflexion, if it is plantarflexing via the windlass mechanism. The combined plantarflexion, eversion, and adduction seen in this study is a reasonable movement pattern to produce loading of metatarsophalangeal joints I and II. These data suggest that the concept of effective propulsion necessitates forefoot pronation needs revision and that propulsion may be achieved in the absence of forefoot pronation. These data build upon what has been described qualitatively and provide some clarity to the coordination of the medial forefoot at late stance. In the characterization of forefoot kinematics in plantar fasciitis feet, movements in the sagittal plane appeared to be most relevant. The ranges of motions in both plantar fasciitis and healthy feet were the largest in the sagittal plane, a finding which was also noted by Hunt et al. (2001). Yet, the forefoot of plantar fasciitis individuals rotated through a greater range of motion than healthy individuals. These findings are consistent with the functional anatomy of the plantar fascia (Hicks, 1954) and the plantar fasciitis injury mechanism. Given that the plantar fascia is oriented longitudinally, forefoot 112
135 dorsiflexion directly produces tension, while frontal and transverse plane motion yield torsional and bending stress. Other studies have recognized the importance of sagittal plane motion as a measurement of loading. For example, it has been shown that there is appreciable rearfoot to forefoot elongation when the foot is loaded, and elongation increases 13 to 40% when the plantar fascia was removed (Arangio et al., 1998). The negative correlation of arch height and arch length has been shown (Kayano, 1986). These data alongside previous anatomical observations and quantitative studies underscores the importance sagittal plane movements of the foot in response to loading. While the majority of the work suggests that deformation of the soft tissues is detrimental, at least when in excess, other research has recognized the benefits of this response. Deformation of the foot and arch has been shown to be an energy saving mechanism (Ker et al., 1987). Given larger deformation of the arch in PF, there may be greater energy storage and return in this population. As such, these forefoot mechanics may indicate energy conservation. More research is needed to offer a conclusion to this matter. Ultimately, the underlying mechanism for why PF individuals exhibited a greater degree of medial longitudinal arch flattening is not clear. It has been said that overpronation and planus feet arise from a host of reasons, including congenital deformity, reduced osseous restraint, muscle action, load and body weight, and soft tissue integrity (Franco, 1987; Ker et al., 1987; Huang et al., 1993; Messier et al., 1994; Kitaoka et al., 1994). The majority of studies have focused on the latter, but none of these studies have specifically addressed differences between healthy and plantar fasciitis feet. When the plantar fascia and other passive structures were resected in vivo, in cadavers and in 113
136 simulation models, the foot became less stiff and the medial longitudinal arch flattened (Huang et al., 1993; Ward et al., 2003; Thordarson et al., 1995; Thordarson et al., 1997; Daly et al., 1992; Arangio et al., 1998). Interestingly, the plantar fascia is the most important structure to the integrity of the arch, and when the vertical load is increased, the arch height decreases (Huang et al., 1993). In the present study, individuals were excluded if they reported a traumatic injury associated with their foot, (e.g. motor vehicle accident, third degree ankle sprain). Presumably, the soft tissues in all subjects were intact. Therefore, it is unlikely that the larger magnitude of forefoot dorsiflexion as seen in PF was due ruptured soft tissues. Other aforementioned characteristics which lead to reduced foot stiffness cannot be excluded, such as greater soft tissue laxity, reduced contribution by muscle, and reduced osseous restraint. In contrast to our findings, Wearing et al. (2004) reported that plantar fasciitis individuals did not differ from healthy subjects in their total sagittal plane motion. Their reports of total sagittal plane motion were larger ( ) in comparison to this study ( ). However, this disparity should be viewed in light of several key differences between studies. First, Wearing et al. (2004) used two dimensional fluoroscopy sampling in the sagittal plane which enabled bone motion to be tracked. Also, Wearing et al. (2004) constrained measurements to the first 80% of stance phase. Most studies, including the present study, indicate that maximum forefoot to rearfoot deflection occurs at around 80% stance (Kayano 1986; Hunt et al. 2001; Chang et al, 2008); therefore, Wearing et al. (2004) may not have measured the true maximum. Also, in the Wearing et al. (2004) study, the sampling rate was relatively slow (15 Hz) and no kinematic time series were reported. Lastly, they studied a smaller sample size, 10 PF 114
137 and 10 healthy individuals. Unfortunately, a paucity of research in arch dynamics in plantar fasciitis individuals leaves no other results to compare. Although it was not the original intent of this research, the results of this study provide some insight into the debate regarding the effects of foot morphology on intrinsic foot kinematics. There are claims in the clinical literature that static foot postures inform clinicians regarding dynamic function and behavior (Subotnick, 1980; Subotnick, 1981; Franco, 1987). Yet, in the current study, group differences were detected in spite of their similar arch ratio and foot posture index. Our findings are in agreement with the quantitative biomechanical studies which have challenged this clinical assertion. Hamill et al. (1989) demonstrated that various clinical static foot measures have limited value in predicting lower extremity biomechanics. Hunt et al. (2000) found that static measures of the arch angle were not correlated to total rearfoot motion. Later, Hunt and Smith (2004) demonstrated that forefoot motion of pes planus feet and normal arched feet were similar in their kinematics. These findings have also held up in studies specific to plantar fasciitis; for instance, Rome et al. (2001) report that quasi-static measures, such as vertical navicular height change from sit-to-stand, have failed to differentiate healthy and plantar fasciitis. A minority of research has shown that feet that are diametrically opposed (arch ratios greater than and less than 1.5 sd) exhibit different rearfoot kinematics (Williams et al., 2001). The present study provides further support that foot function is not solely dictated by foot shape. Furthermore, this study indicates that clinicians should not limit their assessments to static postures of the foot, but should also examine the foot in gait. 115
138 Frontal and transverse plane forefoot kinematics during the loading phase of gait were surprisingly small in comparison to the sagittal plane. There was relatively little movement from 0 to 80% stance from the forefoot s slightly everted and abducted position. Total motions in the transverse plane amounted to about half of the sagittal plane s total motion. Eversion and adduction movements were more rapid in late stance. Discrete kinematic variables did not reach a statistical significance nor exceeded a medium effect size to support the pronounced forefoot motion hypothesis. The total motion results in the frontal plane were indeed larger in the PF group, but the effect sizes indicated only marginal support. The transverse plane PF group produced a small effect in the opposite direction. No differences were seen in the maximum velocity variables. The results suggest that movements in these planes do not contribute as much as the sagittal plane to the loading response of the foot. Given a lack of kinematic response to loading and small ranges of motion, it was concluded that frontal and transverse forefoot motion is not characteristically different in plantar fasciitis feet. Many of these findings have clinical applications as well. For instance, we found that the forefoot dorsiflexion is characteristic of plantar fasciitis and we have assumed that it is a deleterious mechanism to the plantar fascia; therefore, clinicians may intervene accordingly and use this information to scientifically validate treatment modalities. Clinicians should focus on reducing motion at the medial longitudinal arch in the sagittal plane, since the frontal and transverse planes appear less instrumental to plantar fasciitis. Techniques such as orthoses, insoles, taping the foot, strengthening the intrinsic and extrinsic foot muscles may successfully target this area and provide relief to PF sufferers. 116
139 However, more research is needed to determine whether these modalities indeed reduce motion in the sagittal plane. In summary, these findings provide some clarity to the issue of forefoot kinematics during walking gait. These data did not support the basic premise from which we based our hypotheses, that there is forefoot pronation into mid- and late stance. While the foot was indeed in a pronated posture, only dorsiflexion movements were detected; there was essentially no movement in eversion and abduction. The data suggest that the notion of forefoot pronation during propulsion needs revision. In turn, our general hypotheses that PF feet exhibit excessive forefoot pronation were also not fully supported. However, there was strong evidence that plantar fasciitis feet exhibit a greater range of motion in stance in the sagittal plane, therefore, a greater magnitude of arch flattening. Such a movement would subject the plantar fascia to tensile stresses which might lead to plantar fasciitis when excessive. Noteworthy, kinematic differences were found despite the similarities in foot posture and arch index. These data underscore the greater value of dynamic measurements over static measurements in the characterization of plantar fasciitis feet. These data support the clinical belief that plantar fasciitis feet exhibit greater medial longitudinal arch flattening in walking. Rearfoot-Forefoot Coupling and Variability The purpose of this component of the study was threefold. The first purpose was to gain some insight to segmental coordination of the foot. The second purpose was to determine whether plantar fasciitis feet exhibit more frequent anti-phase movements than healthy feet. The third purpose was to determine whether there are differences in coordinative variability between healthy and plantar fasciitis feet. We hypothesized that 117
140 the coupling angles would differ between healthy and plantar fasciitis feet. Also, we hypothesized that plantar fasciitis feet would exhibit more frequent anti-phase movements than healthy feet. Lastly, we hypothesized that plantar fasciitis feet would exhibit reduced levels of coordinative variability. When the present data were compared to those of our previous study of healthy subjects (Chang et al. 2008), there was a high level of agreement in the sagittal plane and less agreement in the frontal and transverse planes. In the present study, the frontal angle-angle plot was parabolic in shape but the same plot in the previous study was rounded with an enclosed area. The transverse plane in this study did not exhibit obvious horizontal, diagonal and vertical components that were observed in the past. Differences were likely due to the methodology. The considerable effects of the forefoot segment were noted earlier in this discussion (medial forefoot versus generalized forefoot model). Also, the sample size of Chang et al. (2008) was small (n=3) in comparison. By using a more relevant medial forefoot model and a larger sample size, we believe that the present results produce a more valid estimation of healthy and plantar fasciitis coordination. Coupling and coordination histograms provided valuable insight to the movements patterns of the foot in gait, particularly when examined along side the traditional kinematic time series. In-phase coupling was the majority movement pattern, and this was to be expected since the forefoot and rearfoot move as a unit through space together. However, the more subtle coordination patterns were well represented also. For instance during early and mid-stance in the sagittal plane, frequent rearfoot phases indicated that rearfoot movements rather than forefoot movements, contributed more to elongation of the medial longitudinal arch. In late stance, coordination was in-phase 118
141 which is appropriate for coordinating an effective push-off. In regards to the frontal plane, both in-phase and forefoot phase movements were frequent in early stance. Inphase eversion movements were observed first, and then the forefoot continued to evert while the rearfoot reached a maximum. However in late stance, rearfoot motion was the dominant movement pattern (secondary to in-phase movements). Therefore, medial forefoot eversion as indicated by the kinematic data resulted from rearfoot inversion (not forefoot motion). This is contrary to Bojsen-Moller s (1979) thesis that suggests that it is the forefoot which leads this movement pattern. These data are plausible given that the rearfoot is off the floor and inverting while forefoot cannot rotate relative to the floor and is therefore plantigrade. Lastly in the transverse plane, a forefoot phase was apparent at late stance in the healthy individuals to effect an adducted forefoot at propulsion. A key finding of the coupling results was that coordinative patterns between the rearfoot and forefoot are not as straight forward as implied in the literature. Anti-phase movements were expected in late stance, however, the data did not support this expectation. Coordination patterns were constantly evolving through a rich array of movement patterns during the stance phase of gait. The hypothesis that the groups would differ in their coordination patterns was not supported by statistical examination of the coupling angle data. The groups were similar in coupling angle time series, and no significant group differences were found in the coupling angles across the three stance periods. Interestingly, PF and healthy individuals were least similar at 20-30% stance, a time period which coincided with the first peak in the vertical ground reaction forces. These subtle coupling angle data differences were seen despite unremarkable differences in joint kinematics using standard techniques. 119
142 Given that there appeared to be differences at 20-30% stance, further research is warranted to determine whether the method in which the data were analyzed masked differences. Despite a lack of differences in the overall coupling angles, there were group differences in the frequency of anti-phase movements. These data did not support the hypothesis that plantar fasciitis individuals exhibit greater anti-phase movements, and in fact, the opposite was found plantar fasciitis feet are associated with reduced anti-phase movements. These findings, however, are consistent research on upper body coordination. Reduced anti-phase movements and increased inter-segmental rigidity of the pelvic-thoracic segments has been reported in Parkinsonism (Van Emmerik et al., 1999) as well as chronic low back pain (Selles et al., 2001; Lamoth et al., 2006). It has been speculated that lesser anti-phase motion is indicative of guarding behavior against pain. Lamoth et al. (2006) reported increased and more erratic lumbar muscle activity, which may impair inter-segmental coordination and increase rigidity. Such pain guarding strategies and increased muscle activity might also play a role in reducing anti-phase motions in plantar fasciitis individuals. It is proposed that anti-phase motion of the rearfoot and forefoot is functional and allows for fluid movements in gait. For the most part, coupling variability results were consistent with the characteristics of dynamical systems. Peaks in variability did coincide with abrupt changes in the coordinative modes (plateaus in the coupling angles). At approximately 20 to 30% of stance, there were critical fluctuations (high levels of coupling variability) and erratic coupling angles in all planes. This is consistent with the characteristics of a transitory period (Kelso, 1984; Kelso, 1995). Another transitory period was seen at
143 70% stance in the frontal plane such that variability remained high as the coupling angles evolved. As evidence of a return to stability following a transition, the coordination variability in the sagittal plane was negligible at 70 to 100% stance and coupling angles exhibited little change. It is perhaps a relevant finding that peak variability at 20-30% of stance coincided with the peak in the vertical ground reaction force. Some variability data were not that consistent with dynamical systems theory. In the transverse plane, at 80 to 100% stance coupling angles were evolving rapidly, but the respective variability was very low. More research is needed to determine whether it is appropriate to use dynamical systems theory with a vector coding technique in rearfoot-forefoot coordination analysis. These data partially support the dynamical systems based hypothesis that reduced variability is associated with pathology. In the sagittal and frontal planes, healthy and plantar fasciitis individuals exhibited similar levels of coordinative variability. In the transverse plane, however, plantar fasciitis individuals exhibited reduced magnitudes of variability in comparison to their healthy counterparts. A visual examination of the variability time-series indicates that the PF group was clearly lacking a third peak in variability at 70% of stance. A lack of variability results in coordinative similarity from one cycle to the next and a loss of complexity. It has been suggested that an injured state may be prolonged by repeatable stress (Hamill et al. 1999). This time period may have functional implications for the foot in stance phase; it coincided with beginning of a distinctive forefoot adduction phase, and the second peak in the vertical ground reaction forces. A loss of coordinative variability has also been seen in Parkinson s disease (Van Emmerik et al., 1999), and patellofemoral pain (Hamill et al., 1999; Heiderscheit et al., 121
144 1999; Heiderscheit et al., 2000; Heiderscheit et al., 2002). These data were consistent with previous human movement data which has associated pathology with a loss of complexity at transition periods. There are limitations in computing mean coupling angles over predetermined stance periods. A given time period may straddle distinct coupling angle plateaus, or span rapidly evolving coordination patterns. Therefore, mean coupling angle quantities may lose some of their contextual meaning. Correspondingly, standard deviations may be inflated making it more difficult to detect statistical differences (linear or circular). Accommodations to the challenges in handling coupling angles are seen in other studies. Coupling angles have been constrained from 0 to 45 and 0 to 90 (Ferber et al., 2005; Dierks and Davis, 2007). By doing so, coordinative information has been compressed or distorted if the coupling angles cross the boundaries and span the unit circle. We chose to divide the total stance period into thirds to approximate the loading response of walking gait. Group differences may have been detected with more functionally relevant time periods, however, it is a challenge to objectively define these time periods. Prominent coordination patterns are easily identified from the coordination histograms, but these data are not without limitations either. One of their strengths lies in the use of all data points over a cycle, as opposed to a reduction of data to a mean or some other metric. Like coupling angles, they also suffer from the limitations of predetermined time periods. The nature of these data is unique; the data are dependent, non-normal and categorical in nature. Also, each phase has a ceiling of 33 observations. If these data were normal, each movement pattern would have an expected value of The authors are not aware of any statistical procedure which would be appropriate for 122
145 non-normal categorical data to compare two groups considering 4 coordination factors and 3 stance periods. Currently, a comparison of means and t-tests between a given coupling pattern (i.e. anti-phase patterns) seem most appropriate. As a relatively new and technique in limited use, there are methodological issues that would benefit from more experimentation. In summary, rearfoot-forefoot coupling angles indicated a rich array and evolution of coordination patterns which would not have been realized without the use of the expanded vector coding technique. While in-phase movements were predominant, the more subtle coordination modes were also well represented. It was found that forefoot to rearfoot eversion was a product of rearfoot segment inversion, rather than forefoot segment eversion. No group differences were found with mean coupling angles. Contrary to our hypothesis, anti-phase data were more frequent in healthy subjects. Based on similar observations in research on upper body coordination, it is proposed that anti-phase movements are functional, and when reduced, indicate pain guarding strategies. There was also some support for hypothesis that there would be reduced variability with pathology. Plantar fasciitis individuals lacked a peak in variability at 70% of stance in the transverse plane. Reduced variability may prolong symptoms in these chronic plantar fasciitis feet. As a first study to use vector coding in intrinsic foot mechanics research, more research is needed to refine the technique for the context of this research problem. FMPJ Motion, FMPJ - MLA Coupling and Variability The plantar fascia mediates motion between the first metatarso-phalangeal joint motion and the medial longitudinal arch angle through the windlass mechanism (Hicks, 123
146 1954). The purpose of this study was to determine whether there are changes in FMPJ motion and the windlass mechanism in plantar fasciitis. We hypothesized that PF would alter the coupling of the FMPJ and MLA in late stance. We also hypothesized that the plantar fasciitis individuals would exhibit reduced coordinative variability consistent with dynamical systems theory. The measured FMPJ movement patterns and touchdown values agree with previous literature (Mann and Hagy, 1979). Some differences, however, were noted in the present peak dorsiflexion values in comparison to the literature. The group mean in this study of 51.2 was lower than the 70 to 90 range reported by Mann and Hagy (1979), but greater than others who have reported (Nawoczenski et al., 1999; Nawoczenski and Ludewig, 2004; Halstead et al., 2005). These discrepancies were likely due to different methodology and instrumentation. With the exception of a high speed cinema technique by Mann and Hagy (1979), all above mentioned studies used a three dimensional electromagnetic system, which has been shown to be highly reliable (Umberger et al., 1999). The cube shaped transmitters of electromagnetic systems are relatively large (length and width 96 mm), tethered and presumably heavier than the small wireless markers used in the present study (8 mm diameter hollow ball on plastic disc). Also, the present approach was 2D in nature and the limitations of 2D have been discussed previously (Areblad et al., 1990). Despite the limitations of 2D analyses, these data reside within the normative range of motion for the FMPJ (Shereff et al., 1986; Allen and Gross, 2003), and may represent a more natural and unobstructed movement pattern than some previous literature. 124
147 In general, the kinematic data of the FMPJ and medial longitudinal arch were in accord with the purported windlass mechanism (Hicks 1954), but it was clear that the FMPJ did not entirely dictate MLA kinematics. There was dorsiflexion of the FMPJ from 60 to 90% of stance. Such a movement is believed to wind and tighten the plantar fascia and result in an increasing medial arch height (forefoot plantar flexion). However, forefoot plantar flexion was not initiated until approximately 80% of stance. This delay may indicate the dominance of loading which flattens the medial longitudinal arch. Later, from % of stance, the medial longitudinal arch kinematics were not consistent with the windlass mechanism yet again. The FMPJ plantar flexed (a release of the plantar fascia tension) yet the medial longitudinal arch continued to rise. Therefore, other factors, such as intrinsic muscle activity (Mann and Inman, 1964) are likely to contribute to the plantarflexion of the medial longitudinal arch kinematics. The results of this study indicate that some intrinsic foot kinematics can be ascribed to the windlass mechanism, but the windlass mechanism is most certainly not the only factor. Plantar fasciitis individuals exhibited greater peak dorsiflexion of the first metatarso-phalangeal joint, a movement pattern that might predispose an individual to plantar fasciitis, or prolong injury. Cadaver models (Hicks, 1951; Carlson et al., 2000; Flanigan et al., 2007), and more recent finite element analyses (Cheng et al., 2008) have confirmed that tension in the plantar fascia rises directly with the magnitude of toe dorsiflexion. Furthermore, it has been shown that there is a stress concentration in the plantar fascia under the first ray and medial calcaneal tubercle (Cheng et al., 2008), supporting the tenet that the FMPJ contributes relatively more than the lesser toes to the windlass mechanism (Hicks, 1951). These locations of high stress also coincide with 125
148 sites of pain which plantar fasciitis patients typically report. Elevated FMPJ dorsiflexion over multiple cycles, such as in walking gait, could put undue strain on the plantar fascia thereby predisposing or prolonging a state of plantar fasciitis. While no direct strain measurements were made in this study, these data provide some insight to injury causation and also differentiate PF feet from healthy feet. The data did not support the hypothesis that plantar fasciitis would be associated with alterations in the coupling or frequency of anti-phase movements between the FMPJ and the medial longitudinal arch in late stance. There were no group differences in the mean coupling angles and the coupling angle time series did not appear remarkably different from one group to the next. These data are somewhat contrary to studies which have shown that this coupling is not invariant across feet. By testing the windlass mechanism via passive FMPJ dorsiflexion in healthy feet, Kappel-Bargas et al. (1998) identified two distinct populations. Some individual exhibited changes in the MLA angle upon 4.1 of passive dorsiflexion, while others exhibit changes at They speculated that a differential response had implications to injury. In a rupture to the plantar fascia, albeit a more extreme injury, the windlass response is absent (Theodorou et al., 2000), and therefore the coupling is disrupted. It is possible that the limitations of mean coupling angles, which were discussed earlier, masked group differences. It is also possible that plantar fasciitis is not a sufficient injury to perturb the windlass mechanism. While recognizing methodological limitations, the data indicate that the coordination of the FMPJ and MLA remained unchanged with plantar fasciitis. These data refuted the hypothesis that the plantar fasciitis feet would exhibit reduced coordinative variability of the FMPJ-MLA couple. The results were in fact the 126
149 opposite as PF feet exhibited more than double the variability of their healthy counterparts. This was an unusual finding given that pathology has been associated with reduced variability (Hamill et al., 1999; Van Emmerik and van Wegen, 2000). It is possible, however, that such a high level of variability in comparison to the healthy foot was detrimental. Previous applications of dynamical systems theory have not examined couplings that are analogous to the windlass mechanism. As of yet, there is no measure of stability or efficacy of the windlass mechanism. While these analyses identified differences in coordinative variability, more research is needed to interpret the meaning of these findings given the unique stabilizing effects of the windlass mechanism. Since it was found that PF subjects exhibit increased FMPJ dorsiflexion, these data provide some validation for certain practices which clinician s use to reduce FMPJ dorsiflexion in the treatment of treat plantar fasciitis. Clinicians have used semi-rigid orthoses designed with a first ray extension from the three-quarter line (Morton s extension), forefoot rocker soles (Janisse and Janisse, 2008), and gait plates. Intrinsic and extrinsic muscles may also be strengthened to increase the internal plantarflexion moment at the FMPJ by primarily targeting muscles which cross the FMPJ: flexor hallucis longus, flexor hallucis brevis, and flexor digitorum brevis. These data encourage clinician s to pursue such practices. Ground Reaction Forces (GRF) There is little agreement on how GRF profiles in PF may differ from healthy individuals. Due to the inconsistent findings, the purpose of this study was to characterize GRF profiles in healthy and plantar fasciitis individuals with a particular focus on peak vertical GRF. Subjects walked barefoot over a force plate at a fixed speed. 127
150 Overall, the GRF profiles reported in the present study are consistent with other reports for healthy adults (Chao et al., 1983; Hunt et al., 2001; Barrios et al., 2009). It was found that plantar fasciitis feet have reduced vertical ground reaction forces during propulsion in comparison to healthy feet. In contrast, peak vertical GRF at loading were not different between groups. We propose that the reduced vertical GRF at propulsion reflects a compensatory response which reduces plantar fascia loading and, therefore, further injury and pain. The proposition that reduced GRF at late-stance (propulsion) is a compensatory strategy is supported by the kinematics of the rearfoot-forefoot and the tension profile of the plantar fascia. The kinematic data indicated that the forefoot dorsiflexed (medial longitudinal arch flattening) from heel strike to about 80% of stance. It may be inferred that the plantar fascia and other passive structures that span the plantar foot, lengthened during this period. Studies that have instrumented dynamic cadaver models have reported that at ~80% stance, plantar fascia loads reach their peak at approximately one body weight (Erdemir et al., 2004). Tension was negligible in early stance. Similarly, computer simulation models of running gait also confirm low plantar fascia loads in early stance and that peak fascia load occurring at mid- and into late stance (Scott and Winter 1990). Presumably, a reduction in vertical GRF in turn reduces forefoot dorsiflexion, lengthening and peak tension of the plantar fascia, and pain. Anecdotally, some patients report tenderness specifically during propulsion. Simulation and/or direct measures of plantar fascia tension, which were not made in the present study, are needed to confirm this compensatory strategy. Ground reaction force profiles do not replace direct tension measurements, but since the forefoot is the contact point of the body and the ground at 128
151 propulsion, GRF profiles may provide some valuable insight to the mechanics of the plantar fascia. Previous findings in regards to peak GRF in PF have been inconsistent, but the issue of walking speed has been overlooked. It is well known that peak GRF increase with increased walking speed (Andriacchi et al., 1977). Furthermore, past studies were conducted at self-selected speeds which were slower than the present study. This experimental approach has compromised comparison of GRF results of one group to the other and may account for inconsistent findings. For example, Katoh and colleagues (1983) reported that PF subjects were associated with reduced peak forces in the vertical GRF profile, both at loading and at propulsion. However, PF subjects walked more slowly (mean = 1.19 ms -1 ) than controls (mean 1.38 ms -1 ) and therefore, GRF differences were confounded by walking speed. Other studies, which were also conducted at a selfselected pace, have refuted the findings of Katoh et al., (1983). Two studies (Wearing et al., 2003; Liddle et al., 2000) reported no differences in the magnitudes of the vertical ground reaction forces in comparisons of symptomatic feet, asymptomatic contra-lateral feet, and healthy individuals. Neither study addressed the possibility of walking speed as a confounding factor. The estimated walking speeds by Wearing et al. (2003) were slow (0.8 to 1.0 ms -1 ) with respect to the present speed. Slower self-selected walking speeds may not have taxed the active and passive structures of the foot sufficiently to elicit an observable compensatory GRF profile. Future studies may also control stride length and stride rate (Martin and Marsh, 1992). The current walking speed was more challenging and slightly greater than the overall preferred walking speed and therefore elicited differences in ground reaction forces. 129
152 Limitations This study has limitations, many of which have been addressed in their relevant discussion sections. In addition to those already mentioned, this study s case-control design and, therefore, retrospective nature is an overriding limitation. In view of the case-control design, the present significant findings, and in particular the kinematic results which were found to be in the theoretical direction of injury causing, can only suggest causation. It should be highlighted though, that the plantar fasciitis individuals which were included in this study were considered chronic cases of plantar fasciitis (symptomatic for more than three months). Therefore, it is quite plausible that the kinematic differences perpetuated the state of injury. Nevertheless, this study has characterized aspects of plantar fasciitis which may serve as a basis for future research. The use of skin markers for bone pose estimation has limitations, and numerous precautions were taken to minimize problems associated with this technique. Skin markers were pursued over bone pinned markers since they are non-invasive and practical. It has been shown that skin markers oscillate (Karlsson and Tranberg, 1999), their spatial information only approximate the underlying bone position (Reinschmidt et al., 1997), and there is variability in researchers ability to identify anatomical landmarks. Despite such problems, other researcher have found that markers fixed to the skin of the foot have high-levels of correlation with corresponding bony landmarks in their movement patterns in the vertical and antero-posterior directions (Wrbaskic and Dowling, 2007). Furthermore, we took precautions to minimize the errors associated with skin markers. First, the Leardini et al. (2007) marker set used in this study was designed to avoid tendon elevation artifacts. Second, the markers used in this study were 130
153 a relatively small size in comparison to other protocols. Thus, the markers were unobtrusive and light which in turn minimized erroneous oscillations. Third, the variability due to inter-tester marker placement was circumvented by having an experienced certified pedorthist prepare all subject landmarks. Everything considered, we believe that the errors associated with skin markers were reduced to the best of our abilities. While the biomechanics of plantar fasciitis feet were the focus of this study, the development of plantar fasciitis is multi-factorial. Various intrinsic (e.g. pronation, low arch, high arch, muscle weakness, age) and extrinsic factors (e.g. footwear, activity level, activity type, surface properties) have been identified to predispose individuals to this injury (Wearing et al., 2006). This study in no way diminishes the contribution of these factors to the development of plantar fasciitis and we recognize that they play important roles in the aetiology of this overuse injury. Overall Summary and Conclusion This study characterized healthy and plantar fasciitis feet in 3D via multi-segment foot modeling, vector coding, dynamical systems theory, and force platform measurements. The findings of this study challenged a fundamental theory of healthy foot mechanics. Instead of the typically described forefoot pronation of late stance, there was forefoot eversion, plantarflexion and adduction. Furthermore, coordination data indicated that forefoot eversion was primarily due to rearfoot segmental inversion in late stance as the forefoot segment remained in a planti-grade position. There were kinematic differences between healthy and plantar fasciitis feet which to an extent, support the purported aetiology of plantar fasciitis. In comparison to healthy 131
154 feet it was found that plantar fasciitis feet exhibited greater rearfoot eversion in midstance. Then towards late stance, plantar fasciitis feet flattened to a greater extent in the medial longitudinal arch (forefoot dorsiflexion) and exhibited more FMPJ dorsiflexion. Kinematic differences were seen in spite of similar static foot anthropometry, therefore, these results underscore the importance of dynamic, as opposed to simply static examinations of the pathological foot. Contrary to the hypothesis, there was more frequent anti-phase motion in the frontal plane of healthy subjects than plantar fasciitis. Therefore, the ability to produce these counter-rotations may be an indication of a healthy state, which has been shown in upper extremity research. When plantar fasciitis and healthy feet were examined from a dynamical systems perspective, there was some support for the hypothesis that there would be reduced variability with pathology. In comparison to their healthy counterparts, plantar fasciitis individuals exhibited reduced variability at late stance in the transverse plane. It has been suggested that reduced variability may prolong symptoms of overuse injuries. However, the data refuted the hypothesis that plantar fasciitis feet would exhibit reduced FMPJ- MLA coordinative variability. We speculate that these contrary findings are related to the unique stabilizing effects of the windlass mechanism. Differences in vertical ground reaction forces, namely a reduced propulsion peak, suggested that plantar fasciitis feet exhibited a compensatory pain response. Kinematic with GRF data indicate that the plantar fascia was lengthening under a tensile load. It would have likely been more painful at the plantar fascia had the plantar fasciitis subjects exhibited ground reaction forces comparable to healthy subjects. 132
155 References Allen, R. H., Gross, M. T., (2003). Toe flexors strength and passive extension range of motion of the first metatarsophalangeal joint in individuals with plantar fasciitis. Journal of Orthopaedic and Sports Physical Therapy 33, Andriacchi, T. P., Ogle, J. A., Galante, J. O., (1977). Walking speed as a basis for normal and abnormal gait measurements. Journal of Biomechanics 10, Arangio, G. A., Chen, C., Salathe, E. P., (1998). Effect of varying arch height with and without the plantar fascia on the mechanical properties of the foot. Foot & Ankle International 19, Arangio, G. A., Phillippy, D. C., Xiao, D., Gu, W. K., Salathe, E. P., (2000). Subtalar pronation--relationship to the medial longitudinal arch loading in the normal foot. Foot & Ankle International 21, Arndt, A., Wolf, P., Liu, A., Nester, C., Stacoff, A., Jones, R., Lundgren, P., Lundberg, A., (2007). Intrinsic foot kinematics measured in vivo during the stance phase of slow running. Journal of Biomechanics 40, Barrios, J. A., Davis, I. S., Higginson, J. S., Royer, T. D., (2009). Lower extremity walking mechanics of young individuals with asymptomatic varus knee alignment. Journal of Orthopaedic Research 27, Batschelet, E., (1981). Circular statistics in biology. Academic Press, London. Bojsen-Moller, F., (1979). Calcaneocuboid joint and stability of the longitudinal arch of the foot at high and low gear push off. Journal of Anatomy 129, Carlson, R. E., Fleming, L. L., Hutton, W. C., (2000). The biomechanical relationship between the tendoachilles, plantar fascia and metatarsophalangeal joint dorsiflexion angle. Foot & Ankle International 21, Chao, E. Y., Laughman, R. K., Schneider, E., Stauffer, R. N., (1983). Normative data of knee joint motion and ground reaction forces in adult level walking. Journal of Biomechanics 16, Cohen, J., (1988). Statistical power for the behavioral sciences. Lawrence Erlbraum Associates, New York. Cole, G. K., Nigg, B. M., Ronsky, J. L., Yeadon, M. R., (1993). Application of the joint coordinate system to 3-dimensional joint attitude and movement representation - a standardization proposal. Journal of Biomechanical Engineering 115,
156 Daly, P. J., Kitaoka, H. B., Chao, E. Y., (1992). Plantar fasciotomy for intractable plantar fasciitis: clinical results and biomechanical evaluation. Foot & Ankle 13, Dierks, T. A., Davis, I., (2007). Discrete and continuous joint coupling relationships in uninjured recreational runners. Clinical Biomechanics 22, Donatelli, R., (1987). Abnormal biomechanics of the foot and ankle. Journal of Orthopaedic & Sports Physical Therapy 9, Erdemir, A., Hamel, A. J., Fauth, A. R., Piazza, S. J., Sharkey, N. A., (2004). Dynamic loading of the plantar aponeurosis in walking. Journal of bone and joint surgery. American volume 86-A, Ferber, R., Davis, I. M., Williams, D. S., III, (2005). Effect of foot orthotics on rearfoot and tibia joint coupling patterns and variability. Journal of Biomechanics 38, Flanigan, R. M., Nawoczenski, D. A., Chen, L., Wu, H., DiGiovanni, B. F., (2007). The influence of foot position on stretching of the plantar fascia. Foot & Ankle International 28, Franco, A. H., (1987). Pes cavus and pes planus. Analyses and treatment. Physical Therapy 67, Halstead, J., Turner, D. E., Redmond, A. C., (2005). The relationship between hallux dorsiflexion and ankle joint complex frontal plane kinematics: a preliminary study. Clinical Biomechanics 20, Hamill, J., Van Emmerik, R. E., Heiderscheit, B. C., Li, L., (1999). A dynamical systems approach to lower extremity running injuries. Clinical Biomechanics 14, Heiderscheit, B. C., Hamill, J., Caldwell, G. E., (2000). Influence of Q-angle on lowerextremity running kinematics. Journal of Orthopaedic and Sports Physical Therapy 30, Heiderscheit, B. C., Hamill, J., Van Emmerik, R. E., (1999). Q-angle influences on the variability of lower extremity coordination during running. Medicine and Science in Sports and Exercise 31, Heiderscheit, B. C., Hamill, J., Van Emmerik, R. E. A., (2002). Variability of stride characteristics and joint coordination among individuals with unilateral patellofemoral pain. Journal of Applied Biomechanics 18, Hicks, J. H., (1951). The Function of the Plantar Aponeurosis. Journal of Anatomy 85,
157 Huang, C. K., Kitaoka, H. B., An, K. N., Chao, E. Y., (1993). Biomechanical evaluation of longitudinal arch stability. Foot & Ankle 14, Hunt, A. E., Fahey, A. J., Smith, R. M., (2000). Static measures of calcaneal deviation and arch angle as predictors of rearfoot motion during walking. The Australian Journal of Physiotherapy 46, Hunt, A. E., Smith, R. M., (2004). Mechanics and control of the flat versus normal foot during the stance phase of walking. Clinical Biomechanics 19, Hunt, A. E., Smith, R. M., Torode, M., Keenan, A. M., (2001). Inter-segment foot motion and ground reaction forces over the stance phase of walking. Clinical Biomechanics 16, Kappel-Bargas, A., Woolf, R. D., Cornwall, M. W., McPoil, T. G., (1998). The windlass mechanism during normal walking and passive first metatarsalphalangeal joint extension. Clinical Biomechanics 13, Karlsson, D., Tranberg, R., (1999). On skin movement artefact-resonant frequencies of skin markers attached to the leg. Human Movement Science 18, Katoh, Y., Chao, E. Y., Morrey, B. F., Laughman, R. K., (1983). Objective technique for evaluating painful heel syndrome and its treatment. Foot & Ankle 3, Kayano, J., (1986). Dynamic function of medial foot arch. Nippon Seikeigeka Gakkai Zasshi 60, Kelso, J. A. S., (1984). Phase-transitions and critical-behavior in human bimanual coordination. American Journal of Physiology 246, Kelso, J. A. S., (1995). Dynamic Patterns - The Self-Organization of Brain and Behavior. MIT Press, Cambridge, MA. Ker, R. F., Bennett, M. B., Bibby, S. R., Kester, R. C., Alexander, R. M., (1987). The spring in the arch of the human foot. Nature 325, Kidder, S. M., Abuzzahab, F. S., Jr., Harris, G. F., Johnson, J. E., (1996). A system for the analysis of foot and ankle kinematics during gait. IEEE Transactions on Rehabilitation Engineering 4, Kitaoka, H. B., Luo, Z. P., Growney, E. S., Berglund, L. J., An, K. N., (1994). Material properties of the plantar aponeurosis. Foot & Ankle International 15, Kwong, P. K., Kay, D., Voner, R. T., White, M. W., (1988). Plantar fasciitis - mechanics and pathomechanics of treatment. Clinics in Sports Medicine 7,
158 Lamoth, C. J., Meijer, O. G., Daffertshofer, A., Wuisman, P. I., Beek, P. J., (2006). Effects of chronic low back pain on trunk coordination and back muscle activity during walking: changes in motor control. European Spine Journal 15, Liddle, D., Rome, K., Howe, T., (2000). Vertical ground reaction forces in patients with unilateral plantar heel pain - a pilot study. Gait & Posture 11, Liu, W., Siegler, S., Hillstrom, H., Whitney, K., (1997). Three-dimensional, six-degreesof-freedom kinematics of the human hindfoot during the stance phase of level walking. Human Movement Science 16, Mann, R., Inman, V. T., (1964). Phasic activity of intrinsic muscles of the foot. Journal of bone and joint surgery. American volume 46, Mann, R. A., Hagy, J. L., (1979). The function of the toes in walking, jogging and running. Clinical Orthopaedics and Related Research Manter, J. T., (1941). Movements of the subtalar and transverse tarsal joints. Anatomical Record 80, Martin, P. E., Marsh, A. P., (1992). Step length and frequency effects on ground reaction forces during walking. Journal of Biomechanics 25, Messier, S. P., Davies, A. B., Moore, D. T., Davis, S. E., Pack, R. J., Kazmar, S. C., (1994). Severe obesity: effects on foot mechanics during walking. Foot & Ankle International 15, Moseley, L., Smith, R., Hunt, A., Gant, R., (1996). Three-dimensional kinematics of the rearfoot during the stance phase of walking in normal young adult males. Clinical Biomechanics 11, Nawoczenski, D. A., Baumhauer, J. F., Umberger, B. R., (1999). Relationship between clinical measurements and motion of the first metatarsophalangeal joint during gait. Journal of bone and joint surgery. American volume 81, Nawoczenski, D. A., Ludewig, P. M., (2004). The effect of forefoot and arch posting orthotic designs on first metatarsophalangeal joint kinematics during gait. Journal of Orthopaedic and Sports Physical Therapy 34, Nester, C. J., Liu, A. M., Ward, E., Howard, D., Cocheba, J., Derrick, T., Patterson, P., (2007). In vitro study of foot kinematics using a dynamic walking cadaver model. Journal of Biomechanics 40, Pohl, M. B., Buckley, J. G., (2008). Changes in foot and shank coupling due to alterations in foot strike pattern during running. Clinical Biomechanics 23,
159 Prichasuk, S., Subhadrabandhu, T., (1994). The relationship of pes planus and calcaneal spur to plantar heel pain. Clinical Orthopaedics and Related Research Rattanaprasert, U., Smith, R., Sullivan, M., Gilleard, W., (1999). Three-dimensional kinematics of the forefoot, rearfoot, and leg without the function of tibialis posterior in comparison with normals during stance phase of walking. Clinical Biomechanics 14, Redmond, A. C., Crosbie, J., Ouvrier, R. A., (2006). Development and validation of a novel rating system for scoring standing foot posture: the Foot Posture Index. Clinical Biomechanics 21, Reinschmidt, C., vandenbogert, A. J., Nigg, B. M., Lundberg, A., Murphy, N., (1997). Effect of skin movement on the analysis of skeletal knee joint motion during running. Journal of Biomechanics 30, Sarrafian, S. K., (1983). Anatomy of the Foot and Ankle. Descriptive, Topographic, Functional. J.B. Lippincott Co., Philadelphia, PA. Selles, R. W., Wagenaar, R. C., Smit, T. H., Wuisman, P. I., (2001). Disorders in trunk rotation during walking in patients with low back pain: a dynamical systems approach. Clinical Biomechanics 16, Shama, S. S., Kominsky, S. J., Lemont, H., (1983). Prevalence of non-painful heel spur and its relation to postural foot position. Journal of the American Podiatry Association 73, Shereff, M. J., Bejjani, F. J., Kummer, F. J., (1986). Kinematics of the first metatarsophalangeal joint. Journal of bone and joint surgery. American volume 68, Subotnick, S. I., (1980). The cavus foot. The Physician and Sportsmedicine 8, Subotnick, S. I., (1981). The flat foot. The Physician and Sportsmedicine 9, Taunton, J. E., Clement, D. B., McNicol, K., (1982). Plantar fasciitis in runners. Canadian journal of applied sport sciences. Journal canadien des sciences appliquées au sport 7, Theodorou, D. J., Theodorou, S. J., Kakitsubata, Y., Lektrakul, N., Gold, G. E., Roger, B., Resnick, D., (2000). Plantar fasciitis and fascial rupture: MR imaging findings in 26 patients supplemented with anatomic data in cadavers. Radiographics 20 Spec No, S181-S
160 Thordarson, D. B., Kumar, P. J., Hedman, T. P., Ebramzadeh, E., (1997). Effect of partial versus complete plantar fasciotomy on the windlass mechanism. Foot & Ankle International 18, Thordarson, D. B., Schmotzer, H., Chon, J., Peters, J., (1995). Dynamic support of the human longitudinal arch. A biomechanical evaluation. Clinical Orthopaedics and Related Research Umberger, B. R., Nawoczenski, D. A., Baumhauer, J. F., (1999). Reliability and validity of first metatarsophalangeal joint orientation measured with an electromagnetic tracking device. Clinical Biomechanics 14, Van Emmerik, R. E., Wagenaar, R. C., Winogrodzka, A., Wolters, E. C., (1999). Identification of axial rigidity during locomotion in Parkinson disease. Archives of Physical Medicine and Rehabilitation 80, Van Emmerik, R. E. A., van Wegen, E. E. H., (2000). On variability and stability in human movement. Journal of Applied Biomechanics 16, Ward, E. D., Smith, K. M., Cocheba, J. R., Patterson, P. E., Phillips, R. D., (2003). In vivo forces in the plantar fascia during the stance phase of gait: sequential release of the plantar fascia. Journal of the American Podiatric Medical Association 93, Warren, B. L., (1990). Plantar fasciitis in runners. Treatment and prevention. Sports Medicine 10, Wearing, S. C., Smeathers, J. E., Urry, S. R., (2003). The effect of plantar fasciitis on vertical foot-ground reaction force. Clinical Orthopaedics and Related Research Williams, D. S., McClay, I. S., Hamill, J., Buchanan, T. S., (2001). Lower extremity kinematic and kinetic differences in runners with high and low arches. Journal of Applied Biomechanics 17, Wolf, P., Stacoff, A., Liu, A., Nester, C., Arndt, A., Lundberg, A., Stuessi, E., (2008). Functional units of the human foot. Gait & Posture 28, Wrbaskic, N., Dowling, J. J., (2007). An investigation into the deformable characteristics of the human foot using fluoroscopic imaging. Clinical Biomechanics 22,
161 CHAPTER V PART II IS THERE MUSCLE ATROPHY OF THE PLANTAR INTRINSIC FOOT MUSCLES AND TIBIALIS POSTERIOR WITH CHRONIC PLANTAR FASCIITIS? Abstract It has been shown that plantar intrinsic foot muscles (PIFM), the tibialis posterior muscle, and the plantar fascia play a significant role in providing dynamic support to the medial longitudinal arch. Muscle atrophy may occur in individuals with chronic plantar fasciitis, thereby compromising the supportive role offered by these muscles and thus perpetuating a state of injury. The purpose of this study was to determine the distribution of the PIFM, and whether chronic plantar fasciitis is accompanied by atrophy of PIFM and tibialis posterior muscle. Foot and leg magnetic resonance images were taken in seven subjects with unilateral plantar fasciitis so that the healthy foot could be compared to the plantar fasciitis foot within the same subject. Muscle areas were digitally outlined for each series of images and cross sectional areas (CSA) were computed. In comparison to healthy feet, plantar fasciitis feet were associated with a 5.2% reduction in PIFM CSA at the forefoot (p=0.03), but not at the rearfoot (p=0.26). No mean differences were seen in the tibialis posterior muscle, but significant atrophy was observed in one subject when the leg ipsilateral to the plantar fasciitis foot was compared to the healthy leg. Atrophy of the forefoot PIFM may destabilize the medial longitudinal arch and prolong the healing process. Clinicians may intervene by testing for muscle strength deficits and strengthening the forefoot muscles, particularly at the first metatarso-phalangeal joint. 139
162 Introduction It has been postulated that muscle weakness may be a potential cause of plantar fasciitis (Chandler and Kibler, 1993; Wearing et al., 2006). Alongside passive tissues and osseous constraints, studies have shown that the plantar intrinsic foot muscles (PIFM) (Mann and Inman, 1964; Fiolkowski et al., 2003; Headlee et al., 2008; Wong, 2007) and the tibialis posterior muscle (Kitaoka et al., 1997) play an important role in providing dynamic support to the medial longitudinal arch. A reduction in muscle strength may prolong the healing process by putting added stress onto the already compromised plantar fascia. However, only two studies have examined how muscle properties are changed under the stress of chronic plantar fasciitis symptoms. These studies indicate plantar fasciitis may be associated with a reduction in plantar flexor toe strength (Allen and Gross, 2003) and plantar flexor ankle strength (Kibler et al., 1991). While those findings are suggestive, it is not known whether there is muscle atrophy in plantar fasciitis, and in which segment of the foot atrophy might occur. Magnetic resonance imaging (MRI) has been utilized to estimate PIFM size experimentally in vivo, but only in diabetic and healthy feet. MRI may be used to obtain detailed image sets across the entire foot (Bus et al., 2002; Greenman et al., 2005, Bus et al., 2009). A major disadvantage of MRI, however, is the high cost of acquiring image sets and the lengthy time needed to process these images. Previous methods have reduced the detailed data offered by MRI in that they have prescribed a subjective atrophy score (1 to 5) (Bus et al., 2009), have digitized only one representative image per subject (Bus et al., 2002), or, have used a stereological point counting method (Andersen et al., 2004) which approximates muscle size by user-defined grid areas rather than by 140
163 each voxel. Such methods are limited by their subjectivity and error. Further, the use of one representative image leaves the possibility of overlooking size differences that may exist outside that image. Meanwhile, methods which take into account of data at a much higher resolution (i.e. each voxel), but are more time consuming to process, are available (Kent-Braun et al., 2000). Such techniques may be applied across a series of images to determine specific areas of muscle atrophy in spite of processing time. To this end, quantitative muscle cross-sectional areas have not been reported along the entirety of the foot and the effect of chronic plantar fasciitis on PIFM size is not known. Therefore, the first purpose of this study was to quantify and report the distribution of PIFM across the length of the foot. The second purpose was to determine whether chronic plantar fasciitis is accompanied by atrophy of PIFM and the tibialis posterior muscle. In comparison to contra-lateral healthy feet, it was hypothesized that plantar fasciitis feet would exhibit smaller muscle cross-sectional areas of the PIFM in the rearfoot, forefoot, and the tibialis posterior. Methods Subjects Individuals between the ages of 30 and 60 years of age with chronic unilateral plantar fasciitis were recruited for this study. Subjects were screened for MRI safety (Appendix C) and gave informed consent to this study which was approved by the Institutional Review Board of the University of Massachusetts (Appendix A). Since it is believed that high arched feet have a different plantar fasciitis injury mechanism than normal and low arched feet, individuals with a high arch foot type were excluded. A high arched foot was defined as a standing arch ratio (Williams and McClay, 2000) greater 141
164 than 0.357, one standard deviation above the laboratory s present mean value. Additional exclusion criteria included: symptomatic for less than three months, history of a local steroid injection within the last 2 months, arthritis in the lower extremities, local traumatic injury, neurological disorders, myopathies, local cardiovascular disorder, local infections and tumors, pregnancy and a body mass index greater than 35 kg m -2. The subjects were asked to rate their foot function using a Revised Foot Function Index (Appendix E; Budiman-Mak et al., 2006). The subjects of this study were a subset of the plantar fasciitis subject pool of Part I. In accordance with these criteria, eight plantar fasciitis individuals qualified and consented to participate (mean age: 44.9 years (8.4), height: cm (8.0), body mass: 75.6 kg (12.7). There were seven females and one male (P21). Subjects were symptomatic on average 3.0 years (range: years, sd: 3.7) and were reduced in foot function. Plantar fasciitis feet and healthy feet were not significantly different in their morphology as assessed by the weight bearing arch ratio and foot posture index (Redmond et al., 2006) (Table 19). Subjects reported their level of functional impairment as follows (mean (sd): pain: 6.5 (3.9); stiffness: 3.6 (4.2), disability: 10.1 (9.8), activity limitation: 5.0 (4.4), and social issues: 2.6 (3.0). 142
165 Table 19. Mean anthropometric measures of the healthy and plantar fasciitis feet, (standard deviation). The p-values are provided for a paired t-test. Variable Healthy Plantar Fasciitis p Value Arch Ratio (0.025) (0.023) 0.85 Foot Posture Index 5.0 (3.1) 4.8 (3.9) 0.89 Protocol Axial bilateral foot and leg MRIs were taken at the Cooley Dickinson Amherst MRI Clinic with a 1.5 Tesla MR system (Espree, Siemens AG, Munich, Germany). Foot images were acquired using a four channel head coil (Quadrature Head Coil, Siemens AG, Munich, Germany) positioned in the magnet s isocenter. Subjects were positioned supine on the patient table with the ankle oriented in 45 of plantarflexion inside the coil. To reduce movement artifact during image acquisition, the foot, ankle, and knee were stabilized with sandbags and cushions. Care was taken to not deform the soft tissue from their natural non-weight bearing shape. Frontal, sagittal and transverse localizer images were acquired to confirm foot positioning and subjects were repositioned when necessary. T1 weighted images of the entire length of the foot were acquired perpendicular to the plantar aspect of the foot using a spin-echo sequence (relaxation time (TR)=500ms, echo time (TE)=16 ms, averages=3, slice thickness=4mm, gap between slices=0mm, field of view (FOV)= 120x 120 mm, flip angle = 90 degrees, matrix=512 x 512). The data acquisition time for each foot was approximately 25 minutes. To acquire leg images, patients were supine on the patient table with knees straight and feet taped together. Sandbags were placed at the medial and lateral borders of the legs to minimize motion artifact. Two six-element pre-amplified flexible coils (Body Matrix Coil, Siemens AG, Munich, Germany) were wrapped around the subject s 143
166 lower body and four three-element pre-amplified coils in the patient table were activated (Spine Matrix Coils, Siemens AG, Munich, Germany). Leg images were acquired from the knee joint to the malleoli. Images were taken at a perpendicular direction with respect to the patient table (TR=500ms, TE=16 ms; FOV=210x210mm, matrix=512x 512, averages=2, thickness=4mm, gap=0mm). Due to the relatively long length of the legs, image acquisition required two passes; the distal leg was imaged first, then the proximal leg. The data acquisition time for one leg was approximately 50 minutes. DICOM image files were saved onto transportable media for data reduction. Data Reduction A single researcher (RC) used interactive custom software programmed in Matlab (Mathworks Inc., Natick, USA) to quantify muscle CSA for each subject s image set (Figure 30). The researcher was blinded as to whether the image set was from a plantar fasciitis or healthy foot. Plantar intrinsic foot muscle perimeters were digitally outlined and wherever possible excluded non-contractile tissues such as bone, tendon, fat, connective tissue, nerve and blood vessel. While the extensor digiti brevis muscles on the dorsal foot could be excluded, the dorsal interossei muscles could not be excluded due to their small size. To facilitate the identification of various anatomical structures, the user could zoom and view neighboring images. For each image, lower and upper pixel intensity thresholds were assigned pertaining to muscle for each image. To assist the threshold selection process, the MR image was optionally viewed in three colors as opposed to grey scale, in accordance to the selected thresholds (Figure 31). The assignment of muscle pixel intensities improved the muscle CSA estimation by removing 144


167 high-intensity pixels relating to fat, and low-intensity pixels relating to bone and connective tissues contained within the outline (Kent-Braun et al., 2000). Figure 30. Screen shot of custom muscle digitization program. The user-digitized muscle contour is shown in red. The lower panel indicates the distribution of the pixels by pixel intensity with low intensity (darker) to the left. Vertical blue lines indicate user-selected thresholds set to 295 and

168 Figure 31. T1 weighted magnetic resonance image with user-outlined intrinsic foot muscle group (left). Same image on the right viewed in three colors; pixels below the low signal intensity threshold were coded blue; red pixels coded for between low and high threshold, and light-green coded pixels are above high threshold. Plantar Intrinsic Foot Muscles (PIFM) For each intrinsic foot muscle image set, PIFM CSA were digitized from the calcaneus through to the image containing the maximum diameter of the sesamoid bones. Forefoot and rearfoot segments were defined by splitting the total number of images containing muscle into halves, anterior and posterior. The session-to-session repeatability for intrinsic foot muscle image processing was estimated. One randomly selected foot image was processed five times with at least 24 hours in between each session. Across sessions, the coefficient of variation (COV) for muscle CSA was 1.3%. The COV for lower and upper thresholds was 11.7% and 1.9%, respectively. Tibialis Posterior Muscle The original intention was to digitize the entire length of the tibialis posterior muscle. However, in all but one subject, the distal 1/3 portion of the tibialis posterior could not be identified separately from the flexor digitorum muscle, and therefore, the 146

169 proximal 2/3 portion was digitized. Like the PIFM, the reliability of image processing for this muscle was also examined. The COV for posterior tibialis muscle CSA was 1.7%, and the COV for lower and upper threshold selection was 5.2% and 1.6%, respectively. Tibialis Posterior m. Tibia Flexor Digitorum Longus m. Tibialis Anterior m. Peroneus longus and brevis m. Soleus m. Gastrocnemius m. Figure 32. T1 weighted magnetic resonance image of a subject s leg at the proximal one-third of the leg length. Tibialis posterior muscle is outlined. Variables and Statistical Analysis Due to the irregular shapes and non-uniform distribution across the length of the foot, muscle CSA were summed over the rearfoot, forefoot, and entire foot. For image sets containing an odd number of images, the muscle CSA for the middle slice was divided in half then added to the forefoot and rearfoot. In the tibialis posterior muscle data, CSA could not be summed over the total length. As an alternative, two variables were compared between groups, the peak muscle CSA and the sum over the five images with the greatest muscle CSA within a given leg. There was confidence in capturing this 147
170 muscle s peak CSA given that it is located in the proximal half of the leg (Fukunaga et al., 1992). Paired t-tests (α = 0.05) were used to determine differences between plantar fasciitis and healthy feet. Effect sizes were computed to determine the importance of the difference (Cohen, 1988): small effect ES= 0.2, medium effect ES=0.5, large effect, ES=0.8. Results Plantar Intrinsic Foot Muscles There was a mean of 38.0 and 37.4 slices digitized for PIFM for healthy and plantar fasciitis feet and these were not significantly different (Table 20). Table 20. Number of images digitized for each subject s healthy and plantar fasciitis (PF) foot. p value and effect size (ES) indicated for a two-tailed paired t-test on the number of images analyzed healthy versus PF. Number of Foot Images Digitized Subject Healthy PF p ES P P P P P P P P Mean 38.0 (6.4) 37.4 (5.8) The majority of intrinsic foot muscle CSA resided in the forefoot. The distribution profile for muscle CSA from heel-to-toe was bimodal with PIFM being larger in the forefoot than the rearfoot (Figure 33). Across all feet, 59.5% (sd = 3.0) of the total muscle CSA was in the forefoot and 40.5% (sd = 3.0) was in the rearfoot. There were no obvious differences between the distribution profiles for healthy and plantar fasciitis feet. 148
171 Also, the male subject (P21) had the largest PIFM CSA in all variables that were considered in comparison to the other subjects. Muscle Cross Sectional Area (cm 2 ) H PF % Foot Length Containing Muscle Figure 33. Mean muscle cross sectional areas across the foot length for healthy (H) and plantar fasciitis (PF) feet, from sesamoids (0% foot length) to calcaneal tuberosity (100%). Compared to healthy feet, PF feet exhibited a 5.2% reduction of muscle CSA in the forefoot (p = 0.03, Table 21). Six of the eight subjects exhibited lower forefoot muscle CSA in the plantar fasciitis foot. In the rearfoot, no significant muscle size differences were found when plantar fasciitis feet were compared to healthy feet ( Table 22). Four of eight subjects exhibited lower muscle CSA in the rearfoot PIFM on the plantar fasciitis side. 149
172 Table 21. Subject and group mean data for total muscle cross sectional areas (CSA) in the forefoot derived by MRI (healthy feet: H, plantar fasciitis: PF, percentage difference with respect to H: %H). A p value for a one-tailed dependent t-test and effect size (ES) are provided. Forefoot Total Muscle CSA Subject H (cm 2 ) PF (cm 2 ) Difference (%H) p-value ES P P P P P P P P Mean (sd) (47.3) (37.1) -5.2 (6.2) Table 22. Subject and group mean data for total muscle cross sectional areas (CSA) in the rearfoot derived by MRI (healthy feet: H, plantar fasciitis: PF, percentage difference with respect to H: %H). A p value for a one-tailed dependent t-test and effect size (ES) are provided. Rearfoot Total Muscle CSA Subject H (cm 2 ) PF (cm 2 ) Difference (%H) p-value ES P P P P P P P P Mean (sd) (43.6) (33.3) -0.7 (8.3) There were no significant differences between the healthy and PF feet when PIFM CSA were summed over an entire foot series (Table 23) or as a peak muscle CSA (Table 24). Six of the eight subjects exhibited reductions with respect to the healthy foot. 150
173 Table 23. Subject and mean data for total muscle cross sectional areas (CSA) summed over the entire series of foot images (plantar fasciitis: PF, percentage difference with respect to healthy feet: %H). A p value for a one-tailed dependent t-test and effect size (ES) are provided. Total CSA Whole Foot Subject Healthy (cm 2 ) PF (cm 2 ) Difference (%H) p Value ES P P P P P P P P Mean (sd) (87.7) (69.0) -3.4 (5.4) Table 24. Individual subject data for peak cross sectional areas (CSA) across entire foot (plantar fasciitis: PF, percentage difference with respect to healthy group: %H). p-value for a one-tailed dependent t-test between groups. ES: effect size. Peak Foot CSA Subject H (cm 2 ) PF (cm 2 ) Difference (%H) p-value ES P P P P P P P P Mean (sd) 12.7 (3.1) 12.6 (2.8) -0.4 (7.0) Tibialis Posterior Muscle There were no significant differences between the tibialis posterior muscle CSA of healthy and plantar fasciitis legs measured in peak or sum over the greatest five images (Table 25, Table 26). Subject P25 exhibited 11.3% atrophy in the leg ipsilateral in 151
174 comparison to the plantar fasciitis foot. In contrast to the PIFM CSA, the male subject (P21) did not exhibit substantially larger muscles in comparison to the rest of the group. Table 25. Individual subject and mean data for image containing the peak cross sectional area (CSA) for tibialis posterior (healthy feet: H, plantar fasciitis: PF, percentage difference with respect to H: %H). P-value for a one-tailed dependent t-test between groups and effect size (ES) are provided. Tibialis Posterior Peak CSA Subject H (cm 2 ) PF (cm 2 ) Difference (%H) p Value ES P P P P P P P P Mean (sd) 4.3 (1.2) 4.3 (1.1) 0.6 (5.4) Table 26. Individual subject and group mean data for muscle cross sectional area (CSA) of a sum of the five images for the tibialis posterior muscle with the greatest CSA (healthy feet: H, plantar fasciitis: PF, percentage difference with respect to H: %H). A p-value for a one-tailed dependent t-test between groups and effect size (ES) are provided. Tibialis Posterior - Sum of Top Five CSA Images Subject H (cm 2 ) PF (cm 2 ) Difference (%H) p Value ES P P P P P P P P Mean (sd) 20.8 (5.8) 21.1 (5.5) 1.8 (4.9)
175 Discussion The first purpose of this study was to quantify the distribution of plantar intrinsic foot muscles throughout the length of the foot. The second purpose was to determine whether chronic plantar fasciitis is associated with atrophy of the PIFM and the tibialis posterior muscle. In a cohort of unilateral chronic plantar fasciitis patients, axial MRI images were acquired bilaterally for the feet and legs. The present cohort was consistent with the clinical plantar fasciitis population in terms of age and predominance for females (DeMaio et al., 1993; Davis et al., 1994). The foot posture index scores of healthy and plantar fasciitis feet were well within the reported normal range (mean ± sd: 1.9 ± 2.0), and therefore were neither overly pronated or supinated (Redmond et al., 2008). This study demonstrated a bimodal distribution for the CSA of the PIFM from heel-to-toe in healthy and plantar fasciitis feet. The bias toward greater muscle size in the forefoot is likely an indication of the higher degree of dexterity at the metatarsals and phalanges in comparison to the rearfoot. Since the foot segment is overall smaller than the leg, it was surprising that the PIFM were comparable in peak CSA to the lateral gastrocnemius, and even larger than the individual tibialis anterior, tibialis posterior, medial gastrocnemius and flexor digitorum longus (Fukunaga et al., 1992; Kent-Braun et al., 2000). There were no obvious changes compared to the contra-lateral healthy in the distribution of muscle with chronic plantar fasciitis, and therefore, substantial compensatory hypertrophy or atrophy to the PIFM seems unlikely. These CSA data build upon the muscle property data provided by others which may be used for purposes such as simulation modeling (Silver et al., 1985; Kura et al., 1997; Lachowitzer et al., 2007; Ledoux et al., 2001). 153
176 The data from the current study were compared to other studies which have used MRI for muscle size estimation. It was challenging to make a reasonable comparison of PIFM CSA results to previous literature given that CSA has not been reported; instead, semi-quantitative scores (Bus et al., 2009) and the ratio of muscle area to total foot area have been reported (Bus et al., 2002; Greenman et al., 2005). The present PIFM CSA data, however, were converted to similar total volume data reported by (Andersen et al., 2004) by multiplying the mean total PIFM CSA with the inter-slice distance. The results from the present study were much smaller (i.e cm 3 versus 168 cm 3 ). The higher estimations of the previous researchers are due to several factors. First, their estimations were based on stereological point-counting, which are estimations derived by multiplying a constant grid area according to the type of tissue which a grid point intersected. Second, they did not exclude the extensor intrinsic foot muscles, and third, they did not identify and subtract areas above and below pixel thresholds. In regards to the present estimates for healthy tibialis posterior CSA, ours were slightly lower that a previous study (Fukunaga et al., 1992) (i.e. 4.3 ± 1.2 cm 2 versus 5.40 ± 1.41 cm 2 ). Fukunaga et al. (1992), however, did not subtract areas relating to intramuscular fat or fascia located within the digitized perimeter as was done in the present study. Furthermore, the subjects of the Fukunaga et al. (1992) study were predominantly young healthy males (mean age: 32.6 years). Therefore, these significant methodological and subject pool differences are most likely accountable for the discrepancies. The findings of this study supported the hypothesis that plantar fasciitis is associated with PIFM atrophy at the forefoot, but there was a lack of support for the hypothesis of atrophy at the rearfoot. The PIFM CSA of chronic plantar fasciitis was on 154
177 average 5.2% less than the contra-lateral healthy feet. Therefore, the following muscles or a combination of are implicated in this atrophy because they reside in the forefoot: flexor hallucis brevis medialis, flexor hallucis brevis lateralis, adductor hallucis transverse, adductor hallucis oblique, and the plantar interossei. Also implicated, but to a lesser extent are the quadratus plantae and flexor digitorum brevis since a large majority of their muscle bellies are located in the rearfoot. At the rearfoot, however, group differences were small and not significant. Therefore, the muscles situated at the rearfoot are not implicated in atrophy. These are namely the: flexor digitorum brevis, the abductor hallucis, the quadratus plantae, and abductor digiti minimi (Figure 10). Looking more closely at the individual responses, it was apparent that responses were subject specific and non-systematic. There were no significant group differences found in PIFM in regards to peak CSA and the sum of MRI CSA across the foot. However, the use of one representative CSA value may be only appropriate in other more systemic pathologies, such as diabetes neuropathy in which significant muscle atrophy is to be expected in the entire foot (Bus et al., 2002; Bus et al., 2009). With the examination of CSA summed over the foot segment, it was noted that the difference trended towards significance (p = 0.07). This suggests that the use of a variable which totals CSA over the foot may mask any segmental differences, or may be an indication of variability of muscle distribution within a given subject. The occurrence of forefoot atrophy in plantar fasciitis feet may bring a greater understanding of the aetiology of plantar fasciitis and healthy foot function and direct intervention to this problem. Interestingly, many PIFM in the forefoot (i.e. PIFM of the 155
178 third plantar layer) insert onto the surroundings of the first metatarsophalangeal joint. Therefore, we speculate that atrophy of these forefoot muscles may result in a reduced ability to stabilize and to generate a plantar flexion moment at the first metatarsal. When a foot with atrophy is loaded, one would expect a greater magnitude of medial longitudinal arch flattening, which would lead to an increased strain on the plantar fascia. When repeated over many cycles, increased tension on the plantar fascia may delay healing of that tissue. This injury mechanism has also been suggested by Allen and Gross (2003), and the present data indirectly support their reports of a loss of plantar flexor toe strength in plantar fasciitis individuals. Towards understanding foot mechanics, a finding of localized atrophy in some ways disagrees with the belief that PIFM work together as a functional unit (Mann and Inman 1964). Had that been true, the atrophy would have been evenly distributed across rearfoot and forefoot segments. Although associative, these data support the postulate that plantar fasciitis may be a result or prolonged by muscle atrophy, a characteristic which could destabilize the medial longitudinal arch. The lack of atrophy in the rearfoot was unexpected. Cadaver research has shown that the abductor hallucis muscle, a muscle which is for the most part situated in the rearfoot, plays an important role in elevating the medial longitudinal arch by flexing and supinating the first metatarsal (Wong et al., 2007). However, atrophy of this muscle may have been masked by the amalgam of rearfoot muscle CSA. Future studies may use different imaging techniques which would allow for better delineation of individual PIFM to verify the absence of individual muscle atrophy. 156
179 The group data did not support the expectation for atrophy of the posterior tibialis muscle on the ipsilateral side to the plantar fasciitis foot. However, individual subject data were insightful. The tibialis posterior muscle was examined in this study because it plays a significant role in supporting the medial longitudinal arch. While these data do not refute the supportive role of tibialis posterior, they suggest that most patients with chronic plantar fasciitis do not exhibit a loss of muscle. However, it should be noted that subject P25 exhibited a much smaller tibialis posterior on the plantar fasciitis side (- 11.3%). Such a magnitude of atrophy is on par with that of individuals who suffer from posterior tibial tendon dysfunction with adult acquired flat foot (mean 10.7%, Wacker et al, 2003). Therefore, in this subject, atrophy of the tibialis posterior muscle may have played a significant role in the development of plantar fasciitis. While as a group, there was little indication of systematic atrophy of the posterior tibialis, the data indicate that atrophy of the posterior tibialis muscle may be present in a minority of plantar fasciitis individuals. Limitations of the study should be considered in light of these findings. A healthy control group was absent from this experimental design, therefore, the differences between individuals with plantar fasciitis and healthy individuals is not known. Also, the sample size used in this study was relatively small, thus these data should be interpreted cautiously if generalizing to a larger population. There are two reasons for the small sample size. First is the prohibitive cost of using MRI, and second, the digitization of foot muscles is a challenging and laborious process. As an alternative to a larger sample size and control group, we chose to study individuals who suffered from unilateral chronic plantar fasciitis so that subjects healthy feet could serve as their own control. 157
180 An additional benefit to such a design is the reduction of inter-subject variability. In regards to digitizing images, the subjectivity of the process is problematic, however, precautions were made to minimize errors associated with this process. In particular, one researcher digitized all image sets, and therefore there were no issues relating to interobserver variability. Also, the researcher was blinded to the identity of the image sets. Furthermore, navigating between images and toggling color displays facilitated the identification of the anatomy. Given that the 5.2% difference seen in the forefoot exceeded the COV of reliability by fourfold, we are confident these PIFM differences were reliable. For these reasons, we feel that this is a good first step in understanding the relationship between plantar fasciitis and muscle size. The findings of these data may be used to guide clinicians who deal with patients suffering from plantar fasciitis. These data indicate that some patients may present with muscle atrophy in the PIFM and a small minority of patients at the tibialis posterior muscles. Therefore, a clinical assessment of plantar fasciitis patients should include appropriate muscle testing. Also, these data underscore the need to strengthen forefoot muscles, a treatment modality seen in some (Taunton et al., 1982; Warren, 1990; Cornwall and McPoil, 1999), but not all clinical literature (Kwong et al., 1988; Chandler and Kibler, 1993). Exercises should target the forefoot and in particular plantar flexion and adduction of the first metatarsal and metatarsophalangeal joint. Lastly, treatment modalities which encourage muscle atrophy through disuse, such as casting the foot, is contra-indicated. In conclusion, this study contributed to the understanding of PIFM in healthy and plantar fasciitis feet. It was found that there is a greater amount of PIFM in the forefoot 158
181 as compared to the rearfoot. In chronic plantar fasciitis, there was evidence of PIFM atrophy in the forefoot, but not in the rearfoot. Many of the muscles of the forefoot insert onto the first ray, and when atrophied may destabilize the medial longitudinal arch, and therefore delay recovery by placing a greater strain of the plantar fascia. Also, while a large majority of subjects did not exhibit atrophy of the tibialis posterior, atrophy of this muscle may present in a small minority of patients. Therefore, patient assessments should include muscle testing to determine whether there is a loss of strength is present first at the forefoot, and second at the tibialis posterior. Clinicians may intervene by addressing muscle atrophy and tailoring exercises which particularly target the first metatarsophalangeal joint to prevent excessive flattening of the medial longitudinal arch. References Allen, R. H., Gross, M. T., (2003). Toe flexors strength and passive extension range of motion of the first metatarsophalangeal joint in individuals with plantar fasciitis. Journal of Orthopaedic and Sports Physical Therapy 33, Andersen, H., Gjerstad, M. D., Jakobsen, J., (2004). Atrophy of foot muscles: a measure of diabetic neuropathy. Diabetes Care 27, Budiman-Mak, E., Conrad, K., Stuck, R., Matters, M., (2006). Theoretical model and Rasch analysis to develop a revised Foot Function Index. Foot & Ankle International 27, Bus, S. A., Maas, M., Michels, R. P., Levi, M., (2009). Role of intrinsic muscle atrophy in the etiology of claw toe deformity in diabetic neuropathy may not be as straightforward as widely believed. Diabetes Care 32, Bus, S. A., Yang, Q. X., Wang, J. H., Smith, M. B., Wunderlich, R., Cavanagh, P. R., (2002). Intrinsic muscle atrophy and toe deformity in the diabetic neuropathic foot: a magnetic resonance imaging study. Diabetes Care 25, Chandler, T. J., Kibler, W. B., (1993). A biomechanical approach to the prevention, treatment and rehabilitation of plantar fasciitis. Sports Medicine 15,
182 Cohen, J., (1988). Statistical power for the behavioral sciences. Lawrence Erlbraum Associates, New York. Cornwall, M. W., McPoil, T. G., (1999). Plantar fasciitis: etiology and treatment. Journal of Orthopaedic & Sports Physical Therapy 29, Davis, P. F., Severud, E., Baxter, D. E., (1994). Painful heel syndrome: results of nonoperative treatment. Foot & Ankle International 15, DeMaio, M., Paine, R., Mangine, R. E., Drez, D., Jr., (1993). Plantar fasciitis. Orthopedics 16, Fiolkowski, P., Brunt, D., Bishop, M., Woo, R., Horodyski, M., (2003). Intrinsic pedal musculature support of the medial longitudinal arch: an electromyography study. Journal of Foot and Ankle Surgery 42, Fukunaga, T., Roy, R. R., Shellock, F. G., Hodgson, J. A., Day, M. K., Lee, P. L., Kwong-Fu, H., Edgerton, V. R., (1992). Physiological cross-sectional area of human leg muscles based on magnetic resonance imaging. Journal of Orthopaedic Research. 10, Greenman, R. L., Khaodhiar, L., Lima, C., Dinh, T., Giurini, J. M., Veves, A., (2005). Foot small muscle atrophy is present before the detection of clinical neuropathy. Diabetes Care 28, Headlee, D. L., Leonard, J. L., Hart, J. M., Ingersoll, C. D., Hertel, J., (2008). Fatigue of the plantar intrinsic foot muscles increases navicular drop. Journal of Electromyography and Kinesiology 18, Kent-Braun, J. A., Ng, A. V., Young, K., (2000). Skeletal muscle contractile and noncontractile components in young and older women and men. Journal of Applied Physiology 88, Kibler, W. B., Goldberg, C., Chandler, T. J., (1991). Functional biomechanical deficits in running athletes with plantar fasciitis. The American Journal of Sports Medicine 19, Kitaoka, H. B., Luo, Z. P., An, K. N., (1997). Effect of the posterior tibial tendon on the arch of the foot during simulated weightbearing: biomechanical analysis. Foot & Ankle International 18, Kura, H., Luo, Z. P., Kitaoka, H. B., An, K. N., (1997). Quantitative analysis of the intrinsic muscles of the foot. Anatomical Record 249,
183 Lachowitzer, M. R., Ranes, A., Yamaguchi, G. T., (2007). Musculotendon parameters and musculoskeletal pathways within the human foot. Journal of Applied Biomechanics 23, Ledoux, W. R., Hirsch, B. E., Church, T., Caunin, M., (2001). Pennation angles of the intrinsic muscles of the foot. Journal of Biomechanics 34, Mann, R., Inman, V. T., (1964). Phasic activity of intrinsic muscles of the foot. Journal of bone and joint surgery. American volume 46, Redmond, A. C., Crane, Y. Z., Menz, H. B., (2008). Normative values for the Foot Posture Index. Journal of Foot and Ankle Research 1, 6. Redmond, A. C., Crosbie, J., Ouvrier, R. A., (2006). Development and validation of a novel rating system for scoring standing foot posture: the Foot Posture Index. Clinical Biomechancis 21, Silver, R. L., de la Garza, J., Rang, M., (1985). The myth of muscle balance. A study of relative strengths and excursions of normal muscles about the foot and ankle. Journal of bone and joint surgery. British volume 67, Taunton, J. E., Clement, D. B., McNicol, K., (1982). Plantar fasciitis in runners. Canadian journal of applied sport sciences. Journal canadien des sciences appliquées au sport 7, Warren, B. L., (1990). Plantar fasciitis in runners. Treatment and prevention. Sports Medicine 10, Wearing, S. C., Smeathers, J. E., Urry, S. R., Hennig, E. M., Hills, A. P., (2006). The pathomechanics of plantar fasciitis. Sports Medicine 36, Williams, D. S., McClay, I. S., (2000). Measurements used to characterize the foot and the medial longitudinal arch: reliability and validity. Physical Therapy 80, Wong, Y. S., (2007). Influence of the abductor hallucis muscle on the medial arch of the foot: a kinematic and anatomical cadaver study. Foot & Ankle International 28,
184 CHAPTER VI PART III ESTIMATIONS OF PLANTAR INTRINSIC FOOT MUSCLE ENERGETICS IN INDIVIDUALS WITH UNILATERAL PLANTAR FASCIITIS Abstract The plantar intrinsic foot muscles (PIFM) and the plantar fascia play an important role in supporting the medial longitudinal arch of the foot during stance and push-off. It is not known, however, what level of metabolic demand at the PIFM is associated with walking and whether this is affected by plantar fasciitis (PF). The primary objective of this study was to determine whether it is feasible to measure muscle energetics of the PIFM via phosphorus magnetic resonance spectroscopy ( 31 P MRS) before and after a walking protocol. The secondary purpose was to determine whether PF is characterized by changes in muscle bioenergetics. In the intrinsic foot muscles of healthy and contralateral PF feet of unilateral PF individuals, ph and the ratio of inorganic phosphate to phosphocreatine (Pi/PCr) were quantified using 31 P MRS in a pre- and post-walking design. To guide the interpretation of muscle energetic data, metatarsophalangeal joint power and energy were estimated using an inverse dynamics technique. The PIFM of healthy and PF feet were not significantly different in resting intramuscular levels of ph (p=0.24) or Pi/PCr (p=0.17), and there were no significant differences in the increase of Pi/PCr (p=0.85) from pre- to post-walking. It was concluded that resting energetics were consistent with muscle free of systemic disease or neuromuscular pathology. Furthermore, the presence of PF did not elicit systematic asymmetries in the metabolic demand in comparison to healthy feet. Large inter-subject metabolic responses may indicate differing coordinative walking strategies. 162
185 Introduction The plantar intrinsic foot muscles (PIFM) are recognized for playing an important role in the dynamic support of the medial arch and push-off in gait (Mann and Inman, 1964). PIFM cross numerous joints, the midtarsal and the metatarsophalangeal joints (MTPJ) being the most functionally important (Hicks, 1954). Likely due to the anatomical complexities of the foot, only a few studies have quantified the activity of the PIFM in gait in vivo (Mann and Inman, 1964; Basmajian and Stecko, 1963). These studies suggest that PIFM participate in plantarflexion and support of the arch and the phalanges. A presence of plantar fasciitis, an injury to a passive structural component of the medial longitudinal arch (Wearing et al., 2006), may elicit changes in the demand of the PIFM. This study aims to quantify the metabolic activity of the PIFM, and determine whether this is changed with a plantar fasciitis injury. Electromyographical (EMG) research indicates that muscle activation of the PIFM increases with foot injuries and deformities. In comparison to healthy normal arched feet, it has been shown that individuals with painful flat feet exhibit increased involuntary activation of the abductor hallucis in standing (Duranti et al., 1985) and in walking gait (Kayano, 1986). Mann and Inman (1964) reported that flat, pronated feet exhibited earlier onset of PIFM acitvation in stance phase of gait (i.e. abductor hallucis, flexor digitorum brevis and flexor hallucis brevis). In a pes planus deformity, Gray and Basmajian (Gray and Basmajian, 1968) reported that the abductor hallucis and flexor digitorum muscles were more active in flatfooted subjects. It has been suggested that flat medial longitudinal arches elicit a greater activation of the PIFM to support the arch (Gray and Basmajian, 1968). Based upon the findings of these studies, there is reason to 163
186 believe that the biomechanics and activation of PIFM may be affected by the presence of plantar fasciitis. If support elements of the medial longitudinal arch are mechanically compromised, such as in the case of plantar fasciitis, there may be an increase in activity of in the PIFM during a given task. While EMG has been the main technique for studying PIFM activity in vivo, there are associated methodological limitations. The muscle architecture of the foot consists of four layers on the plantar aspect, with only a few PIFM lying sufficiently near the surface for use of EMG. Therefore, studies have reported EMG data for only the most superficial muscles, often only the abductor hallucis (Kayano, 1986; Duranti et al., 1985); (Fiolkowski et al., 2003), (Headlee et al., 2008). A more complete data set for the PIFM may be achieved with fine wire EMG (Sheffield et al., 1956; Mann and Inman, 1964; Basmajian and Stecko, 1963), however, such an invasive technique is inappropriate for the study of ailing feet. As an alternative method to the electrical quantification of muscle activation, phosphorous magnetic resonance spectroscopy ( 31 P MRS) quantifies activity from a metabolic perspective (Chance et al., 1980). In 31 P MRS, surface coils are used to measure non-invasively muscle metabolic activity from a volume of interest at a penetration depth deeper than fine wire EMG. At rest, during exercise and in recovery, measurements are made of intramuscular phosphorous containing metabolites, namely phosphocreatine (PCr), inorganic phosphate (Pi) and adenosince triphosphate (ATP) (Chance et al., 1980; Chance et al., 1985; Kemp and Radda, 1994). A measure of Pi/PCr at rest and with exercise has been used as an indicator of disease and metabolic demand. At rest, skeletal muscle that is diseased and/or damaged 164
187 (e.g. peripheral vascular disease, chronic muscle necrosis and muscular dystrophy) has exhibited an increased Pi/PCr compared to healthy subjects (McCully et al., 1988; Kent- Braun et al., 1995). In exercise, studies of human steady-state wrist flexion using 31 P MRS have shown that there is a repeatable linear relationship between the Pi / PCr ratio and submaximal work rate (Chance et al., 1985; McCully et al., 1991). Furthermore, various patient populations exhibited a higher Pi / PCr ratio for a given work rate during submaximal exercise compared to healthy subjects (Kent-Braun et al., 1995). Therefore, the use of 31 P MRS for quantifying the energetics of PIFM may provide novel information about muscle energetics. No previous studies have used 31 P MRS to noninvasively measure muscle at rest in a pre- and post-walking design. This study represents a first step toward estimating muscle energetics of the PIFM at rest, with walking and their adaptations with plantar fasciitis injury. The primary objective was to determine whether it was feasible to use 31 P MRS to quantify muscle energetics of the PIFM due to walking. The secondary objective was to determine whether plantar fasciitis feet in comparison to healthy feet, exhibit alterations in intrinsic foot kinetics and bioenergetics at rest and with walking. Due to a lack of muscle disease, we hypothesized that there would be no differences in resting levels of intracellular ph and Pi/PCr. Also, we hypothesized that plantar fasciitis feet would exhibit a relatively greater increase in Pi/PCr due to the compromised arch support (plantar fasciitis). To guide the interpretation of changes in Pi/PCr from pre- to post-walking, the mechanics of push-off were estimated. 165
188 Methods Subjects Ten subjects between the ages of 30 to 60 years with chronic unilateral plantar fasciitis were recruited (mean (sd) age: 44.9 years (8.1), height: cm (7.5), mass: 74.0 kg (11.7), duration of symptoms: 2.7 years (3.3), gender: 9 female, 1 male). These subjects were a subset of Part I s cohort. Subjects gave informed consent to this study which was approved by the Institutional Review Boards of the University of Massachusetts (Appendix A and B) and Yale University. Individuals were included in the study if there was pain upon palpation of the plantar fascia, and they reported having experienced first-step heel pain at least five times. All subjects were symptomatic for greater than three months only on one foot (PF), never having had symptoms in the contra-lateral healthy foot (H). Individuals with a high arch foot type were excluded because it is believed that high-arched feet have a different injury mechanism than normal and low arched feet. A high-arched foot was defined as a standing arch ratio (Williams and McClay, 2000) greater than 0.357, one standard deviation above the University of Massachusetts Biomechanics laboratory s present mean value. Plantar fasciitis feet did not differ morphologically from contra-lateral healthy feet in a standing arch ratio (p=0.31, mean ± sd H: ± 0.025, PF: ± 0.026) and foot posture index (p=0.94, mean ± sd H: 5.1 ± 3.2, PF: 5.0 ± 3.5) (Redmond et al., 2006). Subjects levels of foot function are reported in Table 27 (Appendix E; Budiman-Mak et al., 2006). Additional exclusion criteria included a history of: a local steroid injection within the last two months, arthritis in the lower extremities, local traumatic injury, neurological disorders, myopathies, local 166
189 cardiovascular disorder, local infections and tumors, pregnancy and a body mass index greater than 35.0 kg m -2. The six-meter preferred walking speed for these individuals based on five trials was 1.28 ± 0.17 m s -1. Three of the female subjects did not participate in the MRS measures due to drop out or because MRI safety criteria were not met (Appendix C), leaving seven subjects with MRS data. Based upon previous MRS literature (Lanza et al., 2006) and pilot data, an a priori sample size estimation (α= 0.05, β=0.80) indicated that seven subjects was sufficient to detect group differences in Pi/PCr. Table 27. Group mean (sd) scores totaled for each section of the Revised Foot Function Index. Foot Function Index Section Mean (sd) Pain 6.5 (3.5) Stiffness 3.6 (4.0) Disability 9.5 (8.6) Activity Limitation 4.0 (4.3) Social Issues 2.3 (2.8) Muscle Energetics The 31 P MRS measurements were conducted at the Yale Magnetic Resonance Research Center (New Haven, Connecticut). A pre- (PRE) and post-walking (POST) experimental design was implemented to measure intracellular concentrations of PCr and Pi. A 4.0-Tesla MRS system (Bruker Biospin, Rheinstetten, Germany) measured intracellular metabolites within the foot through a 1 H and 31 P tuned radio frequency surface coil consisting of a circular 1 H coil (diameter= 6cm) and an elliptical 31 P coil (3 x 4 cm). Since only one foot could be measured at a time, the experiment sequence was performed twice in each subject to measure each foot with sufficient rest time between trials (> 20 minutes). To obtain resting 31 P data prior to walking, subjects were 167
190 positioned supine with their knee flexed inside the bore of the superconducting magnet. Positional adjustments to the bed, foot and surface coil were made until 1 H scout images confirmed that the surface coil was centered on the flexor digitorum muscle belly of the foot, and at the isocentre of the main magnetic field. Magnetic field homogeneity was optimized by fast automatic shimming techniques (FASTMAP), or manually shimmed on the water signal in the event that FASTMAP was unable to arrive at an optimal solution. The 31 P free induction decay (FID) collection parameters for PRE and POST were the same (data acquisition time=3 min, pulse time=100μs, 60 nominal flip angle, TR=2s, number of scans=90, 2048 data points, spectrum width=8000hz). Once PRE measurements were complete, the bed position was recorded, the bed and subject were removed from the magnet, and the position of the coil relative to the subject s foot was outlined in ink on the skin. After a seated rest period of five minutes, subjects walked barefoot on a motorized treadmill for seven minutes at 1.35 m s -1. At the last step, a blood pressure cuff located above the malleoli was inflated within approximately 10 to 15 seconds to supra-systolic pressure (> 220 mmhg). The cuff was utilized to impede blood flow to the PIFM. Therefore, oxidative recovery of PCr was prevented and the metabolic disturbance as a result of barefoot walking was preserved. Following cuff inflation, subjects were transported by a non-magnetic wheelchair back to the MR room then lifted onto the bed. The surface coil was repositioned to the foot according to the inked outline and subjects were then repositioned in the superconducting magnet at the same position as in PRE. Data acquisition for POST began within 3 to 3.75 minutes after the last step of walking. The cuff was deflated once the 31 P FIDs were collected. 168
191 A single investigator (RGL) conducted post-processing of FIDs using NUTS software (Acorn NMR Inc., Livermore, CA, USA) to derive intramuscular concentrations of PCr, Pi and ph. The FID data were averaged (90 scans) then multiplied with a 10Hz exponential line function to improve the signal to noise ratio. The resulting FID was Fourier transformed to generate phosphorous spectra in the frequency domain. Frequency signals were corrected for phase distortions. The spectral baseline that was due to bone was corrected by subtracting a baseline fitted to a 5 th order polynomial. PCr and Pi peaks were identified by their distinct resonant frequencies. Gaussian and Lorentzian curves were fit to the Pi and PCr peaks respectively using a least squares fit algorithm and these fits were integrated to derive their relative concentrations. By assuming that [PCr] + [Pi] = 42.5 mm, millimolar concentrations of [PCr] and [Pi] were determined (Harris et al., 1974). Saturation correction factors for Pi and PCr were applied according to fully relaxed spectra collected on two of the subjects. Intracellular ph values were calculated based on the chemical shift between the Pi and PCr peaks (Moon and Richards, 1973). Mechanical Energy As an indicator of PIFM work, a Newton-Euler inverse dynamics procedure similar to Stefanyshyn and Nigg (1997) was performed to obtain MTPJ power curves in the sagittal plane. This model is a mechanical simplification of the MTPJ anatomy given that there are several PIFM and five MTPJ. Furthermore, there are several PIFM that span numerous joints from rearfoot to the phalanges. A better estimation of energy performed by the PIFM may have been achieved by an eight segment foot model (MacWilliams et al., 2003). However, a thorough estimation of the mechanical work and 169
192 energy of the PIFM is not the primary focus of this study. Moreover, without further developing a method to include force systems of adjacent medio-lateral segments, kinetic and work computations within the foot are not without significant limitations (Buczek et al., 2006). Gait data were collected at the Biomechanics Laboratory of the University of Massachusetts with a three-dimensional motion capture system synchronized with a force platform. The foot segment was defined proximally by retroflective skin markers fixed to the medial and lateral malleoli, and distally by the first and fifth metatarsal heads. The foot segment was tracked by three markers on the rearfoot (calcaneus, peroneal tubercle and sustentaculum tali). A toe segment was defined and tracked proximally by the first and fifth metatarsal head markers and distally by a marker placed on the proximal hallux. Kinematic and kinetic data were collected for standing calibration and walking trials on a straight ten meter walkway (1.35 ms -1 ± 5%). The data collection system consisted of eight circularly positioned 1.3 megapixel cameras (Oqus 3-series, Qualisys AB, Gothenburg, Sweden) sampling at 240 Hz and a force platform (BP , AMTI Inc., Watertown, USA) sampling at 1920 Hz. Data were collected in random sets for one foot, then the other. Subjects were instructed to cross the force platform without targeting. Data processing, computations and model building were performed in Visual 3D TM (C-Motion Inc., Germantown, USA). Marker histories and analog signals were smoothed with a 4 th order, low-pass Butterworth filter at 8 Hz and 70 Hz, respectively. Joint kinematics were calculated with six degrees of freedom using a right-handed 170
193 orthogonal Cardan Xyz sequence of rotations (Cole et al., 1993). Data for five trials for each foot were processed, and these means were used to calculate group means. In this inverse dynamics approach, the toe and foot segments are modeled as cones (Figure 34). The mass of the foot and toe segments were given a mass proportional to (Dempster, 1955) and of the subject s mass, respectively. The location of the MTPJ center was defined at the midpoint between the first and fifth metatarsal head markers. The MTPJ joint moment was computed as the toe relative to the foot segment. The moment was assumed to be negligible until the center of pressure moved anterior to first metatarsal head marker. Joint power was estimated using the equation P j = M j ω j, where P j is the joint power, M j is the moment of the joint and ω j is the joint angular velocity (Winter, 2005). Positive and negative joint work were calculated by taking the time integrals of the positive and negative regions of the power curve, respectively. Various extrinsic foot muscles also cross the MTPJ and therefore, MTPJ energy was only used as a gross estimate of work. 171
 vector is acting at the toe segment. The fixed laboratory coordinate system (XYZ) is indicated on the right-side.")

194 Figure 34. The toe and foot segments modeled as cones as a subject walked from right to left across the surface of the force platform. At this moment, the ground reaction force (GRF) vector is acting at the toe segment. The fixed laboratory coordinate system (XYZ) is indicated on the right-side. Statistical Analysis Differences between healthy and plantar fasciitis feet were determined using a paired t-test (α=0.05). Group mean variables of interest included resting ph, PRE Pi/PCr, POST Pi/PCr and the change in Pi/PCr from PRE to POST. Kinetic, mechanical energy and work variables were averaged over five trials for each subject. Variables of interest included: peak ground reaction force at loading (GRF1), peak ground reaction force at pushoff (GRF2), peak MTPJ plantar flexion moment, mechanical energy absorbed at the MTPJ, and the mechanical energy generated at the MTPJ. Effect sizes were computed to determine the importance of the difference (Cohen, 1988): small effect ES= 0.2, medium effect ES=0.5, large effect, ES=
195 Results Muscle Energetics: ph and Pi/PCr There were no systematic differences between healthy and plantar feet in the resting levels of intracellular ph and Pi/PCr (Table 28, Table 29). Some individuals exhibited equal levels of ph and Pi/PCr in both healthy and plantar fasciitis feet, some subjects exhibited lower levels on the healthy side, while the opposite was true for others. The group ranges for ph and Pi/PCr at rest were 7.09 to 7.15 and 0.08 to 0.13, respectively. Table 28. Individual and mean (sd) ph values at rest. A p value and effect size (ES) estimate is provided for a dependent t-test of the means. ph at Rest Subject Healthy Plantar Fasciitis p value ES P P P P P P P Mean 7.12 (0.03) 7.11 (0.02)
196 Table 29. Individual and mean (sd) Pi/PCr values at rest. A p and effect size (ES) estimate are provided for a dependent t-test of the means. Pi/PCr at Rest Subject Healthy Plantar Fasciitis p value ES P P P P P P P Mean 0.12 (0.02) 0.10 (0.03) With walking, all subjects exhibited a decrease in PCr, and an accumulation of Pi consistent with buffering of ATP with use of PCr (for example spectra, see Figure 35). There were no group differences in the levels of Pi/PCr following exercise (Table 30) nor were there differences in the relative increase in the Pi/PCr ratio (Table 31). Compared to the plantar fasciitis foot, the healthy foot of four of seven subjects exhibited a relatively larger increase in Pi/PCr. The increases in Pi/PCr as a result of walking were similar in both feet of a given subject. For example, subject P30 exhibited a relatively high Pi/PCr response in both healthy and plantar fasciitis feet in comparison to the rest of the cohort. No differences between feet were found in post-walking levels of ph (Table 32). 174
197 Figure P MRS spectra from one subject at rest (PRE) and after seven minutes of barefoot treadmill walking (POST). Peaks for inorganic phosphate (Pi), phosphocreatine (PCr), and the three phosphate groups (α, β, γ) of adenosine triphosphate (ATP) are indicated. Table 30. Individual and mean (sd) Pi/PCr values following seven minutes of treadmill walking. A p value and effect size (ES) estimate is provided for a paired t-test of the means. Pi/PCr POST Code Healthy Plantar Fasciitis p ES P P P P P P P Mean 0.37 (0.34) 0.35 (0.27)
198 Table 31. Individual and mean relative increases in Pi/PCr from rest (PRE) to following seven minutes of treadmill walking (POST). A p and effect size (ES) estimate is provided for a dependent t-test of the means. Increase in Pi/PCr PRE to POST Code Healthy Plantar Fasciitis p ES P P P P P P P Mean 0.25 (0.34) 0.24 (0.28) Table 32. Individual and mean (sd) ph values post-walking. A p value and effect size (ES) estimate is provided for a dependent t-test of the means. Post-walking ph Subject Healthy Plantar Fasciitis p value ES P P P P P P P Mean 7.09 (0.07) 7.07 (0.07) MTPJ Joint Moments and Energy The vertical ground reaction force in walking was characteristically bimodal in shape (Figure 36). There were significant differences in the peak GRF associated with propulsion on the plantar fasciitis foot, but not with loading (Table 33). 176
199 1.5 PF H Vertical (%BW) %Stance Figure 36. Mean and standard deviation bands for the vertical ground reaction forces in individuals with unilateral plantar fasciitis (healthy foot (H) and plantar fasciitis foot (PF)). In general, the mean MTPJ moment and power curves were predominantly negative indicating that the plantar flexors of the MTPJ were eccentrically resisting the external ground reaction forces and absorbing energy (Figure 37). Just prior to toe off, there was a short and small positive aspect to the power curve indicating energy generation and a plantar flexion moment expressed by the muscles that cross this joint. In comparing mean plantar fasciitis curves to healthy, plantar fasciitis feet generated a reduced joint moment and absorbed less energy than healthy feet (Figure 37). On average, PF feet produced a lower peak plantar flexion moment (p =0.49, ES=0.32) and absorbed less energy than healthy feet (p=0.49, ES=0.30) (Table 33). 177
200 a) b) MTPJ Moment (Nm) +Dorsi PF H MTPJ Power (Watts) 50 0 Normalized Time Figure 37. Mean metatarsophalangeal joint (MTPJ) moment (a) and power curves (b) with standard deviation bands for healthy (H) and plantar fasciitis feet (PF). Table 33. Mean (sd) peak vertical ground reaction forces, metatarsophalangeal joint (MTPJ) moments and energy. Peak ground reaction forces associated with loading (GRF1) and push-off (GRF2) of walking gait were normalized to body weight (BW). p values and effects sizes are for t-tests between feet. Means Effect Variable Healthy Plantar Fasciitis p Size GRF1 (%BW) (0.058) (0.053) GRF2 (%BW) (0.073) (0.096) MTPJ Moment (Nm) Peak Plantarflexion 22.9 (7.7) 21.2 (6.2) MTPJ Energy (J) Absorbed 11.0 (3.6) 10.0 (3.0) Generated 1.2 (0.8) 1.3 (0.8)
201 Discussion The primary objective of this study was to determine whether energetics of the PIFM measured via 31 P MRS before and after a walking protocol could provide reasonable intramuscular ph and Pi/PCr data. The secondary objective was to determine whether chronic plantar fasciitis is characterized by changes in resting and post-exercise levels of ph and Pi/PCr. To guide the interpretation Pi/PCr responses, MTPJ mechanical energy associated with walking was estimated. In this study, the plantar fasciitis foot was compared to the contra-lateral healthy foot in a cohort of unilateral plantar fasciitis subjects who were of similar age to what has been described in the clinical literature (DeMaio et al., 1993; Davis et al., 1994). Phosphorus spectra obtained for the PIFM were characteristically shaped for intramuscular phosphorous metabolites, and the resting levels of ph and Pi/PCr were comparable to other reports (Coggan et al., 1993; Tartaglia et al., 2000; Lanza et al. 2006). Qualitatively, spectra from the present study were acceptable with resonant 31 P peaks easily identifiable from one another and in particular, there was no merging of the γ-atp and PCr peaks. The spectra, levels of resting ph and resting Pi/PCr were similar to those obtained from gastrocnemius muscle (Coggan et al., 1993; Tartaglia et al., 2000), and to studies of tibialis anterior muscle using the same MRS system (Lanza et al. 2006). The present Pi/PCr and ph values are lower than those reported by Suzuki et al. (Suzuki et al., 2000) for intrinsic foot muscles (Pi/PCr range estimated from figure: 0.13 to 0.19; ph: 7.15). Methodological differences versus the present study are likely to account for these differences, which include: diabetes versus healthy or plantar fasciitis, and centering position of the surface coil (first metatarsal head versus belly of flexor 179
202 digitorum brevis). A high level of agreement with previous literature gave us confidence in these data. Our expectation that there would be no differences in resting Pi/PCr between healthy and plantar fasciitis feet was supported by these data. Increased resting levels Pi/PCr have been shown in muscle damage (McCully et al., 1988), and various pathologies and diseases, such as muscular dystrophy, diabetes (Suzuki et al, 2000), peripheral vascular diseases, and mitochondrial myopathies (for a review, see Kent-Braun et al., 1995). No such alterations in resting Pi/PCr have been reported in cumulative microtrauma injuries like plantar fasciitis, which suggests that trauma is not to the muscle or vasculature. Furthermore, individuals with significant health problems were excluded from the study, and therefore, it was not surprising that there were no significant differences of the PIFM between healthy and plantar fasciitis feet. The mechanical energy of the MTPJ was estimated and the results suggested that mechanical work at push-off is unchanged with a chronic plantar fasciitis injury in comparison to a healthy state. Power and energy calculations were performed as an indicator of the mechanical demand placed upon the PIFM in walking. Despite the fact that all PIFM cross the MTPJ, several other passive and active tissues including some extrinsic foot muscles also cross the MTPJ. Therefore, kinetics and energy results should not be interpreted as performed solely by intrinsic foot muscles. However, we speculate that they are responsible for a large proportion of these moments and work. The present MTPJ energy values were compared to those of Stefanyshyn and Nigg (1997) and Oleson et al. (2005) which were estimated in running and sprinting. Overall, the present joint moment and power curves agree with these previous studies; the MTPJ moment was 180
203 plantarflexion and the power curves indicated predominantly energy absorption. The energy absorbed was approximately 1/2 of running (4 ± ms -1 ) and 1/5 of sprinting (7.1 to 8.4 ms -1 ) (Stefanyshyn and Nigg 1997). The differences seem reasonable given the large differences in locomotion speed. It was found in this study that on average, peak ground reaction forces with propulsion, peak MTPJ plantar flexion moments and the energy absorbed were all greater in the healthy feet in comparison to plantar fasciitis feet, but were not statistically significant. Given these trending differences between healthy and plantar fasciitis limbs, there may be changes in joint kinetics and power occurring more proximal to MTPJ which may only be realized with further examination and elaboration of the simplified inverse dynamics model presented here. To our knowledge, this is the first study to report estimates of metabolic response of the PIFM using 31 P MRS in the context of walking. As expected Pi/PCr increased, indicating that walking elicits ATP use within the PIFM (Chance et al., 1985). These data agree with EMG studies which have demonstrated that PIFM are active in walking gait, from ~40% of stance and onward (Mann and Inman 1964, Gray and Basmajian 1968). On the other hand, the PIFM are silent in swing phase of gait (Mann and Inman 1964), when bearing the weight of the foot and leg in a sitting position (Basmajian and Stecko, 1963), and when supine (Duranti et al., 1985). Therefore, the increases in Pi/PCr were likely due to the mid- and late portions of stance phase of gait, with some metabolic recovery occurring during the swing phase and early stance. Together with the power and moment curves, the Pi/PCr data suggest that PIFM were eccentrically active and absorbed energy in late stance phase, followed by a short period of energy generation with plantar flexion. These data do not necessarily support or refute literature which has 181
204 recognized the importance of the intrinsic foot muscles in supporting the medial longitudinal arch (Fiolkowski et al., 2003; Wong, 2007; Headlee et al., 2008). These data do, however, point to their other role in generating a plantar flexion moment at the MTPJ, absorbing and then generating energy in gait a function of the PIFM which has been understated in the literature. While other extrinsic foot muscles cross the MTPJ, the relative magnitudes of metabolic demand and mechanical work expressed by each individual PIFM cannot be resolved at this point in time. In 31 P MRS studies of muscle energetics, exercise protocols typically entail ergometer guided isolated muscle contractions instead of more dynamic activities, such as walking. Therefore, there are challenges in cross comparisons in work load and with Pi/PCr data. Nevertheless, similar Pi/PCr have been reported for forearm flexion on a Cybex cycle ergometer at 0.8 watts per repetition (ramp protocol, contraction 120 degs-1, contraction of 0.5 seconds every 5 seconds, additional 5-10% of MVC each minute) (McCully et al., 1991) and two to five minutes of knee extensions at 2.61 Watts (40 contractions per minute, work rate increased by 0.65 W every minute) (Takahashi et al., 1995). In general, it was found that the magnitudes of Pi/PCr post-walking in this study are consistent with a moderate level of muscle work. These data did not support the hypothesis that the relative increase in Pi/PCr would be greater in plantar fasciitis individuals, given the similar levels of MTPJ mechanical work. Upon examination of the individual subject data, it was apparent that there were no noteworthy trends to support this hypothesis. The metabolic demand at the PIFM appears to be subject specific regardless of a presence or absence of plantar fasciitis. Some subjects exhibited a relatively high metabolic response (e.g. P30), while 182
205 others exhibited a low response (e.g. P21). But, within a given subject, pairs of feet responded similarly. This may be an indication of the different coordinative strategies associated with walking gait. An injured plantar fascia via plantar fasciitis may not be a significant enough of an injury to elicit adaptations in muscle energetics. From these data, we conclude that there is no evidence to suggest systematic and large asymmetries in the muscle energetics of plantar fasciitis feet in comparison to healthy feet. As a first step towards the use of 31 P MRS for estimating muscle energetics associated with walking, limitations of this study should be considered in addition to those already mentioned. A healthy control group was absent from this experimental design, therefore, the normal within-subject variability from the left to the right foot is not known. This study made use of a small sample size, therefore, differences between healthy and plantar fasciitis feet may have been realized with a larger sample size. However, there were no trends to indicate that expectation at this point. It is also possible that some incidental foot contractions occurred while subjects were in transit within the minute period from the last step of treadmill walking to the beginning of data acquisition. Foot movement was minimized to our greatest ability with verbal discouragement, by not allowing the subject to bear weight and by use of a wheelchair. These data have significant research and clinical implications. Refinement of this protocol may provide researchers with alternate methods of quantifying changes in metabolic demand associated with altered footwear designs, foot orthoses and foot pathologies such as the diabetes foot. The finding that intrinsic foot muscles are metabolically active in walking gait supports the criticism directed at simplified biomechanical models. Biomechanical models of human gait which exclude the smaller 183
206 joints of the foot like the MTPJ may lead to different support moments and ankle powers (Stefanyshyn and Nigg, 1997; MacWilliams et al., 2003). Furthermore, these data may assist clinicians in the treatment and evaluation of patients which have compromised MTPJ function, such as in toe amputation, or joint deformity (e.g. hallux valgus) and reduced range of motion (e.g. hallux rigidus). In conclusion, this study draws attention to aspects of the foot which have been for the most part neglected in the literature: the muscle energetics of the PIFM and mechanical work performed at the MTPJ. It was shown that it was feasible to use 31 P MRS to detect changes in the intracellular energy metabolites of the PIFM in a pre- and post-walking protocol. The data indicated that the intrinsic foot muscles were active in gait, and when interpreted along with MTPJ moment and power profiles, it was inferred that PIFM participated in the plantar flexor moment at the MTPJ and dissipated energy. In comparing the plantar fasciitis foot to the contra-lateral healthy foot, it appeared that there were no significant asymmetries in the metabolic response of the intrinsic foot muscles. References Basmajian, J. V., Stecko, G., (1963). The role of muscles in arch support of the foot. Journal of Bone and Joint Surgery. American volume 45, Buczek, F. L., Walker, M. R., Rainbow, M. J., Cooney, K. M., Sanders, J. O., (2006). Impact of mediolateral segmentation on a multi-segment foot model. Gait & Posture 23, Budiman-Mak, E., Conrad, K., Stuck, R., Matters, M., (2006). Theoretical model and Rasch analysis to develop a revised Foot Function Index. Foot & Ankle International 27,
207 Chance, B., Eleff, S., Leigh, J. S., Jr., (1980). Noninvasive, nondestructive approaches to cell bioenergetics. Proceedings of the National Academy of Sciences of the United States of America 77, Chance, B., Leigh, J. S., Jr., Clark, B. J., Maris, J., Kent, J., Nioka, S., Smith, D., (1985). Control of oxidative metabolism and oxygen delivery in human skeletal muscle: a steady-state analysis of the work/energy cost transfer function. Proceedings of the National Academy of Sciences of the United States of America 82, Coggan, A. R., Abduljalil, A. M., Swanson, S. C., Earle, M. S., Farris, J. W., Mendenhall, L. A., Robitaille, P. M., (1993). Muscle metabolism during exercise in young and older untrained and endurance-trained men. Journal of Applied Physiology 75, Cohen, J., (1988). Statistical power for the behavioral sciences. Lawrence Erlbraum Associates, New York. Cole, G. K., Nigg, B. M., Ronsky, J. L., Yeadon, M. R., (1993). Application of the joint coordinate system to 3-dimensional joint attitude and movement representation - a standardization proposal. Journal of Biomechanical Engineering 115, Davis, P. F., Severud, E., Baxter, D. E., (1994). Painful heel syndrome: results of nonoperative treatment. Foot & Ankle International 15, DeMaio, M., Paine, R., Mangine, R. E., Drez, D., Jr., (1993). Plantar fasciitis. Orthopedics 16, Dempster, W. T., (1955). Space requirements of the seated operator. WADC Technical Report, Wright Patterson Air Force Base, pp Duranti, R., Galletti, R., Pantaleo, T., (1985). Electromyographic observations in patients with foot pain syndromes. American Journal of Physical Medicine 64, Fiolkowski, P., Brunt, D., Bishop, M., Woo, R., Horodyski, M., (2003). Intrinsic pedal musculature support of the medial longitudinal arch: an electromyography study. Journal of Foot and Ankle Surgery 42, Gray, E. G., Basmajian, J. V., (1968). Electromyography and Cinematography of Leg and Foot (Normal and Flat) During Walking. Anatomical Record 161, Harris, R. C., Hultman, E., Nordesjo, L. O., (1974). Glycogen, glycolytic intermediates and high-energy phosphates determined in biopsy samples of musculus quadriceps femoris of man at rest. Methods and variance of values. Scandinavian Journal of Clinical and Laboratory Investigation 33,
208 Headlee, D. L., Leonard, J. L., Hart, J. M., Ingersoll, C. D., Hertel, J., (2008). Fatigue of the plantar intrinsic foot muscles increases navicular drop. Journal of Electromyography and Kinesiology 18, Hicks, J. H., (1954). The mechanics of the foot II. The plantar aponeurosis and the arch. Journal of Anatomy 88, Kayano, J., (1986). Dynamic function of medial foot arch. Nippon Seikeigeka Gakkai Zasshi 60, Kemp, G. J., Radda, G. K., (1994). Quantitative interpretation of bioenergetic data from P-31 and H-1 magnetic-resonance spectroscopic studies of skeletal-muscle - an analytical review. Magnetic Resonance Quarterly 10, Kent-Braun, J. A., Miller, R. G., Weiner, M. W., (1995). Human skeletal muscle metabolism in health and disease: utility of magnetic resonance spectroscopy. Exercise and Sport Sciences Reviews 23, Lanza, I. R., Wigmore, D. M., Befroy, D. E., Kent-Braun, J. A., (2006). In vivo ATP production during free-flow and ischaemic muscle contractions in humans. Journal of Physiology 577, MacWilliams, B. A., Cowley, M., Nicholson, D. E., (2003). Foot kinematics and kinetics during adolescent gait. Gait & Posture 17, Mann, R., Inman, V. T., (1964). Phasic activity of intrinsic muscles of the foot. Journal of Bone and Joint Surgery. American volume 46, McCully, K. K., Argov, Z., Boden, B. P., Brown, R. L., Bank, W. J., Chance, B., (1988). Detection of muscle injury in humans with 31-P magnetic resonance spectroscopy. Muscle & Nerve 11, McCully, K. K., Kakihira, H., Vandenborne, K., Kent-Braun, J., (1991). Noninvasive measurements of activity-induced changes in muscle metabolism. Journal of Biomechanics. 24 Suppl 1, Moon, R. B., Richards, J. H., (1973). Determination of intracellular ph by 31P magnetic resonance. The Journal of Biological Chemistry248, Oleson, M., Adler, D., Goldsmith, P., (2005). A comparison of forefoot stiffness in running and running shoe bending stiffness. Journal of Biomechanics 38, Redmond, A. C., Crosbie, J., Ouvrier, R. A., (2006). Development and validation of a novel rating system for scoring standing foot posture: the Foot Posture Index. Clinical Biomechanics 21,
209 Sheffield, F. J., Gersten, J. W., Mastellone, A. F., (1956). Electromyographic study of the muscles of the foot in normal walking. American Journal of Physical Medicine 35, Stefanyshyn, D. J., Nigg, B. M., (1997). Mechanical energy contribution of the metatarsophalangeal joint to running and sprinting. Journal of Biomechanics 30, Suzuki, E., Kashiwagi, A., Hidaka, H., Maegawa, H., Nishio, Y., Kojima, H., Haneda, M., Yasuda, H., Morikawa, S., Inubushi, T., Kikkawa, R., (2000). 1H- and 31Pmagnetic resonance spectroscopy and imaging as a new diagnostic tool to evaluate neuropathic foot ulcers in Type II diabetic patients. Diabetologia 43, Takahashi, H., Inaki, M., Fujimoto, K., Tomoshige, S., Katsuta, S., Niitsu, M., Itai, Y., (1995). Index of the oxidative potential in human quadriceps muscle: simultaneous measurements of [31P]NMR and oxygen consumption during exercise. Acta physiologica Scandinavica 155, Tartaglia, M. C., Chen, J. T., Caramanos, Z., Taivassalo, T., Arnold, D. L., Argov, Z., (2000). Muscle phosphorus magnetic resonance spectroscopy oxidative indices correlate with physical activity. Muscle & Nerve 23, Wearing, S. C., Smeathers, J. E., Urry, S. R., Hennig, E. M., Hills, A. P., (2006). The pathomechanics of plantar fasciitis. Sports Medicine 36, Williams, D. S., McClay, I. S., (2000). Measurements used to characterize the foot and the medial longitudinal arch: reliability and validity. Physical Therapy 80, Winter, D. A., (2005). Mechanical work, energy, and power. Biomechanics and Motor Control of Human Movement. John Wiley & Sons, Inc., Hoboken, pp Wong, Y. S., (2007). Influence of the abductor hallucis muscle on the medial arch of the foot: a kinematic and anatomical cadaver study. Foot & Ankle International 28,
210 CHAPTER VII SUMMARY AND RECOMMENDATIONS FOR FUTURE STUDY Introduction In this chapter, we explore an underlying question and impetus for this dissertation; are these data consistent with how the compliant-rigid mechanisms are thought to unfold within the foot? Up to this point in the document, the results and interpretations of Parts I, II and III have been discussed in their respective chapters and in isolation to one another. The purpose of this chapter is to summarize the relevant results from all three Parts. The chapter begins with a brief review of the current state of knowledge (see Chapter 2 for a more extensive literature review), followed by a summary of findings, and then concludes with some directions for further research. Traditional Perspective A fundamental belief about the foot is that during the stance phase of gait, there is a conformational change from a pronated foot posture to a supinated posture. At heel strike and in early stance, it is believed that the foot is pronated and compliant so as to cushion impact forces and loading. Later at pushoff, the foot is supinated and rigid for effective forward propulsion. A failure to achieve these states at the appropriate times is thought to elicit compensatory mechanics, which over time may lead to injury (Root et al., 1977). There are three mechanisms which are believed to produce a compliant or rigid foot. One of these mechanism pertains to the function of the mid-tarsal joint. Forefoot pronation with respect to the rearfoot will lock the foot in a high arch position (Manter 1941; Elftman 1960; Bojsen-Moller 1979). In contrast, forefoot supination produces a 188
211 low arch position and a compliant foot. Second, it has been shown that dorsiflexion of the first metatarsophalangeal joint (FMPJ) draws the medial longitudinal arch (MLA) into a high arch position (Hicks 1954). This coupling termed the windlass mechanism, is mediated by the plantar fascia and has been observed to occur in late stance to produce a rigid foot. Third, activation of the plantar intrinsic foot muscles (PIFM) is thought to increase the overall stiffness of the foot (Mann and Inman 1964; Basmajian and Stecko 1963). Moreover, when the PIFM are active, the forefoot plantar flexes on the rearfoot drawing the calcaneus and metatarsophalangeal joints closer, which yields a high arched foot and a supinated rearfoot. Despite the alleged importance of these mechanisms, there is limited quantitative information to substantiate or refute whether these events actually take place. A Summary of Relevant Findings The results of this dissertation clearly indicate that the mechanics of the foot are more complicated than traditional compliant-rigid ideologies suggest. Nuances to these ideologies were realized by studying gait characteristics of healthy feet using a multisegment foot model, kinematic and kinetic measurement, a dynamical systems approach, magnetic resonance imaging (MRI), and magnetic resonance spectroscopy (MRS). These results are summarized in Table
212 Table 34. Summary of findings for healthy feet in the early, mid- and late periods of stance phase (RF: rearfoot; FF: forefoot; FMPJ: first metatarsophalangeal joint; MLA: medial longitudinal arch, MTPJ: metatarsophalangeal joint, PIFM: plantar intrinsic foot muscles). Variable Stance Phase Findings RF Kinematics Early, Mid Eversion Mid, Late Inversion FF Kinematics Early, Mid Dorsiflexed, Everted, Abducted Late Plantar Flexion, Eversion, Adduction RF-FF Early, Mid, Late Anti-phase not most frequent mode Coordination RF-FF Early, Mid, Late Increased with transitions Variability FMPJ Kinematics Early, Midstance Neutral position Late Dorsiflexion FMPJ-MLA Late Some deviations from windlass effect MTPJ Kinetics Late Plantar Flexor Moment Negative work PIFM Activity Stance Phase PIFM were moderately active Among the variables mentioned in Table 34, rearfoot kinematics have undergone the greatest number of quantitative investigations to date. These rearfoot data were consistent with previous reports (Hunt et al., 2001). From touchdown to midstance, the rearfoot everted, and then subsequently inverted for the remainder of stance. These rearfoot kinematic findings are therefore consistent with the concept that in stance phase, the foot starts with a low arch posture than adopts a high arch posture. The present data challenges the observations of forefoot motion put forth by Bojsen-Moller (1979). Based on his work, we expected a pronated forefoot posture from 190
213 early to mid-stance, with further forefoot pronation toward late stance. These data confirmed that shortly after touchdown, the foot quickly assumed a pronated posture with forefoot dorsiflexion, eversion and abduction. However, our data indicated that forefoot pronation does not occur in late stance as was previously suggested (Bojsen-Moller, 1979). Instead, late stance was associated with plantarflexion, eversion and adduction, movements which only satisfy one of the three components of tri-planar pronation. The expectation that the forefoot dorsiflexes (Bojsen-Moller, 1979) has been refuted by this study and several others that have shown that the forefoot plantar flexes in late stance (Kayano, 1986, Hunt et al., 2001; Pohl et al., 2006; Leardini et al., 2007). Therefore, there appears to be little evidence to support the belief that the forefoot pronates in late stance. Dynamical systems analyses (i.e. vector coding) indicated that the transition of the foot from a compliant to a rigid structure was more complex than an idealized counter-rotation of the rearfoot and forefoot couple. The data did not support the expectation that there would be predominantly anti-phase movements between the couple. An array of in-phase, rearfoot and forefoot movements were also necessary at pushoff. In addition, results indicated that forefoot eversion was achieved primarily through rearfoot inversion (as opposed to being led by the forefoot). Consistent with dynamical systems, there were generally increases in rearfoot-forefoot variability (critical fluctuations) that preceded and were coincident with changes in coordination modes (Kelso, 1984; Kelso, 1995). Therefore, it appears that the use of dynamical systems and vector coding methods are appropriate paradigms for understanding the compliant-rigid transition and warrant further investigation. 191
214 The kinematic coupling of the FMPJ and MLA was not entirely consistent with the operations of the windlass mechanism (Hicks 1954). Contrary to expectations, FMPJ dorsiflexion was not matched by rising of the MLA at 60% stance. The MLA did not rise until approximately 80% of stance. The delay in coupling may indicate the dominance of the forces associated with loading which tend to flatten the MLA. Incongruities of the windlass mechanism were also seen in late stance when the FMPJ plantar flexed, but the MLA continued to rise. Presumably, a rise in the MLA was due to plantar intrinsic foot muscle activity (Mann and Inman, 1964), which would produce a plantarflexion moment and movement of the midtarsal joint. These data indicated that loading forces and the moments associated with intrinsic foot muscles should not be neglected when considering mediating factors of MLA kinematics. The results of this dissertation suggest that the role and potential of the PIFM are understated in the literature. The MRI data indicated that these muscles are sizable. The peak PIFM cross-sectional area is larger than that of the individual tibialis anterior, tibialis posterior, medial gastrocnemius and flexor digitorum longus (Fukunaga et al., 1992; Kent-Braun et al., 2000). For most subjects, walking elicited a moderate PIFM metabolic response, and therefore imposes a moderate work load on these muscles. As stated earlier, PIFM activation is thought to increase stiffness across the joints of the foot, particularly at the midtarsal joint (Mann and Inman, 1964; Basmajian and Stecko, 1963). Furthermore, we explored the functions of the PIFM with an examination of MRS results together with metatarsophalangeal joint (MTPJ) kinetics. In late stance, there was a MTPJ plantar flexion moment that absorbed energy, and then there was a brief and small magnitude of energy generation. We speculate that the PIFM are responsible for a large 192
215 proportion of the MTPJ moment despite the fact that other passive and active tissues also cross the MTPJ. Therefore, the MRS data, the MLA kinematic data, and the MTPJ kinetic data suggest that the PIFM play a significant role in gait. Due to the difficulties in measuring PIFM in vivo, many studies overlook their functions and therefore, we believe that that the functions of the PIFM have been understudied and undervalued in the literature. Further study of these muscles is warranted. Directions for Further Research This study supported, challenged, and provided new perspectives on how the foot functions as a mechanical system, but many questions about the foot remain unanswered. In this section we overview areas of potential research. Due to the overwhelming number of joints and structures within the foot, the intrinsic kinematics and kinetics of the in vivo foot are still not well understood. Progression of knowledge in this field is dependent upon continued developments in multi-segment foot models and improvements in motion capture technology. In the last decade, there has been a steady influx of multi-segment foot models for motion capture. More research is needed to validate and to refine these models not only for typical biomechanical variables, but also for the newer non-linear dynamics and dynamical systems approaches. Similarly, patient specific link segment models and inverse dynamics computations need further development to gain insight in to the bone-on-bone forces and moments expressed across joints. For example, it would be a significant benefit to quantify the kinetics at the midtarsal joint. It is such modeling that will ultimately enhance our understanding of the healthy foot, inter-subject differences, and various pathologies, such as club foot, local osteoarthritis, pes planus, and pes cavus. 193
216 There is very little data on the intrinsic foot muscles, and our research suggests that their mechanical contributions to the healthy foot should not be ignored. Recently, the news media has rekindled old debates about barefoot running and heel-toe running versus forefoot striking. These issues beg speculation about the role and importance of intrinsic foot muscles. Hopefully researchers will be motivated to examine the intrinsic foot muscles more closely. Due to the nature of these muscles, we utilized MRI and MRS techniques, methods that are outside of the traditional biomechanics laboratory. The use of MRS for the study of PIFM in gait is novel and has significant research and clinical implications. Further development of this technique may provide researchers with alternate methods of quantifying changes in metabolic demand associated with altered footwear designs, foot orthoses and foot pathologies such as the diabetes foot. References Bojsen-Moller, F., (1979). Calcaneocuboid joint and stability of the longitudinal arch of the foot at high and low gear push off. Journal of Anatomy 129, Elftman, H., (1960). The transverse tarsal joint and its control. Clinical Orthopaedics 16, Fukunaga, T., Roy, R. R., Shellock, F. G., Hodgson, J. A., Day, M. K., Lee, P. L., Kwong-Fu, H., Edgerton, V. R., (1992). Physiological cross-sectional area of human leg muscles based on magnetic resonance imaging. Journal of Orthopaedic Research 10, Gray, E. G., Basmajian, J. V., (1968). Electromyography and Cinematography of Leg and Foot (Normal and Flat) During Walking. Anatomical Record 161, Hunt, A. E., Smith, R. M., Torode, M., Keenan, A. M., (2001). Inter-segment foot motion and ground reaction forces over the stance phase of walking. Clinical Biomechanics 16, Kayano, J., (1986). Dynamic function of medial foot arch. Nippon Seikeigeka Gakkai Zasshi 60,
217 Kelso, J. A. S., (1984). Phase-transitions and critical-behavior in human bimanual coordination. American Journal of Physiology 246, Kelso, J. A. S., (1995). Dynamic Patterns - The Self-Organization of Brain and Behavior. MIT Press, Cambridge, MA. Kent-Braun, J. A., Ng, A. V., Young, K., (2000). Skeletal muscle contractile and noncontractile components in young and older women and men. Journal of Applied Physiology 88, Leardini, A., Benedetti, M. G., Berti, L., Bettinelli, D., Nativo, R., Giannini, S., (2007). Rear-foot, mid-foot and fore-foot motion during the stance phase of gait. Gait & Posture 25, Manter, J. T., (1941). Movements of the subtalar and transverse tarsal joints. Anatomical Record 80, Pohl, M. B., Messenger, N., Buckley, J. G., (2006). Changes in foot and lower limb coupling due to systematic variations in step width. Clinical Biomechanics 21, Root, M. L., Orien, W. P., Weed, J. H., (1977). Normal and abnormal function of the foot. Clinical Biomechanics Corporation, Los Angeles. Sharkey, N. A., Ferris, L., Donahue, S. W., (1998). Biomechanical consequences of plantar fascial release or rupture during gait: part I--disruptions in longitudinal arch conformation. Foot & Ankle International 19, Thordarson, D. B., Schmotzer, H., Chon, J., Peters, J., (1995). Dynamic support of the human longitudinal arch. A biomechanical evaluation. Clinical Orthopaedics and Related Research Ward, E. D., Smith, K. M., Cocheba, J. R., Patterson, P. E., Phillips, R. D., (2003). In vivo forces in the plantar fascia during the stance phase of gait: sequential release of the plantar fascia. Journal of the American Podiatric Medical Association 93,
218 APPENDICES 196
219 APPENDIX A INFORMED CONSENT: PART I & II INFORMED CONSENT DOCUMENT University of Massachusetts Amherst, MA Title: Movement Analysis and Muscle Size in Plantar Fasciitis Principal Investigators: Ryan Chang, MS, Jane Kent-Braun, PhD and Joseph Hamill, PhD. Your written informed consent is required before you can participate in this project. Please read this document carefully and then sign your name on the last page if you agree to participate. This document is in accordance with the Assurance of Compliance with the Office of Human Research Protection Regulations as approved by the Faculty Senate of the University of Massachusetts. Purpose: The purpose of this study is to understand movement patterns of joints and how muscle size changes with plantar fasciitis. Eligibility: To participate in this study, you must be 30 to 60 years of age and fit the criteria for one of these groups: Plantar Fasciitis Group: You have had plantar fasciitis symptoms for more than 3 months and have a low arch ratio. You have not had a steroid injection to your foot in the last 2 months. You do not, and have no history of: severe structural foot abnormality, arthritis, neurological disorders, myopathies, cardiovascular disorder in the foot, foot infections and tumors. Healthy Group: You are in general healthy, and have no history of plantar fasciitis or other serious injuries. You must have a medium arch ratio. Definitions: The following terms will used in this study: Arch Ratio. A length ratio measurement of arch height and foot length. Medium: & Low: < Magnetic resonance imaging (MRI). This technique uses radio waves and a large, superconducting magnet to obtain information about the size and shape of your muscles. Procedures: Screening I: Telephone Interview. Before you are studied, you will be screened by telephone interview for general health status, medical history, current medications and 197
220 usual physical activity habits. If you pre-qualify and wish to participate in the study, we will invite you to the University of Massachusetts for qualifying measurements. Screening II: Body Measurements. This will be carried out at the University of Massachusetts, Biomechanics Laboratory (Totman Building Room 23). You will complete a Modified Physical Activity Readiness Questionnaire and a Magnetic Materials Safety Questionnaire to ensure that there are no magnetic materials in your body. We will measure your height and weight and your arch ratio. If the inclusion criteria are met and you agree to participate, we will schedule two measurement sessions. We will end the session by making a plaster cast of your foot from which we will build a custom foot orthotic. 1 st Session: Motion Analysis. This will be carried out at the University of Massachusetts, Biomechanics Laboratory. Reflective markers will be placed at various bony landmarks of your body and you will be asked to walk barefoot with these on. The movements of the reflective markers will be captured by cameras as you walk into their recording area. You will be asked to perform approximately 20 to 40 trials with each trial lasting approximately 10 seconds. You will be provided with rest periods. At the end of the procedure, all markers will be removed. This session should take approximately 60 minutes. 2 nd Session: MRI. This study will be carried out at the Cooley Dickinson Hospital MRI Center. We will reconfirm that you have no magnetic materials in your body. After we ensure that you are free of magnetic objects, you will be taken into the MRI room where we will take images of your legs and feet. Your leg and foot on one side of your body will be imaged first, then we will repeat the process for the other side. To protect your hearing during the imaging, you will be given earplugs or headphones to wear. After you are positioned comfortably, we will slide the MRI bed into the scanner. We will then collect anatomical images of your leg, which will provide information about the shape and size of your muscles. During the imaging procedures, the table may shake slightly, and you will hear loud knocking noises. This is a normal part of the imaging procedure. This procedure will take approximately 40 minutes. Possible Risks and Discomforts: The following risks and discomforts are associated with the procedures described above. 1 st Session: Motion Analysis. For subjects who have plantar fasciitis symptoms, symptoms may increase slightly during data collections. During any type of exercise, there are slight possibilities of health risks such as temporary fatigue and muscle soreness. 2 nd Session: MRI. When in the magnet, there is a very small possibility that the magnetic field will pull an iron-containing object into the magnet, which might result in physical injury. However, precautions have been taken to prevent such an event from happening; loose metal objects, like pocketknives or key chains, are not allowed in the magnet room. If you have a piece of metal in your body, such as a fragment in your eye, aneurysm 198
221 clips, ear implants, spinal nerve stimulators, or a pacemaker, you cannot participate in this study. One potential hazard of this MRI study is heating of the body due to use of radio waves. However, the MRI machine has safety devices that will prevent this from happening. Women who are pregnant, or trying to conceive, are discouraged from participating in MRI studies to due the potential risks associated with this procedure. Your head will be at the opening of the magnet; however, you may be bothered by feelings of claustrophobia, or by the loud noise during this study. Temporary hearing loss has been reported from this loud noise, so you will be asked to wear earplugs or headphones. If at any time you feel too claustrophobic or too uncomfortable to continue, the study will be stopped immediately. Confidentiality: Your identity and records will be kept confidential. While results from this study will be shared with other researchers, no individual identities will be used in any reports or publications resulting from this study. In Case of Injury: In the unlikely event of injury resulting directly from participation in this study, we will do everything we can to assist you in seeking medical treatment. The University of Massachusetts will not provide compensation for medical treatment you obtain. Benefits: You will receive no direct benefit from participating in this study. Any information that is obtained from this study will be made available to your physician, upon request. The purpose of these studies is to provide the investigators with information that will help us understand how plantar fasciitis affects joint motion and muscle size. This information ultimately may have a positive impact on the treatment of plantar fasciitis. Costs and Reimbursement: No costs will be charged to you if you participate in this study. You will receive one pair of custom foot orthotics after completing the study. Withdrawal of Participation: Participation in this research is voluntary. You have the right to withdraw from this study at any time. Information: You are encouraged to ask questions about the study. The investigators will attempt to answer all of your questions to the best of their knowledge. The investigators fully intend to conduct the study with your best interest, safety and comfort in mind. Please address any questions regarding the study Dr. Joe Hamill, Ph.D. at jhamill@kin.umass.edu, or to Ryan Chang, M.S. (413) If you would like to speak with someone not directly involved in the research study, you may contact the Human Research Protection Office at the University of Massachusetts via at humansubject@ora.umass.edu; telephone (413) ; or mail at the Human Research Protection Office, Research Administration Building, University of Massachusetts Amherst, 70 Butterfield Terrace, Amherst, MA
222 Participant s Name Address Signature Phone Number Date Investigator Signature Department of Kinesiology 200
223 APPENDIX B INFORMED CONSENT: PART III INFORMED CONSENT DOCUMENT University of Massachusetts Amherst, MA Project Title: Foot Muscle Activity in Plantar Fasciitis Principal Investigators: Ryan Chang, MS, Jane Kent-Braun, Ph.D., Joseph Hamill, PhD Your written informed consent is required before you can participate in this project. Please read this document carefully and then sign your name on the last page. This document is in accordance with the Assurance of Compliance with the Office of Human Research Protection Regulations approved by the Faculty Senate of the University of Massachusetts. Purpose: The purpose of the study is to measure foot muscle work when walking with plantar fasciitis. Eligibility: To participate in this study, you must have plantar fasciitis in one foot and be 30 to 60 years of age. You have had plantar fasciitis symptoms for more than 3 months and have a low arch ratio. You have not had a steroid injection to your foot in the last 2 months. You currently do not and have no history of: severe structural abnormality of the foot, arthritis, neurological disorders, myopathies, cardiovascular disorder in the foot, foot infections and tumors. Definitions: The following terms will be referred to throughout the study. MRS- magnetic resonance spectroscopy. This technique uses radio waves and a large, superconducting magnet to study the energy supply of your muscle during exercise. Arch Ratio. A length ratio measurement of arch height and foot length. Low: < Procedures: Screening I: Telephone Interview. Before you are studied, you will be screened by telephone interview for general health status, medical history, current medications and usual physical activity habits. If you pre-qualify and wish to participate in the study, we will invite you to the University of Massachusetts for qualifying measurements. 201
224 Screening II: Body Measurements. This will be carried out at the University of Massachusetts, Biomechanics Laboratory (Totman Building, Room 23). You will complete a Modified Physical Activity Readiness Questionnaire and a Magnetic Materials Safety Questionnaire to ensure that there are no magnetic materials in your body. We will measure your height, weight and your arch ratio. If the inclusion criteria are met and you agree to participate, we will schedule a MRS measurement session. We will end the session by making a plaster cast of your foot from which we will build a custom foot orthotic. MRS Measurement. This study will be carried out at the Yale University School of Medicine Magnetic Resonance Research Center. You will be transported to and from Yale University at no expense to you. We will reconfirm that you are free of magnetic objects and you will be taken into the MRS room. 1) Pre-Walking MRS: You will lie on a firm plastic bed and we will be placing a coil under your foot. The coil will help us record chemical changes in your muscle. We will slide the bed into the center the MR unit. MRS should cause very little discomfort, and has no known side effects. 2) Walking Protocol We will go to a nearby exercise room and you will walk barefoot on a treadmill for 7 minutes. At the end of 7 minutes, we will inflate a blood pressure cuff above your ankle to above 220 mmhg and transport you by wheelchair back to the MRS room. 3) Post-Walking MRS: The Pre-Walking MRS procedures are repeated with the a blood pressure cuff on your ankle. The cuff will be inflated for about 10 minutes. Since we measure one foot at a time, this sequence (1-3) will be repeated for the other foot. Estimated time: travel to Yale (1.5 hours), data collection (2 hours), return trip (1.5 hours). The total time is about 5 hours. Possible Risks and Discomforts: The following risks and discomforts may be associated with the procedures described above. When the blood pressure cuff is inflated, you may feel: moderately uncomfortable, a tight squeezing on your ankle, and numbness in your foot. This procedure poses no risk to you. Upon release of the cuff, you may feel pins and needles in your foot. You may also experience slight bruising on your ankle where the blood pressure cuff was inflated. When in the magnet, there is a very small possibility that the magnetic field will pull an iron-containing object into the magnet, which might result in physical injury. However, precautions have been taken to prevent such an event from happening; loose metal objects, like pocketknives or key chains, are not allowed in the magnet room. If you have a piece of metal in your body, such as a fragment in your eye, aneurysm clips, ear 202
225 implants, spinal nerve stimulators, or a pacemaker, you will not be allowed into the magnet room and cannot participate in these portions of the study. One potential hazard of the experiments is heating of the body due to the radio waves. However, the magnetic resonance instrument has safety devices that will prevent this from happening. Your head will be at the opening of the magnet; however, you may be bothered by feelings of claustrophobia and by the loud noise during this part of the study. Temporary hearing loss has been reported from this loud noise, so you will be asked to wear earplugs. If at any time you feel too claustrophobic or too uncomfortable to continue, the study will be stopped immediately. Confidentiality: Although precautions will be taken to ensure your privacy, participation in research may involve loss of privacy. Your records will be kept as confidential as is possible under the law. No individual identities will be used in any reports or publications resulting from this study. In Case of Injury: In the unlikely event of injury resulting directly from participation in this study, we will do everything we can to assist you in seeking medical treatment. The University of Massachusetts does not have a program for compensating subjects for injury or complications related to human subjects research but the study personnel will assist you in getting treatment. Benefits: You will receive no direct benefit from participating in this study. You may receive more precise information about your muscle s metabolic capacity or its ability to produce energy. Any information that is obtained from this study will be made available to your physician upon request. The purpose of these studies is to provide the investigators with information, which ultimately may have a positive impact on the management of muscle function in aging. Costs and Reimbursement: No costs will be charged to you if you participate in this study. You will receive a pair of custom foot orthotics upon completion of the study. Withdrawal of Participation: Participation in this research is voluntary. You have the right to refuse or to withdraw at any point in this study without jeopardy to your medical treatment. Information: You are encouraged to ask questions about the study. The investigators will attempt to answer all of your questions to the best of their knowledge. The investigators fully intend to conduct the study with your best interest, safety, and comfort in mind. Please address any questions regarding the study Dr. Jane Kent-Braun, PhD, at (413) or to Ryan Chang, MS, at (413) If you would like to discuss your rights as a participant in a research study or wish to speak with someone not directly involved in the study, you may contact the Human Subjects Administrator at humansubjects@ora.umass.edu (413)
226 Participant s Name Address Signature Phone Number Signature of Principal or Co-Investigator Department of Kinesiology 204

227 APPENDIX C MAGNETIC MATERIALS SAFETY QUESTIONNAIRE Yale University School of Medicine Magnetic Resonance Research Center 300 Cedar Street New Haven, CT Name: Today s date: Date of birth: Please read the following questions carefully. It is very important for us to know if you have any metal devices or metal parts anywhere in your body. If you do not understand a question, please ask us to explain! If you answer yes to any question, please contact the principal investigator. 1. Yes No Do you have a heart pacemaker? (if you have a pacemaker, you cannot have an MRI) 2. Yes No Did you ever have a device implanted somewhere in your body like a heart defibrillator? 3. Yes No Did you ever have an aneurysm clip implanted during brain surgery? 4. Yes No Do you have a Carotid Artery Vascular clamp? 5. Yes No Do you have nerve stimulators (neuron-stimulators also called TENS or wires)? 6. Yes No Do you have any devices to make bones grow (like bone growth or bone fusion stimulators)? 7. Yes No Do you have implants in your ear (like cochlear implants)? 8. Yes No Do you have a Vagus nerve stimulator to help you with convulsions or with epilepsy? 9. Yes No Do you have a filter for blood clots (Umbrella, Greenfield, bird s nest)? 10. Yes No Do you have embolization coils (Gianturco) in your brain? 11. Yes No Do you have implants in your eyes? Have you ever had cataract surgery? 12. Yes No Do you have any stents (small metal tubes used to keep blood vessels open)? 13. Yes No Do you have an implanted pump to deliver medication? 14. Yes No Do you have an artificial arm or leg? 15. Yes No Do you wear colored contact lenses? 16. Yes No Do you wear a patch to deliver medicines through the skin? 17. Yes No Do you have shrapnel or metal in your head, eyes or skin? 18. Yes No Have you ever worked with metal? (For example in a machine shop)? If yes, we need to obtain orbit x-rays. 19. Yes No Have you ever had metal removed from your eyes by a doctor? 20. Yes No Have you ever had a gunshot wound? Or a B-B gun injury? 21. Yes No Do you have body-piercing or jewelry on your body? 22. Yes No Do you have permanent eye liner? (We need to make sure it does not heat up during the MRI) 23. Yes No Do you use a hearing aid? 24. Yes No Do you wear braces on your teeth or have a permanent retainer? 25. Yes No Do you have a shunt (a tube to drain fluid) in your brain, spine or heart? 26. Yes No Do you have metal joints, rods, plates, pins, screws, nails, or clips in any part of your body? 27. Yes No Do you have a tattoo? (We need to make sure it does not heat up during the MRI) 28. Yes No Do you get upset or anxious in small spaces? 29. Yes No Do you have kidney disease, need dialysis or have diabetes? 30. Yes No Do you have asthma? Have you ever had an allergic reaction? If yes, to what? 31. Yes No Have you ever had any surgery? Please list all FOR WOMEN 32. Yes No Are you breastfeeding? 33. Yes No Do you use a diaphragm, IUD, or cervical pessary? 34. Yes No Do you think there is any possibility that you might be pregnant? Date of last menstrual period FOR MEN 35. Yes No Do you have a penile implant? Weight Height Signature: Date: 205
228 APPENDIX D SUBJECT QUESTIONNAIRES Screening I: Telephone Interview Date (MM/DD/YY): / / Last Name First Name Phone # Age (yrs) Gender: Female / Male Yes No Plantar Fasciitis Dx? Right / Left / Both How long? Yes No Do you have heel pain regularly? Yes No Walk with a limp Yes No Have first step or AM pain 5 times of more? Low High Describe your arch type # Hours per day spent on your feet. Activity: Yes No Cortisone shot? How long ago?: What treatments have you tried? Eg., orthotics, rest, ice, PT, splint, DPM Current health status (general) Are you on medication? Yes No Do you or have a significant past medical history? Yes No Is there any physical reason why you should not follow a physical activity program even program even if you wanted to? Yes No Do you have physical limitations? Yes No Do you have any heart problems? Yes No Do you smoke cigarettes? Yes No Do you have diabetes? Yes No Do you have allergic reactions? Yes No Do you use foot orthoses or insoles? Yes No Do you or have you had swelling of discoloration of your feet? Yes No Do you have claustrophobia? Yes No Are you pregnant or trying to become pregnant? Yes No Do you have metallic implants or any metal in your body? Participation Status: O Plantar Fasciitis O Healthy O Inappropriate 206
229 Screening II: / / Modified Physical Activity Readiness Questionnaire Date (MM/DD/YY): 1. Yes No Has your doctor ever said you had heart trouble or a heart murmur? 2. Yes No Do you ever suffer pains in your chest? 3. Yes No Do you ever feel faint or have spells of severe dizziness, passed out, palpitations or rapid heart beat? 4. Yes No Has the doctor ever told you that your blood pressure was too high? (systolic > 160 mm Hg or diastolic > 90 mm Hg on at least 2 separate occasions) 5. Yes No Do you smoke cigarettes? 6. Yes No Do you have diabetes? 7. Yes No Do you have a family history of coronary or other atherosclerotic disease in parents or siblings prior to age 55? 8. Yes No Has your serum cholesterol ever been elevated? 9. Yes No Is there any physical reason not mentioned here why you should not follow an activity program even program even if you wanted to? Below please provide an explanation for any of the questions to which you answered YES. Body and Foot Measurements Height: Feet, Inches or cm Weight: lbs or kg Total Foot Length: mm 50% FL: mm Dorsal Foot Height (at 50% FL): Truncated Foot Length (heel to centre of 1 st MTPJ): mm mm Arch Ratio (DFL/TruncFL): Arch type based on arch ratio (circle): Planus (< ) Normal ( ) 207
230 APPENDIX E REVISED FOOT FUNCTION INDEX PAIN PLEASE READ BEFORE ANSWERING. Please circle the number that indicates how bad your foot pain was in each of the following situations during the past week. For example, when asked how severe your foot pain was at its worst, if you feel No pain, circle the number 0 and if you felt the Worse pain imaginable, circle the number 5. Please provide an answer for every item. DURING THE PAST WEEK, HOW SEVERE WAS YOUR FOOT PAIN: No Mild Moderate Severe Very Worst pain pain Pain pain severe pain pain imaginable 1. Before you get up in the morning? When you first stood without shoes? When you stood wearing shoes? When you walked wearing shoes? At the end of a typical day? Total Pain Score (0-25 points): 208
231 STIFFNESS PLEASE READ BEFORE ANSWERING. Please circle the number that indicates how bad your foot stiffness was in each of the following situations during the past week. For example, when asked how severe your foot stiffness was before you get up in the morning, if you feel No stiffness, circle the number 0 and if you felt the Worst stiffness imaginable, circle the number 5. Please provide an answer for every item. DURING THE PAST WEEK, HOW SEVERE WAS YOUR FOOT STIFFNESS: No Mild Moderate Severe Very Worst stiffness stiffness stiffness stiffness severe stiffness stiffness imaginable 1. Before you get up in the morning? When you first stood without shoes? When walked without shoes? When you stood wearing shoes? When you walked wearing shoes? Before you went to sleep at night? Total Pain Score (0-30 points): 209
232 DIFFICULTY PLEASE READ BEFORE ANSWERING. Please circle the number that indicates how much difficulty you had performing each activity because of your foot problems during the past week. For example, when asked how much difficulty your foot problems caused when climbing stairs, if you had No difficulty, circle the number 0 and if it was so difficult [that you were] unable, circle the number 5. Please provide an answer for every item. DURING THE PAST WEEK, HOW MUCH DIFFICULTY DID YOUR FOOT PROBLEMS CAUSE YOU: No Mild Moderate Severe Very So difficulty difficulty difficulty difficulty severe difficult difficulty unable 1. Walking outside on uneven ground? Walking four or more blocks? Climbing stairs? Descending stairs? Standing on tip toes? When you carried or lifted objects weighing more than five pounds? Getting out of a chair? Walking fast?
233 9. Running? Keeping your balance Total Pain Score (0-50 points): ACTIVITY LIMITATION PLEASE READ BEFORE ANSWERING. Please circle the number that indicates how often you performed each of these activities in the past week because of your feet. For example, when asked how often you limited outdoor activities because of foot problems, if limited None of the time, circle the number 0 and if limited All of the time, circle the number 5. Please provide an answer for every item. DURING THE PAST WEEK, HOW MUCH TIME DID YOU: None of A little of Some of Much of Most of All of the time the time the time the time the time the time 1. Stay indoors most of the day because of foot problems? Limit your outdoor activities because of foot problems? Limit your leisure/sport activities because of foot problems Total Pain Score (0-15 points): 211
234 SOCIAL ISSUES PLEASE READ BEFORE ANSWERING. Please circle the number that indicates how often you experienced the following feelings in the past week because of your feet. For example, when asked how often you felt awful because of foot problems, if you felt awful None of the time, circle the number 0 and if you felt awful All of the time, circle the number 5. Please provide an answer for every item. DURING THE PAST WEEK, HOW MUCH OF THE TIME DID YOU EXPERIENCE: None of A little of Some of Much of Most of All of the time the time the time the time the time the time 1. Embarrassment due to footwear? Feeling awful because of foot problems? Limit social activities due to foot problems? Difficulty participating in social activities due to footwear? Burden of taking medication to control foot pain? Concern about limited work around the house? Total Pain Score (0-30 points): 212
235 APPENDIX F QUANTIFYING REARFOOT FOREFOOT COORDINATION IN HUMAN WALKING 213

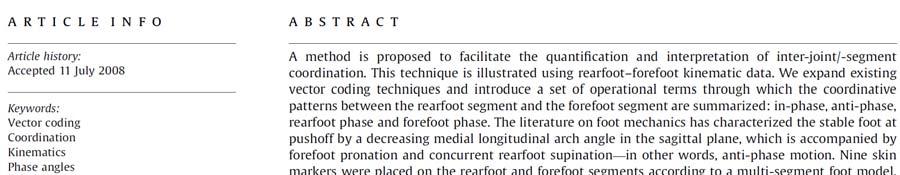
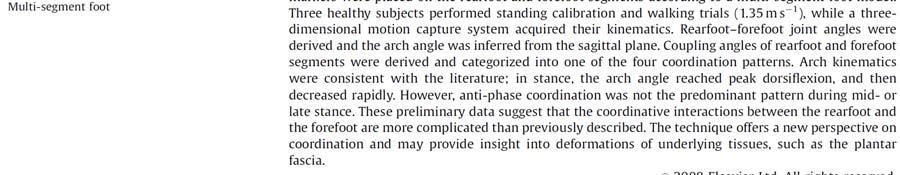
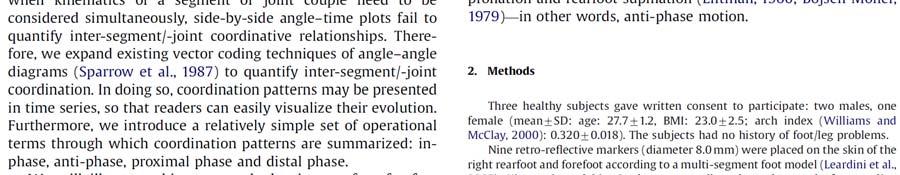
236 214
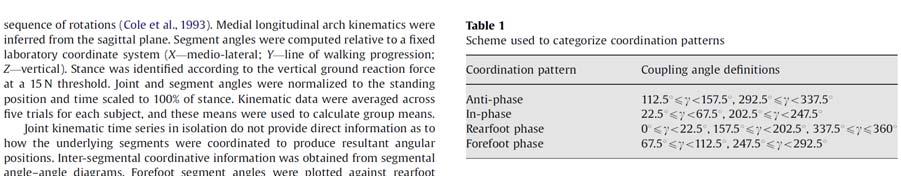
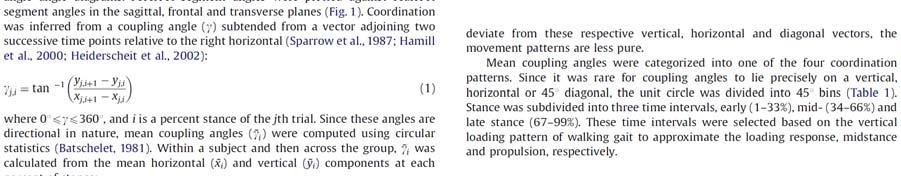
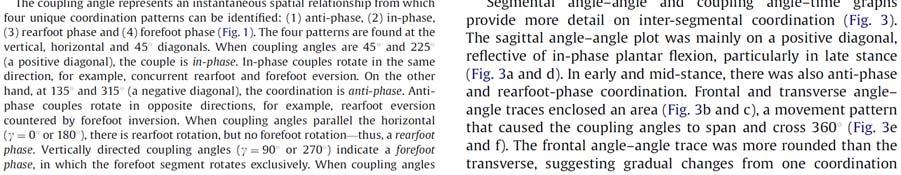
237 215
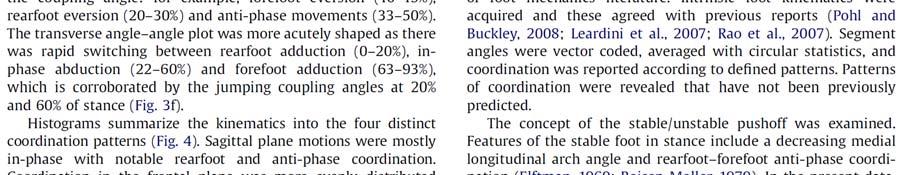
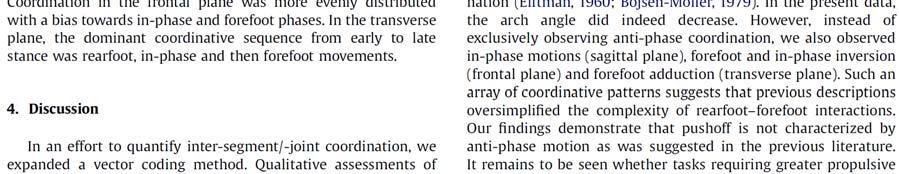
238 216
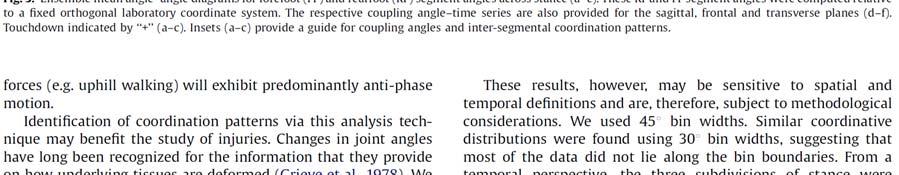
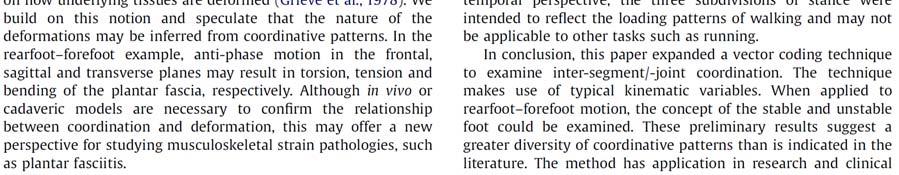
239 217
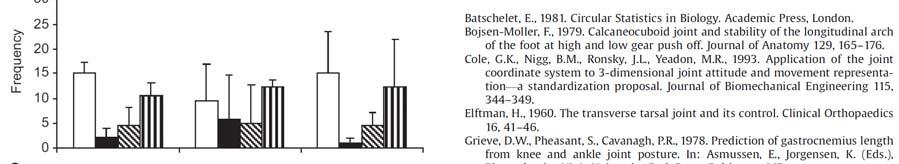
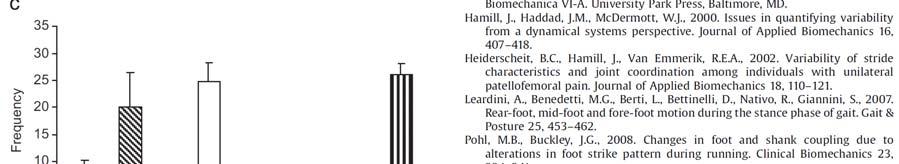
240 218
The Problem. An Innovative Approach to the Injured Runner. Dosage. Mechanics. Structure! Postural Observations. Lower Quarter Assessment
 The Problem An Innovative Approach to the Injured Runner Irene S. Davis, PhD, PT, FAPTA, FACSM Director, Spaulding National Running Center Harvard Medical School Healthy People 2020 Initiative 76% runners
New research that enhances our knowledge of foot mechanics as well as the effect of
 The Tissue Stress Model: Justification based on Current Best Evidence New research that enhances our knowledge of foot mechanics as well as the effect of bone alignment on foot mobility during activity
Recent Advances in Orthotic Therapy for. Plantar Fasciitis. An Evidence Based Approach. Lawrence Z. Huppin, D.P.M.
 Recent Advances in Orthotic Therapy for Plantar Fasciitis An Evidence Based Approach Lawrence Z. Huppin, D.P.M. Assistant Clinical Professor, Western University of Health Sciences, College of Podiatric
Ankle biomechanics demonstrates excessive and prolonged time to peak rearfoot eversion (see Foot Complex graph). We would not necessarily expect
. We would not necessarily expect") Case Study #1 The first case study is a runner presenting with bilateral shin splints with pain and tenderness along the medial aspect of the tibia. The symptoms have increased significantly over the last
Case Study #1 The first case study is a runner presenting with bilateral shin splints with pain and tenderness along the medial aspect of the tibia. The symptoms have increased significantly over the last
Normal Gait and Dynamic Function purpose of the foot in ambulation. Normal Gait and Dynamic Function purpose of the foot in ambulation
 Normal Gait and Dynamic Function purpose of the foot in ambulation Edward P. Mulligan, PT, DPT, OCS, SCS, ATC Assistant Professor; Residency Chair UT Southwestern School of Health Professions Department
SECTION 4 - POSITIVE CASTING
 4-1 SECTION 4 - POSITIVE CASTING THE SHAPE OF THE SHELL IS DERIVED FROM THE SHAPE OF THE CAST Thermo-forming plastic for orthopedic intervention was originally developed at the University of California
Steffen Willwacher, Katina Fischer, Gert Peter Brüggemann Institute of Biomechanics and Orthopaedics, German Sport University, Cologne, Germany
 P01-3 ID126 SURFACE STIFFNESS AFFECTS JOINT LOADING IN RUNNING Steffen Willwacher, Katina Fischer, Gert Peter Brüggemann Institute of Biomechanics and Orthopaedics, German Sport University, Cologne, Germany
Giovanni Alfonso Borelli Father of Biomechanics
 Giovanni Alfonso Borelli Father of Biomechanics 1608-1679 Peter Guy BSc DCh Private practice Whitby and Peterborough Professor Chiropody Faculty Michener Institute of Education at UHN Advisory Board Member
Case Study: Chronic Plantar Heel Pain/Plantar Fasciopathy. CASE STUDY PRESENTATION by Resonance Podiatry and Gait Labs
 Case Study: Chronic Plantar Heel Pain/Plantar Fasciopathy CASE STUDY PRESENTATION by Resonance Podiatry and Gait Labs THE PATIENT 43yo female, professional netball umpire 6 month history right plantar
Foot mechanics & implications on training, posture and movement
 Foot mechanics & implications on training, posture and movement Three Arches Three Arches These arches are not reciprocal. When the foot pronates ALL arches should fall. If the medial arch falls and the
Frontal Plane Moments Do Not Accurately Reflect Ankle Dynamics During Running
 Ankle Dynamics During Running 85 JOURNAL OF APPLIED BIOMECHANICS, 2005, 21, 85-95 2005 Human Kinetics Publishers, Inc. Frontal Plane Moments Do Not Accurately Reflect Ankle Dynamics During Running Kristian
Customized rocker sole constructions
 Customized rocker sole constructions German guidelines to improve results in daily practice Stief, Thomas Registered Association for the Encouragement of Research and Education Management in Orthopedic
The Effect of a Seven Week Exercise Program on Golf Swing Performance and Musculoskeletal Screening Scores
 The Effect of a Seven Week Exercise Program on Golf Swing Performance and Musculoskeletal Screening Scores 2017 Mico Hannes Olivier Bachelor of Sport Science Faculty of Health Sciences and Medicine Bond
The Unified Theory of Foot Function
 The Unified Theory of Foot Function Paul Harradine MSc FCPodMed CertEd Podiatrist / Director The Podiatry and Chiropody Centre, Cosham. Hants www.podiatryandchiropodycentre.com The Podiatry Centre, Farnham,
Smita Rao PT PhD. Judith F. Baumhauer MD Josh Tome MS Deborah A. Nawoczenski PT PhD
 Smita Rao PT PhD Judith F. Baumhauer MD Josh Tome MS Deborah A. Nawoczenski PT PhD Strong Foot and Ankle Institute Department of Orthopaedics University of Rochester Rochester, NY Center for Foot and Ankle
Purpose A patented technology designed to improve stability of the human foot.
 The Richie ArchLock Technology Purpose A patented technology designed to improve stability of the human foot. Description A platform of specific dimension, strategically placed under the human foot. This
10/22/15. Walking vs Running. Normal Running Mechanics. Treadmill vs. Overground Are they the same? Importance of Gait Analysis.
 2 angle (deg) 1/22/1 Normal Running Mechanics Walking vs Running Irene Davis, PhD, PT, FACSM, FAPTA, FASB Director, Spaulding National Running Center Walking Periods of DOUBLE SUPPORT Running Periods of
Running Gait Mechanics. Walking vs Running. Ankle Joint Complex Sagittal Plane. As speed increases, when has walking ended and running begun?
 Running Gait Mechanics Walking vs Running As speed increases, when has walking ended and running begun? Ankle Joint Complex Sagittal Plane 1 Ankle Joint Complex Sagittal Plane Pos. @FS 5 o DF Absorption
An investigation of kinematic and kinetic variables for the description of prosthetic gait using the ENOCH system
 An investigation of kinematic and kinetic variables for the description of prosthetic gait using the ENOCH system K. OBERG and H. LANSHAMMAR* Amputee Training and Research Unit, University Hospital, Fack,
GROUND REACTION FORCE DOMINANT VERSUS NON-DOMINANT SINGLE LEG STEP OFF
 GROUND REACTION FORCE DOMINANT VERSUS NON-DOMINANT SINGLE LEG STEP OFF Sara Gharabaghli, Rebecca Krogstad, Sara Lynch, Sofia Saavedra, and Tamara Wright California State University, San Marcos, San Marcos,
Foot Biomechanics Getting Back to the Base
 Foot Biomechanics Getting Back to the Base Christopher J. Mehallo, D.O. Rothman Institute Orthopaedics Objectives Understand basic foot biomechanics during walking and running Understand common sports
ASSESMENT Introduction REPORTS Running Reports Walking Reports Written Report
 ASSESMENT REPORTS Introduction Left panel Avatar Playback Right Panel Patient Gait Parameters Report Tab Click on parameter to view avatar at that point in time 2 Introduction Software will compare gait
Sample Biomechanical Report
 Sample Biomechanical Report To identify the root cause of an injury, and thus determine the optimal treatment for that injury, many pieces of your injury puzzle must be considered. At the Running Injury
A Biomechanical Assessment of Gait Patterns and Risk of Associated Overuse Conditions among Mature Female Runners.
 A Biomechanical Assessment of Gait Patterns and Risk of Associated Overuse Conditions among Mature Female Runners. Submitted by Kim Louise Lilley to the University of Exeter as a thesis for the degree
THE EFFECTS OF ORTHOTICS ON LOWER EXTREMITY VARIABILITY DURING RUNNING. Samuel Brethauer
 THE EFFECTS OF ORTHOTICS ON LOWER EXTREMITY VARIABILITY DURING RUNNING. By Samuel Brethauer Submitted to the graduate degree program in Health, Sport, and Exercise Science and the Graduate Faculty of the
Chapter 1 - Injury overview Chapter 2 - Fit for Running Assessment Chapter 3 - Soft Tissue Mobilization... 21
 Table of Contents Introduction Chapter 1 - Injury overview... 6 Chapter 2 - Fit for Running Assessment... 13 Chapter 3 - Soft Tissue Mobilization... 21 Chapter 4 - Dynamic Warm-up... 28 Chapter 5 - Strengthening...
ATHLETES AND ORTHOTICS. January 29, 2014
 ATHLETES AND ORTHOTICS January 29, 2014 TOPICS TO COVER TODAY Why use an orthotic? What athlete would benefit from wearing orthotics? What device should I use: Custom versus off of the shelf orthotics?
Figure 1 betois (bending torsion insole system) system with five measuring points and A/D- converter.
 system with five measuring points and A/D- converter.") Bending and Torsional Moments - A new measuring system for gait analysis Nora Dawin & Annette Kerkhoff & Klaus Peikenkamp, University of Applied Sciences Münster, Germany Abstract The Laboratory of Biomechanics
Bending and Torsional Moments - A new measuring system for gait analysis Nora Dawin & Annette Kerkhoff & Klaus Peikenkamp, University of Applied Sciences Münster, Germany Abstract The Laboratory of Biomechanics
BIOMECHANICAL EVALUATION OF RUNNING AND SOCCER SHOES: METHODOLOGY AND TESTING PROCEDURES. Ewald M. Hennig
 BIOMECHANICAL EVALUATION OF RUNNING AND SOCCER SHOES: METHODOLOGY AND TESTING PROCEDURES Ewald M. Hennig Biomechanics Laboratory, University Duisburg-Essen, Essen, Germany Running shoes are the footwear,
Running injuries - what are the most important factors
 Created as a free resource by Clinical Edge Based on Physio Edge podcast 59 with Greg Lehman, Tom Goom and Dr Christian Barton Get your free trial of online Physio education at Why do runners get injured?
Biofeedback Insole can help to Increase Performance and Comfort, and Reduce Injury.
 Biofeedback Insole can help to Increase Performance and Comfort, and Reduce Injury. During independent third party testing for consumer acceptance and evaluation purposes the device was found to provide
THE ANKLE-HIP TRANSVERSE PLANE COUPLING DURING THE STANCE PHASE OF NORMAL WALKING
 THE ANKLE-HIP TRANSVERSE PLANE COUPLING DURING THE STANCE PHASE OF NORMAL WALKING Thales R. Souza, Rafael Z. Pinto, Renato G. Trede, Nadja C. Pereira, Renata N. Kirkwood and Sérgio T. Fonseca. Movement
Gait analysis through sound
 Invited article Niigata Journal of Health and Welfare Vol. 15, No. 1 Gait analysis through sound Kaoru Abe Graduate School of Health and Welfare, Niigata University of Health and Welfare, Niigata, Japan
Outline. Biomechanics of Running. Biomechanics of Running 3/11/2011. Born to Run : A Biomechanical Analysis of Barefoot vs.
 Born to Run : A Biomechanical Analysis of Barefoot vs. Shod Running Linfield College Alicia Amsberry, Brooke Bekkedahl, & Michelle Weber Outline The Biomechanics of Running Barefoot vs. Shod-Running Vibram
Clinical Observational Gait Analysis
 Clinical Observational Gait Analysis Paul Harradine MSc FFPM RCPS(Glasg) FCPodMed CertEd Podiatrist The Podiatry Centre. Portsmouth, Farnham, Chichester and Southampton www.thepodiatrycentre.co.uk Introduction
Dynamix Ankle Foot Orthoses Range
 The Restyled Dynamix Ankle Foot Orthoses Range Supporting your wellbeing Product Range Introduction Index Product Range Introduction... 3 Puffin - Dynamix Supramalleolar... 4 Penguin - Dynamix Plantarflexion...
PATHOLOGICAL CONDITIONS REQUIRING THE USE OF CUSTOMIZED LASTS
 ICAMS 2014 5 th International Conference on Advanced Materials and Systems PATHOLOGICAL CONDITIONS REQUIRING THE USE OF CUSTOMIZED LASTS DANIEL PETCU, GHEORGHE BERIJAN INCDTP Division: Leather and Footwear
Influence of a custom foot orthotic intervention on lower extremity dynamics in healthy runners
 Clinical Biomechanics 21 (26) 623 63 www.elsevier.com/locate/clinbiomech Influence of a custom foot orthotic intervention on lower extremity dynamics in healthy runners Christopher MacLean a, Irene McClay
Modelling the stance leg in 2D analyses of sprinting: inclusion of the MTP joint affects joint
 1 Technical Note 2 3 4 5 Title: Modelling the stance leg in 2D analyses of sprinting: inclusion of the MTP joint affects joint kinetics (corrected version) 6 7 8 9 10 11 Authors: Neil E. Bezodis a,b, Aki
Case Report: The Infant Flatfoot
 Sergio Puigcerver (1) ; Juan Carlos González (1) ; Roser Part (1) ; Eduardo Brau (1) ; Luis Ramón Mollá (2) (1) Instituto de Biomecánica de Valencia, UPV. Valencia, Spain; ibv@ibv.upv.es ; www.ibv.org
Palacký Univerzity in Olomouc Faculty of Physical Culture
 Project: Sophisticated biomechanic diagnostics of human movement Registration number: CZ.1.07/2.3.00/09.0209 Palacký Univerzity in Olomouc Faculty of Physical Culture Tento projekt je spolufinancován Evropským
PLANTAR FASCIITIS. Points of Confusion. TREATING SUBCALCANEAL PAIN: Who gets the best outcomes?
 TREATING SUBCALCANEAL PAIN: Who gets the best outcomes? DOUGLAS H. RICHIE, JR., D.P.M. Seal Beach, California Points of Confusion Pathomechanics of Plantar Fascia overload: Foot Pronation STJ Pronation
Diabetes and Orthoses. Rob Bradbury Talar Made
 Diabetes and Orthoses Rob Bradbury Talar Made Diabetes High prevalence disease 4-6% in UK (over 2.5 mill diagnosed and a further 0.5 ) 6+% in USA 40% in some parts of Middle East (may be higher in Indian
Footwear Science Publication details, including instructions for authors and subscription information:
 This article was downloaded by: [Eveline Graf] On: 23 May 2013, At: 04:28 Publisher: Taylor & Francis Informa Ltd Registered in England and Wales Registered Number: 1072954 Registered office: Mortimer
Does Changing Step Width Alter Lower Extremity Biomechanics During Running?
 University of Tennessee, Knoxville Trace: Tennessee Research and Creative Exchange Masters Theses Graduate School 5-2012 Does Changing Step Width Alter Lower Extremity Biomechanics During Running? Richard
The Starting Point. Prosthetic Alignment in the Transtibial Amputee. Outline. COM Motion in the Coronal Plane
 Prosthetic Alignment in the Transtibial Amputee The Starting Point David C. Morgenroth, MD, Department of Rehabilitation Medicine University of Washington VAPSHCS Outline COM Motion in the Coronal Plane
Purpose. Outline. Angle definition. Objectives:
 Disclosure Information AACPDM 69 th Annual Meeting October 21-24, 2015 Speaker Names: Sylvia Õunpuu, MSc and Kristan Pierz, MD Gait Analysis Data Interpretation: Understanding Kinematic Relationships Within
Custom Ankle Foot Orthoses
 A Comparison of Negative Casting Techniques Used for the Fabrication of Custom Ankle Foot Orthoses How you cast makes a big difference in correctly capturing an impression foot. By Doug Richie DPM and
Impact of heel position on leg muscles during walking
 Original article Niigata Journal of Health and Welfare Vol. 14, No. 1 Impact of heel position on leg muscles during walking Koichi Akaishi Graduate School of Health and Welfare, Niigata University of Health
Comparison of Langer Biomechanic s DynaFlange to Traditional, Legacy, Rear Foot Posted Orthotics
 Comparison of Langer Biomechanic s DynaFlange to Traditional, Legacy, Rear Foot Posted Orthotics DynaFlange Testing Session 2012 Sally M Crawford MS, Biomed Eng, Neuromuscular Eng. Sally.crawford@noraxon.com,
FOOT FUNCTIONING PARADIGMS
 THE PUBLISHING HOUSE MEDICINE OF THE ROMANIAN ACADEMY Review article FOOT FUNCTIONING PARADIGMS PETCU DANIEL 1 and ANCA COLDA 2 1 National Research and Development Institute for Textiles and Leather- The
SAPPHIRE PHYSICAL THERAPY
 www.fisiokinesiterapia.biz SAPPHIRE PHYSICAL THERAPY PRESENTATION OUTLINE Foot Facts Foot & Ankle Anatomy Shoe Anatomy Common Foot Injuries Orthotics Sport & Activity Specific Shoes Questions & Answers
Comparison of Langer Biomechanic s DynaFlange to Traditional Legacy Rearfoot Posted Orthotics
 Comparison of Langer Biomechanic s DynaFlange to Traditional Legacy Rearfoot Posted Orthotics This study demonstrates the advantages of these devices. BY SALLY M. CRAWFORD, MS Background Motion control,
Neurorehabil Neural Repair Oct 23. [Epub ahead of print]
![Neurorehabil Neural Repair Oct 23. [Epub ahead of print]](/thumbs/86/94477916.jpg "Neurorehabil Neural Repair Oct 23. [Epub ahead of print]") APPENDICE Neurorehabil Neural Repair. 2009 Oct 23. [Epub ahead of print] Segmental Muscle Vibration Improves Walking in Chronic Stroke Patients With Foot Drop: A Randomized Controlled Trial. Paoloni M,
APPENDICE Neurorehabil Neural Repair. 2009 Oct 23. [Epub ahead of print] Segmental Muscle Vibration Improves Walking in Chronic Stroke Patients With Foot Drop: A Randomized Controlled Trial. Paoloni M,
CHAPTER IV FINITE ELEMENT ANALYSIS OF THE KNEE JOINT WITHOUT A MEDICAL IMPLANT
 39 CHAPTER IV FINITE ELEMENT ANALYSIS OF THE KNEE JOINT WITHOUT A MEDICAL IMPLANT 4.1 Modeling in Biomechanics The human body, apart of all its other functions is a mechanical mechanism and a structure,
Michiel Twiss BScPT, MScPT i.a. Contact:
 Quest for the Holy Strike Contemporary considerations for the clinical management and prevention of running related injuries: kinematics and kinetics in forefoot and rearfoot strike patterns Michiel Twiss
Association between Iliotibial Band Syndrome Status and Running Biomechanics in Women
 University of Tennessee, Knoxville Trace: Tennessee Research and Creative Exchange Doctoral Dissertations Graduate School 8-2013 Association between Iliotibial Band Syndrome Status and Running Biomechanics
WalkOn product range. Dynamic Ankle-Foot Orthoses. Information for specialist dealers
 WalkOn product range Dynamic Ankle-Foot Orthoses Information for specialist dealers WalkOn Flex WalkOn WalkOn Trimable WalkOn Reaction WalkOn Reaction plus One range Many different applications The WalkOn
In memory of Dr. Kevin P. Granata, my graduate advisor, who was killed protecting others on the morning of April 16, 2007.
 Acknowledgement In memory of Dr. Kevin P. Granata, my graduate advisor, who was killed protecting others on the morning of April 16, 2007. There are many others without whom I could not have completed
The Influence of Load Carrying Modes on Gait variables of Healthy Indian Women
 The Influence of Load Carrying Modes on Gait variables of Healthy Indian Women *Guha Thakurta A, Iqbal R and De A National Institute of Industrial Engineering, Powai, Vihar Lake, Mumbai-400087, India,
Rob Burke B.Sc. KIN and Reggie Reyes B.Sc. KIN August 2002
 Structural relationship between foot arch length and height and the relavtive effects on foot strength (stability) and impact loading (shock absorption) while barefoot, shod, shod with custom orthotics,
A bit of background. Session Schedule 3:00-3:10: Introduction & session overview. Overarching research theme: CPTA
 A Cognitive-Biomechanical Perspective for the Management of Common Chronic Musculoskeletal Conditions Skulpan Asavasopon, PT, PhD Loma Linda University Christopher M. Powers, PT, PhD, FAPTA University
Sample Solution for Problem 1.a
 Sample Solution for Problem 1.a 1 Inverted Pendulum Model (IPM) 1.1 Equations of Motion and Ground Reaction Forces Figure 1: Scheme of the Inverted Pendulum Model (IPM). The equations of motion of this
Normal and Abnormal Gait
 Normal and Abnormal Gait Adrielle Fry, MD EvergreenHealth, Division of Sport and Spine University of Washington Board Review Course March 6, 2017 What are we going to cover? Definitions and key concepts
University Honors Program. Capstone Approval Page
 Patenaude 1 NORTHERN ILLINOIS UNIVERSITY Differences in Foot-strike Patterns during Jogging: A Literature Review A Thesis Submitted to the University Honors Program In Partial Fulfillment of the Requirements
Gait Analysis at Your Fingertips:
 Gait Analysis at Your Fingertips: Enhancing Observational Gait Analysis Using Mobile Device Technology and the Edinburgh Visual Gait Scale Jon R. Davids, MD; Shriners Hospitals for Children Northern California;
REPORT. A comparative study of the mechanical and biomechanical behaviour of natural turf and hybrid turf for the practise of sports
 REPORT A comparative study of the mechanical and biomechanical behaviour of natural turf and hybrid turf for the practise of sports Addressed to: PSF - PALAU TURF Date: May 2015 Table of Contents SHEET
The Lateralized Foot & Ankle Pattern and the Pronated Left Chest
 The Lateralized Foot & Ankle Pattern and the Pronated Left Chest Presented by: James Anderson, MPT, PRC Director of Affiliate Programs, Faculty & Board of Certification Postural Restoration Institute Pronate
Artifacts Due to Filtering Mismatch in Drop Landing Moment Data
 Camenga et al. UW-L Journal of Undergraduate Research XVI (213) Artifacts Due to Filtering Mismatch in Drop Landing Moment Data Elizabeth T. Camenga, Casey J. Rutten, Brendan D. Gould, Jillian T. Asmus,
Arch Height and Running Shoes: The Best Advice to Give Patients
 Arch Height and Running Shoes: The Best Advice to Give Patients by Thomas C. Michaud, DC Published May 1, 2014 by Dynamic Chiropractic Magazine Because runners with different arch heights are prone to
Afoot. What s VASYLI. Biomechanical foot function: a Podiatric perspective. Introduction: Anatomical structure and function. Continued on Page 2
 What s foot iomechanical foot function: a Podiatric perspective by Trevor D. Prior, Podiatrist Introduction: ipedal upright locomotion is one of the defining characteristics of the human race, yet it is
video Purpose Pathological Gait Objectives: Primary, Secondary and Compensatory Gait Deviations in CP AACPDM IC #3 1
 s in CP Disclosure Information AACPDM 71st Annual Meeting September 13-16, 2017 Speaker Names: Sylvia Ounpuu, MSc and Kristan Pierz, MD Differentiating Between, Secondary and Compensatory Mechanisms in
Axis of rotation is always perpendicular to the plane of movement
 Sports scientists and medical practitioners use formal terms to describe directionality, joint movement, and muscle movement. These universal terms let us use fewer words when describing movement, teaching,
The Promise of Achieving Higher Standards in Children s Health. The Gait and Motion Analysis Laboratory Referral Guide
 The Promise of Achieving Higher Standards in Children s Health Nemours/Alfred I. dupont Hospital for Children has consistently been ranked among the best in the nation for pediatric orthopedics by U.S
A New Approach to Modeling Vertical Stiffness in Heel-Toe Distance Runners
 Brigham Young University BYU ScholarsArchive All Faculty Publications 2003-12-01 A New Approach to Modeling Vertical Stiffness in Heel-Toe Distance Runners Iain Hunter iain_hunter@byu.edu Follow this and
THREE DIMENSIONAL KINEMATICS OF HUMAN METATARSOPHALANGEAL JOINT DURING LOCOMOTION
 THREE DIMENSIONAL KINEMATICS OF HUMAN METATARSOPHALANGEAL JOINT DURING LOCOMOTION A thesis submitted to The University of Manchester for the degree of Master of Philosophy in the Faculty of Engineering
video Outline Pre-requisites of Typical Gait Case Studies Case 1 L5 Myelomeningocele Case 1 L5 Myelomeningocele
 Outline Evaluation of Orthosis Function in Children with Neuromuscular Disorders Using Motion Analysis Outcomes Terminology Methods Typically developing Case examples variety of pathologies Sylvia Õunpuu,
RUNNING SHOE STIFFNESS: THE EFFECT ON WALKING GAIT
 RUNNING SHOE STIFFNESS: THE EFFECT ON WALKING GAIT Stephen N Stanley, Peter J M c Nair, Angela G Walker, & Robert N Marshall Auckland Institute of Technology, Auckland, New Zealand University of Auckland,
The importance of physical activity throughout an individual's life is indisputable. As healthcare
 What to Expect When They re Expecting: A Look at Biomechanical Changes in Walking/Running During Pregnancy Jennifer Bruer-Vandeweert, Megan Hotchkiss, Jamie Kronenberg, Kristin Olson Dr. Rumit Singh Kakar,
Spasticity in gait. Wessex ACPIN Spasticity Presentation Alison Clarke
 Spasticity in gait Clinicians recognise spasticity but the elements of spasticity contributing to gait patterns are often difficult to identify: Variability of muscle tone Observation/recording General
Analysis of a Kinetic Multi-Segment Foot Model. Part II: Kinetics and Clinical Implications
 Brigham Young University BYU ScholarsArchive All Faculty Publications 2012-4 Analysis of a Kinetic Multi-Segment Foot Model. Part II: Kinetics and Clinical Implications Dustin A. Bruening dabruening@byu.edu
Aeris Performance 2. Product Manual
 Aeris Performance 2 Product Manual Instructions The Aeris Performance 2 is designed to be maintenance free. The foot is water resistant; however, if the foot is submerged in water, the foot and foot shell
Treating Foot Pain in Alpine Skiers with
 SPORTS PODIATry Treating Foot Pain in Alpine Skiers with Pes Planus What role should the podiatrist play? 103 By Lawrence Z. Huppin, DPM and Paul R. Scherer, DPM Jakub Gojda Dreamstime The foot plays a
Product catalog Top models
 Product catalog Top models formthotics.com Select from a wide range of foam densities Original Single Hard Original Single Firm Original Dual Hard Original Dual Medium & Original Dual Medium (perforated)
Characteristics of ball impact on curve shot in soccer
 Available online at www.sciencedirect.com Procedia Engineering 60 (2013 ) 249 254 6 th Asia-Pacific Congress on Sports Technology (APCST) Characteristics of ball impact on curve shot in soccer Sungchan
Foot Posture Biomechanics and MASS Theory
 The Foot and Ankle Online Journal Official Publication of the International Foot & Ankle Foundation faoj.com / ISSN 1941-6806 Foot Posture Biomechanics and MASS Theory by Edward S Glaser 1 and David Fleming
Ground Reaction Forces and Lower Extremity Kinematics When Running With Suppressed Arm Swing
 Ground Reaction Forces and Lower Extremity Kinematics When Running With Suppressed Arm Swing Ross H. Miller 1 e-mail: rhmiller@kin.umass.edu Graham E. Caldwell Richard E. A. Van Emmerik Brian R. Umberger
SCHEINWORKS Measuring and Analysis Systems by
 Pressure Measurement Systems for standing and walking analysis Germany since 1879 Pressure Measurement Systems for standing and walking analysis Documentation of Gait image Stance Symmetry of all parameters
Orthotic intervention in forefoot and rearfoot strike running patterns
 Clinical Biomechanics 19 (24) 64 7 www.elsevier.com/locate/clinbiomech Orthotic intervention in forefoot and rearfoot strike running patterns Carrie Laughton Stackhouse a, *, Irene McClay Davis b,c, Joseph
Running Injuries in Adolescents Jeffrey Shilt, M.D. Part 1 Page 1
 Running Injuries in Adolescents Jeffrey Shilt, M.D. Chief Surgical Officer, The Woodlands, Texas Children's Hospital Associate Professor, Orthopedic and Scoliosis Surgery, Baylor College of Medicine Part
Equine Trust Summer Scholarship
 Development of 3D gait model Student: Nicola Wichtel Supervisor: Dr Robert Colborne Equine Trust Summer Scholarship In 2015, The Equine Trust funded the purchase of a 6-camera infrared kinematic system
BIOMECHANICS OF FOOT FUNCTION IN RELATION TO SPORTS PERFORMANCE GRACE SMITH
 BIOMECHANICS OF FOOT FUNCTION IN RELATION TO SPORTS PERFORMANCE GRACE SMITH A thesis submitted in partial fulfilment of the requirements of liverpool John Moores University For the degree of Doctor of
Coordination among the rearfoot, midfoot, and forefoot during walking
 Takabayashi et al. Journal of Foot and Ankle Research (2017) 10:42 DOI 10.1186/s13047-017-0224-3 RESEARCH Open Access Coordination among the rearfoot, midfoot, and forefoot during walking Tomoya Takabayashi
Functional Outcomes of a Custom, Energy Harvesting "Bullfrog" AFO
 Functional Outcomes of a Custom, Energy Harvesting "Bullfrog" AFO Principal Investigator Géza F. Kogler, Ph.D., C.O. Co-Principal Investigator Young-Hui Chang, Ph.D. Co-Investigators Hosna Sharafi, BME
EXPLORING MOTIVATION AND TOURIST TYPOLOGY: THE CASE OF KOREAN GOLF TOURISTS TRAVELLING IN THE ASIA PACIFIC. Jae Hak Kim
 EXPLORING MOTIVATION AND TOURIST TYPOLOGY: THE CASE OF KOREAN GOLF TOURISTS TRAVELLING IN THE ASIA PACIFIC Jae Hak Kim Thesis submitted for the degree of Doctor of Philosophy at the University of Canberra
'Supporting' the Foot 2 May 2002
 'Supporting' the Foot 2 May 2002 Proper alignment of the foot is widely considered as being necessary for normal function during gait. Poor alignment of the foot is associated with symptoms such as metatarsalgia,
Rotation Centers of the Equine Digit and their Use in Quantifying Conformation
 Presented at the Roth Kinematics Symposium, Stanford University, June 21, 2003. Rotation Centers of the Equine Digit and their Use in Quantifying Conformation John J. Craig, Phd ; Monique F. Craig, BSCE;
Ice skating in all its various forms. Living on the Edge: The Biomechanics of Power Skating
 Living on the Edge: The Biomechanics of Power Skating There are some very specific overuse injury patterns seen in the ice hockey population. 135 By R. Neil Humble, DPM Ice skating in all its various forms
Throw the Baby Out with the Bath Water? Challenging the Paradigm of Root Biomechanics
 Throw the Baby Out with the Bath Water? Challenging the Paradigm of Root Biomechanics Faculty Jarrod Shapiro, DPM, FACFAS, FACFAOM Associate Professor Western University of Health Sciences College of Podiatric
Gait Analyser. Description of Walking Performance
 Gait Analyser Description of Walking Performance This brochure will help you to understand clearly the parameters described in the report of the Gait Analyser, provide you with tips to implement the walking