Forest City: Heart & Sole A plan for people who walk in Forest City December 2015
|
|
|
- Bertha White
- 6 years ago
- Views:
Transcription


1 Forest City: Heart & Sole A plan for people who walk in Forest City December 2015 A Comprehensive Pedestrian Plan for the Town of Forest City & NC Department of Transportation
2 Acknowledgments Thank you to the following organizations that contributed to. Steering Committee Members Tammy Arrowood, Citizen Leeann Camp, Citizen Stephen Bennett, Citizen Donna Ohlmstead, Advocate Terry & Teresa Mode, Advocates Jarrett Roberts, Puzzle Creek David Smith, Impact Fitness Mandy Huffman, Fitness Solutions Arthur Littlejohn, Gteam Salomon Mendoza, Immigrantes Unitedos de Rutherford County Yesenia Ponce, Immigrantes Unitedos de Rutherford County Mary Smith, Active Routes to School Becky Koone, Rutherford County Health Department Clark Poole, Rutherford County Chamber Kristina Solberg, NCDOT Division 13 Karyl Fuller, Region C/Isothermal RPO John Vine-Hodge NCDOT Bicycle & Pedestrian Transportation Division John Condrey, Town of Forest City Amy Bridges, Town of Forest City Jimmy Clay, Town of Forest City Jody Wright, Town of Forest City Donnie Hensley, Town of Forest City Consultant Team

3 Table of Contents 1. Introduction Building the Plan Existing Plans & Policies Building a System for People who Walk Designing for People who Walk Pedestrian Safety & Enforcement Education & Encouragement Walking: The Wonder Drug Implementation & Evaluation Appendix Forest City is recognized for its livability image of a small town with great climate and quality of life amenities that give it a competitive edge for economic growth. The vibrant downtown reflects a memorable city image of a town that promotes, protects and celebrates its unique and distinctive character. Forest City is highly regarded throughout the region and North Carolina as a progressive and dynamic small town where people want to live, work, shop, play and visit. - Forest City Land Use Plan & Guiding Vision for
4 Exhibits 1-1: How far will people walk? 4 2-1: Survey Responses Related to Walking Frequency 7 2-3: Survey Responses Related to Destinations 8 2-4: Population Pyramid for Forest City & Age Cohort Characteristics Related to Walking : Forest City Commute Data (2010 Census) : Plans & Policies Evaluated : Forest City Land Use Plan Strategies Relevant to Walkability : Downtown Forest City Plan Strategies Relevant to Walkability : Forest City Land Use Plan Strategies Relevant to Walkability : Sidewalk Zones : Existing Pedestrian Facilities & Activity Generators in Forest City : Project Ranking Criteria : Project Rankings : Project Recommendations : Short-Term Project Recommendations : Long-Term Project Recommendations (in Priority Order) : Intersection Recommendations : Intersection & Crossing Recommendations : Operating Width & Clearance Requirements for People Who Walk : Standard Drawing for Curb Ramp (NCDOT ) : Best Practices for Curb Ramps : Pushbutton Location Area (MUTCD; Figure 4E-3) : Typical Crossing Treatment for Multi-Use Trail at a two-lane road : Typical Crossing Treatment for Multi-Use Trail at a four-lane highway : Alternative pedestrian facilities : Design Resources : Pedestrian Crash Rates in WNC Towns : Pedestrian Crashes in and Around Forest City ( ) : The Impact of Vehicle Speed : Injured Body Regions of a Pedestrian When Hit by a Motorist : Pedestrian Law in North Carolina : This is Your Brain on Walking : The Health Benefits of Walking (Source: Everybody Walk! ) : Behavior Change Resulting from a Mile of New Sidewalks/Greenways : Broad Health Benefits of Walking-related Facility Investments : Action Steps for Implementation : Potential Schedule for Implementation : Evaluation Measures for Creating a More Walkable Forest City : Job Creation Potential of Walking Facilities 79

5 1. Introduction Since ancient times streets have served as a place where people socialized, conducted business and explored their city. During that time the predominant mode of transportation was walking. When Forest City was incorporated in 1877 walking was still the primary mode of transportation for human beings and downtown was built at a pedestrian scale. Chapter 1: Introduction By the time Forest City was selected by the US Department of Agriculture as one of the ten most beautiful and well planned towns in the country in 1927, the town had begun a transition. This period would see streets deemphasize pedestrian mobility while land use and transportation priorities focused on accommodating automobiles. Forest City s core its downtown still reflects the many virtues that made the town one of America s most prized small towns in the 1920s. The Town s efforts at historic preservation have also reflected these long-standing community values. In the book Fighting Traffic author Peter Norton chronicles the transition in the United States from streets meant for people to streets that were designed exclusively for automobiles. In detailing this transition, Norton notes that all (road user) groups agreed that some of the effects of new cars in old streets were disastrous. This early argument fostered hopes that common sense solutions could be found. If all groups did their bit, perhaps street problems would be solved. A Comprehensive Pedestrian Plan Those sentiments chronicled by Norton have contemporary meaning: In order to improve walkability and increase pedestrian safety in Forest City and across North Carolina, street problems can be solved by collectively addressing the problem through input from community members, business owners, planners, engineers, architects, law enforcement and many others. Forest City s downtown is the model from which the community can build upon to improve walkability across the town. The Pedestrian Plan identifies projects, programs and policies to help accomplish the goals of the Forest City Comprehensive Land Use Plan. Photo: Don Kostelec is an effort funded by the Town of Forest City and the North Carolina Department of Transportation to assist the community in making a stronger connection between the features of the community that make it more walkable and the health of its current and future residents. Small towns face unique challenges today more than ever. Over time Forest City has become more physically and socially disconnected due to highway expansion, autocentric investment priorities by public and private entities, and changes in overall retail markets. These influences caused more traditional neighborhood businesses to move from walkable neighborhood areas to high volume vehicular corridors. 1

6 Chapter 1: Introduction Forest City is recognized for its livability image of a small town with great climate and quality of life amenities that give it a competitive edge for economic growth. - Forest City Comprehensive Land Use Plan 2025 The goal of is to identify how Forest City can establish and enhance facilities within its boundaries to serve as physical activity and recreation hubs, create places where residents can access healthy food, and reconnect neighborhoods via multi-modal transportation infrastructure and additional programs. This effort comes at a time when Forest City, Rutherford County and other nearby towns are working to reimagine how the region can continue to grow a healthy environment, increase recreational opportunities and promote economic development. Forest City Comprehensive Land Use Plan is one step in the process to help reimagine the community on the heels of the Town s efforts in 2012 to adopt the Forest City Comprehensive Land Use Plan. The plan acknowledges the community desires multi-modal connectivity between locations where citizens live, work and play. Walkability is the fundamental building block of this. Numerous studies, including a 2012 analysis on job creation by AASHTO, show that investments in walkability-based projects have a greater return on investment than traditional highway widening projects and other major transportation investments. It will be incumbent upon the community as a whole, with support from the Town of Forest City, NCDOT and its many partners, to continue to make the case for investment in walkability. The Forest City Comprehensive Land Use Plan establishes the vision : Forest City is recognized for its livability image of a small town with great climate and quality of life amenities that give it a competitive edge for economic growth. The vibrant downtown reflects a memorable city image of a town that promotes, protects and celebrates its unique and distinctive character. Forest City is highly regarded throughout the region and North Carolina as a progressive and dynamic small town where people want to live, work, shop, play and visit. The Plan includes the following goals related to walkability and health: Cultivate the identity of the Town as a hub of economic activity in the region. Promote a sustainable land development pattern that complements the character of the Town. Provide for adequate services and infrastructure to sustain and improve economic development. 2

7 Provide opportunities for residents to connect with Parks and Recreation facilities throughout the community. Foster a vibrant and attractive downtown atmosphere that residents and visitors enjoy. Establishing a safe and efficient multi-modal transportation network that accommodates the demand from proposed land uses is the transportation goal in the Plan. These interrelationships led Forest City to establish the overall goals of the Comprehensive Land Use Plan as the goals for the Comprehensive Pedestrian Plan. Major Influences The influences on walkability listed below reflect how a community can respond, in part, by creating a more walkable area as emerging demographic, health, and economic trends suggest physical activity and having places to recreate is at the heart of making small towns economically competitive in contemporary society and the modern economy. 1. Changing Demographics. Communities like Forest City find young adults continuing to move out of the area. Moreover, older adults tend to be moving in. All of this leads to declining birth rates and rapidly aging populations. 2. Health Issues. Obesity rates tend to be higher than the national average among every age group in areas with demographic indicators similar to Forest City. This results from neighborhoods lacking easy access to healthy foods and recreational spaces, as well as an automobile-reliant population. 3. Housing. Based upon trends, young professionals, trades people, minorities, and some seniors prefer smaller, multi-family housing versus conventional singlefamily homes. The plan for the Florence Mill buildings helps address this emerging market trend. 4. Rental Share. The share of renter-occupied housing for Forest City (51.7%) is notably higher than the North Carolina average (33.3%). By comparison, Rutherfordton s share of renter-occupied housing is 38.7% and Spindale s is 45.7%. 5. Transportation Costs. Despite the high cost of fuel, areas like Forest City remain very auto-dependent. Except when destinations are within close proximity to a person s residence, transportation options combined with travel distance to jobs and other resources causes transportation costs to rise more because individuals must purchase fuel for automobile travel and pay for associated repairs. While commuting to a job may be a trip that residents must make by car due to the reali- 3 Chapter 1: Introduction Changes in health conditions, an aging population and increase in individuals with mobility impairments all impact how a community addresses walkability. Photo: Don Kostelec

8 Chapter 1: Introduction Exhibit 1-1: How far will people walk? Research has proven that people are willing to walk longer distances to reach a destination if they are given safe and convenient facilities. ties of a small town market, we can replace automobile-based trips for recreation and shopping by promoting walkability. Sidewalks as a Smart Investment In her article, Sidewalks A Smart Investment, Dr. Kathleen Beine of Kingsport, Tennessee notes that there are many approaches and solutions to the [health] crisis A significant part of the solution is to make it easy to be physically active---where you don't have to load up a car and drive someplace, or join a gym. Just make it easy by walking out your front door and lead your family on a neighborhood adventure outing, possibly to a small community park to play and visit with other neighbors. Sidewalks are smart investments. Benefits of properlydesigned sidewalks and connectivity include improved: Pedestrian safety; Safety for motorists (not worrying about hitting a pedestrian, decreased risk of swerving head-on into another motorist when trying to avoid an unexpected pedestrian in the road); Sociability and neighborliness; Air quality from decreased usage of vehicles; Family budgets because of being able to safely walk on short trips rather than driving; Health, such as aerobic capacity, cardiovascular fitness, muscle strength and balance; decreased obesity, diabetes, heart disease, high blood pressure, asthma, cancers of various types; and Mental and emotional health, such as decreased depression, anxiety, and social isolation -improved work performance, on the job and at school (that's where kids work). It also leads to decreased medical costs for individuals and companies. The cost of a mile of sidewalk is cheap compared to emergency room visits, operations, hospital stays, rehab, and sometimes, permanent disability. Places and distances where people are willing to walk are illustrated in Exhibit

9 2. Building the Plan Those who walk the community, manage its businesses and administer the Town s business know the community best. Any good Plan is built from input from these and other key individuals and organizations. The cornerstone of is the public/stakeholder input and what is known about the town through analysis of demographic data. The efforts to build the plan consisted of a multi-pronged approach to spread awareness of the planning process and ensure a variety of local perspectives were incorporated into the plan. Residents, key stakeholders, and town staff were engaged during the planning process through the following channels: Steering Committee Meetings; Public Meetings and Outreach Events; and a Public Input Survey. Finally, a brief analysis of Census data was compiled to provide a snapshot of prevailing statistically-valid demographic data and conditions across Forest City. Steering Committee The process for the Plan was overseen by a Steering Committee comprised of representatives from the Town, the County, the business community, pedestrian and health advocacy organizations, and several interested town residents. The Steering Committee convened on four occasions to provide input on pedestrian issues and opportunities, serve as a sounding board for elements of the planning process, and review plan deliverables. The first Steering Committee meeting was held in July at the Town s 108 Meeting Building on Main Street in downtown Forest City. The consultant team gathered feedback about important pedestrian destinations and hotspots in the Town to be evaluated by the consultant team. The second Steering Committee meeting was held concurrently with the Public Workshop for the Plan at the Mooneyham Public Library in September This meeting was used to gather input from stakeholders on locations for pedestrian facility improvements that would help connect people with popular destinations. The third and fourth Steering Committee meetings were held in January and March 2015 to review open house materials, determine project ranking criteria, refine project rankings and review the draft plan document. 5 Chapter 2: Building the Plan Steering Committee members learned the basics of walkability during their first meeting by measuring walking speed and human dimensions on Main Street in Forest City. Photo: Sealy Chipley

10 Chapter 2: Building the Plan The Forest City Owls Game in summer 2014 was a successful venue for public input as 59 surveys were collected and individuals engaged with the consultant team to identify concerns and needs in the community. Photo: Don Kostelec Public Meetings and Outreach Events Owls Game In August 2014 the consultant team set up an informational booth at McNair Field for a Forest City Owls baseball game to raise awareness about the pedestrian plan and encourage participation in the public input survey. To attract more survey respondents, a raffle was held and those who completed the survey had the opportunity to win an Owls hat and jersey. In total, 59 individuals completed the survey during the game. Public Workshop A public workshop was held in September at the Library to collect input from Town residents and stakeholders on popular destinations in Forest City and pedestrian network improvements that would make walking to these locations safer and more convenient. The workshop was advertised through notices in the local newspaper, posts on the Town website and Town Facebook page, lists for Town boards and community organizations, s from local residents and organizations collected during Plan outreach efforts, and announcements at other Town meetings. The meeting was opened with a presentation by the consultant that included an overview of the plan purpose and timeline, a review of basic pedestrian planning concepts, and preliminary findings from field research in the Town. Meeting attendees were then divided into groups for a mapping exercise. Each group identified places that they would like to walk, and then highlighted gaps in the pedestrian network where construction or improvement projects were needed for sidewalks, greenways and intersections. Each group presented their top five pedestrian projects, and common themes that emerged from the exercise were used as the basis for a facilitated discussion that concluded the workshop. Map mark-ups, projects, and discussion topics from the workshop were used to help formulate recommendations in the Plan. Open House In February 2015 the joint Open House and Greenways Meeting was held at the Meeting Center in downtown Forest City. Approximately 15 residents dropped by during one of two sessions to learn more about the Plan s findings and to provide feedback on recommendation. This included locations for proposed crosswalks and sidewalks, streetscape improvements, and the proposed greenway network. Throughout the Open House, a slideshow was running in the background that summarized key themes for meeting attendees. Participants were also encouraged to review and comment on the Town s map that summarizes all of the recommended pedestrian improvements. They had the opportunity to vote on their top five pedestrian 6


11 destinations or enhancements that would support walking in Forest CIty. The most popular option from the Open House was to develop an outdoor social space, followed by a installing a public water fountain and a covered picnic shelter. Other popular recommendations included a dog park, workout stations, and a Little Free Library. Public Input Survey A public input survey was deployed to collect additional input from local residents on their walking habits, popular destinations, barriers to walking, and needed improvements to the pedestrian network. A link to the online survey was posted on the Town of Forest City website, on the Town Facebook page, and in the local newspaper. A link to the survey was also ed to Town staff, Town boards, community organizations, and local walking clubs for further distribution. Hard copies of the survey were made available at public locations such as Town Hall and Mooneyham Public Library, at public meetings for the Plan, and at events such of the Owls baseball game at McNair Field. The survey was open for four months from July to October, during which 300 online and printed responses were collected. A summary and analysis of the results from the public input survey are included in several exhibits on this and following pages. Demographics. Half of respondents reside in the Town limits of Forest City, while the other half reside in adjacent locations in the County or a neighboring Town (43% from Rutherford County outside of Forest City). Survey preferences for respondents living outside Forest City limits differed only marginally from those of Town residents. Over 60% of survey respondents were female. Women also make up 60% of the Town of Forest City population based on 2012 American Community Survey estimates. Differences in survey results between men and women were marginal. Local residents under the age of 20 are Exhibit 2-1: Survey Responses Related to Walking Frequency Chapter 2: Building the Plan 7


12 Chapter 2: Building the Plan Exhibit 2-2: Survey Responses Related to Comfort Features 8 under-represented among survey respondents, which likely explains why school was among the least popular walking destinations in responses to questions 4 and 8. Walking Destinations and Purposes. While over 90% of respondents walk for exercise or recreation, only a third walk for the purpose of transportation. Half of respondents walk sometimes or more often to the home of a friend or family member. Walking as a form of transportation to other non-residential destinations is much less common. Roughly a third of respondents walk sometimes or more often to destinations for recreation, entertainment, and shopping. Walking Comfort Levels and Factors Discouraging Walking. A large majority of respondents feel comfortable or very comfortable walking in downtown Forest City. However, roughly a third of respondents feel uncomfortable when crossing the street in Forest City. Survey respondents answering Question 11 identified numerous intersections in and around downtown where crosswalks and pedestrian signals are lacking or inadequate. As is common in many towns, an automobile-oriented transportation network with inadequate pedestrian facilities works in tandem with a sprawling, segregated pattern of development to discourage people in Forest City from walking. Traffic that makes walking unsafe or unpleasant was the most likely reason to be cited by survey respondents for not walking to a destination. Over half of respondents were also likely to avoid walking somewhere due to the lack of a continuous sidewalk to the destination. Roughly half of respondents were also likely to avoid walking somewhere because the destination was too far away and/or because they had too many errands to run in different locations. The most popular destinations that respondents would like to walk to more often included parks or recreation centers (e.g. Crowe Park) and entertainment / cultural events (e.g.

13 Owls baseball game at McNair field). Close to 90 respondents would also like to be able to access the Thermal Belt Trail for recreation or transportation. Other equally popular destinations included the homes of friends and family and shopping locations. Locations to Expand or Improve Pedestrian Facilities. Questions 9 through 11 asked respondents to identify locations for new sidewalks or trails that improve pedestrian connectivity, existing sidewalks in need of repair or upgrade, and intersections in need of pedestrian crossing facilities. Popular pedestrian network improvements suggested by respondents are summarized below for each question and illustrated with a word cloud. Question 12 provided an open-ended response for additional comments on the pedestrian issues in Forest City. A full list of responses to questions 9 through 12 have been included in the Appendix. Popular locations suggested for new sidewalks included extending W Main Street west towards Spindale, extending the Church Street sidewalk south to the Dollar General and Hwy 74, and extending the sidewalk on Trade Street west to McNair field. Extending the rail trail from Spindale to Forest City was also a very popular recommendation. Locations identified for sidewalk repair and improvement included E Main Street, Broadway Street and Arlington Street. The most common issue cited was uneven or cracked pavement. Overgrown vegetation and dim lighting were other common issues cited with the existing sidewalk network. Pedestrian improvements were most frequently recommended at the intersections of Church Street and Main Street, Arlington Street and Broadway Street, and Main Street and Broadway Street. A crosswalk and pedestrian signal was the most commonly recommended improvement suggested on Main Street at the intersections with Church Street and Broadway St. Exhibit 2-3: Survey Responses Related to Destinations 9 Chapter 2: Building the Plan

 and shopping (e.g. Wal-Mart, Dollar General, Ingles).")
14 Chapter 2: Building the Plan When asked about streets where they would like to see sidewalks or greenways, survey respondents said When asked to identify where sidewalks are in need of repair, survey respondents said 10 Multiple respondents also commented that the pedestrian light at the intersection of Oak Street and Church Street was too short to cross all lanes on Oak Street. Common themes found in additional comments made by survey respondents include: Adding street lighting to make it safer to walk at night; Extending the pedestrian network to connect residents with parks (e.g. Crowe Park, Summey Park) and shopping (e.g. Wal-Mart, Dollar General, Ingles). US Census Data & Demographics It is important to examine a community s demographics as part of developing a pedestrian plan because demographic information provides valuable clues about travel behavior, preferences and can identify potential heath-related concerns as they relate to the socioeconomic conditions in which someone is raised and/or lives. Characteristics such as age, income, vehicle ownership, and commute time can suggest a population s potential for walking as a mode of transportation. This section provides a summary of the demographic analysis for Forest City and explains the implications of the analysis for the recommendations made in. The Census data summarized in this section includes those consider most relevant. According to 2010 U.S. Census data, the Forest City s population tips slightly toward older adults age 60 and higher (Exhibit 2-4) when compared to North Carolina overall demographics. This population cohort comprises 23.4 of the town's overall population compared to only 18.4 of the state s population in this age group. Older adults are seeking walkable communities because they want to lead an independent lifestyle as they approach retirement and ultimately retire. Older adults are concerned about their safety while walking in terms of self -defense and the risk of falling. The isolation that can come from being in a large, rural estate during retirement

15 has been shown to have negative physical and mental health effects. The youth percentage for Forest City is 20.4% and similar to the 19.9% of North Carolina s population that is age 15 years and younger. Youth seek to explore the world around them and express their free will in these years. With increasing demands on the family and most households having both parental units in the workforce, youth are being asked to be more independent. Walkable communities allow for this to occur in a safe environment. The working population of Forest City is 56.2% of the population and is lower than North Carolina s proportion at 61.4%. The life of a working adult is complicated. They are seeking greater work/life balance while also considering the needs of the family, both elders and offspring. Chapter 2: Building the Plan Exhibit 2-4: Population Pyramid for Forest City & Age Cohort Characteristics Related to Walking Older Adults (23.4% of Forest City) Seeking quality of life during retirement. Concerns include living independently, social isolation and falling/sense of balance while walking. Working Population (56.2% of Forest City) Seeking easier living and convenient access. Concerns include life/work balance, safety of self and family, and improving personal and family health. Young Dependents (20.4% of Forest City) Seek to explore and express free will. Concerns by parents about safety and health. 11
16 Chapter 2: Building the Plan Exhibit 2-5: Forest City Commute Data (2010 Census) Mode of Transportation to Work Forest City % NC % Drove Alone 82.8% 81.1% Carpooled 14.5% 10.4% Worked at Home 1.7% 4.4% Public Transportation 0.5% 1.1% Walked 0.2% 1.8% Bicycle 0.0% 1.3% Travel Time to Work for Forest City Residents Percentage Less than 10 minutes 34.30% 10 to 14 minutes 25.10% 15 to 19 minutes 13.00% 20 to 24 minutes 5.80% 25 to 29 minutes 3.80% 30 to 34 minutes 5.90% 35 to 44 minutes 1.60% For other Census-related data, the American Community Survey is used for estimates for mode of transportation to work and travel time to work. The American Community Survey only measures commute modes of transportation and has no metric to indicate number of walking trips per day for recreation or other purposes. Unfortunately, the American Community Survey data for small towns and rural areas is largely unreliable within the margins typically seen for pedestrian mode share. For example, the survey, which samples a portion of the population every 5 years, indicates no one in Forest City commutes on a bicycle. This is a statistic that seems unlikely. Exhibit 2-5 shows some select journey to work data for the estimated 2,455 workers age 16 years and older in Forest City. The mode to work share indicates 0.2% of workers 16 years and older in Forest City walk as a means of commuting (the margin of error is +/- 0.5%). The table also includes data for North Carolina. The American Community Survey indicates that the average travel time to work for Forest City residents is 16.9 minutes, which is less than the NC average. More than one-third of residents report a commute time of less than 10 minutes and almost 60% of working age residents in Forest City have a commute time less than 15 minutes. This could indicate greater potential for converting some trips to walking or bicycling. It is also estimated that 6.6% of Forest City working age individuals have no access to a car, meaning they rely on carpooling, walking, public transportation, taxicab, scooter or bicycle as their primary means of travel to work. Workers reporting only one vehicle available in a household is 27.0%, with 39.6% of female workers reporting only one car in the household. This could also indicate potential trips that could be taken by a mode other than the automobile. 45 to 59 minutes 6.80% 60 or more minutes 3.80% Mean travel time to work (minutes)
17 3. Existing Plans & Policies Fueled by the booming economy in the post-world War II era, planners and decision makers implemented zoning ordinances, development regulations, and transportation policies that prioritized the needs of automobiles at the expense of pedestrians and other non-motorized travelers. As we separated our land uses and built bigger roads, we lost the connectivity between our homes and our schools and we increased the distance between our office and the grocery store. We made it difficult to navigate from place to place by anything other than a car. Forest City was not immune to this type of land development pattern. As noted in the Introduction, the town s development activity shifted away traditional neighborhood development patterns near the Main Street neighborhoods to auto-oriented development patterns along today s US 74-A and US 74 Business, where there was an adequate land supply to accommodate large parking lots and wide roads. The old schools, nearer to downtown neighborhoods were closed or repurposed when larger, less accessible schools opened. However, Forest City is on a path of change. With recent projects, plans, and codes, Forest City is taking steps to reestablish pedestrian connections and improve overall walkability. When one views Forest City's plans as a complete body of work, it is clear that the town wants to become a place that is well-connected a town where residents can walk to the grocery store, to schools, to parks, and to Main Street businesses. While stating a desire or adopting a vision is a good starting place, a vision alone cannot create a connected and coordinated pedestrian network. A community needs good policies and implementation plans to transform its vision to on-the-ground sidewalks, safe intersection crossings, and off-street paths. In other words, Forest City needs a set of built-environment policies (recreation facilities, neighborhood design, safety, aesthetics, facilities, destinations to walk to, policies that influence land use and transportation systems) that result in features that facilitate walking. This section of Heart & Sole evaluates the Forest City s built-environment policies. Exhibit 3-1 includes a list of plans and policies evaluated for the plan. Before evaluating Forest City s specific plans and policies, it is important to think about the difference between pedestrian networks where pedestrians feel safe, comfortable, and welcome and a place that feels unsafe, uncomfortable, or even life threatening. While not exhaustive, the following list highlights the key elements that make the difference. Exhibit 3-1: Plans & Policies Evaluated Town of Forest City Plans and Policies Forest City Comprehensive Land Use Plan (2012) Downtown Forest City Plan Streetscape Improvements Plan (DRAFT 2014, to be finalized concurrently with Pedestrian Plan) Town of Forest City Unified Development Ordinance Chapter 3: Existing Plans & Policies Regional Plans and Policies Thermal Belt Rail Trail Isothermal RPO / Rutherford County Comprehensive Transportation Plan Safe Routes to Schools State / Federal Plan and Policies NCDOT STIP, Funding Prioritization Process NCDOT Complete Streets Policy Other Guiding Plans and Policies 13
18 Chapter 3: Existing Plans & Policies Forest City is highly regarded throughout the region and North Carolina as a progressive and dynamic small town where people want to live, work, shop, play and visit. - Forest City Comprehensive Land Use Plan Street Design (SD): Well-designed streets reduce vehicle speeds but do not inhibit the efficient flow of transit. Crosswalks are appropriately spaced, signed, signaled, and easy to see. Streets accommodate a balance of users, including cars, bikes, and pedestrians. Connected streets are prioritized over cul-de-sacs and dead end streets. Sidewalk Design (SWD): Sidewalks are accessible and passable for those in wheelchairs or with strollers. The width, ideally 5 to 8 feet across, allows for comfortable passing. Sidewalks are in good repair, are well-lighted, and are continuous. Pedestrians can progress down the street without stepping around trees, benches, bicycle racks or other street furniture. Visual Appeal (VA): Streets have a sense of place and they include public spaces. Texture is provided by trees, benches, lighting, and public art. Buildings are oriented to the street with street facing storefronts that are interesting and welcoming. Retail and restaurant establishments cater to the pedestrian. Buildings have design elements that appeal to the pedestrian. The built environment provides cues to drivers that they are entering a pedestrian area. Sense of Direction (DIR): Pedestrians know where they are and how to get to the next destination, with signage, informational materials, and education programs to promote walking trips. Land Use Integration (LU): Land use and density patterns throughout the town integrate residential land use with other land uses, such as commercial centers, schools, and parks to decrease the distance between homes and destinations. Development Integration (DI): Sidewalk construction and the placement of other pedestrian features is required during the development process. The development process considers the needs of pedestrians in dimensional development standards (e.g. building setbacks, building entrance placement, parking lot standards, and building height, scale, and mass). Town of Forest City Plans and Policies The Town of Forest City has completed several planning efforts that ultimately lead to an improved quality of life for town residents. These plans include the Forest City Comprehensive Land Use Plan, the Forest City Downtown Plan , the Streetscape Improvements Plan, and the Town of Forest City Unified Development Ordinance. Forest City Comprehensive Land Use Plan (2012). The Town of Forest City Comprehensive Land Use Plan (CLUP), adopted in October 2012, serves as the basis for
19 Forest City s future land use and growth management decisions over the next 20 years. The CLUP s stated purpose is to pull together and prioritize implementation strategies from previous planning initiatives and establish the policy framework for implementing the long-range growth and development objectives of the Town of Forest City. The CLUP also details the town s guiding vision, which states: Forest City is recognized for its livability image of a small town with a great climate and quality of life amenities that gives it a competitive edge for economic growth. The vibrant downtown reflects a memorable city-image of a town that promotes, protects and celebrates its unique and distinctive character. Forest City is highly regarded throughout the region and North Carolina as a progressive and dynamic small town where people want to live, work, shop, play and visit. The CLUP is sectioned in to six goal areas and strategies designed to help the town actualize its vision. These areas are: Community Character and Identity; Land Use, Growth Management, and Environment; Transportation; Services and Infrastructure; Parks and Recreation, Open Space; and Downtown Development and Historic Resources. What follows in Exhibit 3-2 is a summary of the strategies from the goal areas that are relevant to pedestrian connectivity in Forest City and how they relate to elements that create a pedestrian friendly environment. Downtown Forest City Plan The Downtown Forest City Plan was adopted in 2010 and looks to the horizon year of The plan sets a vision for enhancing Downtown Forest City and details the efforts the downtown community hopes to accomplish in that timeframe. The projects that make up the plan include a number of revitalization efforts, facility rehabilitation, and new development. Exhibit 3-3 is a summary of how elements of the downtown plan reflect goals for walkability. Streetscape Improvements Plan (DRAFT 2014). McGill & Associates released a draft Streetscape Improvement Plan in June The plan includes 23 recommendations in and around the downtown area for enhanced crosswalks and landscaping to improve the aesthetic appeal of the area. The streetscape plan incorporates many of the elements that lead to a more pedestrian friendly environment, especially in the areas of street design, sidewalk design, and improvements to make the area visually interesting. The summary table is included in Exhibit 3-4. Chapter 3: Existing Plans & Policies The Downtown Forest City Plan sets a vision for enhancement of the central business district, which is one of Western North Carolina s urban planning jewels. Photo: Don Kostelec 15
20 Chapter 3: Existing Plans & Policies Exhibit 3-2: Forest City Land Use Plan Strategies Relevant to Walkability Forest City Land Use Plan Goals C5. C6. C7. Community Character and Identity: Cultivate the identity of the Town of Forest City as a hub of economic activity in the region with a small town atmosphere. Improve landscaping and lighting requirements for new developments and work with existing developments to retrofit outdated sites. Establish building design requirements to set an architectural standard for construction in the Town and work with existing developments to retrofit outdated buildings. Improve sign regulations for commercial development to reduce visual clutter and enhance rather than detract from the built environment. SD SWD VA DIR LU DI C9. Install wayfinding signs to direct residents and visitors to area attractions. Y Y Land Use, Growth Management, and Environment: Promote a sustainable land development pattern that complements the character of the Town, utilizes existing resources, and promotes economic development. Y Y Y SD SWD VA DIR LU DI Y Y Y L6. L10. Promote additional infill residential development to support existing and future commercial development. Y Y Y Improve commercial development standards for access management, parking lot location and design, landscaping, lighting, building design, fencing and signage along major corridors. Y Y Y Y Transportation: Establish a safe and efficient multi-modal transportation network that accommodates the demand from proposed land uses. SD SWD VA DIR LU DI T1. T3. T4. T5. T6. Follow a priority schedule and budget funds annually for sidewalk construction to extend and loop the existing system while connecting likely pedestrian destinations like parks, schools, churches and government buildings. Work with the RPO and NCDOT to complete new road connections, intersection improvements, and pedestrian crossing improvements as show on the Transportation Network Improvements Map. Work with the RPO and NCDOT to utilize preferred cross sections in the Rutherford County Comprehensive Transportation Plan (CTP) for state roads in Forest City s jurisdiction. Require the addition or replacement of sidewalks and bicycle facilities for development projects along thoroughfares and within new subdivisions. Improve access management by limiting curb cuts along West Main Street, Oak Street, South Broadway Street and US Highway 74-A Bypass. Y Y Y Y Y Y Y Y Y Y Y Y SD: Street Design SWD: Sidewalk Design VA: Visual Appeal DIR: Sense of Direction LU: Land Use Integration DI: Development Integration 16
21 Exhibit 3-2 continued: Forest City Land Use Plan Strategies Relevant to Walkability Forest City Land Use Plan Goals Chapter 3: Existing Plans & Policies Parks and Recreation, Open Space: Provide opportunities for residents to connect with facilities throughout the City that provide a variety of activities. SD SWD VA DIR LU DI P1. D1. D2. D5. D12. Connect residential areas to schools, parks and other amenities with greenways sidewalks, bikeways and rails-to-trails. Downtown Development and Historic Resources: Foster a vibrant and attractive downtown atmosphere that residents and visitors enjoy and preserved community character and a sense of place through the preservation of historic resources. Encourage the rehabilitation and reuse of older homes, historic buildings and neighborhoods. Pursue the adaptive re-use of the historic Florence Mill buildings, rehabilitation of surrounding historic properties and development of green space with pedestrian amenities. Throughout downtown, continue the historic preservation of existing buildings, construction of new infill buildings, upgrading of sidewalks and crosswalks and additional pedestrian friendly amenities. Create a downtown parking plan and post signs directing visitors to additional public parking. Y SD SWD VA DIR LU DI Y Y Y Y Y Y Y Y Y Y Y Y Y Y Exhibit 3-3: Downtown Forest City Plan Strategies Relevant to Walkability Downtown Forest City Plan Goals Goals/Objectives SD SWD VA DIR LU DI Florence Mills Redevelopment- the project consists of redeveloping Florence Mills for post-industrial uses, including residential units and open space. The plan specifically notes the importance of developing pedestrian amenities. Main Street- upgrade pedestrian amenities, including sidewalks and crosswalks along downtown areas of Main Street. Trade Street Redevelopment- develop a mix of uses along Main Street, including homes, stores, and offices. Other parts of the Downtown Plan include the development of more residential units close to downtown, in areas adjacent to the Florence Mill and along Trade Street. Y Y Y Y Y Y Y Y Y Y Y Y SD: Street Design SWD: Sidewalk Design VA: Visual Appeal DIR: Sense of Direction LU: Land Use Integration DI: Development Integration 17
22 Exhibit 3-4: Forest City Land Use Plan Strategies Relevant to Walkability Downtown Streetscape Plan Recommendations Street/Crossing Recommendations SD SWD VA DIR LU DI E Main Church Street Soften lot targeted for future development with landscaping, stamped brick crosswalks, crosswalk improvements Y Y Y E Main Yarboro Street Visually delineate a downtown boundary, ADA curb ramps Y Y Y Y E Main Thomas Street E Main Street and Depot Cherry Mountain Street E Main Street/Mill Maritn Alley E Main Mid-Block Crossing between Powell/Cherry Mountain Visual entrance to overlooked street, landscaping, bulbouts, ADA curb ramps, crosswalk improvements, wayfinding Crosswalk improvements, landscaping, bulbouts, ADA curb ramps, improved pedestrian guidance Delineated link to parking, improved pedestrian guidance, crosswalk improvements, curb ramps, landscaping, bulbouts, decorative features, visually delineate a downtown boundary Y Y Y Y Y Y Y Y Y Y Y Y Crosswalk improvements, pedestrian signage, ADA curb ramps Y Y Y E Main Powell Street Crosswalk treatment, refuge, landscaping, bulbouts, ADA ramps Y Y Y E Main N Broadway Delineate downtown district, crosswalk treatment, bulbout, landscaping, pedestrian direction Y Y Y S W Main Street Wayfinding, crosswalk treatment, landscaping, underground utilities Y Y Y Depot Main Street Crosswalk treatments, street lights, visual enhancements, wayfinding Y Y Y Cherry Mountain Blanton Alley Crosswalk treatments, sidewalk repair, ADA curb ramps, visual delineation of downtown, traffic calming Y Y Y N Powell Blanton Alley Crosswalk treatment, traffic calming, wayfinding, ADA curb ramp Y Y Y Martin and Blanton Alleys Powell Mill Street Mill Harmon Street Roundabout Mill Huntley Street E Main N Broadway Blanton Alley Parking Lot Trade Powell Street McDaniel Alley Dumpsters McDaniel Martin Street Mill Street Open Space Mill Street Curb Cuts Crosswalk treatment, link to parking, ADA Curb ramps, visual improvements Crosswalk treatment, ADA curb Ramps, Landscaping, visual improvements, pedestrian refuge Y Y Y Y Y Y Y Crosswalk treatment, visual improvements, ADA curb ramps Y Y Y Dropoff area for pedestrians, ADA curb ramps, visual improvements, wayfinding Delineate downtown district, crosswalk treatment, bulbout, landscaping, pedestrian direction Landscaping, link to parking, landscaping, ADA curb ramps, brick pavers, decorative features, Sidewalk Repair, ADA Curb ramp, brick pavers, landscaping, link to parking through signage, lighting, visual features, wayfinding Y Y Y Y Y Y Y Y SD: Street Design SWD: Sidewalk Design VA: Visual Appeal DIR: Sense of Direction LU: Land Use Integration DI: Development Integration 18

23 Town of Forest City Unified Development Ordinance Adopted in May 2013, the Town of Forest City s Unified Development Ordinance (UDO) is the Town s guiding policy document for land development. The UDO is the town s most useful tool to translate the Forest City s vision to on-the-ground projects. Forest City recognizes that providing a pedestrian network that is safe and accessible requires a land development ordinance that integrates the needs of the pedestrian with built environment standards. Forest City s UDO contains a variety of standards that lead to a more pedestrian friendly network. The UDO s Conservation Subdivision standards require developers to set aside a minimum of 50 percent of the subdivision s total area for common open space. Open space, as defined by the UDO, is a playground, square, park, green, greenway, greenbelt, agriculture preserve, or nature preserve. Rather than being a prescriptive standard, conservation subdivisions present an opportunity for the Town s pedestrian network. When working though the development process, town officials can engage with the developer to determine if the subdivision s open space can enhance existing and or help build new planned pedestrian connections. Forest City s Traditional Neighborhood Development (TND) standards allow for mixed-use, pedestrian-oriented neighborhoods that minimize traffic congestion, suburban sprawl, infrastructure costs, and environmental degradation. Some of the pedestrian oriented standards of this zoning district include edge lots that must be pedestrian accessible to retail and recreation uses (a distance not greater than ¼ mile) and an interconnected street network with small blocks. Additionally, a minimum of 30 percent of the total area of the TND shall be set aside in open space. Similar to Conservation Subdivisions, Forest City has an opportunity to build or enhance existing or build new pedestrian connections when TNDs are developed. The UDO s Special Requirements section contains standards related to Outdoor Display of Merchandise and Outdoor Dining. The town allows for the outdoor display of merchandise and outdoor dining on sidewalks the Central Business District (C -1) and General Business District (C-2). A retail establishment may display merchandise on the sidewalk and outdoor seating is permitted immediately in front of a restaurant provided that not more than one-half (½) of the width of the sidewalk is obstructed and at least three (3) feet of the sidewalk is left unobstructed. This type of street activity should be encouraged as both the display of merchandise and outdoor dining contribute to a business district s vibrancy and visual attractiveness. In other words, these activities engage the pedestrian. 19 Chapter 3: Existing Plans & Policies Stemming from the Land Use Plan recommendations, Forest City s Unified Development Ordinance is the Town s guiding document for land development.

24 Chapter 3: Existing Plans & Policies Exhibit 3-5: Sidewalk Zones Forest City s UDO could be strengthened by illustrating expectations for businesses along Main Street and in other future pedestrian-oriented locations. Designating the furnishings zone, pedestrian access route and frontage zone helps identify where features such as sandwich boards and plants should be placed so they do not interfere with a required clear zone for pedestrians. Illustration: Don Kostelec 20 However, three feet of sidewalk makes for a tight passage for a single person and very difficult passage for someone in a wheelchair. This also assumes the pathway is unobstructed with obstacles and protruding objects such as benches, bike racks, fire hydrants, planers, utilities, etc. The minimum acceptable ADA sidewalk width is five feet (four feet if a five-foot wide pathway is placed at least every 200 feet). Exhibit 3-5 provides an illustration based on Main Street in Forest City. Recommendations: Work with the business community to evaluate the effect of street merchandise and outdoor dining. Is the remaining pathway unobstructed? Can the obstruction be moved? Are there offlimits sections of sidewalk? The illustration at left shows an example of the pedestrian access route. It should be kept clear of any obstructions or protruding objects. Encourage wider that the five-foot minimum in C-1 and C-2 redevelopment projects. Change UDO standards to define the minimum width for the pedestrian access as four feet of clear linear space. Downtown Building Design Guidelines. The UDO contains sections dedicated to Downtown Building Design Guidelines and Non-residential Building Requirements. The intent of the these Guidelines is to maintain Downtown Forest City s historic character and ensure that infill development is compatible. The guidelines, which are voluntary, are in place to protect downtown s character and vibe; a character and vibe that is rooted in its pedestrian friendliness. Protecting Downtown s character through the design guidelines naturally protects and enhances pedestrian connections in the Downtown. The Town s Non-residential Building Requirements require design elements such as windows on the first floor, primary-street fronting facades, street level windows that are visually permeable, and other pedestrian oriented standards that result in activated streets and places. One of the stated intents of the UDO s section on signs is, to prevent signs from dominating the visual appearance of the area in which they are located and to enhance the aesthetic environment of the Forest City area. While the UDO contains a wide va-

25 riety of sign standards, two are closely associated with pedestrian friendliness. First, the UDO allows the Town of Forest City to place town-sponsored wayfinding signs a use by right; allowing for the easy placement of pedestrian oriented wayfinding signs. Second, signs allowed in the C-1 and C-2 districts--those that are or will become pedestrian friendly--are smaller and more oriented to pedestrians than automobiles. When it adopted the new UDO, Forest City implemented standards that require developers to install sidewalks in conjunction with new development. The standards require that sidewalks shall be provided along the frontage street and at least on one side of the new streets for all developments, and sidewalks shall be at least five feet wide and shall be separated from the street by a minimum four-foot buffer. The standards also address sidewalk thickness and joints. The standards do not address accessibility or curb ramps, nor does the UDO state that developers are required to label sidewalks on subdivision plats or development plans. Recommendations. Consider adding language to the ordinance or adopting a policy that states that sidewalk design and standards should follow NCDOT s sidewalk standards. Consider adding standards that require developers to bring sidewalks up to standard during building rehabilitation projects. Finally, the UDO contains miscellaneous standards that enhance the town s pedestrian friendliness. These standards include: Environmental Protection and Open Space: This section includes a provision that allows narrow walking paths in stream buffers. Open Space Requirements for New Developments with Five or More Lots: The amount of open space is dependent upon the development s density. The types of open space allowed include playgrounds, squares, parks, greens, greenways, greenbelts, agriculture preserves, and nature preserves. The standards also allow for payment in lieu of open space. Landscaping: A variety of landscaping requirements for commercial and residential developments lead to a more pedestrian friendly environment. Of note are the standards related to commercial parking lot design. Parking Lots: While primarily auto-oriented, Forest City s UDO standards related to parking lots minimize a pedestrian s exposure to automobiles through landscaping and planting islands, maintenance, encroachment, and connectivity standards. The UDO does not include standards for bicycle parking. Recommendation: Consider adding bicycle parking standards. These standards should take into consideration that once a cyclist is off the bike, s/he becomes a pe- 21 Chapter 3: Existing Plans & Policies Sandwich boards placed on the sidewalks by merchants are the most common obstruction encountered along downtown sidewalks. They infringe upon the pedestrian access route and make it difficult for older adults, persons in a wheelchair and persons with visual impairments to freely navigate the sidewalk system. Photo: Don Kostelec

26 Chapter 3: Existing Plans & Policies The intersection of West Main Street and Withrow Road / Hudlow Road is in need of improvements for both pedestrians and motorists. Forest City should work with the RPO to ensure this intersection is identified in the Comprehensive Transportation Plan and considered for inclusion in a future STIP. Photo: Don Kostelec 22 destrian. Bicycle racks should be placed in locations that are not in conflict with automobile circulation. Driveways: The UDOs minimum width standards pertaining to driveway widths 10 feet minimum for one way traffic and 18 feet minimum for two way traffic- are acceptable widths to reduce a pedestrian s exposure to automobiles. However, driveway design is not a clear cut or simple process. Recommendation: Before issuing a driveway permit, Forest City, or in negotiations with NCDOT, should make it a policy to consider how the driveway design affects pedestrians and, when appropriate, implement mitigation measures. Regional Plans and Policies Thermal Belt Rail Trail. The Thermal Belt Rail Trail does not currently reach the limits of Forest City, but does serve the neighboring towns of Spindale and Rutherfordton. A section of the trail between Ruth and Spindale was recently paved, increasing user-safety and allowing more people to use the trail. Community members want the trail to continue to Forest City and this may be an option sometime in the future. Isothermal RPO, Rutherford County CTP. The Isothermal RPO hosted the first meeting of the Rutherford County Comprehensive Transportation Plan (CTP) in January A CTP is a multi-modal transportation plan that, according to NCDOT, represents a community s consensus on the future transportation system (including the existing system and improvements) needed to support anticipated growth and development over a year timeframe. The CTP planning process is Forest City s opportunity to introduce the town s pedestrian projects into NCDOT s funding process. The RPO anticipates a late 2015, early 2016 plan completion date. Findings of should be incorporated into the CTP. Safe Routes to Schools. As of December 2014, there are no Safe Routes to Schools/Active Routes to Schools projects planned in Forest City, nor are there any existing projects. According to the region s Active Routes to Schools Coordinator, there is some interest from the elementary school community to host a Walk to School Day. State and Federal Planning Policies The NCDOT State Transportation Improvement Plan (STIP), released in December 2014, contains only two pedestrian specific improvement projects in Forest City and Rutherford County; which are two sections of the Thermal Belt Rail Trail. Section 1 Runs from Aydlotte Road (SR 1531) to US 64 and calls for trail widening and resurfacing of the existing trail. The total project cost for this project is $2.3 million
27 and is scheduled for construction in Section 2 runs from US 64 to Oakland (SR 2169) for $1.5 million and construction in A streetscape project is also slated for Mill Street from Main Street to Depot Street. Oak Street is also planned for widening west of US 74. Chapter 3: Existing Plans & Policies The STIP also contains a number of road improvements, including bridge repair and replacements. There is a Division managed bridge replacement program. Forest City should use the Isothermal RPO both to program pedestrian-specific projects and to ensure that bridge projects contain needed pedestrian design features on both sides of the bridge. DOT will fund and construct sidewalks on both sides of bridges less than 200 feet in length; one side for structures with a span greater than 200 feet. NCDOT s Complete Streets Planning and Design Guidelines. The adoption of the state s Complete Streets policy in 2009 began the process for NCDOT to develop a set of guidelines for implementation of the policy. While NCDOT has adopted the Complete Streets policy, they also encourage individual towns to adopt their own policy via resolution. As new projects come on-line, developments are considered and improved, and parks and other public facilities are constructed, Forest City should ensure their design and street connections comply with Complete Streets goals. NCDOT s Complete Streets policy states that Complete Streets is North Carolina s approach to interdependent, multi-modal transportation networks that safely accommodate access and travel for all users. In its Policy Statement, DOT says Transportation, quality of life, and economic development are all undeniably connected through well-planned, well-designed, and context sensitive transportation solutions. Further, in its role as stewards over the transportation infrastructure, it states NCDOT is committed to: Providing an efficient multi-modal transportation network in North Carolina such that the access, mobility, and safety needs of motorists, transit users, bicyclists, and pedestrians of all ages and abilities are safely accommodated; Caring for the built and natural environments by promoting sustainable development practices that minimize impacts on natural resources, historic, businesses, residents, scenic and other community values, while also recognizing that transportation improvements have significant potential to contribute to local, regional, and statewide quality of life and economic development objectives; Working in partnership with local government agencies, interest groups, and the public to plan, fund, design, construct, and manage complete street networks that 23 Complete streets are designed to be safe and comfortable for all users, including pedestrians, bicyclists, transit riders, motorists, and individuals of all ages and capabilities. - North Carolina Department of Transportation Complete Streets Guidelines

28 Chapter 3: Existing Plans & Policies NCDOT s Complete Streets Planning & Design Guidelines include several illustrations on how to build a community for people who walk. The Guidelines also contain conceptual cross-sections that serve as the starting point for project discussions. These Guidelines and associated documents can be accessed via the following site: Other NCDOT Policies for Reference: NCDOT Bridge Policy RoadwayDesignAdministrativeDocuments/Bridge%20Policy.pdf NCDOT Pedestrian Policy Guidelines NCDOT Greenway Policy NCDOT Board of Transportation Resolution for Bicycling and Walking bikeped_laws_bot_mainstreaming_resolution.pdf 24 sustain mobility while accommodating walking, biking, and transit opportunities safely. This policy requires that NCDOT s planners and designers consider and incorporate multi-modal alternatives in the design and improvement of all appropriate transportation projects. The adoption of Complete Streets policies at the local government level should go beyond design standards like those in the NCDOT Complete Streets guidance and should consider how subdivision, zoning, stormwater management and other ordinances consider the needs of all modes of travel. Streets should not be deemed complete unless the design of the land uses adjacent to those streets is also complete in its consideration of bicycle and pedestrian modes, as it does little to promote use of non-motorized modes to have a bicycle lane or a sidewalk if those users cannot safely reach the front door of a store or business, and park their bicycle, once they leave the street environment. The Town should also pursue policies and design guidance for non-dot streets and greenways that help connect complete streets to a variety of land use types. With the passage of the Strategic Transportation Investments law in 2013, NCDOT is prohibited from using state funds for standalone pedestrian and bicyclist projects.

29 4. Building a System for People who Walk Developing a list of projects to improve walkability in Forest City is not as simple as identifying where sidewalks exist and where they are missing. Identifying projects that promote walkability is an exercise in identifying destinations or land uses that are most likely to generate pedestrian trips if linked through a network of quality pedestrian facilities. The concept of quality is critical to understand as pedestrians are not a homogenous user of the transportation system; seniors have different needs than adults, as do children. Understanding what constitutes a quality of service for each user type will lead a community down the correct path to identify the proper pedestrian facility and corresponding dimensional needs. The project recommendations explored for Forest City are a mix of traditional treatments such as sidewalks and greenways along with ideas geared toward addressing places along streets or in parking lots that are of concern based on crash data. Existing Facilities Like most downtown areas, Forest City is connected with a sidewalk network that has been in place since downtown took its current form. While the Town may be interested in upgrades to enhance it for pedestrians safety and economic development purposes, the basic elements of facilities for people who walk downtown provide a pleasant environment. Many of the primary routes whose footprints were established decades ago have sidewalks along one or both sides of the street. These are the routes radiating from the downtown area and reflect sidewalk design qualities from an era where separation from traffic was common and links were provided to neighborhoods. Broadway Street, Main Street, Harmon Street, Clay Street and Old Caroleen Road are a few such places. Most of these sidewalks are still functional but many lack modern curb ramps for better access for people of all ages and abilities, including those with disabilities. Many intersections are in need of updated or new marked crosswalks to provide better visibility for those who walk. Streets constructed within the past decade begin to reflect new policies and interest by Forest City and NCDOT to better accommodate pedestrians. The new section of Oak Street, Learning Parkway, and the streets around the Florence Mills site are examples. These modern sidewalks are in good shape and have only minor upgrades needed in their design with regard to ADA needs, primarily the curb ramps. The remaining streets that lack sidewalks were developed in eras where requirements were not as prevalent as they are today. Street segments where adjacent land was 25 Chapter 4: Building a System for People who Walk This chapter addresses a variety of project types for people who walk. It is combination of upgrades along corridors like Main Street (above) as well as new sidewalks on streets where projects are a high priority. Photo: Don Kostelec
30 Chapter 4: Building a System for People who Walk How projects were identified for Recommendations from Past Plans Input via Open House & Survey Steering Committee & Health Workshop Consultant Field Review & Input Mapping & Project Rankings Public & Steering Committee Review Final Recommendations annexed into Forest City over the past several decades have not been upgraded to include sidewalks. Many of these streets, especially those with higher volumes of vehicular traffic, were identified through the Land Use Plan and the Pedestrian Plan as those with the highest level of need for walking facilities. A map of existing facilities is shown on the following page (Exhibit 4-1). Primary Generators & Attractors Initial input on the plan from Steering Committee members and health professionals focused on the destinations within or near Forest City that should be linked via a network of facilities for people who walk. These generators or attractors of pedestrian activity are: Downtown and the Florence Mills site; Forest City - Dunbar and Forrest Hunt Elementary Schools; McNair Field; Callison Recreation Center & Municipal Golf Course; Crowe Park; Hardin Road Park; Shopping areas along the US 74 Bypass and Broadway Street; Thomas Jefferson Academy; Rutherford Opportunity Center; Isothermal Community College; and Rutherford County Government complex between Forest City and Spindale. Overall Recommendations The process of identifying projects for Forest City consisted of: Reviewing project recommendations in the Forest City Land Use Plan and Downtown Streetscape project; Gathering feedback at the Steering Committee meetings, through public involvement efforts and through the health workshop; Conducting field evaluation of walking conditions; and Identifying popular destinations and walking routes. From this input, the projects recommendations contained in this chapter are developed at what is referred to as planning level, meaning that they were examined for their relative value and evaluated based on field observations. Detailed right-of-way analysis or design processes were not conducted as part of this Plan, rather those steps will follow as the Town, NCDOT and its partners work toward implementation. The cost estimates contained in this Plan are based on this planning level evaluation and prevailing costs per mile of similar facilities at the time of Plan development. 26

31 Exhibit 4-1 Existing Pedestrian Facilities & Activity Centers in Forest City Chapter 4: Building a System for People who Walk 27

32 Chapter 4: Building a System for People who Walk The Steering Committee met to identify how they would prioritize projects based on weighting of a variety of factors. The average weight placed upon these factors by the Committee was used to develop the ranking process. Photo: Sealy Chipley Project Development. To become reality, projects may go through up to four phases depending on their level of complexity. 1. Feasibility studies may occur on projects like greenways or streetscape plans to gather more information. This could include a field review by Town staff; 2. Most projects begin with Design, which is the surveying, measuring and scoping of the project to produce a set of drawings to define the exact parameters of the projects and the manner in which it can be constructed; 3. Acquisition of land may then occur if the project design process indicates additional land is needed; in some cases there may be existing right-of-way to accommodate the project; and 4. Once the project is designed and land has been acquired or is available, the project may then move into the Construction phase. A majority of the projects identified in this Plan are at a point they can move into either a design phase or a joint feasibility study / design phase. Depending on the implementing agency, design may be done by in-house staff or can be contracted through a design consultant. All pedestrian facility recommendations along NCDOT-maintained routes require review by NCDOT Highway Division 13 prior to implementation. Ranking Projects The projects identified through the early stages of the plan were mapped for consideration by the Steering Committee and review by the public at the second Open House meeting. The Steering Committee was convened in January 2015 to identify the criteria by which they wanted to evaluate the projects in order to develop a priority list. The criteria shown on the following page (Exhibit 4-2) illustrate how projects were scored. The maximum number of points available for each criteria (ranging from 5 points to 20 points) was identified by the Steering Committee. Individual committee members were asked to identify how they would score projects on a matrix of criteria. Their inputs were averaged to then identify the relative weight (reflective in the maximum number of points available) of each criterion. Projects were scored based on this weighting. At the final Steering Committee meeting, the group was then allowed to assign committee points to projects they saw as a priority or ones where they felt the criteria did not (and could not) address every factor for making it a priority. The consultant team used the outcomes of this ranking process (Exhibit 4-3) to identify the top-10 projects that constitute short-term priorities for Forest City. 28
33 Chapter 4: Building a System for People who Walk Exhibit 4-2: Project Ranking Criteria Primary Criteria Possible Points Secondary Criteria Possible Points Safety: Crash data indicate a history of pedestrian crashes along the proposed route ( data) Proximity to Parks or Natural Areas: Project will connect parks to neighborhoods and other destinations. Proximity to Downtown and/or Jobs: Project will connect downtown to neighborhoods and other destinations; or major employment centers. Proximity to Schools/ Churches: Project will connect a school or churches to neighborhoods and other destinations. Ease of Implementation: Measures the likelihood that project can be easily implemented based on available right-of-way and other constraints. 20: Corridor has fatal crashes 15: Corridor has 3 documented crashes 10: Corridor has 2 documented crashes 5: Corridor has 1 documented crash 0: Corridor has no crashes 15: Project has direct connection or is within ¼-mile of a park 10: Project is within ¼-mile of a park but has no direct connection 5: Project is within ½-mile of a park but has no direct connection 0: Project is beyond ½-mile 15: Project has direct connection or is within ¼-mile of downtown 10: Project is within ¼-mile of downtown but has no direct connection 5: Project is within ½-mile of downtown but has no direct connection 0: Project is beyond ½-mile 10: Project has direct connection or is within ¼-mile of a school 7: Project is within ¼-mile of a school but has no direct connection 4: Project is within ½-mile of a school but has no direct connection 0: Project is beyond ½-mile 10: Project has no evident right-of-way constraints or other feasibility issues 7: Project has limited right-of-way constraints or few feasibility issues 4: Project has a right-of-way or feasibility issue but not both 0: Project has major right-of-way constraints or feasibility issues Note: Measurements are approximate. Where measurements were borderline or unclear, the score for a criterion reflects the higher number. 29 Access to Food: Project will connect major food outlets to neighborhoods. Population in Need: Project is within a Census Block Group identified as having socioeconomic needs related to income and/or race. Traffic Exposure: Based on function of the roadway project is along. Identified in Past Plans: Project was identified in past local or regional plans. Fills Gap in System: Project will connect to existing facilities by filling the gap between them. Steering Committee Priority: Points assigned by the steering committee. 5: Project is within ¼-mile of a major food outlet (grocery story or farmers market) 3: Project is within ½-mile of a major food outlet (grocery story or farmers market) 1: Project is within ¼-mile of a minor food market (convenience store) 0: Project is beyond these limits. 5: Project is within a block group showing need among more than 2 categories 3: Project is within a block group showing need among 2 categories. 1: Project is within a block group showing need in 1 category. 0: Project is not within a block group showing need. 5: Project is along or crosses a US highway route 3: Project is along or crosses a state highway or other arterial route 1: Project is along a local street that connects two highways or arterials 0: Project is along a local street that does not connect two highways or arterials. 5: Project is identified in 2 or more past plans or in Priority Group A of Land Use Plan. 3: Project is identified in a past plan. 0: Project is not identified in past plans. 5: Project fills a gap in the existing sidewalk system along a high volume route. 3: Project fills a gap in the system along secondary routes. 0: Project does not address a gap in the system. Steering committee was asked to assign a score from 1 to 5 for each project. Points assign reflect the average points (rounded) assigned by the steering committee.


34 Chapter 4: Building a System for People who Walk The Downtown Streetscape Improvements Plan includes several before (left) and after (right) drawings of ideas for enhancement the downtown walking environment. Rendering: McGill & Associates Short-Term Project Priorities The following pages contain more detailed project profiles for the top-10 projects identified through the project ranking. These top-10 projects are labeled as short term investments because they are the ones Forest City and its partners should seek funding options to implement them over the next one to 10 years. A shortcoming of any project ranking method is that it cannot assign factors to deal with all project influences in terms of implementation realities related to budgeting, grant availability and unknown factors that can only be determined through project development or design. While Forest City should begin pursuing its top priorities it should not overlook opportunities that arise to fund projects ranked lower on the list of short-term improvements. It is also important to understand that opportunities for implementation may vary greatly for greenway projects and sidewalk projects. Acquisition of the rail line will be the major determinant in the feasibility of constructing the Thermal Belt Rail Trail through the Town. If this opportunity does not arise, it does not mean that the project should not be the Town s top priority; it simply means that other priorities may be more effectively addressed in the short-term. Exhibit 4-3 shows the project ranking with the top-10 projects identified as short-term improvements. Estimates include full project estimates (sidewalks plus intersections) Exhibit 4-4 is a map of recommended projects, both short and long-term. Exhibit 4-5 contains more detailed descriptions and cost estimates for short-term projects, which are inclusive of all known intersection improvements. Note that detailed intersection improvements are unknown due to planning-level evaluation of these projects. T6 Downtown Focus Area The Downtown Streetscape Improvements Plan identifies nearly $1 million worth of improvements within and beyond the pedestrian realm. In total, these improvements are intended to promote economic development in the downtown core and create a showcase for walkability in Forest City. There are 23 projects at intersections identified in the Streetscape Improvements Plan. These were incorporated into the ranking methods for this Plan and prioritized as Main Street Streetscape Improvements. These improvements are not specifically identified in the project profiles as this section. Details are available in the streetscape document. For this plan the consultant team identified those features within the Downtown Streetscape Plan that best aligned with the purpose of the pedestrian plan primarily sidewalk and crossing upgrades. The collection of these projects is identified in the project ranking exhibit. The Town of Forest City is working to identify the funds for some of these improvements as part of its fiscal year budget. 30


35 Chapter 4: Building a System for People who Walk Exhibit 4-3: Project Rankings The project ranking was developed through input from the Steering Committee about which factors they felt were most important for people who walk in Forest City. The maximum points available for each category was determined by this input and each project was scored on those merits. 31


36 Exhibit 4-4 Project Recommendations 32
 paved multiuse trail")


37 Exhibit 4-5: Short-Term Project Recommendations Thermal Belt Rail-Trail West Main Street Bracketts Crk Greenway Oakland St to Forrest Hunt Dr Smith Grove Rd to Gettys St Chapter 4: Building a System for People who Walk Isothermal CC to Church St Rural Avenue Construct a 10-foot wide (12-foot wide through downtown area) paved multiuse trail along the rail line. The five-mile long pathway would link many destinations within Forest City and is identified as the Town s top overall priority and the project most likely to have the greatest impact on community health. Influences: Existing trail in Spindale Downtown & Florence Mills site Rutherford County complex Callison Recreation Center Neighborhoods along the trail Forrest Hunt Elementary School Cost Estimate: $3,000,000 Length: 5.1 miles Health Impact: High Economic Impact: High Construct a 6-foot wide sidewalk buffered by a five-foot planting strip along both sides of West Main Street (north side preferred if only one side is chosen). Crosswalks and intersection upgrades to modern standards at signals and public streets should be included with this project to facilitate safe crossing of the corridor and connection to the rail-trail. Right-of-way does not appear to be a major constraint. Influences: Busy highway corridor with no sidewalks Route has documented crash history Neighborhoods west of downtown Businesses along West Main Street Access to future rail-trail Cost Estimate: $1,730,000 Length: 1.7 miles Health Impact: High Economic Impact: Moderate 33 Construct a 10-foot wide paved multiuse trail along existing sewer easements and parallel to the US 74 Bypass. The 2.6-mile trail could extend up to 3.0 miles to connect to downtown and the proposed rail-trail. The pathway could run along the east side of US 74 Bypass to the Oak Street intersection if crossing under or at Plaza Drive is difficult. Influences: Isothermal Community College Shopping areas along US 74 Bypass Neighborhoods on south side of Town Connection to future rail-trail Cost Estimate: $1,500,000 Length: 2.5 miles Health Impact: High Economic Impact: High


 with project U-5833. Consider rural cross section to avoid curb/gutter costs and other constraints.")
38 Exhibit 4-5, continued: Short-Term Project Recommendations Broadway Street Sunnyside Dr to Main St Broadway Street 4 5 T6 Forrest Hunt to Sunnyside Oak Street Piney Ridge Rd to US 74-Byp 3-lane Urban/ Suburban Blvd 3-lane Urban/ Suburban Blvd Rural Road Reconstruct broken sidewalks in combination with curb ramp and driveway upgrades to meet ADA design guidelines. Fill sidewalk gaps, including along parking areas fronting the street. Improve signalized intersections with high visibility crosswalks and pedestrian signals. Intersections include Washington Street and Oak Street. Space constraints may require modified design of ramps. Influences: High crash location Downtown access Shopping areas along the route Grocery store access Neighborhoods along the route Forrest Hunt Elementary School Cost Estimate: $120,000 Length: 1.0 miles Health Impact: Moderate Economic Impact: Moderate Improve Wells Dr crossings to allow pedestrians to cross from west to east side in to access overpass. Improve crossings at Pine St for better visibility at off-ramps. Construct sidewalks along route to Forrest Hunt Dr. Upgrade curb ramps and driveways where sidewalks already exist and fix broken sidewalks. Identify locations for mid-block crossings at or near the schools. Influences: High crash location Lack of crossings north and south of interchange Shopping areas along the route Neighborhoods along the route 3 public/private/charter schools Cost Estimate: $480,000 Length: 1.5 miles Health Impact: High Economic Impact: High Construct a 5-foot wide sidewalk buffered by a five-foot planting strip (north side preferred to connect to existing sidewalks near shopping areas) with project U Consider rural cross section to avoid curb/gutter costs and other constraints. Crosswalks and intersection upgrades should be included to facilitate crossing of the corridor at key intersections and entrance to shopping areas. Influences: Area shopping and employment Future Bracketts Creek greenway connection Access to Oak Street corridor east of Bypass Cost Estimate: $130,000 Length: 0.6 miles Health Impact: Moderate Economic Impact: High 34


 along east")
39 Exhibit 4-5, continued: Short-Term Project Recommendations Trade Street McNair St to Elizabeth St East Main Street Broadway St to Town Limit Chapter 4: Building a System for People who Walk McNair Drive Main St to Trade St Urban/ Suburban Main Street Fill sidewalk gaps and reconstruct sidewalks with buffer where feasible. Upgrade crossing treatments at intersections to include pedestrian signals and crosswalks at signalized intersections and crosswalks at unsignalized locations of all public street intersections. Install new curb ramps. Right-of-way and existing structure are a constraint that may require narrower sidewalks in some sections. Influences: Downtown Neighborhoods to north and east McNair Field Town Hall Cost Estimate: $100,000 Length: 0.9 miles Health Impact: Moderate Economic Impact: High 35 Rural Village Main Street Construct new sidewalks to fill gaps and replace broken sidewalks along 1.3 mile section east of downtown. Install crosswalk/signal at Broadway. Utility pole locations suggest there is existing right-of-way to accommodate sidewalks. The railroad overpass is a major constraint and would require shortening of left turn lane at entrance to Nu Way Packing Road to fit under the bridge. Influences: Downtown access Crash history Rutherford Opportunity Center nearby Neighborhoods along the route Future greenway along the river Cost Estimate: $420,000 Length: 1.3 miles Health Impact: Moderate Economic Impact: Low Rural Village Main Street Construct a new 6-foot wide sidewalk with 2-foot buffer (as space allows) along east side to fill this one-block gap in the sidewalk that would link Main Street to McNair Field. Project would provide an upgrade to the edge of the parking lot for the business at that location. Influences: McNair Field Downtown Fills gap in system to population destination Provides a segment between McNair Field and future rail-trail. Cost Estimate: $30,000 Length: 0.1 miles Health Impact: Low Economic Impact: Moderate
40 Chapter 4: Building a System for People who Walk Exhibit 4-6: Long-Term Project Recommendations (in Priority Order) Long-Term Project Priorities Fourteen long-term projects were identified through planning process in addition to the 10 short-term projects. These were identified as long-term due to their ranking. It is generally anticipated these projects could be constructed beyond a 10-year timeframe. Exhibit 4-6 includes a brief summary of these projects and cost estimates. Forest City should continue to seek opportunities to construct these projects or require any new development along them to install sidewalks in anticipation of a future full-length project along these routes. The construction of the greenways and rail-trail projects may influence these projects. In general these projects ranked lower because they were along routes with fewer influences or destinations and lower traffic volumes. Project / Cost Estimate Description Project / Cost Estimate Description Hardin Rd, W Main St to Church St ($680,000; 1.3 miles) Construct a 6-foot wide sidewalk buffered by a five-foot planting strip (west side preferred if only one side is chosen). Upgrade existing sidewalks Duke St/Daniel Rd, W Main St to Isothermal CC Crossing ($790,000; 1.5 miles) Construct sidewalks along one side. Will link future greenway to rail-trail and Main Street. US 74 is a major crossing. Cherry Mtn Rd, Main St to Crowe Park Dr ($560,000; 1.1 miles) Construct sidewalks along one side (west side seems most suitable). Will link future greenway to neighborhoods and shopping. Hudlow Rd, W Main St to Cable Tower Rd ($270,000; 0.5 miles) Construct sidewalks along one side; may be detached with drainage swale between road and pathway. Church St, Spruce St to US 74 Alternate ($570,000; 1.1 miles) Construct sidewalks on east side (due to US 74 approach) of the street to connect to Crowe Park. Vance St, Learning Pkwy to Town Limit ($370,000; 0.7 miles) Construct sidewalks along west side to link residential areas north of school entrance road. Links to future Parks Greenway crossing. Parks Greenway, Summey Park to Crowe Park ($800,000; 1.3 miles) Construct multiuse trail along existing easements and access roads between the two parks. Old Caroleen Rd, Florida Av to Riverside Dr ($310,000; 0.6 miles) Construct/replace sidewalks along south side to town limits. Explore ways to connect via pathway to future greenway along the river. Forest St, Hardin Rd to Oak St ($270,000; 0.5 miles) Construct sidewalks on one side of the street. There may be major constraints due to narrow road width and utilities. Elizabeth Av, E Main St to Trade St ($70,000; 0.1 miles) Construct sidewalk along east side to connect neighborhood to East Main Street and Trade Street. Church sidewalks are offset from street. Turner St, Main St to McDaniel St / Dunbar Elem ($260,000; 0.5 miles) Construct sidewalks on one side with connection to school property and track. Will provide future rail-trail to school connection. Brackett Rd/Washington St, Church St to Broadway St ($560,000; 1.1 miles) Construct sidewalk along one side of road to connect neighborhoods and nearby shopping areas as well as future trails. Butler Rd, US 74 Bypass to Oak St ($240,000; 0.4 miles) Construct sidewalks along one side. Will link future greenway to neighborhoods and shopping. Withrow Dr, Duke St to W Main St ($520,000; 1.0 miles) Construct sidewalk along one side of the street to link to future rail-trail. 36

41 Special Project Oak Street - US 74 Bypass to Broadway Avenue Oak Street (SR 2241) represents a category of roadway that typically presents both safety and accessibility problems for pedestrians. Facilities like Oak Street act as a barrier for pedestrians, causing people not to take trips or to use a car for short, otherwise walkable, trips in order to avoid having to cross the road on foot. Additionally, because of the high average speed of vehicles on Oak Street, any crash that does occur there is more likely to be fatal than a crash on a local street. This is identified as a special project because we recognize many of the facilities along it are new and addressing existing and emerging issues will require a detailed level of analysis by NCDOT to correct deficiencies in the roadways overall design. This will require approaches and funding sources beyond the normal scope of what is identified in a pedestrian plan. Oak Street was constructed with some facilities for pedestrians. There are sidewalks on both sides of the corridor from South Broadway Street (Alt 221) to Hardin Road, and there are some crosswalk markings and pedestrian signals. Intersections create a number of potential conflict points where existing marked crosswalks may even give pedestrians a false sense of security. The intersections at Harmon and Young Streets have marked crosswalks but no traffic signals. NCDOT s Traffic Survey Unit observed a volume of approximately 11,000 vehicles per day (AADT) on Oak Street just east of Church Street in The Federal Highway Administration s (FHWA) publication, Safety Effects of Marked Versus Unmarked Crosswalks at Uncontrolled Locations: Final Report and Recommended Guidelines (2005) discourages the use of marked crosswalks without additional pedestrian safety measures (including signals, signage, and traffic calming such as bulbouts or median pedestrian refuges). Oak Street does not conform to these Guidelines. FHWA recommends using additional treatments with unsignalized marked crosswalks on similar roadways with volumes of 9,000 to 11,000 vehicles per day. These recommendations are based on studies of driver compliance with crosswalk laws at selected unsignalized crosswalks. The guidelines also advise against the use of marked, unprotected crosswalks on any facility with a speed limit of 40 mph or higher. The current speed limit on Oak Street is 45 mph. 37 Pedestrians wishing to cross Oak Street at Harmon Street are subject to a crosswalk that is 150-feet long across six lanes of traffic the widest section along the entire stretch of Oak Street. There is no protection for pedestrian or measures to slow vehicle speeds. This route connects housing to the south to downtown and Florence Mills site. Photo: Don Kostelec Recommendations for Existing Intersections Short term: NCDOT could consider marking corner islands with thermoplastic markings and tubular delineators. These will create slip lanes for motor traffic and pedestrian refuges with shorter crossing distances for pedestrians. Pedestrian refuge areas could be placed in the center lane by restriping Oak Street with narrower lanes. Long term: Replace the marked islands with concrete islands with either cut-through (lower cost and usually more comfortable) or ramped paths (may be needed for drainage reasons). Request evaluation for NCDOT Highway Safety Improvement funds due to the fatalities along the route.
42 Special Project Oak Street - US 74 Bypass to Broadway Avenue Other recommendations to consider along Oak Street include: Broadway St: Reduce curb radius or install channelized islands to discourage high speed turning traffic and reduce pedestrian crossing distance. Liberty St: Due to the curvature of Oak and Liberty Streets and wide turning radii at intersections, there are potential visibility problems at crosswalks. Extending curbs to reduce turning radii could improve safety and would allow for flat landings to bring the curb ramps into compliance with ADA standards Harmon St: This crossing is a substantial distance from the signalized intersections at Broadway and Church. Crosswalks are marked in all four legs of the intersection, but there is no other traffic control. FHWA recommends additional protections for pedestrians at such a crossing. The geometry of this intersection also poses a challenge for pedestrians. If signalized, a realignment to calm traffic, improve sight lines, and shorten the pedestrian crossing distance should be explored. As an interim measure, signage could alert drivers to upcoming marked crosswalks and reminding them of their duty to yield to pedestrians. Young St: Young Street has uncontrolled marked crosswalks on all four legs. The crosswalk across Young Street on the south leg of the intersection is unnecessarily diagonal and could benefit from realignment to minimize crossing distance and alleviate potential confusion for visually impaired pedestrians. This intersection could also benefit from replacing the parallel crosswalk markings with ladder markings to improve visibility. Church St: The crosswalk markings could be replaced with higher visibility treatments. Additional signage to alert motorists to the presence of pedestrians can be added and a longer term project might include squaring off the corners to shorten crossing distance and provide curb ramps with ADA-compliant landings. McArthur Street to Golf Street, including Forest St.: Intersections in this section have ramps behind the stop bars, meaning a motorist waiting for a clearance would obstruct the crosswalk. Placement of curb ramps and stop bars should be evaluated. Hardin Rd: Align crosswalks with continuous path for better visibility. Add refuge islands and install accessible pedestrian buttons. Evaluate signal timing to allow for crossing of older residents who live south of Oak Street and access the store. 38 Recommendations for Roadway Reconfiguration Short term: Reducing the speed of vehicles on Oak Street should be a key component of a pedestrianfriendly traffic calming strategy. Lowering the speed limit to 35 mph is recommended, but speed limit signs do little to actually influence driver behavior. Channelized island, like those shown above from design details from NCDOT s Standard Drawings, should be considered at intersections along Oak Street to reduce pedestrian exposure to long crossing distances and unprotected crossings. Long term: Consideration should be given to narrowing travel lanes on Oak Street and adding bicycle lanes to promote a more multi-modal environment, as well as to adding a landscaped median (or enhancing existing landscaped medians) to all or parts of the corridor.
43 Intersection Improvements Intersections present many challenges to constructing standalone pedestrian safety projects, especially if no sidewalks are present. Right-of-way constraints are a primary factor in intersection improvement if there are no sidewalks as oftentimes these properties are developed close to the intersection. Exhibit 4-7: Intersection Recommendations Intersection upgrades can take many forms, but primarily consist of sidewalks, curb ramps, crosswalks, and audible pedestrian signals. Other features may include channelized islands, median refuge islands and bus stop pads and shelters. A combination of these features must be included when full-length sidewalk projects are constructed and impact an intersection. Forest City should work with NCDOT to identify intersection upgrades where necessary and already connected to existing sidewalks along statemanaged routes. An example of this is the crosswalks and pedestrian signals at the intersection of Oak Street and US 74 Bypass that were installed in There are three main corridors identified in this pedestrian plan for intersection upgrades. Oak Street, Broadway Street and Main Street represent the areas of Forest City where there is a combination of the highest pedestrian volumes and highest vehicular traffic volumes. Where these two modes conflict is at intersections, which is a contributor to the pedestrian crashes along these routes. The short-term projects identified earlier in this chapter outline recommendations for Broadway and Main Street. Details on Oak Street are outlined in the next section. Exhibit 4-7 includes recommendations for intersection along other streets. Exhibit 4-8 is a map of recommended intersection improvements. Greenways proposes more than 15 miles of greenways throughout the town on the rail line and along the river. It is an ambitious goal and includes creating both a complete outer greenway loop of the town and a cross-town connector via an extended Thermal Belt Rail Trail. The sidewalk system would ultimately connect to these major greenway corridors providing a comprehensive pedestrian network to and from all sections of the town. This system, once complete, will make Forest City a role model for small town greenway systems. The system, in combination with the sidewalk network, will essentially allow any Forest City resident the ability to travel throughout and town and to key des- 39 Project / Cost Estimate Hardin Rd at Forest St ($5,000) US 74 Bypass at Church St ($110,000) W Main Street at Withrow St/ Hudlow St ($36,000) Arlington St at Old Caroleen Rd ($10,000) Depot St at Farmer s Market ($40,000) Cherry Mountain St at Blanton Alley ($12,000) Broadway St and US 74 interchange ($55,000) Chapter 4: Building a System for People who Walk Description Complete sidewalk link from mortuary to corner, mark crosswalk on north leg of intersection across Hardin. Install channelized islands for refuges with pedestrian signals and crosswalks. Evaluate elimination of 3rd northbound through lane. Add pedestrian signals to existing signal and add crosswalks with curb ramps and landing area. Stripe high visibility crosswalks and curb ramps in line with sidewalks along with appropriate signage. Install stamped asphalt crosswalk with landscaping and lighting. (Estimate per Streetscape Plan) Install stamped asphalt crosswalks and curb ramps. Upgrade existing sidewalks with buffers. On bridge consider plastic posts (e.g. modular lane separators) to shy traffic away from 4- foot wide sidewalk.

44 Exhibit 4-8 Intersection & Crossing Recommendations 40

45 tinations like Isothermal Community College without using a vehicle. The length of the system combined with the connectivity to other trails in the area like the existing Thermal Belt Rail Trail will make Forest City a destination solely for the greenways. Visitors will be attracted to the area and the system will be a key recruiting and retention tool to businesses and residents. Some guiding principles for the greenway system include: Think long-term and have a vision for a connected, paved system for transportation and recreation Continually garner community support Use on-road and sidewalk connections until complete system is built Do not use eminent domain Be creative with the routing, don t get stuck on one route if barriers exist Always be building, have an active project each year until finished Maintain the system, build in maintenance to the town budget and cultivate volunteers; and Aggressively seek grants and funding partners. It will take years to fully complete the greenway system, some components of which will be beyond the life of this plan. The Thermal Belt Rail Trail, Bracketts Creek Greenway and Parks Greenway are included in the detailed short and long-term project lists. The greenway along the river is mapped but considered a longer term objective for purposes of this pedestrian plan. Much of it falls outside existing town limits. Top Priority: Thermal Belt Rail Trail. The current Thermal Belt Rail Trail extends from the Oak Springs Road in the community of Gilkey to Oakland Road in Spindale. It is nearly 8 miles long. The trail is between 6-8 feet wide and includes a newly paved 1.8-mile section in Spindale. The remainder of the trail is gravel. Improvements to the trail are planned for early 2015 including new compacted gravel and a 0.5 mile extension of the paved section. Extension of the rail trail into Forest City was the number one request of respondents to the survey included in this plan. This is the game-changer project for Forest City for its greenway vision. The excitement around the current rail trail is large and growing with exponential increase in use on the newly paved section. Continuing the pavement into Forest City would start a new era of community to community connected greenways. Chapter 4: Building a System for People who Walk Extension of the Thermal Belt Rail Trail from its current terminus in Spindale through Forest City was the number one priority of the public through input at meetings and the survey. It is also the top-ranked priority for Forest City through the project ranking methodology. Photo: Jerry Stensland 41

46 Chapter 4: Building a System for People who Walk The width of a greenway is important to consider based on location and anticipated usage. Communities that build only 10-foot wide greenways in high traffic areas soon find they require more space. A 12-foot wide trail is recommended through the heart of Forest City and could taper to a 10-foot wide trail as it leaves the downtown core. Photo: Don Kostelec The benefits of such a long trail (14 miles) are substantial as it essentially connects five communities (Gilkey, Ruth, Rutherfordton, Spindale & Forest City). The trail instantly becomes a haven for recreation and transportation and would be heavily used due to its visibility and easy accessibility from many of Forest City s neighborhoods and downtown. The railroad grade makes it also easy to use as there are no significant hills. Feasibility. The railroad corridor is not currently available to be converted to a trail. It is considered an active rail line though it has not seen any commercial use in at least four years. The line is currently owned by Rutherford Railroad Development Corporation which has an agreement with Thermal Belt Railways to operate it as a railroad. Rutherford Railroad has stated in informal talks they may be interested in converting the line to a trail in the future but are currently pursuing new railroad customers. For the sake of the economic health of the town and the county, the maximum benefit comes with exhausting all possibilities to use the corridor for its original purpose. The intent of including the rail trail option in this plan is to ensure strong community support and preliminary planning for a quick conversion to a trail should the opportunity arise. It gives the railroad corridor owners a viable alternative that will also positively impact the community. The existing Thermal Belt Rail Trail serves as a direct model as to how to convert the corridor to a trail. ADA Upgrades The age of many of the existing sidewalks in Forest City means that intersection treatments and driveways do not comply with modern requirements established under the Americans with Disabilities Act (ADA) and the Public Right-of-Way Accessibility Guidelines. Forest City should consider an annual allocation to upgrading curb ramps along roadways that have sidewalks. If Forest City or NCDOT resurfaces a street or intersection, ADA requires new curb ramps to be installed to meet modern accessibility requirements (Note: Even if there is an existing curb ramp there is good chance they do not meet the modern standards and should be upgraded with the resurfacing project; Oak Street is an example where some ramps do not meet ADA requirements due to a lack of flat landing areas and detectable warnings). The town may obtain the list of planned resurfacing projects by NCDOT Division 13 at this link: HMIPDIV.aspx 42

47 Maintenance Program Sidewalks and greenways are only as functional as a municipalities ability to maintain them. Older sidewalks throughout Forest City show how well sidewalks can stand the test of time as many are still functional and have few areas where they are in complete disrepair. Forest City could allocate a dedicated annual fund for maintenance upgrades to sidewalks with an emphasis on primary walking routes. This can include sidewalk replacement, updating driveway crossings and building sidewalks through the edge of parking lots where old sidewalks were allowed to be replaced with asphalt. Maintenance needs along future greenways will emerge roughly 10 years after construction as the integrity of an asphalt surface erodes much faster than concrete. Root heaves, encroachment of foliage and stormwater runoff all impact the amount of maintenance necessary on a greenway. Walmart & Shopping Mall Area Several pedestrian crashes have occurred in the Walmart parking lot based on the data provided by NCDOT. This indicates there are conflicts in how motorists and pedestrians react to one another in the parking lot. Forest City could seek ways to remedy these concerns by talking with the owners of the shopping center and pointing out the findings from the pedestrian plan. The UDO now requires walkways but it is always a challenge with development to properly orient them to anticipated walk routes and ensure they connect to on-street facilities. At minimum there should be a walking path from nearby sidewalks on side streets to the front door of the Walmart. The next priority would be the construction of a walking path through the parking lot (as shown at left) or striping a walking lane in the parking lot to better channel pedestrians and make them more visible to motorists. Isothermal Community College Multiuse Trail The Community College campus is outside the town limits but future greenways planned for Forest City will link to existing nature trails on the college s property. Forest City can encourage the college and other municipalities to work to provide a system of paved multiuse trails on and around the campus to serve area residents. At minimum, a paved trail from Daniel Road to the reservoir could be constructed to provide access to this amenity. Chapter 4: Building a System for People who Walk Cities can enact policies to require big box development to provider accommodations for pedestrians through parking lots. This example shows a center median route leading to the front door of the store. Such developments should have a route from the nearest street. Photo: Don Kostelec 43
48 Chapter 4: Building a System for People who Walk This page intentionally blank. 44

49 5. Designing for People who Walk Pedestrian facility use is a function of a variety of factors, including the connectivity of the facilities, their safety, their convenience, and their comfort. For this reason, pedestrian facility design should be thoughtful and sensitive to the needs of its users. By following the guidelines provided in this section for sidewalk, crossing, and trail design, as well as other items associated with pedestrian facilities, Forest City should be able to create a built environment that will promote walking and increase the number of pedestrians in the Town. This section is intended to be a general reference for sidewalk and pedestrian facilities as well as a guide for various Best Practices that apply to special pedestrian situations. This section is not exhaustive but rather it refers to various national and state guidelines to respond to specific situations that may arise in Forest City. Currently, the Town has few standards for pedestrian facilities sidewalks, crosswalks, and other pedestrian-related amenities are constructed on an ad-hoc, asneeded basis. This section of the Plan is important because it provides a consistent set of guidelines within Forest City to help ensure that safety and accessibility goals are realized and clear expectations are set for drivers and pedestrians. Design standards are constantly changing and evolving, so it is recommended that the Town confer with NCDOT and various national resources guides (included on the final page of this chapter) whenever embarking on new facilities. Design Guidance There are a variety of sources for design guidance for pedestrian facilities, including the following: NCDOT Roadway Standard Drawings (2012); NCDOT Complete Streets Planning and Design Guidelines (2012) AASHTO Guide for the Planning, Design, and Operation of Pedestrian Facilities (2004); Manual on Uniform Traffic Control Devices (MUTCD); US Access Board Guidelines for Pedestrians Facilities in Public Right-of-Way (2011); and Numerous Federal Highway Administration publications. It is best for Forest City to refer to these design publications when special conditions arise in the design of projects. Every effort should be made to address the requirements, particularly those concerning ADA, to maximum extent possible even if it means additional right-of-way or construction is needed. 45 Chapter 5: Designing for People who Walk There are many subtle elements and design dimensions, such as the slope of ramps and sidewalk width, that are critically important to people of all ages and abilities. Unfortunately, there is no single design manual to reference, which makes it difficult for designers and practitioners to wade through the various standards. Photo: Don Kostelec
50 Chapter 5: Designing for People who Walk Exhibit 5-1: Operating width & clearance requirements for people who walk User Type Surface Width (feet) Clearance Required (feet) Pedestrian using a walker 3 4 Tourist with wheeled luggage 3 4 Wheelchair user 3 4 Jogger 3 5 Parent walking with child in hand Romantic couple walking arm-in-arm Business colleagues walking side-by-side Wheelchair user with assistance dog or pet Two parents side-by-side with strollers Wheelchair user on a date with somebody using a walker Sidewalks The typical sidewalk is least five feet in width, made of concrete, and placed along roadways at least three feet behind the curbline (a 5 buffer is preferable). In general, the width of sidewalks should accommodate two persons walking past one another, a width generally perceived to be five feet, at a minimum. Other circumstances that may require additional sidewalk width are to accommodate: (1) high pedestrian volumes, such as in a central business district; (2) the overhang of parked vehicles from off-street or angled on-street parking areas; and (3) additional buffer from traffic when a planting strip cannot be installed. Exhibit 5-1 shows the operating characteristics of a pedestrian. The downside of a typical 5-foot sidewalk is that it barely allows for enough width for two people to walk side by side or comfortably pass when considering clearance width. Sidewalks should fit the design characteristics of the area in which they are constructed and designers should recognize when more width is required. Additional design considerations for on-street sidewalk facilities are: Eliminating both high and low contact points with tree branches, mast-arm signs, overhanging edges of amenities or furniture, and Providing clear space between walls on one side of the walkway and amenities, parking overhang, or plantings on the curb side of the walkway. In general, standard sidewalks should be concrete, which is more durable than asphalt. A more flexible material, such as rubberized paving, can also be considered in situations in which there is the potential for tree roots to crack and lift the concrete. Using these types of materials can reduce the risk of a tripping hazard, and also lower maintenance costs. More permeable materials, such as porous pavers, can be considered for all pedestrian-ways, and in particular for greenways near streams, in order to reduce run-off from storm events. Cross-Slopes Cross-slopes, or a slope along the travelway surface which is perpendicular to the direction of travel, can often make it very difficult for wheelchair travel. In addition, it can also make for treacherous walking conditions for individuals with problems with their balance and coordination. Cross-sloping most frequently occurs in conditions in which a driveway meets a sidewalk, but can also occur in other situations. In order to minimize the risk of a dangerous and difficult travel condition for some, cross-slope is regulated by ADA such that cross-slopes should not exceed 2 percent, and preferably not exceed 1.5 percent where possible.

51 Curb Ramps Curb ramps are a significant and required feature of accessible pedestrian transportation systems, and must be designed carefully to fulfill their function and the requirements of the Americans with Disabilities Act. Curb ramps should not have a running slope greater than 1:12, meaning that for every foot of travel, the slope should not rise more than one inch. To provide a tactile warning to the visually impaired, raised truncated domes with a color contrast to the background material (typically concrete) should be used. The ADA Accessibility Guidelines for Buildings and Facilities has an easy-touse format for locating specific design criteria related to curb ramps, rise/run restrictions on ramps, and figures illustrating basic concepts. Curb ramps are also required to have a 4-foot by 4-foot flat landing (no greater than 2 percent cross slope in either direction) area at the top of the ramp to allow people who walk to orient themselves. In some cases, the 4x4 landing may be accommodated at the bottom throat of the ramp. This is a design requirement that is noted in NCDOT s design standards for wheelchair ramps, 2012 Roadway Standards Drawings and (Exhibit 5-2). NCDOT s website for Roadway Standard Drawings also includes four different alternative curb ramp designs intended to help communities meet ADA requirements in a variety of constrained situations (Exhibit 5-3). Curb ramps should be placed entirely within the area of a marked crosswalk, so that a pedestrian can enter the ramp space at an angle perpendicular to the direction of travel. Generally, the standard is to have separate curb ramps on each corner; if a shared (sometimes called corner or diagonal) curb ramp is constructed, then the width and radius should accommodate the user so that entry onto the ramp is parallel to the direction of travel. Crossings Pedestrian-friendly crossings are a critical feature in a well-connected pedestrian system because they provide the linkages between one segment of sidewalk to another as a pedestrian may cross a street, connect to another existing piece of sidewalk, or pass to a new development. A well-placed crossing can dramatically reduce pedestrian travel time and improve pedestrian safety, greatly increasing the convenience of walking as a mode of travel. Crossings can be either signalized or unsignalized, and located at intersections or, in special circumstances, at mid-block locations. 47 Chapter 5: Designing for People who Walk Exhibit 5-2: Standard Drawing for Curb Ramp (NCDOT ) The presence of a 4 x4 flat landing and ADA-compliance entry slopes within the footprint of a curb ramp are the most critical element of designing for people of all ages and abilities. This is where the sidewalk meets the street and where pedestrians must orient themselves to the street crossing. Rendering: J.M. Teague Engineering


52 Chapter 5: Designing for People who Walk Exhibit 5-3: Best Practices for Curb Ramps Curb ramps are the most difficult element of ADA-compliant pedestrian facility design to address. Getting the slopes and flat landings properly constructed is critical to the function of a person in a wheelchair or someone on crutches as they prepare to enter or leave the street. Across North Carolina, curb ramps are the most commonly misapplied elements in street design as many do not meet ADA requirements as they lack the flat landing. The landing allows a flat space for a person in a wheelchair to orient themselves to cross the street or turn to go in their desired direction on the sidewalk. Parallel Ramp: NCDOT Type 3 Shared Landing NCDOT Type 4 Parallel Ramp: NCDOT Type 2A Parallel Ramp: NCDOT Type 2 Shared Landing NCDOT Type 5 Directional Ramp: NCDOT Type 1A Directional Ramp: NCDOT Type 1 Renderings: J.M. Teague Engineering 48

53 The most basic crossing is an unsignalized intersection with standard, continental or zebra crosswalk markings. Other potential treatments for unsignalized crossings include raised crosswalks and/or signage. In-street or overhead yield to pedestrian signs are a treatment for unsignalized intersections, encouraging motorists to stop for pedestrians as they cross the street. These signs offer a visual cue and instill some friction in the roadway, as they are typically placed in the middle of a bi-directional, two-lane road. Additional treatments can be added for crosswalk visibility at unsignalized and signalized locations, including decorative brick, textured crosswalks or experimental paint colors. All signalized intersections should be outfitted with countdown pedestrian signals and crosswalks, per NCDOT and MUTCD standards. MUTCD standards dictate that timing must allow for a pedestrian to safely cross the street at a speed of 3.5 feet per second. In some cases, the built environment or user context may require more crossing time or more specialized treatments to alert motorists to the presence of pedestrians. MUTCD notes that 3.0 feet per second can be used to allow sufficient time for slower pedestrians, such as older adults, those in wheelchairs or who are visually disabled. Marked crosswalks (at signalized and unsignalized locations) should not be less than six feet in width, with 10 feet or greater for downtown areas and locations of high pedestrian traffic. Advance stop bars should be placed 4 to 10 feet from the pedestrian crosswalk (with 6 to 15 feet recommended in uncontrolled locations or multilane roads). Pedestrian push buttons should accompany pedestrian signals that are not phased into the regular traffic signal cycle; push buttons must follow ADA placement guidelines. Pedestrian-activated signals should be used for roadways with long traffic signal cycles where pedestrians are to be given preference when present, and/or for signals where the pedestrian cue is not phased into the traffic cycle unless a button is activated. Pedestrian-activated signalization can also be used to provide lead pedestrian intervals in high-conflict areas, in order to give pedestrians a few seconds of full use of the intersection or crosswalk prior to allowing right or left turning movements for motorists. These options reinforce pedestrian safety at high-conflict intersection locations with significant crash history. Push buttons should not be used in central business districts or high traffic locations as the only means of providing a walk signal. Though NCDOT does not have established guidelines for the placement of pedestrian signals, they generally use MUTCD and AASHTO warrants for the installation of traffic signals. It is advisable for Forest City to follow this same guidance or confer with NCDOT Division 13 staff before making changes to signal timing. 49 Chapter 5: Designing for People who Walk Exhibit 5-4: Pushbutton Location Area (MUTCD; Figure 4E-3) Special care must be given to the placement of push buttons so they are accessible to all users. An all-toocommon application is attaching them to traffic signal poles in a location that is not within reaching distance for wheelchair users. Rendering: MUTCD, Figure 4E-3

54 Exhibit 5-5: Typical Crossing Treatment for Multi-Use Trail at a two-lane road Crossings for Multi-Use Trails Where multi-use trails meet the street is one of the most critical, yet overlooked, design elements. These locations are where a diverse yet of users must cross a street or intersection and they travel at varying speeds. The illustrations (Exhibits 5-5 and 5 6) produced for this Plan are intended to show common treatments for multi-use trail crossings based on common conditions in Forest City. Two-lane neighborhood and collector streets where the future rail-trail will cross at a mid-block location requires design treatments that are very different than a common crosswalk/sidewalk/ramp combination. Crossings and curb ramps must be as wide as the trail. Exhibit 5-5 shows best practice treatments for these conditions. Four-lane highways such as US 74 Business and Oak Street require extra special care for trail crossings. Exhibit 5-6 illustrates some treatments for these locations. It is important for Forest City to work with designers and DOT on these crossings, as multi-use trail design standards are not included in current NCDOT standard drawings. 50 The Thermal Belt Rail-Trail will cross several two-lane streets across Forest City and in other nearby communities. Trail crossings require special care due to the diverse nature of users, both in terms of mode and age. The rendering at left shows some best practice treatments for Forest City and its partners to consider in designing the trail where it intersects streets. Common features include: Ramps and crosswalks that are the same width as the trail (10-feet preferred). Detectable warning surfaces like you see on sidewalk ramps, with detectable warnings placed in medians, if present. Advance warning trail crossing signage, as contained in MUTCD. On-street bicycle route wayfinding. Stop signs on the trail (unless the community decides to require motorists to stop and gives rightof-way to trail users. Rendering: JM Teague Engineering

55 Exhibit 5-6: Typical Crossing Treatment for Multi-Use Trail at a four-lane highway Future multi-use trails identified in this plan will likely have to cross existing four-lane highways in an around Forest City. This image illustrates common best practices for getting trail users across large and sometimes confusing intersections. This illustration also showcases some best practices that could be applied elsewhere in Forest City to improve conditions for pedestrians crossing at intersections with sidewalks. Rendering: JM Teague Engineering 51

56 Chapter 5: Designing for People who Walk It is common practice to sign and designate a detour route for motorists when there is a lane closure. The same is required, per MUTCD, for pedestrians. Sidewalk closures should be carefully evaluated and contractors should be required to design and sign proper detour routes. Sidewalk closure in the downtown area should be limited in terms of duration and extent. Photo: Don Kostelec Signage In addition to sidewalks and crossings, pedestrian facilities also include signage along major pedestrian routes. Regulatory and warning signs serve primarily to reinforce traffic laws and rules of the road, and notify motorists and others of the presence of pedestrians. Often, the intended effect is to instruct motorists to drive more cautiously and reduce their speeds, thereby improving the safety for pedestrians in the given area. Regulatory and warning signs can be used in a variety of places, including at crosswalks, at intersections, in-street, and near schools. National standards for sign placement and use can be found in the MUTCD. The MUTCD provides guidance for warning signs which can be used at both crosswalks, or along the roadway. Temporary accommodation during construction For residents to be comfortable using walking as a primary mode of transportation in their town and neighborhood, they need to be confident that the facilities they count on will be available consistently. Therefore it is of high importance to adhere to guidelines laid out in Chapter 6D of the Manual on Uniform Traffic Control Devices regarding Temporary Traffic Control to ensure pedestrian access when construction or special events obstruct the usual pedestrian route. The Town of Forest City is responsible for ensuring that both municipal construction crews and contractors comply with these guidelines whenever a pedestrian path is impacted by construction activity. Incorporating pedestrian design features into regulatory documents Many design features that are integral to the user experience occur only some of the time or on private property. For this reason, it is essential that pedestrian friendly requirements be incorporated into a wide variety of documents, ranging from the UDO to contracts with contractors who work on city streets, sidewalks, and public facilities. Parking Lots Pedestrian circulation through parking lots is an essential element of walkability and can make the difference between a resident walking to a store or getting into a car for a short trip. Zoning should include requirements for pedestrian-friendly circulation to and from the front doors of places of business, and development review should include an assessment of pedestrian access and safety through vehicular areas in private developments, including attention to the standards described in this chapter for curb ramps, crosswalks, and driveways. 52
57 Ensuring good design in new construction and redevelopment The town s zoning ordinance should be as specific as possible regarding pedestrian facility requirements for new construction and redevelopment. Developers should be told up front about expectations for pedestrian facilities that not only meet minimum requirements but enhance the pedestrian experience. Requirements may vary by zoning district, size of development, and the functional classification and design features of the road the development abuts. Traffic Calming Considerations Traffic calming is the term used to describe a toolbox of improvements that can be used to calm, or slow, traffic along a street, usually in a neighborhood or similar area with low traffic speeds and relatively lower traffic volumes. Traffic calming efforts can help to create a safer, more comfortable pedestrian environment by reducing vehicle speeding. Traffic calming comes in a variety of forms. Some of the most common techniques are described in the following paragraphs. Curb Extensions (Bulb-Outs) and Curb Radii. The primary purpose of bulb-outs is to shorten the distance that pedestrians must travel to cross a street. In addition, they may encourage motorists to drive slower by narrowing the travel lane and reducing vehicular speeds during turning movements at intersections. Motorists will travel more slowly around corners with smaller curb radii even without the use of curb extensions. Landscaping and other aesthetic treatments such as special paving textures should be carefully designed to avoid hazards to drivers and visually-impaired citizens while minimizing maintenance costs. The type of vehicles (especially trucks) using the route should be considered in the design of curb extensions. Medians and Refuge Islands. One approach where wide, high volume and/or high speed roadways create an obstacle to pedestrian mobility is to provide refuge islands to shorten the length of the crossing and give pedestrians who are not able to cross the entire street in one signal cycle the opportunity to split their crossing. These islands, along with medians, also enclose the visual space for motorists and therefore encourage compliance with speed limits and other traffic laws. Sensitivity to large vehicles (buses, trucks and fire equipment) dictates some elements of the median design, curb style, and placement. Median-controlled roadways reduce the number of turning conflicts and are generally considered safer for all road users than a two-way, left-turn lane (TWLTL) roadway. Chapter 5: Designing for People who Walk 53

58 Chapter 5: Designing for People who Walk Creative, yet simple, solutions to providing space for people who walk helps address a present-day need in combination with present-day budget realities. A paving machine used to lay 5-foot asphalt strips was used in this situation to fill a gap in the sidewalk system alongside a street that did not curb and gutter. Photo: Don Kostelec 54 Alternative Pedestrian Facilities Given ever-present budget limitations, Forest City and NCDOT may find opportunities to explore other options for accommodating people who walk in a manner that addresses required technical elements of design but is cost-effective from a budgetary perspective. The common design manuals provide for the perfect solution and the traditional curb, gutter and sidewalk approach to building pedestrian facilities has been around since the 1800s. But this is not always possible given an area s context. Exhibit 5-5 highlights various approaches by North Carolina communities and others to provide for effective but low-cost transportation facilities. A community should not pursue these improvements lightly as they still need to comply with ADA requirements for slopes, access at intersections and other treatments. But they have been proven to be effective in providing a space for pedestrians along various types of roadways, including state and US highways in North Carolina. These improvements can sometimes be constructed at 1/10th the cost of traditional curb, gutter and sidewalk, which is why it is important to consider these options before embarking on more costly improvements. People are already walking along many of Forest City s streets and that requires them to walk in the roadway at times. These alternative facilities simply allow for that use to continue while giving those who walk some space that is clearly delineated from the vehicular realm. Options such as curbless sidewalks (image E) may be pursued on roadways such as West Main Street to avoid costly stormwater facilities that would be required with a typical curb, gutter and sidewalk treatment. Painted pedestrian lanes or simple markings (images A and D) are more suited for low speed, low volume residential streets where motorists and pedestrians are already sharing the road space. Alternatives such as image C could be an interim measure before full-scale pedestrian improvements or a linkage between greenways alongside a street. Images B and F are also effective in linking greenway segments along a street. A unique feature of image F is that it provides typical curb features alongside the road but can be designed to accommodate stormwater movement across the pavement as if it were a shoulder. The image shown in F was constructed in Idaho using federal Safe Routes to School funds and image E was constructed with federal Transportation Enhancements funds (now Transportation Alternatives Program). This shows there are opportunities to utilize federal funds for these types of improvements. They can also be designed to meet ADA requirements.


59 Chapter 5: Designing for People who Walk Exhibit 5-7: Alternative pedestrian facilities Low-Cost and Interim Active Transportation Facilities for Neighborhood & Constrained Streets These images illustrate a variety of improvements that can be made along roadways, under certain conditions, to promote pedestrian and bicycle travel in a low-cost manner. Considerations such as traffic interaction, compliance with ADA, snow removal, and maintenance practices will impact whether such investments can be applied. A: On-street pedestrian lane in Boone, NC. B: Shoulder turned multi-use trail in Talkeetna, Alaska. C: Gravel sidewalk along the NC Highway 9 near Black Mountain, NC. D: Pedestrian shared street markings in Olympia, WA. F: Shoulder/extruded curb pathway in Ada County, ID E: Curbless sidewalks along (constructed with federal Safe Routes to School funds) Photos: Don Kostelec US 64 in Lake Lure, NC. 55


60 Chapter 5: Designing for People who Walk Exhibit 5-8: Design Resources Design Resources for Pedestrian Facilities The various publications and design guidelines for pedestrian facilities are continually being reviewed and revised. Below are some of the common resources that can be referenced by Forest City. Links are provided for each resources with a footnote if they are free for download. NCDOT Roadway Standard Drawings These design standards are kept current on NCDOT s website and are updated as other design manuals or design standards such as ADA are modified. Pedestrian facilities are included in Division 08 - Incidentals. DOT also provides several Alternative Curb Ramp Designs on this page. NCDOT Complete Streets Policy & Design Guidelines This reference document outlines several aspects of the state s policies and design guidelines. There are sections that address specific elements of complete streets and general guidelines that serve as a starting point for design of major facilities. Guidelines for Pedestrian Facilities in the Public Right-of-Way (PROWAG) The guidelines are the specific implementation of the Americans with Disabilities Act for pedestrian facilities in the public right-of-way. The guidelines define the public right-of-way to mean "public land or property, usually in interconnected corridors, that is acquired for or dedicated to transportation purposes. It provides many elements not addressed in other design guides. AASHTO Guide for the Planning, Design, and Operation of Pedestrian Facilities (2004) This design manual published by AASHTO is becoming dated, but it includes many of the foundational elements of pedestrian facility design. NCDOT s design publications do not address all aspects of pedestrian facility design, so this manual is useful for referencing other features. Manual on Uniform Traffic Control Devices (MUTCD, 2009) MUTCD provides specifications for the design and placement of various traffic control devices. For people who walk, this manual impacts design and placement of signage, timing of pedestrian signals, the design of crosswalks and many other features
61 6. Pedestrian Safety & Enforcement Utilizing NCDOT s Pedestrian Crash Tool, the consultant team was able to assemble a summary of characteristics of pedestrian crashes in Forest City from 1997 through This data was gathered by the NCDOT Division of Bicycle and Pedestrian Transportation and the UNC Highway Safety Research Center and enables researchers to examine pedestrian crash trends based on a number of different variables. Examining the characteristics of crashes in Forest City helps to establish a general background of where crashes are occurring, at what time of day, what time of year, and if segments of the population are being disproportionately affected. These findings are used to help identify project, program and policy priorities for Forest City. Chapter 6: Pedestrian Safety & Enforcement Between 1997 and 2012, 79 pedestrians were involved in crashes: 5 pedestrians were killed; 8 suffered disabling injuries; 27 had evident injuries; 30 had possible injuries; and 9 were either not injured or their status was not known. During this time period, Forest City had one of the highest rates of pedestrian crashes per 1,000 residents when compared to other communities in western North Carolina (Exhibit 6-1). This does not necessarily mean that Forest City is an unsafe place to walk. It could mean that more people walk as a form of transportation or it could mean that more focused enforcement efforts are needed. In order to begin to implement countermeasures to make Forest City a safer, more pedestrian-friendly place, the who, what, where, and when of pedestrian crashes needs to be understood. Promoting pedestrian safety is an art that requires proper understanding of how pedestrians move and what motorists can and should do to avoid a crash. Photo: Don Kostelec Who was involved in Pedestrian Crashes? Pedestrian crashes involve every part of the Forest City population, but some demographic groups are more affected than others. Pedestrians involved in crashes were overwhelmingly male. Across North Carolina, the trend is similar. In Forest City, 63% of pedestrians involved in a crash were male, while statewide, 60% of pedestrian involved in a crash were male. Males accounted for all pedestrian fatalities in Forest City during the studied time period. Pedestrian age is a factor that plays a role in the severity of the crash. More vulnerable age-groups, either the younger or older parts of the populations, are more likely to 57
62 Exhibit 6-1: Pedestrian Crash Rates in WNC Towns Town Population (2010) Crashes ( ) Crashes per 1,000 pop. Robbinsville Hayesville Sylva 2, Forest City 7, West Jefferson 1, Bryson City 1, Blowing Rock 1, Columbus Murphy 1, Rutherfordton 4, Franklin 3, Sparta 1, Rosman Spruce Pine 2, Andrews 1, Brevard 7, Highlands Tryon 1, Weaverville 3, Marion 7, Spindale 4, Hot Springs Maggie Valley 1, Mars Hill 1, Waynesville 9, Cherokee 2, Canton 4, Jefferson 1, Burnsville 1, Clyde 1, Fletcher 7, Banner Elk 1, Cullowhee 6, Woodfin 6, be seriously injured or killed if hit by a car. In Forest City, 1 pedestrian fatality was a 3 -years old, another was 64 years old. In examining the race of pedestrian crash victims, 33.3% of the pedestrian crash victims were African-American, which is a percentage notably higher than the 24% of Forest City s population that is African-American. Where are Pedestrian Crashes occurring? The vast majority of the pedestrian crashes occurred on either local roads or public vehicular areas such as parking lots (Exhibit 6-2). Of the 79 crashes, 43 were on local streets, 32 were in public vehicular areas, 2 were on secondary state roads, and 2 were on US routes. Another set of data illustrated what part of the roadway crashes occurred. Of the four categories, 32 occurred in non-roadway locations (e.g. parking lots, driveways), 25 were non-intersection related, 10 were intersection-related, and 12 took place in intersections. While pedestrian crashes were the most frequent in non-roadway locations, they were also the least likely to be severe. No fatalities occurred in non-roadway locations, 2 fatalities occurred at non-intersection locations, 2 fatalities occurred at intersection-related locations, and 1 fatality occurred at an intersection. Vehicular Speed The speed of the vehicle at the time of the pedestrian crash plays a large part in the severity of the pedestrian s injuries. Studies have shown that the chance of a pedestrian being killed by an automobile can increase from 6% at 20 mph to 94% at 40 mph. Pedestrian crashes in Forest City most frequently occurred with the automobile traveling mph. All five pedestrian fatalities occurred with a vehicle s estimated speed of at least 30 mph. When are Pedestrian Crashes occurring? The months when pedestrian crashes are most frequent in Forest City are October and December. Conversely, June and September had the fewest pedestrian crashes. February and March are the deadliest months for pedestrians in Forest City; 3 of the 5 fatalities occurred in these 2 months, while only 9 of the 79 total crashes occurred during these months. Pedestrian crashes generally took place during daylight hours. Of the 79 crashes, 25 occurred during non-daylight hours (dusk or night.) However, 4 of the 5 pedestrian fatalities occurred at times when it was dark. Of these 4 fatalities, 2 occurred on lighted roadways, the other 2 occurred on non-lighted roadways.
")

63 Exhibit 6-2: Pedestrian Crashes in and around Forest City ( ) Chapter 6: Pedestrian Safety & Enforcement Heat Map of Pedestrian Crashes 59

64 Chapter 6: Pedestrian Safety & Enforcement Exhibit 6-3: The impact of vehicle speed The speed of the motor vehicle at the time of impact with a pedestrian is major influence on the likelihood of death. 60 Law Enforcement for Pedestrian Safety There are a number of documented approaches to law enforcement that enhance the safety of pedestrians. Most of these involve simply targeting existing enforcement of traffic laws to locations where there is high pedestrian traffic or a documented history of pedestrian-vehicle conflicts. Speed enforcement is particularly important in areas of high pedestrian traffic, as small differences in vehicle speed make dramatic differences in survivability for the pedestrian. Officers patrolling areas of high pedestrian activity can also step up enforcement for distracted driving violations, unsafe lane changes, failure to signal, aggressive driving, DUI, and other unsafe motorist behaviors that create a particularly grave danger for vulnerable road users. These actions can discourage individuals from choosing walking as their mode of transportation for short trips because a car gives them more protection from dangerous drivers. Officers patrolling near unprotected crosswalks, intersections with unmarked crosswalks, or signalized intersections where there is heavy turning traffic should pay particular attention to the crosswalks and ticket or warn motorists who fail to yield the right-of-way. In addition, crosswalk enforcement actions, often referred to as stings, provide a targeted way to increase public awareness of the requirement to yield to pedestrians in crosswalks. They are discussed in the next section. Crosswalk Enforcement Actions Police departments in jurisdictions participating in the Watch for Me NC campaign (see Chapter 7) have received specialized training in conducting crosswalk enforcement actions. In these targeted operations, officers set up around a marked, unsignalized crosswalk and have an officer, usually wearing highly visible clothing but not a police uniform, cross the street. The decoy officer is trained to begin crossing when an approaching vehicle is far enough away to easily stop but close enough to see him/her. Other officers intercept drivers who fail to yield and issue citations or warnings, along with educational material. When these actions are held, they are typically accompanied by press releases to maximize educational impact. Campaigns usually begin less aggressively, issuing warnings to all but the most egregious violators or those who are committing multiple traffic violations, and move toward issuing tickets instead of warnings after the campaign has received news coverage. In some jurisdictions nationally, creative decoys are used to further attract public attention. For example, Las Vegas has had the plainclothes officers serving as de-

65 coys dress up as Santa Claus in December and in the small town of Mechanicsburg, PA, the mayor has gone through training with the police department and frequently serves as the decoy instead of a police officer. Support for planning crosswalk enforcement actions, including accompanying educational handouts, is available through the Watch for Me NC program. What about enforcement for pedestrians? While motorists ticketed for failure to yield to pedestrians often demand equal treatment, it is important to remember that motorists and pedestrians are not equal in their vulnerability, their potential to cause harm to others, or their requirements for being on the road. Whereas all legal motorists are licensed, theoretically responsible adults operating machines that have the potential to kill or maim, pedestrians include the very young and very old and people incapacitated by illness or disability who may not be able to fully understand the rules of the road. Pedestrians are not required to have a license to simply walk. Educational efforts to reduce problematic pedestrian behaviors have value, but enforcement focus is most effectively used on ensuring that licensed road users are prepared to respond to obstacles and control their vehicles even in adverse circumstances. Additionally, enforcement of jaywalking laws has historically occurred disproportionately in minority and low-income communities, serving to strain police-community relations and lead to a disproportionate financial burden on residents who are forced to walk in less than desirable traffic conditions because they can t afford safer options. Practically speaking, because most people have a survival instinct, the majority of jaywalking or technically illegal street crossings by pedestrians take place in circumstances where a crash is not likely to occur. Therefore, issuing tickets to pedestrians who disobey signals or cross between adjacent signalized intersections typically does not have any significant impact on pedestrian crash rates. As documented by the District of Columbia Department of Transportation and Metropolitan Police Department in their Street Smart Pedestrian and Bicycle Safety Enforcement Training Manual (2007), the city of Seattle conducted an aggressive jaywalking enforcement campaign in the late 1900s, but found that it had no impact on the city s rate of pedestrian crashes. After changing the focus of their pedestrian 61 Chapter 6: Pedestrian Safety & Enforcement Exhibit 6-4: Injured body regions of a pedestrian when hit by a motorist This diagram, modified from a World Health Organization image, illustrates the injured body regions of a pedestrian being hit by a car and where contact will occur based on the size and speed of the vehicle.

66 Chapter 6: Pedestrian Safety & Enforcement safety programs and undertaking other efforts to make the city more walkable, Seattle is now a Platinum-level Walk Friendly Community and was recently ranked as the #1 safest city for pedestrians by Liberty Mutual Insurance. Crosswalk actions and general enforcement of speeding, distracted driving, and other motor vehicle safety laws have proven far more effective in reducing crash rates. Officers who witness particularly dangerous pedestrian law violations can issue tickets, but a concentrated effort of forcing pedestrians to wait for signals or go out of their way to use crosswalks is of limited safety value, particularly if drivers are not fully compliant with laws at crosswalks. Education for Law Enforcement Officers As pedestrian and bicyclist volumes increase across the country, many jurisdictions are realizing that training of law enforcement officers related to nonmotorized road users needs to be updated and augmented. Officers must not only enforce the laws, but also set a positive example for other drivers by complying with crosswalk laws and operating their cruisers safely. Officer training should include a refresher course on state laws relating to pedestrians, including the definition of an unmarked crosswalk and driver responsibilities at all crosswalks and under what circumstances it is legal for a pedestrian to cross at mid-block. Technically, people jaywalk across Main Street all the time to reach parking spots in the middle of the street. Should we perceive this as unsafe, discourage it or find ways to make it as safe as possible? Photo: Don Kostelec In areas with new pedestrian enforcement programs, it is not uncommon for police to issue tickets to pedestrians for crossing at mid-block even though the pedestrian was not between two adjacent signalized intersections, for example. Officers, along with other municipal employees, can also benefit from education about the physical and mental health benefits of walking. 62

67 7. Education & Encouragement Pedestrian education efforts have two primary areas of focus: safety and rules of the road, and education about where, how, and why to walk, which is also encouragement. Safety education typically involves cooperation between planning and transportation staff, law enforcement, health departments, and schools, as well as non-profit community organizations. Chapter 7: Education & Encouragement The Watch for Me NC program is a valuable source of outreach materials and potential funding for such campaigns, and nationally, the National Highway Traffic Safety Administration (NHTSA) funds many similar programs. All materials created with NHTSA funding are available in the public domain for use and adaptation by other agencies, although Watch for Me NC materials will contain specific information on North Carolina laws. Outreach can range from simply passing out printed materials created by other NHTSA campaigns, to a targeted media blitz combined with in-person outreach at community events or high traffic intersections and coordinated with enforcement actions. It is often said that the most effective education for drivers is enforcement, enforcement, and education about the enforcement. Children and schools play a key role in creating a safe, pedestrian -friendly culture. Safe Routes to School and related programs can not only make children more aware while walking to and from school, but also help them to become better future drivers and to positively influence their parents driving by reminding them to slow down, avoid distractions, and watch for pedestrians and bicyclists. Context Sensitivity In safety education campaigns, it is important to recognize that the majority of existing outreach materials were created in and for major metropolitan areas where pedestrian crashes make up the highest percentage of traffic fatalities and pedestrian traffic is relatively high. Some of their messages, like always use crosswalks may not be applicable or practical in less dense areas where roads do not have frequent intersections. Focus of a safety campaign should be on locally observed problems and responsive to local conditions, so messages such as walking facing traffic or watch- Exhibit 7-1: Pedestrian Law in North Carolina Pedestrian Laws in North Carolina When sidewalk is available, pedestrian must walk on the sidewalk. Motorists shall yield right-of-way to pedestrians within any marked or unmarked crosswalk in residential and business areas except where there is a traffic or pedestrian signal regulating traffic movements. (NC General Statutes, Chapter 20, Section 173a) Pedestrians also have right of way when approaching an alley, building entrance, private road, or driveway from any sidewalk or walkway. (NC General Statutes, Chapter 20, Section 173c) At intersections, motorists must yield the right-of-way to pedestrians when making a right-on-red movement. Where sidewalks are not provided, any pedestrian walking along and upon a highway shall, when practicable, walk only on the extreme left of the roadway or its shoulder facing traffic which may approach from the opposite direction. Such pedestrian shall yield the right-of-way to approaching traffic. (NC General Statutes, Chapter 20, Section 174d) 63

68 Chapter 7: Education & Encouragement Watch for Me NC materials are available in English and Spanish to help communities reach a broader audience and be sensitive to local populations. ing for pedestrians on the shoulder while driving on roads without sidewalks are more relevant in areas with fewer sidewalks and more rural roads. Reaching a Broad Audience Messages in an education campaign should be clear and have a broad appeal, but also target those groups most likely to be at risk or to pose a risk to others. Since men and boys constitute a substantial majority of pedestrians hit by cars and also a majority of drivers who kill pedestrians safety-related advertising may be targeted towards sporting events or other programming with an audience that skews male., Women and girls are more likely to be restricted from active transportation due to safety concerns from spouses and parents. Media outlets and events that reach minority and low-income communities should be particularly targeted for pedestrian-focused messages, whereas messages aimed at making drivers more aware and respectful of pedestrians may be most relevant in suburban or higher-income areas. Materials should be provided in any foreign languages spoken within the community, particularly Spanish, and cultural differences should be considered. For example, recent immigrants from Latin America may work long hours, traveling to and from work on farms or constructions sites when it is dark outside, and may walk or bike longer distances than the typical US-born resident will tolerate. Watch for Me NC campaign materials are tailored to suit various community contexts and are oriented for both pedestrian and motorist-focused outreach. They may also walk with traffic, bicycle against traffic, be accustomed to drivers being more aware of their presence because they came from a place with higher walking levels, and be completely unaware of US jaywalking laws, as in many countries around the world, pedestrians are permitted to cross the street wherever they need to. Watch for Me NC Watch for Me NC is a program, run by NCDOT in partnership with local communities, aimed at reducing the number of pedestrians and bicyclists hit and injured in crashes with vehicles. According to NCDOT, Watch for Me NC involves two key elements: Safety and educational messages directed toward drivers, pedestrians and bicyclists, and Enforcement efforts by area police to crack down on some of the violations of traffic safety laws. 64
 in 2012.")

69 Local programs are typically led by municipal, county, or regional government staff with the involvement of many others, including pedestrian and bicycle advocates, city planners, law enforcement agencies, engineers, public health professionals, elected officials, and others. NCDOT piloted the program in Wake, Durham, and Orange counties (Triangle Area) in In 2014, communities were asked to apply for Watch for Me NC funding to become partner communities. Any community is allowed to use the materials developed for the program, which are available at Chapter 7: Education & Encouragement Let s Go NC! The Let s Go NC program is an educational curriculum intended for school-age children to teach them how to walk and bike safely. The program is intended to give children essential skills they need to enjoy a healthy and active lifestyle. Let's Go NC! A Pedestrian and Bicycle Safety Skills Program for Healthy, Active Children provides teachers, parents and PTAs an all-in-one package of lesson plans, materials, activities and instructional videos that encourages children to learn about and practice fundamental skills that build safe habits. This program, developed for NCDOT s Division of Bicycle and Pedestrian Transportation Division and Safe Routes to School Program by NC State University, is a free program with materials and videos available online. The program materials can be accessed here: Encouragement Pedestrian outreach always needs to balance safety messages with reminders that walking is a healthy, beneficial activity. People should not be scared away from it because the built environment isn t ideal and crashes with vehicles do happen. Providing wayfinding to comfortable walking routes including greenways, main street shopping districts, and low-traffic neighborhood streets with optimal sidewalks is an important part of building pedestrian traffic in a community so that broad support can be built for improving the less walkable areas. The Let s Go NC! curriculum teaches children safe walking and bicycling tips. Encouragement should be available multiple ways through public signage, brochures, and web sites, and promoted through community newsletters and other similar forums. Information on physical and mental health benefits of walking and the economic impact of walkability and foot traffic on local businesses are particularly useful. Environmental messages about reducing short car trips are a powerful motivating factor for some, but seen as a threat by others. Some individuals may need reassurance about the safety of walking, particularly senior citizens, parents of 65
70 Chapter 7: Education & Encouragement young children, residents of higher crime neighborhoods, people with disabilities, and women who may have experienced street harassment or even assault. Attention should be paid to making sure messages are inclusive and do not reach only the groups of people who are most likely to walk anyway ( preaching to the choir ). While a health fair is a good place to start spreading a pro-walking message, efforts are also needed to reach people who may not be as aware or concerned about fitness. Messages and activities should be positive, fun, and accessible focusing on the benefits of even a small amount of walking and the possibility of incremental change. Outreach to the business community and civic organizations can also build synergy toward raising the profile of walking in the community as multiple influencers relay related messages about the many benefits of walking to the community and take small steps to improve the pedestrian environment. Giveaways Education and encouragement programs frequently feature prizes such as t-shirts, bags, reflective items like zipper pulls or even small blinking lights. Low cost pedometers can also be particularly useful for encouragement programs. Healthcare organizations are often sponsors of these items, and local businesses that benefit from foot traffic may also be interested in promotional opportunities. Local artists or students can be involved in developing creative materials to add interest to the campaign. Other Resources Pedestrian & Bicycle Information Center Education education.cfm WalkBikeNC Program Resources #program Reflective items can be particularly useful since people frequently need to walk home after dark from a destination where they can t wear reflective clothing, such as a job with a dark uniform, and for many people who need to walk in dark locations the most due to economic circumstances, buying reflective clothing could be a hardship. Small lights or reflective tchotchkes can be kept in a purse or work bag and provide both a means of visibility and a reminder of the campaign s message. Similarly, a keychain or bumper sticker with a message of I yield for pedestrians may help drivers to remember to be cautious. Each piece of education, enforcement, and encouragement campaigns should work together to make walking easier and safer and to support the engineering improvements being made as part of the pedestrian master plan. North Carolina Bike/Pedestrian Laws Guidebook laws/ 66

71 8. Walking: The Wonder Drug The World Health Organization defines health as a state of complete physical, mental and social well-being and not merely the absences of disease or infirmity. Using this holistic definition of health implies that to improve the health of a population, the social determinants of health (the conditions in which people are born, grow, live, work and age, shaped by the distribution of money, power and resources at global, national and local levels) must be considered and addressed to promote health and wellness for all. These same factors should be consid- Exhibit 8-1: This is your brain on walking ered with regard to walkability. Wellness is much more than physical health, exercise or nutrition. It is the full integration of states of physical, mental, and spiritual well-being. Walkability and associated programs to promote walking play a significant role in creating a quality of life that promotes the health of Forest City s residents. Forest City workshop participants noted that the area should consider investments in programs and facilities that attempt to maximize the positive benefits of the initiative as they related to these dimensions of health. The also identified physical activity rates, cardiovascular disease and diabetes as local concerns that can be addressed through creating a more walkable community. The model for health used in includes physical, environmental, emotional, intellectual, social, spiritual, and occupational wellness. These dimensions act and interact in a way that contributes to our own quality of life. Physical Health & Wellness Physical wellness involves aspects of life that are necessary to keep yourself in top condition and capable of doing daily activities without undue fatigue or physical stress. Optimal physical wellness is developed through the combination of beneficial physical activity/ exercise and healthy eating habits. Elemental components of physical wellness include building muscular strength and endurance, cardiovascular strength and endurance and flexibility. Creating a walkable neighborhood with destinations within walking distance promote physical wellness. Additionally: Walking is a low-impact and easy way to improve physical health that can be enjoyed by people of all ages. Walking gives your heart, blood vessels and lungs a good workout, as well as increased cardiovascular fitness; increased strength and flexibility; improved joint 67 Chapter 8: Walking: The Wonder Drug Walking may be seen as having a direct physical outcomes, but it also impacts emotional health. This image illustrates the brain after sitting versus the brain after 20 minutes of walking.

72 Chapter 8: Walking: The Wonder Drug mobility; improved posture and coordination; and decreased body fat. It is one of the best ways to reduce the risk of health problems such as stroke, heart disease, some cancers, diabetes and arthritis. 30 minutes of moderate walking per day five days a week can help ensure a longer, healthier and happier life. One hour of walking may increase your life expectancy by two hours. Emotional Health & Wellness Emotional Wellness is the ability to understand ourselves and cope with the challenges life can bring. The ability to acknowledge and share feelings of anger, fear, sadness or stress; hope, love, joy and happiness in a productive manner contributes to our Emotional Wellness. It also involves being attentive to your thoughts, feelings, and behaviors, whether positive or negative. Walking can improve our mood and help flush toxins out of our body that can negatively effect our mental health. Exhibit 4-1 illustrates how walking affects brain function. The brain after just 20 minutes of walking is invigorated and ready to respond to challenges. The hiking trails at Isothermal Community College embody many of the seven dimensions of health. Adults and children can enjoy physical activity while in nature, which promotes emotional and spiritual health. The campus setting promote intellectual health. Photo: Don Kostelec Social Health & Wellness Social Wellness is the ability to relate to, interact with, and connect with other people in our world. It involves using good communication skills, having meaningful relationships, respecting yourself and others, and creating a support system that includes family members and friends. Our ability to establish and maintain positive relationships with family, friends, and co-workers contributes to our Social Wellness. Walking can and should be a social endeavor. When given a quiet and safe place to walk, families and friend can enjoy time together and explore a neighborhood, share a meal or run errands together. Environmental Health & Wellness Environmental Wellness is the realization of our innate connection to nature and our ability to recognize our own responsibility for the quality of the air, the water, and the land that surrounds us. The ability to make a positive impact on the quality of the environment--be it our homes, our communities or our planet-- contributes to our Environmental Wellness. Protecting yourself from environmental hazards and minimizing the negative impact of your behavior on the environment are also central elements. If we ask that pedestrians walk in an area that is filled with noise pollution or high traffic volumes, special accommodations should be made to mitigate the negative influences of that environment. Intellectual Health & Wellness Intellectual Wellness is the ability to open our minds to new ideas and experiences 68

73 Exhibit 8-2: The Health Benefits of Walking (Source: Everybody Walk! ) Chapter 8: Walking: The Wonder Drug 69

74 Chapter 8: Walking: The Wonder Drug Public transportation in combination with bus stops that are accessible via a safe walking network promote occupational health and wellness by allowing individuals to access a job or education without the burden of the cost of owning and operating a motor vehicle. Photo: Don Kostelec 70 that can be applied to personal decisions, group interaction and community betterment. The desire to learn new concepts, improve skills and seek challenges in pursuit of lifelong learning contributes to our Intellectual Wellness. Historic walking tours or designated routes can help community member and visitors gain greater appreciation, in an active way, of Forest City. Safe walking areas can be enjoyed by school classes, Sunday school classes and other types of instruction-based endeavors. Spiritual Health & Wellness Spiritual Wellness is the ability to establish peace and harmony in our lives. It is a personal matter involving values and beliefs that provide a purpose in our lives. While different individuals may have different views of what spiritualism is, it is generally considered to be the search for meaning and purpose in human existence, leading one to strive for a state of harmony with oneself and others while working to balance inner needs with the rest of the world. Having a quiet place to walk and reflect on life can be a spiritual experience. Churches are starting to provide walking tracks on their property or provide a space for community gardens, which can link the spiritual realm to the physical realm. Occupational Health & Wellness Occupational Wellness is the ability to get personal fulfillment from our jobs or our chosen career fields while still maintaining balance between work and leisure time in our lives. It focuses on our search for a calling and involves exploring various career options and finding where we fit. It also involves addressing workplace stress and building relationships with co-workers. Because what we do for a living encompasses so much of our time, it is important for our overall well-being to do what we love and love what we do. Being able to walk while on a lunch break or making it convenient to walk to a bus stop can improve overall occupational health by providing a place to recreate or reducing the cost burden by allowing a person to access a cheaper mode of transportation. Health Impacts of Pedestrian Facility Investments Exhibit 8-3 outlines the likely impacts of people s behavior for each mile of sidewalk or greenway constructed. Exhibit 8-4 indicates several types of pedestrian facility investments and the likely health impacts, both positive and negative, of those investments. It is hard to find negative impacts of investing in pedestrian facilities as many have the potential, based on research by academics, health professionals and transportation researchers, to greatly impact a community s health and an individual s health in many ways. Some of these positive impacts include: Providing a place for people of all ages and abilities to safely walk for transporta-
75 Chapter 8: Walking: The Wonder Drug tion, recreation and socializing; Connecting destinations by facilities that encourage walking rather than driving, which saves money and increases physical activity; Eliminating the need for pedestrians to walk in the roadway; Places pedestrians in more predictable locations along roadways; and Provides a space that is more resilient to the impacts flooding and other episodic hazards. Exhibit 8-3: Behavior change resulting from a mile of new sidewalks/greenways The negative health impacts that can arise with pedestrian facility investment are primarily related to episodic incidents, construction impacts and a mix of users (e.g. bicyclists). Incorrect placement of pedestrian facilities or poorly constructed facilities can be a detriment to the health and safety of pedestrians. Health-based Investments The multi-criteria evaluation for pedestrian projects in Forest City included several categories that relate to improve health conditions as a result of the project. These factors were safety, proximity to parks, schools and employment, access to food and populations in need. In a review of the recommended projects for Forest City as well as prevailing research related to health impacts and project evaluation criteria, the following projects appear to have the most potential to positively impact the health of the community: Thermal Belt Rail Trail, due to its connecting to many neighborhoods, activity centers and employment hubs throughout the town; Days per Month (% of users) West Main Street sidewalks, due to its filling a critical gap in the pedestrian city, addressing a safety need, serving neighborhoods in needs and linking the downtown area to these neighborhoods; Broadway Street sidewalks, due to their potential to address safety needs, link neighborhoods in need, and provide access to grocery stores and downtown; and Oak Street sidewalks west of the US 74 Bypass, due to the area s employment figures, lack of sidewalk connecting and emerging safety concerns. It is recommended that Forest City pursue health-based funding for these high priority health projects. 71 Duration in Minutes Impacted Users Minutes per Month Max Duration x Days per Month 4-6 (17%) (49%) (17%) (17%) Will people walk more if facilities are built? The answer is: Yes! This table illustrates the results of research through Health Impact Assessment and related modeling to identify how many days per month individuals will walk and likely impact to user per mile of facility constructed. Source: Buncombe Co. Greenways & Trails Plan HIA
76 Chapter 8: Walking: The Wonder Drug Exhibit 8-4: Broad Health Bene- Facility: Description Broad Health Benefits ( = Positive; = Negative) Complete Streets New Sidewalks Crosswalks Separated Pathway Natural path A complete street is one designed to provide appropriate space for the safe movement of all users including motorists, bicyclists and pedestrians. In addition, a street is deemed complete if it adequately considers and optimizes adjacent land uses, is designed for a context sensitive travel speed, and provides ample buffer space between uses. Constructing new sidewalks compliant with ADA standards where they currently do not exist is a cornerstone of a walkable and active community. New sidewalk will vary in width where pedestrian use is higher and should be built with adequate roadway buffer space where warranted. Providing a designated space for pedestrians to cross a street either at an intersection or mid-block is the intended use for crosswalks. Crosswalk design can range from simple paint schemes, to more complex design including the use of pedestrian or traffic signals, pedestrian countdown signals, auditory devices and refuge islands. Greenway routes are constructed to ADA standards, are generally outside of roadway right of ways and span through open space, riverways, or through designated easements. Greenways are free of vehicle traffic, but can intersect roads and accommodate all user types both pedestrian and bicyclists. A natural path is one that is without a paved or artificial surface and can be used by pedestrians and bicyclists. Natural paths are generally built with minimal enhancements, and can be near roads or streets or in natural landscape settings like hills, or river or lake shorelines Gives ample space for pedestrians and bicyclists, fostering and promoting active modes. An attractive and vibrant street can attract more use and users Buffer space and design limits high vehicle speeds, conflicts with defenseless users All elements of the street need to be maintained to ensure continued intentions Provides stable and predictable walking surface Heightens profile and presence of pedestrians to motorists Can be usable space for providing street furniture, signage, vegetation Is not prone to flooding, roadway debris, or rutting like gravel or dirt surfaces Initial construction can generate noise, dust, and potential stress Fosters pedestrian movement at predictable locations Allows accessibility to particular land uses Heightens awareness for pedestrian presence to drivers If used with an elevated platform, can calm traffic and reduce severity of possible crash Without maintenance, crosswalks can lose both reflective properties and visual prominence Crosswalks generally put pedestrians in direct line with motorists. Use is principally dependent on driver compliance. Removes user from roadways Dedicated pedestrian/bicyclist space Connects land uses other than by roadway Provides stable walking surface If isolated, perception of danger heightened User type variability could lead to bike/pedestrian, or bike/bike crashes If outside of peripheral vision of motorists, crashes rates at intersection increased Removes users from roadways Dedicated pedestrian/bicyclist space Immerses users in a natural setting Lower cost to construct Surface can become unpredictable or unstable without normal maintenance Can be limited due to weather events such as flooding or soiling 72

77 9. Implementation & Evaluation Completion of is only one step in creating a community that is accommodating to people who walk. The implementation of the Plan will require a coordinated effort amongst Town officials, leaders, and citizen volunteers as well as follow-up plans and studies on more specific improvements. This chapter provides a series of action steps for moving forward with the recommendations of the Plan, as well as potential funding sources and partners for proposed projects. The implementation strategies of the Pedestrian Plan are closely aligned with areas the state of North Carolina identified for Bicycle and Pedestrian Safety Strategies through a series of summits in early 2011 and through NCDOT s Complete Streets efforts. The major action initiatives identified through those summits to help guide NCDOT and other state agencies through the next decade were: Fully implement Complete Streets; Address multi-modal funding; Retrofit existing facilities; Require more from all road users; Increase public awareness through education; Connect transportation and land use; and Improve law and strengthen enforcement. Each of these themes are addressed to some degree within the Forest City: Heart & Sole plan. This can help stakeholders within Forest City and Rutherford County articulate to local, regional and state leaders that the implementation of this Plan is consistent with what has been identified at the state level. These actions also help support the vision and goals of NCDOT as well as making a case to the state and its leaders that pedestrian needs are important. It will take the energy of communities like Forest City and its stakeholders, as well as many advocates, for walking and bicycling to once again become a priority for North Carolina. 10 Action Steps Completing the 10 Action Steps (Exhibit 9-1) on the next two pages helps guide development of the proposed walking network and creates a supportive program and policy environment for a walk-friendly Forest City. These steps will be crucial in moving forward with the overall recommendations of the Pedestrian Plan. The 10 Action Steps for Implementation are intended to serve as a barometer for short-term accomplishments related to this plan. Forest City should review these steps each year to determine the best approach to achieving them. 73 Chapter 9: Implementation & Evaluation Implementation of can seem daunting. This chapter identifies 10 Action Steps for Implementation to help guide the plan post-adoption and make it easy for the community to track its progress in improving conditions for people who walk. Photo : Don Kostelec

78 Chapter 9: Implementation & Evaluation Exhibit 9-1: Action Steps for Implementation 10 Action Steps for Implementation 2 Meet with Partners, Stakeholders & Others The planning effort engaged citizens and organizations in visioning, goalsetting and identification of projects, programs, and policies. Keeping citizens and organizations engaged in regular conversation about implementation is vital and Forest City should consider an advisory committee for these topics. The meetings and conversations, particularly with NCDOT Division 13, often lead to identification of mutual interests and projects or funding sources. These regular discussions, perhaps through a countywide pedestrian/ greenways advisory committee, can help identify funding opportunities. Partners: Town, RPO, NCDOT, Health Department 1 Adopt the Plan This is the first stage of implementation. The Plan should be forwarded to regional and state decisionmakers, such as the RPO and NCDOT Division office, for inclusion in regional planning and development processes. Rutherford County its planning, economic and health departments should also receive a copy for consideration when other plans or programs are updated. Partners: Town, RPO 3 Pursue High Priority Project Implementation Forest City should begin working toward implementation of its highest priority greenway, sidewalk and intersection projects as identified in Chapter 4. This should also include an upgrade of curb ramps along Main Street or Broadway. NCDOT, the RPO and others can help identify the best implementation strategies and potential partners. Partners: Town, RPO, NCDOT, County 5 Adopt Complete Streets Resolution & Policies Forest City now has a pedestrian plan that incorporates NCDOT s Complete Streets policy and design guidance, which bolsters the case for walking-related improvements on area roadways. To strengthen this position, the town should adopt a Complete Streets resolution and amend existing the UDO to improve walkability. Partners: Town 4 Create Annual Fund for Facilities & Maintenance Working toward high priority projects can only come with financial commitment. As recommended in the Land Use Plan, Forest City should include an annual allocation for facilities for people who walk, both new routes and mintenance. This fund may rotate its priority between greenways, sidewalks and intersections or suballocate a portion of the funds each year to different types of investments. Partners: Town 74


79 6 Be Involved in Complementary Planning Efforts Incorporate the recommendations of Forest City: Heart & Sole into future and existing plans developed and updated at the local, regional and statewide level. For instance, the recommendations of the Plan should be incorporated into the Comprehensive Transportation Plan for Isothermal RPO and any regional trail or greenway plans. Involvement in these efforts will also bolster support for improvements and document 7 Develop Education, Encouragement & Enforcement Programs Pedestrian facilities alone will not lead to a walk-friendly community. A variety of program recommendations are highlighted in Chapters 6 and 7 to promote safer conditions for people who walk. Ideally, programs and policy priorities should be implemented alongside infrastructure improvements, but the community should recognize that programs such as installing signage or wayfinding can occur several years before major infrastructure projects. Forest City should work with the Active Routes to School program to identify school-based programs in 2015 and Partners: Town, Police Dept, Sheriff Dept., Schools the Town s priorities for future NCDOT project prioritization cycles. Partners: Town, RPO, NCDOT, County 8 Measure performance This chapter identifies methods by which Forest City and its partners can track the performance in implementation of the Plan, which can help justify funding pursuits and strengthen the ability of the community to gain funding from various sources. Partners: Town, Volunteers, Health Dept. 10 Be unique. Think big. This Plan contains many firsts for Forest City with regard to: a pedestrian plan, a Health Impact Assessment, and a more detailed list of greenway projects. These components should position the Town at the top of the list in the region when it comes to funding for pedestrian investments and recognizing the community as a place that values walkability for safety, health and economic reasons. Partners: Everyone Chapter 9: Implementation & Evaluation 9 Engage Youth & Seniors to Raise Awareness Our youth and senior populations are the most vulnerable pedestrians who use the system. Design of facilities should be done in a manner that is accessible for persons of all ages and abilities. New program ideas and suggestions for specific design features can emerge through engaging youth and seniors in the design of pedestrian facilities. Know where they want to play along the greenway, where they want to rest, and what amenities they desire. If built with youth and seniors in mind, the pedestrian system of Forest City will be safe for all. Partners: Town, Health Dept., County 75


80 Exhibit 9-2: Potential Implementation Schedule 1. Adopt the Plan Fall Meet with Partners, Stakeholders & Others to discuss project options and funding pursuits Fall 2015 and beyond 3. Pursue High Priority Project Implementation - Starting with FY & RPO SPOT update 4. Create Annual Fund for Facilities & Maintenance Starting with FY Adopt Complete Streets Resolution & Policies - Fall Be Involved in Complementary Planning Efforts Ongoing after implementation schedule for key projects is known 7. Develop Education, Encouragement & Enforcement Programs FY Measure Performance Starting with FY (earlier if volunteers emerge) 9. Engage Youth & Seniors to Raise Awareness As staff resources allow or programs are implemented Be Unique. Think BIG Always!
81 Chapter 9: Implementation & Evaluation Evaluation Transportation-based projects, programs and policies are some of the most measurable aspects of the built environment in that an organization or municipality can track the progress of investments and policy changes. Given the economic uncertainty in many communities and within funding sources, non-profits, cities, RPOs and DOTs are finding value in tracking the performance of a variety of actions. For agencies like Forest City, methods of tracking the performance of projects, programs and policies can greatly help in justifying need for additional projects as grants are pursued. Communities that show measurable progress in the implementation of their plans find themselves in a more strategic position to receive funding from grants and other pursuits. Performance should not be confused with prioritization, as performance is measured as a change over a period of time, not a ranking of strategies. Performance for walkability and related endeavors can fall into many categories, each of which is in turn measured by some criterion. Exhibit 9-3: Evaluation Measures for Forest City Evaluation Measure Frequency (Every X years) Evaluation Measure Frequency (Every X years) Engineering Education Projects pursued in Pedestrian Plan 1 Children taught safe walking skills in school 1 Miles of Sidewalks in Forest City 2 Senior citizens taught safe walking skills 1 Miles of Multi-Use Trails/Greenways 2 Signage Added along Routes 2 Evaluation Pedestrian Counts along Broadway Street, Oak 2 Street, downtown, and at parks Encouragement Total Volunteer Hours 1 Participants in Walk to School Day 1 Economic Impact Survey 5 Participants in Safe Routes to School Program 1 BMI Rates at Forest City Schools 1 Outreach opportunities to businesses, visitors 1 Meetings with Town Officials 1 to 2 Funding allocated to pedestrian-related expenditures 1 to 2 Interaction with municipal, corridor & regional Ongoing Enforcement Plans Number of Crashes (by level / total) 2 Number of presentations to civic groups, others 1 Meetings with Law Enforcement 1 Number of grants pursued 1 Public Service Announcements 1 Participation in seminars, webinars & training 1 Number of Walking Route Maps Distributed 1 77

82 Creating expectations for future funding and greenway facilities can help create momentum for funding and document a need for the community, such as this signage for a planned greenway in downtown Greensboro, NC. Photo : Don Kostelec 78 Chapter 9: Implementation & Evaluation Forest City and its partners should track performance of the pedestrian system on an annual basis and promote this performance through an annual report and presentation to the Town, County and other organizations. Exhibit 9-2 depicts several performance areas that Forest City should consider to measure and document performance of itself and outreach efforts related to walkability. Funding Facilities for people who walk are constructed and therefore funded through a number of avenues and there are even more funding sources to pursue for programmatic implementation measures. Funding is generally divided into five categories of sources: local, state, federal, non-profit and private funding. The following section describe some of the more prominent sources in each category that Forest City could tap for implementation of this plan. Local Funding. It is recommended that Forest City establish an annual budget line item specifically for pedestrian improvements. A specific budget item is the most direct way to ensure that funding for pedestrian facilities is available, but sometimes a municipality s budget may be too limited to finance this work. Pedestrian facilities can also be built through incidental projects, by ensuring that pedestrian-related features (e.g. sidewalk upgrades, curb ramps) are constructed with any new projects or improvements, such as parks and recreation facilities, libraries, schools, and new roads. In addition, future private development should be reviewed for adequate pedestrian access, connections and parking. Municipalities often plan for the funding of pedestrian and greenway facilities or improvements through development of Capital Improvement Programs (CIP). Typical capital funding mechanisms include the following: capital reserve fund, capital protection ordinances, municipal service district, tax increment financing, taxes, fees, and bonds. This section highlights common sources of funding; however, these are in a constant state of flux due to transportation funding discussions occurring at the state and federal levels. Isothermal RPO and NCDOT are able to provide the latest information on these funding options. State and Federal Funding. The State Transportation Improvement Program is based on the Strategic Transportation Investments Bill (2013). The law introduces the Strategic Mobility Formula to prioritize projects funding. With this law, state transportation funds cannot be used to match federally-funded bike and pedestrian projects. The Strategic mobility formula assigns projects for all modes into one of three catego-


83 Chapter 9: Implementation & Evaluation ries: 1) Statewide Mobility, 2) Regional Impact, and 3) Division Needs. Pedestrian projects are in the Division Needs category. It is important to track changes or adjustments in these programs through Isothermal RPO as funding allocations and programs are in flux on a regular basis. NCDOT s Complete Streets Policy, and similar preceding policies, allows the Department to partner with local governments during the design and construction of roadway and bridge projects to accommodate bicycle and pedestrian improvements. Local governments should consider how planned road resurfacing, widening and safety projects can include bicycle and pedestrian facilities. Cost sharing construction of a sidewalk as part of a roadway project is far less costly to local governments than funding those improvements independently. It is crucial that NCDOT knows the interests of the local government well in advance of project design and construction. Local officials should spend time with Division staff reviewing expectations for accommodating bicycle and pedestrian travel as part of TIP or other roadway and bridge projects. Transportation Alternative Program (TAP). North Carolina receives an annual allocation of TAP funds from the federal government. Sidewalks and greenways are eligible expenses under this program. Due to state restrictions, the full 20% match required on these funds must be borne by the municipality. North Carolina may have additional TAP funds that were not allocated through the Statewide Transportation Improvement Program and related prioritization processes. Forest City should work through the RPO and with other regional municipalities to develop strategies to help the state utilize these funds. Powell Bill Funds. Annually, state street-aid (Powell Bill) allocations are made to incorporated municipalities which establish their eligibility and qualify as provided by statute. This program is a state grant to municipalities for the purposes of maintaining, repairing, constructing, reconstructing or widening of local streets that are the responsibility of the municipalities or for planning, construction, and maintenance of bikeways or sidewalks along public streets and highways. New sidewalks or replacement of existing sidewalks are an eligible expense for these funds. Recreational Trails Program. The Recreational Trails Program (RTP) is a grant program funded by Congress with money from the federal gas taxes paid on fuel used by off-highway vehicles. This program's intent is to meet the trail and trail-related recreational needs identified by the Statewide Comprehensive Outdoor 79 Exhibit 9-4: Job Creation Potential of Walking Facilities A study conducted by AASHTO the federal lobbying organization for state DOTs found that transportation investments such as greenways, sidewalks and bicycling facilities produce more jobs per million dollars spent than any other type of traditional transportation investment. Illustration: Don Kostelec

84 Volunteers are used by many communities to patrol and conduct light maintenance along greenways. Above, a volunteer patrol in Boise, Idaho, sweeps leaves off the greenway and provides a presence on the trail, which creates a greater sense of safety for users. Photo Credit: Don Kostelec Recreation Plan. 80 Chapter 9: Implementation & Evaluation North Carolina Parks and Recreation Trust Fund (PARTF). The fund was established in 1994 by the North Carolina General Assembly and is administered by the Parks and Recreation Authority. Through this program, several million dollars each year are available to local governments to fund the acquisition, development and renovation of recreational areas. PARTF funds are allocated through the North Carolina Trails Program to help fund beach accesses, state trail systems, and local trail construction efforts. The projects in this plan that create connections to Forest City's Parks are a good match for PARTF funds. Non-Profit / Private Funding Another method of funding sidewalks and greenways is to partner with public agencies, private companies, the hospital or hospital foundation, and/or not-for-profit organizations. Most private funding sources offer limited grants and public-private partnerships engender a spirit of cooperation, civic pride and community participation. The key to the involvement of non-profit and private partners is to make a compelling argument for their participation. Major employers and developers could be identified and provided with a Benefits of Walking, Bicycling and Greenways handout for themselves and their employees. Very specific routes that make critical connections to place of business would be targeted for private partners monetary support following a successful master planning effort. Potential partners include major employers, such as Facebook, which are located along or accessible to sidewalks, bicycle routes or greenways. Name recognition for corporate partnerships could be accomplished through trailhead signage or interpretive signage along greenway systems. Utilities often make good partners and many trails now share corridors with them. Money raised from providing an easement to utilities can help defray the costs of maintenance. It is important to have legal counsel review the agreement and verify ownership of the subsurface, surface or air rights in order to enter into an agreement. Volunteer Work It is expected that many citizens will be excited about the development of Forest City s greenway system and this is already evident in the energy level of those involved with the Heart & Sole Plan. Individual volunteers from the community can be brought together with groups of volunteers form church groups, civic groups, scout troops and environmental groups to work on route and greenway development on special community work days. Volunteers can also be used for fund-raising, maintenance, and programming needs.

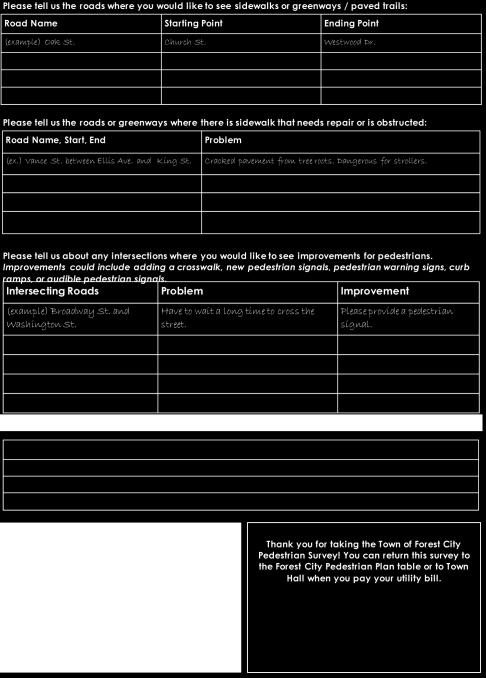
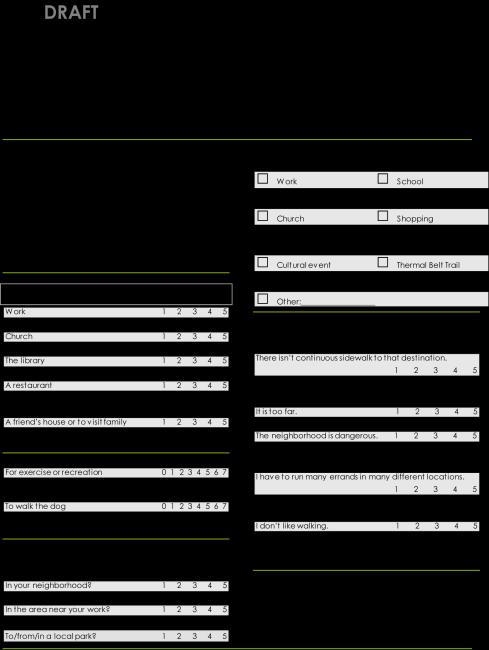
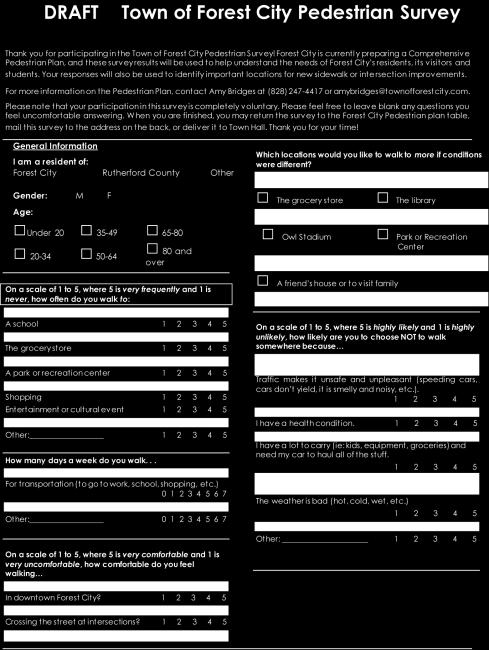
85 Appendix: Survey for Pedestrian Plan 81
City of Novi Non-Motorized Master Plan 2011 Executive Summary
 City of Novi Non-Motorized Master Plan 2011 Executive Summary Prepared by: February 28, 2011 Why Plan? Encouraging healthy, active lifestyles through pathway and sidewalk connectivity has been a focus
PEDESTRIAN ACTION PLAN
 ATTACHMENT 2 CITY OF SANTA MONICA PEDESTRIAN ACTION PLAN CITY OF SANTA MONICA PEDESTRIAN ACTION PLAN This page intentionally left blank EXECUTIVE SUMMARY CHAPTER 1 EXECUTIVE SUMMARY Setting the Stage
EXECUTIVE SUMMARY. Vision
 Vision Walking and bicycling in Salt Lake City will be safe, convenient, comfortable, and viable transportation options that connect people to places, foster recreational and economic development opportunities,
CHAPTER 3: Vision Statement and Goals
 Davidson Walks & Rolls: Active Transportation Master Plan CHAPTER 3 Contents: Overview Vision Statement Measurable Goals Public Outreach CHAPTER 3: Vision Statement and Goals Overview The vision statement
Perryville TOD and Greenway Plan
 Perryville TOD and Greenway Plan Greenway Glossary Pathway: A bicycle and pedestrian path separated from motorized vehicular traffic by an open space, barrier or curb. Multi-use paths may be within the
GRAHAM PEDESTRIAN TRANSPORTATION PLAN
 GRAHAM PEDESTRIAN TRANSPORTATION PLAN Chapter 1 I 1.1 Scope and Purpose n March of 2005, the City of Graham contracted with Greenways Incorporated (GWI) to create a Pedestrian Transportation Plan. The
ACTIVE TRANSPORTATION
 ACTIVE TRANSPORTATION Mobility 2040 Supported Goals Improve the availability of transportation options for people and goods. Support travel efficiency measures and system enhancements targeted at congestion
NM-POLICY 1: Improve service levels, participation, and options for non-motorized transportation modes throughout the County.
 Transportation PRINCE WILLIAM COUNTY 2008 COMPREHENSIVE PLAN NON-MOTORIZED PLAN CONTENTS Goals, Policies, and Action Strategies Table 4 (Bike Facility Classifications and Descriptions) Table 5 (Bike Facility
Vision: Traditional hamlet with an attractive business/pedestrian friendly main street connected to adjacent walkable neighborhoods
 N D. Focus Area II Vision: Traditional hamlet with an attractive business/pedestrian friendly main street connected to adjacent walkable neighborhoods Transit Road Focus Area II is located in the Hamlet
5. Pedestrian System. Accomplishments Over the Past Five Years
 5. Pedestrian System Accomplishments Over the Past Five Years The Alamo Area Metropolitan Planning Organization (MPO) and its partner agencies recognize the importance of improving pedestrian mobility.
City of Birmingham Draft Multi-modal Transportation Plan
 City of Birmingham Draft Multi-modal Transportation Plan City Commission Public Hearing Monday, November 25, 2013 7:30 pm Norman Cox, PLA, ASLA The Greenway Collaborative, Inc. Ann Arbor, Michigan The
Agenda. Overview PRINCE GEORGE S PLAZA METRO AREA PEDESTRIAN PLAN
 PRINCE GEORGE S PLAZA METRO AREA PEDESTRIAN PLAN May 28, 2008 Agenda Welcome and introductions Project overview and issue identification Planning context and strengths Design challenges and initial recommendations
CONNECTING PEOPLE TO PLACES
 CONNECTING PEOPLE TO PLACES 82 EAST BENCH MASTER PLAN 07 Introduction The East Bench transportation system is a collection of slow moving, treelined residential streets and major arteries that are the
Bikeway action plan. Bicycle Friendly Community Workshop March 5, 2007 Rochester, MN
 Bikeway action plan Summary The was held on March 5, 2007 at the Rochester Mayo Civic Center. The workshop was hosted by Rochester-Olmsted County Planning Department in collaboration with the League of
Executive Summary Route 30 Corridor Master Plan
 Route Corridor Master Plan Project Overview The Route Corridor Master Plan is a coordinated multimodal transportation and land use plan for the entire stretch of Route through East Whiteland Township,
TOWN OF PORTLAND, CONNECTICUT COMPLETE STREETS POLICY
 TOWN OF PORTLAND, CONNECTICUT COMPLETE STREETS POLICY I. VISION, GOALS & PRINCIPLES VISION To improve the streets of Portland making them safer and more accessible for all users including pedestrians,
RESOLUTION NO ?? A RESOLUTION OF THE CITY OF NEPTUNE BEACH ADOPTING A COMPLETE STREETS POLICY
 RESOLUTION NO. 2018-?? A RESOLUTION OF THE CITY OF NEPTUNE BEACH ADOPTING A COMPLETE STREETS POLICY WHEREAS, safe, convenient, and accessible transportation for all users is a priority of the City of Neptune
Chapter 2. Bellingham Bicycle Master Plan Chapter 2: Policies and Actions
 Chapter 2 Bellingham Bicycle Master Plan Chapter 2: Policies and Actions Chapter 2: Policies and Actions The Bicycle Master Plan provides a road map for making bicycling in Bellingham a viable transportation
BIKE PLAN CONTENTS GATEWAY
 CONTENTS Acknowledgments...vii Great Rivers Greenway District Board of Directors... vii Great Rivers Greenway District Staff... vii Project Consultants... vii Committees... viii Citizens Advisory Committee
o n - m o t o r i z e d transportation is an overlooked element that can greatly enhance the overall quality of life for the community s residents.
 N o n - m o t o r i z e d transportation is an overlooked element that can greatly enhance the overall quality of life for the community s residents. 84 Transportation CHAPTER 11 INTRODUCTION Transportation
CITY OF BLOOMINGTON COMPLETE STREETS POLICY
 CITY OF BLOOMINGTON COMPLETE STREETS POLICY POLICY OBJECTIVE: The City of Bloomington will enhance safety, mobility, accessibility and convenience for transportation network users of all ages and abilities,
Living Streets Policy
 Living Streets Policy Introduction Living streets balance the needs of motorists, bicyclists, pedestrians and transit riders in ways that promote safety and convenience, enhance community identity, create
Proposed. City of Grand Junction Complete Streets Policy. Exhibit 10
 Proposed City of Grand Junction Complete Streets Policy Exhibit 10 1 City of Grand Junction Complete Streets Policy Vision: The Complete Streets Vision is to develop a safe, efficient, and reliable travel
CONNECTIVITY PLAN. Adopted December 5, 2017 City of Virginia Beach
 CONNECTIVITY PLAN Adopted December 5, 2017 City of Virginia Beach CONTENTS 1.0 Background & Purpose... 2 2.0 Existing Inventory & Analysis... 3 ViBe District Existing Walking Conditions... 4 3.0 ViBe District
CITY OF COCOA BEACH 2025 COMPREHENSIVE PLAN. Section VIII Mobility Element Goals, Objectives, and Policies
 CITY OF COCOA BEACH 2025 COMPREHENSIVE PLAN Section VIII Mobility Element Goals, Objectives, and Policies Adopted August 6, 2015 by Ordinance No. 1591 VIII MOBILITY ELEMENT Table of Contents Page Number
Welcome. Background. Goals. Vision
 Welcome The formal Public Information Centre (PIC) for the Transportation Master Plan How We GO will be held in early 2017. At that time we will present the recommended transportation system for Niagara
Exhibit 1 PLANNING COMMISSION AGENDA ITEM
 Exhibit 1 PLANNING COMMISSION AGENDA ITEM Project Name: Grand Junction Circulation Plan Grand Junction Complete Streets Policy Applicant: City of Grand Junction Representative: David Thornton Address:
REGIONAL BICYCLE AND PEDESTRIAN DESIGN GUIDELINES
 REGIONAL BICYCLE AND PEDESTRIAN DESIGN GUIDELINES November 16, 2011 Deb Humphreys North Central Texas Council of Governments Bicycle and Pedestrian Advisory Committee Snapshot of the Guide 1. Introduction
STONY PLAIN ROAD STREETSCAPE
 Jasper Place Revitalization Strategy: Vision The people involved in the Jasper Place Revitalization Strategy envision: Goal 1: Feeling safe in our community Create a community where feeling safe is common--where
PRINCE GEORGE S PLAZA METRO AREA PEDESTRIAN PLAN
 PRINCE GEORGE S PLAZA METRO AREA PEDESTRIAN PLAN May 28, 2008 Agenda Welcome and introductions Project overview and issue identification Planning context and strengths Design challenges and initial recommendations
Speed Limits Study and Proposal. Public Input Session: 8/14/13
 Speed Limits Study and Proposal Public Input Session: 8/14/13 Why is Decatur a unique place for this project? First Community Transportation Plan in the nation with a Health Impact Assessment. Strong sense
Introduction. Who is WILMAPCO. Why are walkable communities important
 Walkable Community Workshops Round 1 April 2005 SPONSORED BY WILMAPCO AND CCOBH CITY OF NEW CASTLE EDGEMOOR GARDENS CIVIC ASSOCIATION WITH FUNDING BY DELAWARE DEPARTMENT OF TRANSPORTATION AND THE DELAWARE
University of Victoria Campus Cycling Plan Terms of Reference. 1.0 Project Description
 University of Victoria Campus Cycling Plan Terms of Reference 1.0 Project Description The Campus Cycling Plan, a first for the University, will provide a comprehensive and coordinated approach to support
Corpus Christi Metropolitan Transportation Plan Fiscal Year Introduction:
 Introduction: The Safe, Accountable, Flexible, Efficient Transportation Equity Act: A Legacy for Users (SAFETEA-LU) has continued the efforts started through the Intermodal Surface Transportation Efficiency
2015 Florida Main Street Annual Conference. Complete Streets Equal Stronger Main Streets
 WHAT ARE COMPLETE STREETS? CASE STUDIES COMPLETING YOUR MAIN STREET 2015 Florida Main Street Annual Conference St. Petersburg, Florida August 19, 2015 WHAT ARE COMPLETE STREETS? CASE STUDIES COMPLETING
EXISTING CONDITIONS. Chapter General Overview
 GRAHAM PEDESTRIAN TRANSPORTATION PLAN Chapter 2 T 2.1 General Overview he City of Graham is the Alamance County Seat, located within the Piedmont Triad section of North Carolina. About halfway between
TRAVEL PLAN: CENTRAL EUROPEAN UNIVERSITY CAMPUS REDEVELOPMENT PROJECT TRAVEL PLAN. Central European University Campus Redevelopment Project.
 TRAVEL PLAN Central European University Campus Redevelopment Project Page 1 Table of Contents Introduction... 3 Background... 7 Building Users... 7 Transportation in Community Consultation... 7 Summary
Stakeholder Meeting Handouts. January 2013
 January 2013 Stakeholder Meeting Handouts The Case FOR Parking Minimum Requirements Reduce street congestion around the development site Avoid parking spillover Create orderly development patterns Anticipate
A CHANGING CITY. of Edmonton, it is essential that it reflects the long-term vision of the City.
 A CHANGING CITY By the year 2040, Edmonton will be home to more than 1 million people. To accommodate growth and support a healthy and compact city, we need a new approach to development/redevelopment
The best indicator of an individual s and expanding access to parks and open space.
 Health & Wellness Create a Safe and Healthy Built Environment Artist s rendering, 2014 Health is important to Loveland residents, and stakeholders see the many strong connections between quality of life,
EXECUTIVE SUMMARY: TRANSIT-ORIENTED DEVELOPMENT IN SMITHS FALLS, ONTARIO; A COMPARISON BETWEEN TWO SITES
 EECUTIVE SUMMARY: TRANSIT-ORIENTED DEVELOPMENT IN SMITHS FALLS, ONTARIO; A COMPARISON BETWEEN TWO SITES Topic and Purpose In 2007, the Mayor of Ottawa s Task Force on Transportation suggested adding a
4 Goals, Objectives & Actions
 Chapter4 4 This chapter presents goals, objectives, and recommended actions to support the vision of making Overland Park a safer and easier place to ride a bicycle. 35 4.1 Recommendations Structure The
APPENDIX A: Complete Streets Checklist DRAFT NOVEMBER 2016
 APPENDIX A: Complete Streets Checklist DRAFT NOVEMBER 2016 Complete Streets Checklist MetroPlan Orlando s Complete Streets Checklist is an internal planning tool for staff to further implementation of
Ann Arbor Downtown Street Plan
 1 Ann Arbor Downtown Street Plan Public Workshop #1 We know that. 2 Public right-of-way (streets, sidewalks, and alleys) make up 30% of the total District area of downtown. Streets need to provide mobility
Eastern PA Trail Summit October 1, 2018
 Eastern PA Trail Summit October 1, 2018 WHO WE ARE + WHY + WE RE * HERE * * * * * * Session Goals: Discuss how to coordinate planning and design in small, urbanized towns Consider how to develop alternative
Chapter 7. Transportation. Transportation Road Network Plan Transit Cyclists Pedestrians Multi-Use and Equestrian Trails
 Chapter 7 Transportation Transportation Road Network Plan Transit Cyclists Pedestrians Multi-Use and Equestrian Trails 7.1 TRANSPORTATION BACKGROUND The District of Maple Ridge faces a number of unique
12/4/2016 VIA . RE: Grocery Outlet Del Paso (DR16-328)
") 12/4/2016 VIA EMAIL Ethan Meltzer, Assistant Planner City of Sacramento Community Development Department 300 Richards Blvd, 3 rd Floor Sacramento, CA 95811 RE: Grocery Outlet Del Paso (DR16-328) Dear Mr.
12/4/2016 VIA EMAIL Ethan Meltzer, Assistant Planner City of Sacramento Community Development Department 300 Richards Blvd, 3 rd Floor Sacramento, CA 95811 RE: Grocery Outlet Del Paso (DR16-328) Dear Mr.
Transportation Master Plan Advisory Task Force
 Transportation Master Plan Advisory Task Force Network Alternatives & Phasing Strategy February 2016 BACKGROUND Table of Contents BACKGROUND Purpose & Introduction 2 Linking the TMP to Key Council Approved
This page intentionally left blank.
 This page intentionally left blank. COMMUNITY Coweta Community Overview Coweta Coweta, a residential community located in Wagoner County, is a suburb of Tulsa situated southeast of the metropolitan area
PEDALING FORWARD. A Glance at the SFMTA s Bike Program for SFMTA.COM
 PEDALING FORWARD A Glance at the SFMTA s Bike Program for 2017-2021 SFMTA.COM INTRODUCTION About This Booklet More people from all walks of life see their bicycle as a more convenient way to get where
WELCOME. Purpose of the Open House. Update you on the project. Present a draft recommended plan. Receive your input
 WELCOME Purpose of the Open House The Town of Smiths Falls has initiated the Beckwith Street Redevelopment Plan that includes the preparation of a streetscape functional design for the renewal of Beckwith
Pre-Plan Consultation Summary
 Transportation Master Plan Pre-Plan Consultation Summary Thursday July 7, 2011 Presentation ti Outline Consultation Objectives Scope of Consultation Who Responded? What did we hear? How well did we connect?
COMPLETE STREETS POLICY Exhibit A to Ordinance
 CITY OF WENATCHEE COMPLETE STREETS POLICY Exhibit A to Ordinance 2016-24 Prepared and Reviewed By: City of Wenatchee Community & Economic Development Department City of Wenatchee Public Works Department
Table of Contents Introduction. 2 Purpose of the Plan...2 The Benefits of Walking and Bicycling...3 Vision and Goals of the Plan...
 BICYCLE AND This plan was created through a grant from the Healthy Communities Program with the cooperation of the City of Cynthiana, Cynthiana Main Street, Cynthiana-Harrison County-Berry Joint Planning
Pocatello Regional Transit Master Transit Plan Draft Recommendations
 Pocatello Regional Transit Master Transit Plan Draft Recommendations Presentation Outline 1. 2. 3. 4. What is the Master Transit Plan? An overview of the study Where Are We Today? Key take-aways from existing
DRAFT. Table of Contents. Background
 Douglas County Table of Contents Existing Infrastructure 86 Funding 89 Policy and Program Recommendations 90 Infrastructure Recommendations 92 Conclusion 95 Background Home to 4,500 residents and Baker
Solana Beach Comprehensive Active Transportation Strategy (CATS)
") Solana Beach Comprehensive Active Transportation Strategy (CATS) 3.0 Goals & Policies The Solana Beach CATS goals and objectives outlined below were largely drawn from the Solana Beach Circulation Element
Solana Beach Comprehensive Active Transportation Strategy (CATS) 3.0 Goals & Policies The Solana Beach CATS goals and objectives outlined below were largely drawn from the Solana Beach Circulation Element
Complete Streets. Designing Streets for Everyone. Sarnia
 Complete Streets Designing Streets for Everyone Sarnia Complete Streets ~ Sarnia ~ 2018 Introduction Our City is made up of a network of streets that we use to go for a walk, cycle to work, drive to the
CHAPTER 7.0 IMPLEMENTATION
 CHAPTER 7.0 IMPLEMENTATION Achieving the vision of the Better Streets Plan will rely on the ability to effectively fund, build and maintain improvements, and to sustain improvements over time. CHAPTER
INDOT Complete Streets Guideline & Policy
 INDOT Complete Streets Guideline & Policy INTRODUCTION The Complete Streets guidelines build upon multiple efforts and promote a multimodal transportation system that is integrated and sustains land use
NEWMARKET UPHAM S CORNER
 SOUTH STATION Planning Initiative NEWMARKET UPHAM S CORNER COLUMBIA ROAD (P) FOUR CORNERS/GENEVA Working Advisory Group (WAG) Meeting #5 TALBOT AVENUE MORTON STREET BLUE HILL AVE/CUMMINS HWY (P) RIVER
Tonight is for you. Learn everything you can. Share all your ideas.
 Strathcona Neighbourhood Renewal Draft Concept Design Tonight is for you. Learn everything you can. Share all your ideas. What is Neighbourhood Renewal? Creating a design with you for your neighbourhood.
Comments The Plan for Port Whitby
 Comments The Plan for Port Whitby April 24th, 2013 Community Meeting #2 Summary Report Prepared by GLPi April 29th, 2013 1 Introduction The purpose of the Port Whitby Secondary Plan Update, Community Improvement
summary of issues and opportunities
 1 summary of issues and opportunities EXECUTIVE SUMMARY CHAPTER 2: HISTORY - 3: LAND USE This first chapter is an overview of lessons learned from analysis of the existing conditions on El Camino as well
7/23/2017 VIA . Michael Hanebutt City of Sacramento Community Development Department 300 Richards Boulevard, 3 rd Floor Sacramento, CA 95811
 7/23/2017 VIA EMAIL Michael Hanebutt City of Sacramento Community Development Department 300 Richards Boulevard, 3 rd Floor Sacramento, CA 95811 RE: 65 th Street Apartments (DR17-220) Dear Mr. Hanebutt:
7 Complete Streets & Roadway Aesthetics
 7 Complete Streets & Roadway Aesthetics 7.1 OVERVIEW Our streets lay the foundation for how we interface with travel needs, physical exercise, social exchanges and access to goods and services. They are
East Burke Transportation, Safety and Capacity Improvements
 East Burke Transportation, Safety and Capacity Improvements The purpose of this project is to increase mobility and improve safety for pedestrians, cyclists, and motor vehicles along VT Route 114 in the
Chapter 5. Complete Streets and Walkable Communities.
 Chapter 5. Complete Streets and Walkable Communities. 5.1 Description of Complete Streets. Cities throughout the world, and specifically the United States, are coming to embrace a new transportation and
Bicycle and Pedestrian Advisory Committee (BPAC) November 21, 2013
 November 21, 2013") Bicycle and Pedestrian Advisory Committee (BPAC) November 21, 2013 OVERALL LAND USE CONCEPT Overall Broadway Valdez District: 95.5 acres (35.1 acres right-of ways + 60.4 acres developable land) Plan Subareas:
Bicycle and Pedestrian Advisory Committee (BPAC) November 21, 2013 OVERALL LAND USE CONCEPT Overall Broadway Valdez District: 95.5 acres (35.1 acres right-of ways + 60.4 acres developable land) Plan Subareas:
5 Circulation & Parking
 5 Circulation & Parking Downtown Parking & Circulation Strategy. Downtown Wayne has a somewhat disconnected system of local public streets to connect downtown with the residential neighborhoods, and primary
Creating walkable, bikeable and transit-supportive communities in Halton
 Creating walkable, bikeable and transit-supportive communities in Halton By presenting current research and best practices, the information in this paper is meant to support and broaden discussion on how
Chapter VISION, MISSION, AND GOALS AND OBJECTIVES. Vision. Mission. Goals and Objectives CONNECTING COMMUNITIES ACROSS THE ST.
 VISION, MISSION, AND GOALS AND OBJECTIVES Chapter 3 The Plan s vision, mission, and goals and objectives were developed through a series of interactive exercises with the Citizens Advisory Committee (CAC)
Chapter 5 Future Transportation
 Chapter 5 Future Transportation The Future Land Use Plan identifies the desired land use designations. The land uses desired for Crozet depend, in large part, on the success of the transportation system,
Bicycle Master Plan Goals, Strategies, and Policies
 Bicycle Master Plan Goals, Strategies, and Policies Mobilizing 5 This chapter outlines the overarching goals, action statements, and action items Long Beach will take in order to achieve its vision of
 Time of Change We Are Growing We Are An Attractive Place To Live We Are Age Diverse + Living Longer 50000 40000 30000 20000 10000 0 2010 Census Job Density Housing Sheds Transit Sheds The Project FUNDING
APPENDIX A. Outreach Summary
 APPENDIX A Outreach Summary COUNTYWIDE TRANSPORTATION PLAN Summary of Public Outreach and Engagement To gather an understanding of the transportation issues and priorities throughout the county, and inform
5/31/2016 VIA . Arwen Wacht City of Sacramento Community Development Department 300 Richards Blvd., 3 rd Floor Sacramento, CA 95811
 5/31/2016 VIA EMAIL Arwen Wacht City of Sacramento Community Development Department 300 Richards Blvd., 3 rd Floor Sacramento, CA 95811 RE: El Pollo Loco (P16-028) Dear Ms. Wacht: WALKSacramento has reviewed
TRANSPORTATION NEEDS ASSESSMENT
 TRANSPORTATION NEEDS ASSESSMENT A travel demand analysis was carried out to determine the operational issues and the potential benefit that adding traffic capacity would have on the road network. All the
Illustrated Principles of Good Planning
 Illustrated Principles of Good Planning The Miami 21 Zoning Code incorporates time-tested planning principles into the zoning regulations of our City. These are principles that make for better neighborhoods,
5/7/2013 VIA . RE: University Village Safeway Expansion (P13-019)
") 5/7/2013 VIA EMAIL David Hung, Associate Planner Community Development Department, Current Planning Division City of Sacramento 300 Richards Boulevard, 3 rd Floor Sacramento, CA 95811 RE: University Village
5/7/2013 VIA EMAIL David Hung, Associate Planner Community Development Department, Current Planning Division City of Sacramento 300 Richards Boulevard, 3 rd Floor Sacramento, CA 95811 RE: University Village
MASTER BICYCLE AND PEDESTRIAN PLAN
 VILLAGE OF NORTHBROOK MASTER BICYCLE AND PEDESTRIAN PLAN DRAFT PLAN OPEN HOUSE May 2, 2018 AGENDA 1. Community Engagement 2. Vision and Goals 3. General Structure of Plan 4. Recommendations Overview 5.
NJDOT Complete Streets Checklist
 Background The New Jersey Department of Transportation s Complete Streets Policy promotes a comprehensive, integrated, connected multi-modal network by providing connections to bicycling and walking trip
COUNCIL POLICY NAME: COUNCIL REFERENCE: 06/119 06/377 09/1C 10llC 12/1C INDEX REFERENCE: POLICY BACKGROUND
 COUNCIL POLICY NAME: COUNCIL ADVISORY COMMITTEES - TERMS OF REFERENCE ISSUED: APRIL 3, 2006 AMENDED: NOVEMBER 27, 2006 NOVEMBER 23, 2009 JANUARY 11, 2010 DECEMBER 17, 2012 POLICY COUNCIL REFERENCE: 06/119
Goal 3: Foster an environment of partnerships and collaboration to connect our communities and regions to one another.
 Non-Motorized Transportation Plan (NMTP) Draft Vision, Goal and,, Tri-County Regional Planning Commission (TCRPC) Purpose The purpose of the Tri-County Regional Planning Commission (TCRPC) Non-Motorized
Introduction. North 12 th Complete Street Project Overview
 Introduction On Wednesday, March 1, 2017, the City of Sacramento, in partnership with Sacramento Regional Transit District and the Sacramento Housing and Redevelopment Agency, hosted a community outreach
Physical Implications of Complete Streets Policies
 Presentation Overview Physical Implications of Complete Norm Cox, ASLA, LLA Landscape Architect Ann Arbor, Michigan, 10:45 to Noon What Are Complete Streets? What Matters to Bicyclists and Pedestrians
INNER LOOP EAST. AIA Rochester Annual Meeting November 13, 2013 TRANSFORMATION PROJECT. Bret Garwood, NBD Erik Frisch, DES
 INNER LOOP EAST TRANSFORMATION PROJECT AIA Rochester Annual Meeting November 13, 2013 Bret Garwood, NBD Erik Frisch, DES Why? We are building a city that encourages walking, biking and enjoying the outdoor
How to Develop a Pedestrian Safety Action Plan
 How to Develop a Pedestrian Safety Action Plan Course Introduction Presented by: Peter Eun FHWA RC Safety Engineer Ryan Snyder President, Ryan Snyder Associates, LLC Paul Zykofsky Director, Land Use and
AMATS Complete Streets Policy
 AMATS Complete Streets Policy Table of Contents: Section 1. Definition of Complete Streets Section 2. Principles of Complete Streets Section 3. Complete Streets Policy Section 4. Consistency Section 5.
Bicycle and Pedestrian Connectivity Study Phase 2
 Connectivity Study Phase 2 Process PROCESS OUTCOMES Phase Prepared By STEP I Public Participation and Outreach 1. RTP Outreach activities, and development of the Bike and Ped Task Force Phase 1 2011 OCPC
Kelowna On the Move. Pedestrian and Bicycle Master Plan
 Kelowna On the Move Pedestrian and Bicycle Master Plan Executive Summary April 2016 Purpose of the Plan The Pedestrian and Bicycle Master Plan identifies infrastructure, planning, and policy requirements
Make Lincoln Highway an economically vibrant corridor that is safe, efficient, and beautiful for local residents and visitors.
 Lincoln Highway Streetscape Plan Stakeholder Workshop #2 Handout Contents Introduction and Project Vision Planning Principles Specific Recommendations including a Proposed Typical Roadway Section Renderings
2. Context. Existing framework. The context. The challenge. Transport Strategy
 Transport Strategy Providing quality connections Contents 1. Introduction 2. Context 3. Long-term direction 4. Three-year priorities 5. Strategy tree Wellington City Council July 2006 1. Introduction Wellington
Bicycle and Pedestrian Plans and Improvements
 Bicycle and Pedestrian Plans and Improvements Presented to the City Council By Randle Harwood, Planning and Development, and Richard Zavala, Parks and Community Services September 24, 2013 Purpose Review
Chapter 14 PARLIER RELATIONSHIP TO CITY PLANS AND POLICIES. Recommendations to Improve Pedestrian Safety in the City of Parlier (2014)
") Chapter 14 PARLIER This chapter describes the current status and future plans for biking and walking in the City of Parlier. RELATIONSHIP TO CITY PLANS AND POLICIES The Parlier General Plan is the primary
Chapter 14 PARLIER This chapter describes the current status and future plans for biking and walking in the City of Parlier. RELATIONSHIP TO CITY PLANS AND POLICIES The Parlier General Plan is the primary
5 CIRCULATION AND STREET DESIGN
 5 CIRCULATION AND STREET DESIGN This chapter describes circulation and streetscape improvements proposed for the Northwest Chico Specific Plan Area. It includes detailed design specifications for existing
Plant City Walk-Bike Plan
 Plant City Walk-Bike Plan Plant City Commute Mode Share 2.2% 1.4% 2.9% Drove alone 10.2% Carpooled Public transportation (0.1%) Walked Used a Bike (0.4%) 82.9% Taxicab, motorcycle, or other means Worked
General Design Factors
 Chapter 3: 3-1.0 Introduction General Design Factors Mn/DOT s goals include encouraging and accommodating safe bicycling. From a design perspective, these goals are achieved by first having an understanding
DRAFT. Lecompton. Table of Contents. Background
 Lecompton Table of Contents Existing Infrastructure 98 Funding 100 Policy and Program Recommendations 102 Infrastructure Recommendations 104 Conclusion 109 Douglas County Lecompton Background Located at
WILMAPCO Public Opinion Survey Summary of Results
 Wilmington Area Planning Council WILMAPCO Public Opinion Survey Summary of Results Prepared by: 2955 Valmont Road, Suite 300 Boulder, Colorado 80301 t: 303-444-7863 f: 303-444-1145 www.n-r-c.com Table