National Travel Profiles Part A: Description of Daily Travel Patterns
|
|
|
- Dwayne Shelton
- 6 years ago
- Views:
Transcription
1 National Travel Profiles Part A: Description of Daily Travel Patterns Steve Abley, Michael Chou Abley Transportation Engineers Ltd Malcolm Douglass Douglass Consulting Services Ltd Land Transport New Zealand Research Report 353
2 *ISBN **ISSN , NZ Transport Agency Private Bag 6995, Wellington 6141, New Zealand Telephone ; Facsimile Website: Abley, S. 1, Chou, M. 1, Douglass, M National travel profiling part A: description of daily travel patterns. NZ Transport Agency Research Report pp. 1 Abley Transportation Engineers Ltd 2 Douglass Consulting Services Ltd Keywords: annual, average, daily, household, modes, New Zealand, personal, purposes, rural, surveys, travel, trip legs, urban, weekday, weekend
3 An important note for the reader The NZ Transport Agency is a Crown entity established under the Land Transport Management Amendment Act The objective of the NZ Transport Agency is to undertake its functions in a way that contributes to an affordable, integrated, safe, responsive, and sustainable land transport system. Each year, the NZ Transport Agency invests a portion of its funds on research that contributes to this objective. This report is the final stage of a project commissioned by Land Transport New Zealand before 31 July 2008 and is published by the NZ Transport Agency. While this report is believed to be correct at the time of its preparation, the NZ Transport Agency, and its employees and agents involved in its preparation and publication, cannot accept any liability for its contents or for any consequences arising from its use. People using the contents of the document, whether directly or indirectly, should apply and rely on their own skill and judgement. They should not rely on its contents in isolation from other sources of advice and information. If necessary, they should seek appropriate legal or other expert advice in relation to their own circumstances, and to the use of this report. The material contained in this report is the output of research and should not be construed in any way as policy adopted by the NZ Transport Agency but may be used in the formulation of future policy.
4 Acknowledgments New Zealand Trips and Parking, and the researchers acknowledge the assistance provided for this research project by: the Ministry of Transport, who made the basic survey datasets available, and the advice of officers that was generously offered during the work; and the peer reviewers and study group members for their critical and productive comments as the draft reports were reviewed and amended. In particular, we would like to thank Lynley Povey of the Ministry of Transport for her assistance with detailed definitions that were essential for a precise interpretation of the New Zealand Household Travel Survey.
5 Contents Executive summary... 7 Abstract Introduction Background Research objective Report structure Background About the Household Travel Survey Survey procedure Data description Categories Stratification Participants Off-road travel Weights Filters Day of travel and selection of individuals Definitions of trips and purposes Usage Trip legs Trip leg purpose Modes Trip chains Uses of the NZHTS Literature review Introduction Great Britain Australia United States New Zealand Summary Personal travel Introduction Mean trip leg distance and time, and number of trip legs per person Proportion of trip legs taken by private and public modes Summary Travel mode Introduction Trip legs/person/day, mean distance and time by mode and area Proportion of trip legs/person/day by age, gender and mode Walking trip leg duration by age and gender Comparing the proportion of trip legs by modes on weekday and weekends Walking duration by purpose in MUAs Cycle duration by purpose in MUAs Summary
6 6. Travel purpose Introduction Trip legs and total distance/person/day by purpose Mean distance and time by purpose Proportion of trip legs/person/day by age, gender and purpose Trip legs by purpose and day of the week Proportion of weekday and weekend trip legs by selected purposes Trip leg duration by purpose weekdays and weekends Summary Travel by trip leg purpose and travel mode Introduction Trip legs/person/day by purpose and mode Distance travelled/person/day by purpose and mode Trip leg proportion by purpose and mode Summary Social inclusion and accessibility Introduction Variation in travel by household car availability Variation in travel by household size Trip legs/person/day by mode and personal income Distance travelled by mode and personal income Summary Travel by time of day Introduction Proportion of home-based daily departures by purpose and time of day Proportion of daily arrivals purpose and time of day Proportion of weekday and weekend arrivals for all purposes by time of day in MUAs Summary Summary and recommendations Summary Some ongoing matters Recommendations Recommendations to NZTA Recommendations to the MoT References Appendices
7 Executive summary The opportunity to undertake this research resulted from a discussion and an offer from Ministry of Transport officers in They indicated that the very extensive survey information collected in the New Zealand Household Travel Survey (NZHTS), while being collected in primarily for government policy purposes, was also intended to be a database of continuing information for use by transportation researchers and practitioners. As a result, in 2007, Land Transport New Zealand (now part of the NZ Transport Agency) awarded this research contract to the New Zealand Trips and Parking Database Bureau. The objective of this research is to describe New Zealand travel behaviour by different modes and for different purposes as defined in the NZHTS. In the first instance, this is a comprehensive coverage from the database as it relates to travel patterns by mode and purpose. The NZHTS provides continuous, up-to-date data on personal travel, and monitors changes in travel behaviour over time. This report provides a detailed description of individual travel profiles in different areas, along with tables and plots of trip leg related survey results from the continuous travel survey data collected in The report is designed to be useful to practitioners in their understanding of travel patterns in the: Major Urban Areas: populations over ; Secondary Urban Areas: populations between and ; and Rural Areas: lesser populations and all other rural areas. Following the introductory background and literature review, the report deals with the survey results in the following sequence: personal travel, travel mode, travel purpose, travel by trip purpose and mode of travel, social inclusion and accessibility, and travel by time of day. The surveys provide a vast array of information. A few selected items give a sample of the type of information available from the NZHTS: The NZHTS survey breaks journeys up into trip legs, each having its own origin and destination, and relating to each particular mode used in the journey. Overall, the average number of trip legs/person/day for all areas is 4.4. Nationally, trip legs made as vehicle drivers exceed all other modes and, on average, represent 55% of all trip legs. The mode percent varies from 52% in MUAs to 58% in SUAs. Trip legs to home make up the largest trip leg purpose, closely followed by the to work main job trip legs. 7
8 NATIONAL TRAVEL PROFILES PART A: DESCRIPTION OF DAILY TRAVEL PATTERNS It will not be a surprise that individuals whose dominant travel mode is as a vehicle driver make more trip legs and travel greater distances per year for all purposes compared to individuals using all other modes of travel. Individuals who fall into the $10,001 $15,000 income category make fewer trip legs than those with larger incomes. This report explains the NZHTS mode and purpose definitions, and includes a wide range of comparative information describing travel in New Zealand. It may provide a suitable framework to continue recording the NZHTS results for publication in the years ahead. Complementing the description of travel, this report includes some conclusions and recommendations for future consideration. At the head of the list is a recommendation for further analysis of the NZHTS, with a view to improve the description of the predictive variables associated with different modes of travel and journeys, made up of trip chains, for various trip leg purposes. This should enable improved travel predictions for the future. It will be possible, with the completion of four survey years in 2007, to demonstrate trends in travel changes over time. It is also recommended that geographic regional comparisons be made and compared with the results arising from recent regional household surveys and transportation planning studies undertaken in Auckland, Wellington and Christchurch. 8
9 1. Introduction Abstract Gaining a thorough understanding of daily travel for all trip purposes and by all modes of travel is essential to policy and planning. The Ministry of Transport s New Zealand Home Travel Surveys (NZHTS) have, since 2003, been undertaken as continuous ongoing surveys. The dataset resulting from these years of survey include people from 6000 households. This large database is a valuable resource covering accidents and safety issues as well as travel profiles. The national statistics are broken down into major and secondary urban areas, and also rural areas as the basis of reporting and presentation. This report makes this information more readily available to researchers and practitioners involved with transportation. The report provides a wide range of tables and graphs relating to modes, purposes and trip legs for weekdays and weekend travel. It concludes with recommendations that the research should continue to provide more detailed investigation of trips, travel trends and regional comparisons. It also recommends that the variables surveyed in the NZHTS be further assessed for use in the development of transportation models for future travel projection. 9
10 NATIONAL TRAVEL PROFILES PART A: DESCRIPTION OF DAILY TRAVEL PATTERNS 10
11 1. Introduction 1. Introduction 1.1 Background The first Ministry of Transport New Zealand Household Travel Survey (NZHTS) was undertaken in 1989/90, followed by the second in 1997/98. These surveys were designed to provide a databank of personal travel information for New Zealand. The results of these one-off travel surveys have been used by transport planners, road safety researchers and engineers to formulate transportation policies, and to improve the safety and efficiency of the New Zealand transportation system. However, in earlier research documents undertaken using this survey data, little focus has been placed on analysing trip profiles. Trip profiles, such as trip length and trip durations categorised by different modes and trip purposes, are particularly valuable for future planning for sustainable transportation modes and transport assessments. The 1989/90 and 1997/98 surveys were discrete. Since 2003, these have now been complemented by ongoing continuous survey processes. Given that researchers need to investigate and describe New Zealand travel profiles more fully, Land Transport New Zealand 1 (LTNZ) commissioned the New Zealand Trips Parking Database Bureau to undertake analysis on National Travel Profiling: Description of Daily Travel Patterns in This report provides a detailed description of the individual household travel profiles in major urban, secondary urban and rural local government areas, along with tables and plots of trip related survey results from the 2003 to 2006 continuous travel survey data. This report has not attempted to analyse trends or undertaken any time series analysis. The datasets (dated 23 rd of April 2007) used in this analysis included the information from the 2002/03 surveys which were low samples and could not be adjusted to account for a full year s seasonal variations. The analysis in this research has not been able to include more detailed regional comparisons or trends over time. When the 2007 surveys have been added to the dataset, it will be possible for more detailed regional and trend analysis to be undertaken. 1 While this report was being prepared for publication, LTNZ was merged with Transit New Zealand to form the NZ Transport Agency (NZTA). 11
12 NATIONAL TRAVEL PROFILES PART A: DESCRIPTION OF DAILY TRAVEL PATTERNS 1.2 Research objective The objective of this research is to investigate and determine New Zealand travel behaviour for main urban and rural areas by different modes related to different land uses for varying trip purposes. This will provide practitioners with better quality information to make transport planning decisions from. The analysis includes daily trip leg profiles (including arrivals) by: purpose, mode, types of households with defined vehicle ownerships. Daily trip leg arrival profiles are analysed by region and area type (main urban, secondary urban or rural). All the trip leg purposes included in the national travel survey data have been considered, including trip legs to home, work (main job, other job, employer s business), education, shopping, social welfare, personal services, medical/dental, social/recreation, accompanying someone else and to change mode. This research project was defined as Part A (description of daily travel patterns). It was seen as an opportunity to describe the travel profile of the whole of New Zealand on a typical weekday or weekend. This preliminary travel profile investigation has been summarised according to Major Urban Areas (MUAs), Secondary Urban Areas (SUAs) and Rural Areas (RAs) as defined by the Statistics Department. In this report, the trip legs have not been related to specific land uses but rather to types of activity (e.g. work, education, shopping, etc.). Because of the limitations of only having four years of data, it was not possible to consider trends over time. Similarly, it has not been possible to undertake detailed regional comparisons. Such analysis should be undertaken as a further project. Much more information is available from the NZHTS data files, which can be analysed for a variety of purposes, including travel trends in each of the regions and developing travel projection models based on the trip modes and purposes already surveyed in the NZHTS. This project shows the value of the NZHTS as a national information database. This, in turn, leads to a recommendation for further analysis designed to identify regional contrasts and to develop transportation models for assisting future transformation planning. 12
13 1. Introduction 1.3 Report structure This report includes the following sections: Background: descriptions of the NZHTS survey procedure and database, and its uses; Literature review: international research on travel profiling consulted during research; Personal travel: includes information on area variations and personal travel from 2003 to 2006; Travel mode: includes details about how residents travel within New Zealand, categorised by mode; Travel purpose: includes details about why residents in New Zealand travel; Travel by trip purpose and mode of travel: details individuals travel, categorised by the purpose of the trip and mode of transport; Social inclusion and accessibility: includes information on how vehicle availability and income affect households and individuals travel profiles; Travel by time of day: includes information on personal travel patterns, categorised by time and purpose; and Summary and recommendation: a list of recommendations for further research topics. The supplementary material in the Appendices covers: Appendix A: the household form used for the NZHTS; Appendix B: the person form used for the NZHTS; Appendix C: the coding tables used for analysing the NZHTS responses; Appendix D: unweighted trip legs by time of day for home-based arrivals and departures; and Appendix E: glossary, abbreviations and acronyms. 13
14 NATIONAL TRAVEL PROFILES PART A: DESCRIPTION OF DAILY TRAVEL PATTERNS 2. Background 2.1 About the Household Travel Survey The NZHTS is a series of travel surveys designed to provide a databank of personal travel information for New Zealand. It is part of a continuous survey that began in 2003 and will be useful in enabling identification of long-term travel trends. This databank will continue to be an important source of information to influence government policies and monitor transport and safety performances. The Ministry of Transport (MoT) states that the aim of this survey is to increase our understanding of travel behaviour by people in New Zealand, including travel by car as a driver or passenger, walking and cycling, (MoT 2007). The current travel survey differs from the previous one-off surveys that were conducted in 1989/90 and again in 1997/98 in that the survey is now continuous rather than discrete. Discrete surveys are not as reliable in developing valid estimations of changes in accident risks and travel patterns occurring over time. The continuous survey ensures the availability of up-to-date travel data to formulate new transport and road safety policies. 2.2 Survey procedure The NZHTS dataset analysed in this report includes travel by approximately people from some 6000 households in sample areas throughout New Zealand between 2003 and The NZHTS is administered by an independent contract on behalf of the MoT. Households are selected and an initial letter is sent from the MoT to each household, which includes a pamphlet briefly describing the aims and content of the survey. The interviewer then calls at the address to gather household information, explains the purpose of the survey and informs the household what days are their travel days. The travel days are two consecutive days for which the household records all travel. The two consecutive days may be two consecutive weekdays or weekends. An even spread according to the day of the week was maintained by systematic allocation of travel days. The survey includes trips beginning between 0400h on Day 1 to 0359h on Day 3, a 48- hour period. A memory-jogger was left behind for the respondents to use for recording travel. The survey is voluntary. The response rate calculated in 2003/2004 was 64% (MoT 2007). Finally, the interviewer returns to conduct the interviews as soon as possible after the travel days. The 2003 household travel survey form and person form are included in Appendix A and Appendix B respectively. It should be noted that Questions 26 to 76 in the person form relate to alcohol and accidents, and are not applicable to purposes of this particular National Travel Profiling research project. A detailed description of the NZHTS methodology can be found on the MoT website (MoT 2008a). 14
15 2. Background 2.3 Data description Categories This research relies on a household travel survey undertaken in fourteen local government areas in New Zealand. Approximately people were interviewed from 5650 households between March 2003 and June The data supplied by the MoT was dated 23 rd of April In general, the data collected divides into the categories shown in Table 2.1 and the inter-relationships shown in Figure 2.1. This research project only focuses on analysing household, person and trip data to achieve the research objectives. The variables supplied by MoT and used in these surveys and this analysis are listed in Appendix C. Table 2.1 Main data categories and descriptions in the NZHTS. Main data category Household Person Trip Vehicles Alcohol Accidents Address Accident locations Trip geocoding Address geocoding Description Details about the household and its response to the survey Details about people in the household (information such as age, gender, experience, accident totals, occupation, income, driving, and work and school locations) Purpose, mode, date, time and distance of each trip leg, and vehicle information Type, make, model, year, engine CCs and owner information for vehicles driven during the survey Drinking session times and locations Accident involvement over the last two years Text description of trip destinations Text description of accident locations Trip location (map references) and geocoded distance estimates Address location (map references) Figure 2.1 Inter-relationships of the main HTS variables. Note: grey fill indicates the variables considered by this study. 15
16 NATIONAL TRAVEL PROFILES PART A: DESCRIPTION OF DAILY TRAVEL PATTERNS Stratification The sample strata and substrata were geographically based using Statistics NZ definitions for the 1996 Census of Population and Dwellings (see Statistics NZ 2008). The strata were based on the fourteen Local Government regions, further stratified into MUAs, which have a population of at least ; SUAs, which have a population between and ; and RAs, which includes minor urban areas with populations less than and all other rural areas. The sample sizes per Local Government Region were proportional to 2001 Census populations except the initial survey emphasis was as follows: Less than proportional: Auckland, Canterbury, Wellington; More than proportional: Hawkes Bay, Nelson/Marlborough, Northland, Southland, Taranaki, Gisborne and the West Coast Regions Participants All household members, including babies, were eligible for inclusion in the survey. Travel by household members aged nine and under was reported by a parent or caregiver who had been with the child on all travel Off-road travel Off-road travel, such as on off-road tracks or around private property (e.g. farms), was excluded from the survey. All on-road travel, including farmers' work travel, was included in the survey criteria. 2.4 Weights Since the sample is not a simple random sample of the population, a simple total of the sample observations is not appropriate for estimating population means and totals. Weighted means and totals are used, where the weights are approximately equal to the reciprocals of the probability of selection of the respondents. Weights are also used to reduce the inevitable bias due to non-response. The appropriate weights provided by the MoT and included in the datasets have been applied in calculation of all the travel profiles contained in this research. 16
17 2. Background 2.5 Filters Filters are applied to select households, people and trips by people with full responses only. Filters applied to the household, person and trip datasets provided by the MoT are presented in Table 2.2. Table 2.2 Filters used with each dataset of the NZHTS. Dataset Filter Description Household hhrespstat=1 Households with full response only Person perespstat=1 People in the survey with full responses Trip perespstat=1 Trips by people with full responses 2.6 Day of travel and selection of individuals After applying the filters, the entire analysis has accounted for those people who travelled on both Day 1 and Day 2. The analysis also includes people who did not travel on their designated travel days. 2.7 Definitions of trips and purposes Usage The definition of trip legs, modes and trip purposes can often vary between countries. The perception of these terms also varies between research documents depending on how the terms are applied in practice. For example, the Travel Survey 1997/1998 (Land Transport Safety Authority (LTSA) 2000) has used trip legs to understand New Zealanders travel behaviour. It is noted that O Fallon & Sullivan (2005) have used trip chains to understand how New Zealanders link their travel into journeys. Consequently, it is important to define these terms to ascertain the results contained inside this report. This allows practitioners to understand how the travel profiles are generated, and allows for comparisons with other national and international research. For this research, all the analysis uses trip legs and trip leg purposes as defined by the MoT (2007). This section outlines how trips legs, trip chains and trip leg purposes are defined Trip legs The Trip data contain over separate rows, one for each trip leg. The MoT (2008b) defines a trip leg as follows: A trip leg is a section of travel by a single mode with no stops. Thus if one walks to the bus stop, catches the bus to town and walks to his/her workplace, he/she has completed three trip legs (home-bus stop, bus stop 1 to bus stop 2, bus stop 2-work). Trip leg departures consider the start time of a trip leg for a given purpose. Trip leg arrivals consider when the trip leg ends. Home-based departures and arrivals are made to and from home, but a home-based daily departure refers to the first trip leaving home 17
18 NATIONAL TRAVEL PROFILES PART A: DESCRIPTION OF DAILY TRAVEL PATTERNS at the start of the day for a given purpose, while a home-based arrival is any trip leg that ends at home irrespective of the time of day (i.e. subsequent trip legs away from home may be made) Trip leg purpose Each trip leg has a trip leg purpose and the trip legs contained in the TR14 database are categorised by the Tractiv column. This column provides details of what activity is done at a trip leg destination. Fifteen activities (trip leg purposes) are listed: Home: This is used where the person is returning home or to a temporary place of residence at the end of a trip leg. Work main job: This indicates trip legs to work at a fixed work address. The main job is the job at which most hours are worked. Work other job: This is used to describe trip legs to a secondary or other job at a fixed work address. Work employer's business: This describes all work-related stops that are not to a fixed work address. Employed or self-employed people without a fixed place of work (e.g. plumber) are included in this category. Education: This includes travel as a student to institutions such as primary and secondary schools, colleges of advanced education, technical colleges, universities etc. This also includes school-related activities that are not at school, e.g. school outings, school patrol or school sports in school time. Sports at the weekend or after school are coded as recreation. This does not include trip legs to pre-school care/education facilities, as these are considered to be social visits. Shopping: This describes any trip leg ending at premises which sell goods or hire goods out for money. Premises which provide services only (e.g. solicitors, banks) or repairs only (e.g. appliances or shoe repairs) should be coded as personal business/services. Shopping is defined as any time the respondent enters a shop, whether or not a purchase is made. Social welfare: This includes stops made at government agencies involved in welfare, e.g. WINZ, guidance counsellors, employment offices, etc. and also includes collecting pension or unemployment benefit cheques. In this report, however, trips that fall under this definition are usually included in personal business/services unless otherwise stated. Personal business/services: This includes stops made to transact personal business where no goods are involved, e.g. banks, hairdressers, laundromats, libraries, veterinary surgeons and government offices other than social welfare agencies (e.g. City Councils and voluntary work). Medical/dental: This includes any stop made for personal medical or dental needs. Stops made by a respondent who is accompanying another person are coded under the purpose of accompany[ing] someone else. Social visits: These include visits to a private home; visits to a non-private dwelling (e.g. visiting a friend in hospital, visiting a friend staying in a hotel); preschool activities such as kindergarten, crèche, day-care, kohanga reo or nursery school; and all entertainment activities occurring in a public or private place. Such 18
19 2. Background entertainment activities include dining out, clubs, hotels, concerts, religious meetings, and off-road driving or motocross. Walking or cycling for social purposes involve exercise and are therefore coded as recreational. Recreational: This includes participation in sporting activities and travelling to sporting or recreational activities (e.g. driving to the park to go jogging). It excludes watching someone else play sport, which is a social visit ; and off-road driving or motorcycling, which are coded as social visits as these have no exercise component. Change mode: This records all cases where the purpose of the stop was to change to another mode of transport. Accompany someone else: This is used in cases where the purpose of the travel was to go somewhere for someone else's purpose. This is usually to pick up, drop off or accompany another person (or persons) e.g. a parent who walks to school in the afternoon to pick up their children. Left country: This is used where the respondent leaves New Zealand during the travel days. Their travel while in New Zealand should be recorded but any travel outside New Zealand is not part of the study and does not need to be recorded. Other: This covers any other trip leg purposes not defined by all the trip leg definitions above Modes The following definitions were used when defining modes: Trip legs made by motorbike (either as driver or passenger) were classified as vehicle driver or vehicle passenger rather than as cycling. For the analysis of motorised modes (see Chapter 9.4), buses and taxis were not included. Motorised trip legs included trip legs as vehicle drivers or passengers only. Trip legs made by walking included skateboards, scooters, prams, tricycles and children carried in backpacks, but mobility scooters and wheelchairs were classed as other. Trips legs made by professional taxi and bus drivers as part of their work were classified as vehicle driver (with the purpose classified as work employer s business ) rather than as public transport. Emergency vehicles (e.g. ambulances, police cars) were classified as vehicles rather than as a form of public transport. Public mode includes train, bus, ferry, plane and taxi. Private mode includes vehicle driver, vehicle passenger, bicycle and walking. 19
20 NATIONAL TRAVEL PROFILES PART A: DESCRIPTION OF DAILY TRAVEL PATTERNS Trip chains For some purposes, it is desirable to link travel into longer trip chains. For example, if one drives from work to home but stops 200 metres from home to buy bread, this may be considered as a single trip chain (work to home travel). The current dataset does not permit the analysis of trip chains, but this work is being done under a separate commission. 2.8 Uses of the NZHTS The NZHTS provides detailed information on where individuals travel, distance, time and purpose as well as what kinds of individuals are doing the travelling and their frequency of travel. The Pedestrian Planning and Design Guide, published by LTNZ (2006), made use of the 1997/98 NZHTS data to show the proportion of all walking trips categorised by different trip purposes. Other important uses of the NZHTS that relate to travel profiles may include: identifying changes in personal travel over time for different types of travel modes and areas; understanding how individuals travel to different activities; examining travel among different age groups, gender and income categories of individuals; and/or identifying travel demands at different time periods of the day, different days of the week and for different travel purposes. 20
21 3. Literature review 3. Literature review 3.1 Introduction A review of international literature on household travel surveys has been undertaken. The principal aim of this was to consult valuable outputs that have been generated internationally and that would assist in producing travel profiles in New Zealand. This chapter summarises the basic survey methodologies that have been developed in different countries and highlights some of the travel profile outputs that are pertinent to this research. The most constructive travel surveys consulted were those of Britain, Australia and the United States. The final subsection summarises several research projects that have been undertaken in New Zealand, and places this topic in the context of where further research in New Zealand s travel profile may prove of value. 3.2 Great Britain The continuous travel survey in Great Britain began in Field work is carried out every month of the year so that weekly, monthly and seasonal variations in travel patterns are fully monitored. The initial survey made use of data collected from 5050 household samples; subsequently, the number of households surveyed increased to around 8300 households in The sample sizes are drawn randomly each year. In general, the selected households are informed by mail explaining the purpose of the travel survey. Those who respond are followed up by placement interviews that gather information about the household, its individual members, household vehicles and long-distance journeys that household members have recently made. A seven-day travel diary is then given to each of the household members after the interview. Households that have agreed to do the survey receive a reminder call prior to the specified travel week, a mid-week checking call, and a subsequent pick-up call to collect the travel records and check the information recorded with the informants. In 2002, an experiment was undertaken by the British Ministry of Transport to examine the effect of offering incentives to the selected sample. Each household was given a 5 voucher and a signed promissory note if all household members completed the placement interview and a travel record. Hallar et al. (2005) state that there was a significant and large rise in response rate using a 5 incentive, caused primarily by a shift from partial to full responses. In 2003 and 2004 after the incentives were employed the response rate was 60%, compared with a response rate of 54% in
22 NATIONAL TRAVEL PROFILES PART A: DESCRIPTION OF DAILY TRAVEL PATTERNS In summary, the 2006 National Travel Survey (Department for Transport 2006) includes the following sections that touched on personal and household travel profiles: Trends in personal travel: This section shows changes in personal travel from 1988 to 2006 including mean trips, distance and time travelled per person per year. In addition, trends in distance travelled by mode are also illustrated. How people travel: This section provides details about how individuals travel in Great Britain, using different modes. It also includes information about how far people travelled and how many trips were made, by gender and age group. Why people travel: This section focuses on trip purpose, illustrating mean trips, distance and time travelled per person per year by purpose, gender and age group. Social inclusion and accessibility: This section shows how income levels and vehicle accessibility affects personal and household travel. It also shows personal travel by ethnicity, and individuals frequency of bicycle use, public transport and international flights. Moreover, the accessibility of bus services and local facilities is also presented. Other factors affecting travel: This section shows some of the other factors that affect travel, including car mileage, car occupancy, working at home and time of day. Of most relevance in this section is travel by time of day, which identifies morning and evening peak periods where the highest trip demands occur. 3.3 Australia The New South Wales (NSW) household travel survey has been conducted annually since June It is a continuous survey that covers the travel patterns of residents of the Greater Sydney Metropolitan Region. Approximately 8500 people in 3500 households are surveyed annually. Households are chosen at random to participate in the survey and selected households are notified by mail prior to the survey. Those who respond are given a travel diary that collects information on all travel undertaken by all household members for a nominated 24-hour period. Subsequently, travel data are collected though face-to-face interviews. The travel survey is voluntary. The response rate was 67% in 2006 (NSW Government Department of Planning 2007). The latest 2005 Household Travel Survey Summary Report (NSW Ministry of Transport 2007) contains the following sections that are relevant to this research: Purpose of travel: This section illustrates the annual proportion of trips and distance travelled on weekdays or weekends, categorised by purpose. Mode of travel: This section focuses on an individual s choice of travel mode. It shows the annual number and proportions of trips categorised by mode on weekdays and weekends. Purpose by mode: This section illustrates proportion of trips by purpose and mode in Trip duration: This section illustrates mean trip duration by purpose and mode on weekdays annually. 22
23 3. Literature review Time of day of travel: This section illustrates the number of people travelling, categorised by time of day on weekdays and weekends. The proportion of motorised trips categorised by purpose is also included in this section. Profile of travellers: This section compares the travel pattern of individuals categorised by gender and age, and includes the proportions of trips categorised by mode, gender and age group. The 2005 Household Travel Survey Summary Report also includes tables showing the different reasons in percentages for individuals travelling to work by public and private modes on weekdays. The 2005 results indicate the top three reasons for travelling by public transport: It avoids parking problems (48%). Some public transport users do not have a car (25%). Public transport is cheaper than private transport (24%). On the other hand, those who travel to work by private transport do so because: they feel that their vehicle is faster (48%), public transport is unavailable/inaccessible (33%) and public transport is problematic (26%). 3.4 United States The National Household Travel Surveys (NHTS) conducted in the US are discrete as opposed to continuous. The first NHTS was conducted in 1969, followed by surveys in 1977, 1983, 1990 and The latest survey was undertaken in Samples were selected by creating a random-digit dialling (RDD) list of telephone numbers. The sample size includes individuals from households and represents 0.02% of the population. The data collection consists of three main phases: A household interview collected demographics and vehicle ownership data. A personal interview collected the travel data for all the one-way trips that were taken during a designated 24-hour period. The designated travel day started at 0400h and ended at 0400h the next day. Two vehicle odometer readings were collected for each household vehicle. The first was at or around the time of the personal interviews. The second was at least two months later. The dates of each reading were recorded to facilitate the estimation of annual mileage. Cash incentives were offered to the selected households by including $5 in the preinterview letter and $2 in the travel diary mailing. The overall response rate in 2001 was only 41% (FHWA 2004). The 2001 NHTS report Summary of Travel Trends (Hu 2004) details the United States travel profiles extensively, covering the following sections: 23
24 NATIONAL TRAVEL PROFILES PART A: DESCRIPTION OF DAILY TRAVEL PATTERNS Travel and demographic summary: This section is a summary of travel trends of the individual NHTS that were undertaken in the previous years, including Household travel: This section focuses on household travel profiles. Of relevance are the mean annual person miles travelled, person trips and trip distance categorised by the trip purpose. Trips per household categorised by household income are also presented in this section. Person travel: This section provides information on personal travel profiles covering trip distance, time and mean number of trips, categorised by purpose, gender and mode. Private vehicle travel: This section focuses on vehicle travel, showing mean distance, time spent in vehicle per person and mean vehicle occupancy for selected trip purposes. Commute travel patterns: This section compares vehicle commuting trips by year looking at annual commuting trips per worker. It also illustrates the proportion of commuting trips by usual mode, and mean commute trip distance, trip time and speed in different years. Temporal distribution: This section shows distribution of person trips, categorised by trip purposes and the start time of the trip. 3.5 New Zealand The previous NZHTSs, undertaken in 1989/90 and 1997/98, have resulted in the publication of New Zealand Household Travel Survey (Ministry of Transport 1990) and The New Zealand Travel Survey 1997/1998 (Land Transport Safety Authority 2000) respectively. The survey procedures for these discrete surveys are equivalent to the current continuous NZHTS procedure, as mentioned earlier. The full response rate from all household members for the 1997/98 travel survey was 74.9%. LTSA (2000) provides detailed tables and plots showing New Zealanders travel profiles in the Travel section. The section contains the following areas that are relevant to this research: Comparing travel modes: This includes trips and distance travelled by mode and overall purpose; trips by mode, categorised by gender and age groups; and trip distance and duration by mode, categorised by duration and distance intervals. Time of day and day of week (all drivers and motorcycle riders): This includes distance driven by day of week and hour of day. Trips by private modes (i.e. vehicle driver, vehicle passenger, walking and cycling): This includes trips and distance travelled by age groups and gender, trip distance per trip categorised by age groups and gender, and total annual distance and time travelled categorised by age groups for the 1989/90 and 1997/98 comparison. Trips by public modes (i.e. bus and taxi trips): This includes trips and distance travelled, categorised by age groups. 24
25 3. Literature review Urban and rural residents: This includes comparisons between urban and rural areas of trips per year by mode, percentage of trips by purpose, and distance and hours spent travelling per person per week by mode. Regional analysis: This includes trips; annual distance travelled by mode, categorised by region; and annual kilometres travelled per person as a vehicle driver, passenger or cyclist, categorised by region. O Fallon & Sullivan (2005) used the 1997/1998 New Zealand Household Travel Survey database to derive trip chains and tours to understand New Zealanders travel behaviour. O Fallon & Sullivan (2005) define a trip chain as: a series of one or more segments [trip legs] defined by starting a new chain whenever: The segment [trip leg] is the first one recorded in the respondent s travel diary (excluding trip legs by plane). The starting point of the segment [trip leg] is home or their workplace. The origin of the trip is neither home nor work, but the respondent has been at that location for more than 90 minutes (and the purpose of the immediately preceding segment [trip leg] was not change mode). On the other hand, O Fallon & Sullivan (2005) define a tour as a series of segments [trip legs] that start from home and ends at home. The authors class tours into ten different types, as shown in Table 3.1. Table 3.1 Classes of tours used by O Fallon & Sullivan (2005). Tour description Sequence a Simple work h b w c h Multi-part work h w ( w ) w h Composite to work h nw d /e e (nw/w/e) w h Composite from work h w( nw/w/e) nw/e h Composite to and from work h nw/e (nw/w/e) w (nw/w/e) nw/e h Composite at work h w (nw/w/e) nw/e (nw/w/e) w h Simple/multi-part education h e (e) h Composite education and non-work h nw e (nw) h and h (nw) e nw h Simple non-work/non-education h nw/ne h Multi-part non-work/non-education h nw/ne nw/ne (-nw/ne-) h Notes to Table 3.1: a The bracketed terms represent additional trips that may be in the tour. b h = home c w = work d nw = non work (including personal business, shopping and leisure/recreational purposes) e e = education Given the definition of a trip chain, trip legs contained in the 1997/98 database were aggregated into trip chains. The trip chain analysis revealed the following key points: On average, an individual travels 2.3 trip chains per day, compared with 4.4 segments (trip legs) per day. Nearly half (48.3%) of all trip chains consist of one segment (trip leg). On average, a trip chain consists of 1.9 segments (trip legs). 25
26 NATIONAL TRAVEL PROFILES PART A: DESCRIPTION OF DAILY TRAVEL PATTERNS Ninety percent of all trip chains use a single mode of transport, and trips made as a vehicle driver make the highest proportion (48%) of all the modes used within a trip chain. Of the trip trains with vehicle driver as the main mode, 42% have a total trip chain distance of greater than 6 km. For all modes of travel, trip chains by subsistence (work or education), maintenance (personal business, shopping, etc.) and discretionary (social, recreational, leisure) occur in fairly equal proportions, 24%, 21% and 24%, respectively. Similarly, tours were validated from the database. The tours analysis shows that: on average, an individual travels 1.3 tours per day; 56% of the tours have two trip chains in each tour; 66% of the tours are non-work/non-education tours and 23% are for work purposes; 84% of all tours use a single mode, with vehicle driver accounting for the highest proportion of all the modes used within a tour (47%); more than 28% of all tours are less than 4 km in distance and over 50% of all tours are less than 10 km in distance; the proportion of tours made as a vehicle driver in Wellington (40.5%) is relatively lower than in Auckland (45.8%) and Christchurch (44.2%). On the other hand, Christchurch has higher proportions of cycling tours (3.8%) than Wellington and Auckland (3.2% and 1.9%, respectively); individuals make higher proportions of shorter trips (up to 1.99 km) in Christchurch, (14.7%) compared with Auckland (10.9%) and Wellington (12.9%). O Fallon & Sullivan (2003) also used the 1997/98 NZHTS to investigate the weekday and weekend travel patterns for three main urban centres (Auckland, Wellington and Christchurch). Key points revealed from the weekday and weekend analysis include: Sundays have the lowest trip legs (3.6 trip legs/person) compared with weekdays and Saturdays (5.2 and 4.4 trips legs/person, respectively). Fridays have the highest number of trip legs per person (5.8). Individuals travel less on Sundays, making only 3.6 trip legs per person. The proportion of trip legs made for a work purpose is higher on weekdays compared with weekends. On the other hand, proportions of social/recreational and shopping trip legs are higher in the weekend compared with weekdays. Over 50% of weekend trips depart between 0900 and 1500, while just over 37% of weekday trips occur during this period. The proportion of trip legs made as a vehicle driver are relatively lower on Sundays (43.1%) compared with weekdays (48.3%) and Saturdays (48.1%). The proportion of trip legs made by public transport (bus and train) and walking are relatively higher on weekdays compared with weekends. 26
27 3. Literature review A higher proportion of trip legs are made as a vehicle passenger on the weekends. Wellington has a higher proportion of trip legs made by public transport (bus and train) and walking on weekdays compared with Auckland and Christchurch. This also explains why the proportion of trip legs by vehicle driver and vehicle passenger is relatively lower in Wellington. 3.6 Summary The literature reviewed in this section has a twofold function. Primarily, it provides supplementary information regarding travel patterns within New Zealand and around the world. Additionally, it operates as a control on the methodology used in the NZHTS as well as in the analysis of the data collected. By consulting outputs generated internationally, we were able to ensure that both the survey and subsequent analysis of the results were in line with international methods for investigating travel behaviour. This results in high quality information upon which transport planning decisions can be made. 27
28 NATIONAL TRAVEL PROFILES PART A: DESCRIPTION OF DAILY TRAVEL PATTERNS 4. Personal travel 4.1 Introduction Tables and charts in this chapter show the personal travel profiles for all travel surveyed between 2003 to 2006 in different areas. The analysis includes all areas, MUAs, SUAs and RAs. The personal travel profiles included are: mean trip leg distance, trip leg time and number of trip legs/person/day; and proportion of trip legs by categorised by private and public modes. Trip leg distances used in the travel profiles were calculated by mapping the quickest route (or via a given waypoint) between origin and destination. Trip leg distances were calculated for road-based modes only; these modes were vehicle driver, vehicle passenger, bicycle, bus and taxi. 4.2 Mean trip leg distance and time, and number of trip legs per person The distance, number of trip legs and mean trip leg time travelled per person per day categorised by area are presented in Table 4.1. The mean number of trip legs/person/day, mean trip leg distance and mean trip leg time are illustrated in Figures 4.1 to 4.3. The analysis of the mean trip leg distance, trip leg time and the number of trip legs/person/day shows that: The mean amount of trip legs /person/day for all areas is around 4.4 trip legs. SUAs have the highest mean amount of trip legs /person/day, with 4.7 trip legs. RAs have a mean trip leg distance of about 13 km per trip leg. This reflects the remoteness from origin to destination in rural areas. SUAs have the lowest time per trip leg (13.4 min) compared with other area types. This reflects less congestion than MUAs and shorter trip lengths than in RAs. 28
* Trip legs/ person/day Time travelled /person /day (min) Mean trip leg distance Mean trip leg time (min) Unweighted sample size (people) All 35.6 4.4 67 9.")
29 4. Personal travel Table 4.1 Mean trip leg distance, trip leg time and amount of trip legs/person/day, categorised by area. Area Distance travelled/person /day (km)* Trip legs/ person/day Time travelled /person /day (min) Mean trip leg distance Mean trip leg time (min) Unweighted sample size (people) All MUA SUA RA * Only includes vehicle passenger, vehicle driver, bicycle and bus and taxi trip leg distances. Figure 4.1 Mean trip legs/person/day, categorised by area. 29


30 NATIONAL TRAVEL PROFILES PART A: DESCRIPTION OF DAILY TRAVEL PATTERNS Figure 4.2 Mean trip leg distance, categor ised by area. Figure 4.3 Mean trip leg time, categorised by area. 30
31 4. Personal travel 4.3 Proportion of trip legs taken by private and public modes The proportions of trip legs made by modes, categorised by area, are presented in Table 4.2. The proportion of trip legs taken by selected private and public transport modes are illustrated in Figures 4.4 and 4.5, respectively. These show the selected mode as a proportion of total trip legs by all modes. The analysis of the proportions of trip legs taken by selected private and public transport modes shows that: Travel mode as a vehicle driver has the highest trip leg proportion, accounting for over 50% of all trip legs taken from 2003 to 2006 in all area types. The proportion of vehicle driver trip legs in SUAs is 58%, which is relatively higher compared with 53% and 56% in MUAs and RAs, respectively. The proportion of walking trips legs in MUAs is 16%, which is relatively higher compared with 11% and 14% in SUAs and RAs, respectively. In terms of public modes, the proportion of trip legs made by bus in RAs is 2.9%, which is relatively higher compared with 2.4% and 0.8% in MUAs and SUAs, respectively. This is possibly because in SUAs and RAs, bus trip legs are more intertaking the bus to town/regional, and probably reflects the high proportion of rural school children school. Table 4.2 The proportions of trip legs made by modes, categorised by area. Mode description Trip leg proportion All areas MUAs SUAs RAs Walk 15.5% 16.5% 11.3% 13.7% Vehicle driver 54.1% 53.0% 58.5% 56.1% Vehicle passenger 25.5% 25.5% 26.9% 24.9% Bicycle 1.4% 1.2% 1.9% 1.8% Bus 2.4% 2.4% 0.8% 2.9% Train 0.3% 0.3% 0.1% 0.1% Taxi 0.4% 0.5% 0.4% 0.2% Other* 0.5% 0.6% 0.3% 0.4% Total 100% 100% 100% 100% Unweighted trip legs (all modes) * The other category may include trips by train, ferry, plane and mobility scooter, as well as trips which were classified as other on the survey forms. These may include travel by boat, horse, electric wheelchairs etc. 31

32 NATIONAL TRAVEL PROFILES PART A: DESCRIPTION OF DAILY TRAVEL PATTERNS Figure 4. 4 The proportions of trip legs made by private transport modes, categorised by area. Figure area. 4.5 The proportions of trip legs made by public transport modes, categorised by 4.4 Summary This chapter has provided details about how New Zealanders travel in different areas and reg ions. Highlights of the analysis by different area types and regions include: Overall, the mean number of trip legs /person/day for all areas is around 4.4 trip legs; and Trips where the mode was vehicle driver have the highest trip leg proportion, accounting for over 50% of all trip legs taken on a national basis. 32
33 5. Travel mode 5. Travel mode 5.1 Introduction This chapter provides details about how residents of New Zealand travelled using different transport modes between 2003 and It also shows the individual choice of travel mode by identifying different area t ypes and days of the week. In addition, the number of trip legs made per person by members of different age groups and genders are also shown. It is noted that a trip leg is an arbitrary unit based on stops; not every trip leg represents a new purpose or oppor tunity for mode ch oice. In al l figures and tables, the categor y other may incl ude trips by tr ain, ferry, plane and mobility scooter, as well as trips which were classified as other on the survey forms (these may include travel by boat, horse, electric wheelchai rs etc.). 5.2 Trip legs/person/ day, mean distance and time by mode and area The number of trip legs/person/day, total travelling time/person/day and the mean trip leg distance and duration, categorised by mo de of travel and area, are presented in Table 5.1. The number of trip legs/person/day by mode and area are illustrated in Figure Figure 5. 2 shows the mean trip duration by mode and area, while Figure 5. 3 shows the mean trip distance by mode and area. The ana lysis of the number of trip legs/person/day and th e mean trip le g distance, as categorised by the mode of travel, shows that: The number of t rip legs/person/day made as a vehicle driver is substantially higher compared with other travel modes. On average, an individual travels 2.4 trip legs per day as a vehicle driver nationally. The amount of trip legs/person/day made as a vehicle driver and vehicle passenger are 2.8 and 1.3 trip legs, respectively, in SUAs. This is a relatively higher number of trips than reported in other area types. Individuals in MUAs travel more trip legs by walkin g compared with other area types. On average, an individual travels 0.7 trip legs per day by walking in MUAs. RAs have the highest mean trip le g duration in all modes (16 minutes) compared with SUAs (13 minutes) and MUAs (15 minutes). Similarly, RAs have the highest mean trip leg duration and distance for vehicle driver and vehicle passenger compared with other area types. 33
34 NATIONAL TRAVEL PROFILES PART A: DESCRIPTION OF DAILY TRAVEL PATTERNS Table 5.1 The number of trip legs/person/day, total travelling time/person/day and the mean trip leg distance and time, categorised by mode of travel and area Mode description* Area: All Unweighted trip legs Trip legs/person/day by mode Mean trip leg length (km) Mean trip duration (min) Total travelling time/day/person (min) Walk Vehicle driver Vehicle passenger Bicycle Bus Taxi Other All modes Area: MUA Walk Vehicle driver Vehicle passenger Bicycle Bus Taxi Other All modes Area: SUA Walk Vehicle driver Vehicle passenger Bicycle Bus 76 Taxi 42 Other 34 All modes Area: RA Walk Vehicle driver Vehicle passenger Bicycle Bus Taxi 47 Other All modes * Estimates could not be made in categories where the number of trip legs sampled was less than


35 5. Travel mode Figure 5.1 area. The mean number of trip legs/person/day, categorised by mode of travel and Figure 5.2 The mean trip leg duration, categorised by mode of travel and area. 35

36 NATIONAL TRAVEL PROFILES PART A: DESCRIPTION OF DAILY TRAVEL PATTERNS Figure 5.3 The mean tr ip leg distance, categorised by mo de of travel and area. 5.3 Proportion of trip legs/person/day by age, gender and mode The proporti ons of trip legs/person/day, as categorised by age, gender and mode of travel, are shown in Table 5.2. The numbers of trip legs/person/day are illustrated in Figure 5.4; Figure 5.5 sho ws the trip leg distance travelled per person per da y. The analysis of the travel profile between people of different age groups and genders shows that: The number of trip legs/person/day broadly increases from ages 5 9 until 40 49, after which, it begins decreasin g. The distance trav elled per person per day bro adly increases from age to and th en decre ases a bove the a ge of 49. Up until th e age of 50, females make more trip legs on averag e than males of the same age gr oup. Beyond 50, males make more trip legs than femal es. Males travel 22% further than femal es, averaging 39 km per day compared with 32 km for fema les. Children aged 14 and under make ove r 50% of their trip l egs as veh icle passe ngers, with the majority of the r emainder of their trip legs being made on foot. Males and females 14 and under have the same vehicle passen ger and walking mode use. 36
37 5. Travel mode Table 5.2 The weighted proportions of trip legs/person/day, categorised by age, gender and mode of travel. Mode All people All ages All ages (Trip legs/ person/day) Walk 12% 16% 26% 25% 20% 16% 13% 11% 13% 18% 16% 0.7 Vehicle driver 0% 0% 0% 30% 56% 60% 72% 75% 71% 59% 54% 2.4 Vehicle passenger 87% 76% 59% 35% 17% 19% 11% 11% 13% 20% 25% 1.1 Bicycle Bus Taxi Other 0% 3% 7% 2% 0% 1% 1% 1% 1% 1% 1% 0.1 0% 4% 7% 6% 5% 2% 1% 1% 1% 1% 2% 0.1 0% 0% 0% 1% 1% 1% 0% 0% 0% 1% 0% % 1% 1% 2% 1% 1% 1% 1% 1% 1% 1% 0.03 All modes 100% 100% 100% 100% 100% 100% 100% 100% 100% 100% 100% 4.4 Distance travelled/day (km)* All trip legs (trip legs/ person/day) Unweighted sample size (people) Males Walk 13% 14% 24% 22% 16% 15% 11% 9% 10% 17% 13% 0.6 Vehicle driver 0% 0% 0% 37% 65% 67% 79% 83% 81% 72% 61% 2.7 Vehicle passenger 86% 75% 58% 31% 14% 13% 6% 5% 6% 8% 20% 0.9 Bicycle Bus Taxi Other 0% 4% 10% 3% 1% 1% 2% 1% 1% 1% 2% 0.1 0% 5% 7% 5% 3% 3% 1% 1% 1% 1% 2% 0.1 0% 0% - 1% 1% 1% 0% 0% 0% 0% 0% % 1% 1% 2% 1% 1% 1% 1% 1% 0% 1% 0.04 All modes 100% 100% 100% 100% 100% 100% 100% 100% 100% 100% 100% 4.4 Distance travelled/day (km) All trip legs (trip legs/ person/day) Unweighted sample size ( people) Females Walk 10% 18% 27.2% 27.4% 25% 18% 16% 13% 15% 20% 18% 0.8 Vehicle driver 0% 0% 0% 23% 46% 55% 65% 67% 61% 45% 47% 2. 1 Vehicle passenger 89% 77% 61% 39% 21% 24% 16% 17% 20% 31% 31% 1.4 Bicycle Bus Taxi Other 0% 1% 4% 1% 0% 1% 1% 1% 1% 0% 1% % 3% 8% 8% 7% 2% 1% 2% 1% 2% 3% 0.1 0% 0% 0% 1% 1% 0% 0% 0% 0% 1% 37 0% % 0% 1% 2% 1% 1% 0% 1% 1% 1% 1% All Modes 100% 100% 100% 100% 100% 100% 100% 100% 100% 100% 100% 4.4 Distance travelled All trip legs (trip legs/ person/day) Unweighted sample size (people) * Distance travelled per day only includes vehicle passenger, vehicle passenger, bicycle, bus and taxi trip leg distances.
38 NATIONAL TRAVEL PROFILES PART A: DESCRIPTION OF DAILY TRAVEL PATTERNS Figure 5.4 The number of trip legs/person/day, categorised by age group and gender. Figure 5.5 Distance travelled per person per day, categorised by age group and gender. 38
39 5. Travel mode Analysis of the proportions of the mean amount of vehicle trip legs categorised by age and gender, as illustrated in Figure 5.6, shows that: On average, males make a higher proportion of their trip legs as vehicle drivers compared with females (61% as opposed to 47%). Linked to this, females make a higher proportion of their trip legs as a vehicle passenger compared with males (31% compared with 20%). The proportion of trip legs made as vehicle drivers increases with age to a peak of 83% among males in the age group and 67% among females of the same age group. The peaks decline after this age group. The proportion of trip legs made as vehicle passengers decreases with age to a lowest proportion of 5% among males in the age group and 16% among females in the age group. The lowest trip leg proportion for all people as vehicle passengers occurs in the age group. It should be noted that the trip leg proportions of car drivers and passengers do not add to 100% as other modes make up the difference, and sometimes, vehicle drivers make trip legs without carrying passengers. Figure 5.6 The proportion of the mean amount of vehicle trip legs, categorised by age and gender. 39
40 NATIONAL TRAVEL PROFILES PART A: DESCRIPTION OF DAILY TRAVEL PATTERNS Figure 5.7 shows that with regards to walking trip legs: On average, females make higher proportion of their trip legs by walking compared with males (18% compared to 13%). The proportion of trip legs made by walking increases with age to a peak of 27% among females in the age group and 24% among males in the 10 14age group. This trend declines after these age groups and then increases after the age of Figure 5.7 The proportion of walking trip legs, categorised by age and gender. 40
41 5. Travel mode Figure 5.8 shows that with regards to cycling trip legs: On average, males make a higher proportion of their trip legs by cycling compared with females (2% compared to 1%). The proportion of trip legs made by cycling increases with age to a peak of 10% among males in the age group and 4% among females in the same age group. This peak declines rapidly after these age groups and then fluctuates between 0.5% and 1.8% for both genders. Figure 5.8 The proportion of cycling trip legs, categorised by age and gender. 41
42 NATIONAL TRAVEL PROFILES PART A: DESCRIPTION OF DAILY TRAVEL PATTERNS Figure 5.9, which illustrates the proportion of trip legs made by bus, categorised by age and gender, shows that: On average, females make a higher proportion of their trip legs by bus (3%) compared with males (2%). This difference is minor, although it still shows that females are more likely to make a trip leg using the bus. The proportion of trip legs made by bus increases with age to a peak of around 8% among females in the age group and 7% among males in the same age group. This declines rapidly after this age group (when the legal driving age is reached) and levels off below 2% after the age group. Figure 5.9 The proportion of public transport trip legs, catego rised by age and gender. 42
43 5. Travel mode 5.4 Walking trip leg duration by age and gender Walking trip leg duration/person/day, categorised by age and gender, is presented in Table 5.3 and illustrated in Figure The surveys provide walking times but not walking distances so walking trip leg distances are not recorded in this analysis. The analysis of walking trip leg duration/person/day, categorised by age and gender, shows that: On average, females spend more time walking per day compared with males (9.2 minutes/person/day compared to 7.1 minutes/person/day). The walking trip leg duration /person/day increases with age to a peak of 17 minutes among females in the age group and 11.8 minutes among males in the age group. This trend declines after this age and then increases from the age of 50 onwards People aged (males and females) walked for the shortest amount of time per person per day compared with other adult age groups (i.e. those over the legal driving age of 16). Table 5. 3 Walking trip leg duration/person/day, categorised by age and gender. Age group Unweighted sample Walking duration/person/day size (people) (min) All people All Males All Females All
44 NATIONAL TRAVEL PROFILES PART A: DESCRIPTION OF DAILY TRAVEL PATTERNS Figure 5.9 Walking trip leg duration/person/day, categorised by age and gender. 5.5 Comparing the proportion of trip legs by modes on weekday and weekends The proportions of trip legs categorised by travel mode on weekdays and weekends are presented in Table 5.4 and illustrated in Figure The trip legs that were undertaken from midnight Friday to midnight Sunday (i.e. 0000h Saturday to 2359h Sunday) were recorded as weekend travel. The analysis of weekend trip legs/person/day, categorised by modes of transport, shows that: The proportion of trip legs made as a vehicle driver is relatively higher on weekdays compared with weekends (56% compared to 49%). On the other hand, the proportion of trip legs /person/day made as a vehicle passenger is relatively higher on the weekends compared with weekdays (36% compared to 22%). The proportion of walking, cycling and bussing trip legs are relatively higher on weekdays compared with weekends. 44
45 5. Travel mode Table 5.4 The proportion of trip legs, categorised by mode, on weekdays and weekends. Mode Weekdays Proportion of trips Weekends Walk 17% 12% Vehicle driver 56% 49% Vehicle passenger 22% 36% Bicycle 2% 1% Bus 3% 1% Taxi 0.3% 1% Other 1% 1% All modes 100% 100% Number of trip legs (unweighted) Figure 5.11 The proportion of trip legs by mode on weekdays and weekends. 45
46 NATIONAL TRAVEL PROFILES PART A: DESCRIPTION OF DAILY TRAVEL PATTERNS 5.6 Walking duration by purpose in MUAs The 85 th percentile, 15 th p ercentile and mean walking duration by purpose in MUA for all trip leg arrivals and for home-based trip leg arrivals ar e presented in Table 5.5 a nd illustrated in Figure Walking trip legs from all the trip leg arrivals include trip legs that may not be home-based, such as arrivals from work main job, social/recreation or medical/dental. Home-based wa lking trip leg durations are calcu lated using the first trip leg that the individuals make at the start of the day leaving home. Those trip legs made by people who returned home at some poi nt and then went out again have not been include d in this analysis. It is important to point out that respondents were prompted to include all walking trip legs of 100 m or more along a public road or footpath, or where a road was crosse d. In practice, it is likely that very s hort trip legs might tend to be under-reported. Trip le gs from a car park to work were eligible for the survey if they met these criteria. Interviewers were trained to probe for this information. The analysis of walking trip leg durations, categorised by purpose for home-based arrivals in MUAs, shows that: Recreational trip legs have the highest mean walking duration. On average, an individual will walk 17 mi nutes for all recreational trip leg arrivals, and 18 minutes for home-based recreational arrivals. Trip legs made to change mode have the lowest mean walking duration (8 minutes). The work (HB) category has a higher walking trip leg duration (16 min) compared with trip leg purpose by work. This is because trip leg purpose by work includes other short walking distance trip legs such as walking from the bus stop or a stop to work. This therefore reduces the mean for work walking trip leg duration. 46
47 5. Travel mode Table 5.5 Walking trip leg dura tion by purpose in MUAs. Trip leg purpose Unweighted sample size Walking trip leg duration (min) (trip legs) 15 th %ile Mean 85 th %ile Change mode Change mode (HB a ) b Work Work (HB) Shopping Shopping (HB) Accompany someone else Accompany someone else (HB) Personal business/services Personal business/services (HB) c 83 Social visits Social visits (HB) Education Education (H B) Home Recreational Recreational (HB) a HB indicates a home-based arrival. b work includes trip legs for work main job, work other job and work employer s business. c Estimates for personal business and services (HB) cannot be made because the number of trips legs sampled was less than
48 NATIONAL TRAVEL PROFILES PART A: DESCRIPTION OF DAILY TRAVEL PATTERNS Figure 5.12 Walking trip leg duration by purpose in MUAs.* * Estimates for personal business and services (HB) cannot be made because the number of trips legs sampled was less than Cycle duration by purpose in MUAs The 85 th percentile, 15 th percentile and mean cycling duration by purpose in MUAs for home and work trip leg arrivals are presented in Table 5.6. It is noted that cycling duration by other trip leg purposes apart from home and work cannot be made because the number of trip legs for those purposes was less than 120. Table 5.6 shows that, on average, a person takes about 14 minutes to cycle to work in MUAs. The mean cycling duration arriving home from all origins is about 16 minutes. Table 5.6 Cycling trip leg duration by purpose in MUAs. Trip leg purpose Unweighted sample size Duration (min) (trip legs) 15 th %ile Mean 85 th %ile Home Work* * Work includes trip legs for work main job, work other job and work employer s business. 48
49 5. Travel mode 5.8 Summary Table 5. 7 shows the proportion of trip legs by mode of travel for the whole country. Some other key conclusions include: Individuals make approximately 80% of all trip legs per person per day as vehicle drivers and vehicle passengers. Nationally, these amount to an average of 3.5 trip legs per person per day. Individuals in the age group make more trip legs as vehicle drivers per day than any other age group. The use of public transport rises steeply for males and females from 5 14 years, reaching over 7 % of all trip legs. Then males public transport usage reduces rapidly, while females continue high use of public transport until the age of Trip legs made as a vehicle driver continue to make up the highest proportion of personal trip legs among all the travel modes on both weekdays (56%) and weekends (49%). On average, females spend more time walking per day compared with males (9.2 minutes v. 7.1 minutes). On average, trip legs made for the purpose of recreation in MUAs with homebased trip leg arrivals have the highest walking duration of 18 minutes per trip leg. On average, a person takes about 14 minutes to cycle to work in a MUA. Table 5.7 National proportions of trip legs by selected mode. Mode description Trip leg proportion Walk 15.5% Vehicle driver 54.1% Vehicle passenger 25.5% Bicycle 1.4% Bus 2.4% Other* 0. 9% * The other category may include trip leg s made by trains, ferries, planes, taxis and mobility scooters, as w ell as trips which were classified as other on the survey forms (these may include travel b y boat, horse, electric wheelchairs etc.). 49
50 NATIONAL TRAVEL PROFILES PART A: DESCRIPTION OF DAILY TRAVEL PATTERNS 6. Travel purpose 6.1 Introduction Each trip leg has a trip leg purpose. The trip leg purpose definitions are described in Chapter and they are contained in the TR14 database provided from the NZHTS. The tr ip leg purposes provide details of what activity is done at a trip leg destination. This section provides details of travel purposes for all modes, excluding walking. The analysis show s the mean trip leg distance and duration, categorised by different purposes. It also shows the proportion of trip legs per person by age group, gender and purpose. The proportion of trip legs, defined by purpose, on weekdays and weekends are also illustrated in this chapter. 6.2 Trip legs and total distance/person/day by purpose The number of trip legs and total distance travelled per person per day by trip purpose are shown in Table 6.1. Only trip legs made by vehicle drivers, vehicle passengers, bicycle, bus and taxi are considered when considering distance. This analysis shows that: Using the trip leg definitions provided, the proportion of trip legs/pe rson/day to home is the most prevalent (35%). Trip legs made for work main job or shopping are the second and third most prevalent personal travel trip legs, accounting for 15% and 14%, respectively, of the trip legs made per day. On average, an individual travels 11.7 kilometres per day to home, which accounts for 37% of his/her total distance trav elled per day. On the other hand, travel for work main job and recreation account for the second and the third highest proportions of daily distance, at 16% and 14%, respectively. Table 6.1 Number of trip legs and distance/person/day, categorised by trip purpose*. Purpose Trip legs/person/day Trip legs/person/day (%) 50 Kilometres/ person/day Kilometres/ person/day (%) Home % % Work main job % % Work other job % % Work employer s business 0.1 2% 1.0 3% Education 0.2 4% 0.8 2% Shopping % % Personal business/services % 0.0 0% Medical/dental 0.2 6% 1.6 5% Social visits % 0.2 1% Recreational % % Change mode 0.2 6% 2.6 8% Accompany someone else 0.2 5% 0.8 3% Total 3 100% % * Unweighted sample size (people) =
51 6. Travel purpose 6.3 Mean distance and time by purpose The mean trip leg distance and trip leg time, categorised by trip leg purpose, are shown in Table 6.2, and illustrated in Figures 6.1 and 6.2. The analysis of the mean trip leg distance and trip leg time, categorised by trip leg purpose, shows that: Work employer s business has the highest trip leg distance (10.7 km), followed by recreation (10.5 km) and social visits (9.8 km). Recreational trip legs have the highest mean trip leg time (19.9 minutes), followed by work employer s business (19.2 minutes) and social visits (16.4 minutes). Table 6.2 Mean trip leg distances and trip leg time, categorised by trip leg purpose. Trip leg purpose Mean trip leg distance (km) Mean trip leg time (min) Home Work main job Work other job Work employer s business Education Shopping Personal business/services Medical/dental Social visits Recreational Change mode Accompany someone else All purposes Figure 6.1 Mean trip leg distance, categorised by trip leg purpose. 51
52 NATIONAL TRAVEL PROFILES PART A: DESCRIPTION OF DAILY TRAVEL PATTERNS Figure 6.2 Mean trip leg duration, categorised by trip leg purpose.. 52
53 6. Travel purpose 6.4 Proportion of trip legs/person/day by age, gender and purpose The proportions of trip legs/person/day, categorised by age, gender and trip leg purpose, are shown in Tables Analysing these stat istics s hows the followin g: Overall, males make slightly more t rip legs than female s (4.4 trip legs/person/day v. 4.3). On average, males make 0. 4 and more tr ip legs/perso n /day for the purposes of wo rk m ain job or w ork employ er s busi ness, although females make 0.1 more shopping trip legs /person/day than males. Trip legs made to accompany someone else make up the highest proportion of trip legs for those in the 0 4 age group, accounting for 43% of all trip legs. Education was the second most frequent trip leg purpose for those in the age group, with a proportion of 16%. The relative importance of work main job trip legs increases with age. Among people age d 50 64, 20% of tri p legs are for the purpose of work main job. The proportion of shopping trip legs also increases with age. Shopping trip legs account for t he sec ond highest propor tion of trip legs for those in the 65+ age g roup. Table 6.3 Proportions of trip legs/person/day, categoris ed by age and tr ip leg purpose for all people*. All trip legs Trip leg Age bracket (trip legs/ purpose All ages person/day) Home 35% 34% 35% 32% 29% 31% 31% 30% 30% 35% 31% 1.4 Work main job 0% 0.1% 1% 6% 15% 17% 18% 20% 20% 4% 13% 0.6 Work other job 0% 0.1% 0% 1% 1% 0% 0% 1% 1% 0% 0% 0.02 Work employer s 0% 0% 0% 1% 4% 2% 3% 3% 3% 0% 2% 0.1 business Education 4% 17% 16% 12% 5% 2% 1% 1% 1% 0% 4% 0.2 Shopping Personal business/services Medical/dental Social visits Recreational Change mode Accompany someone else 2% 4% 6% 11% 11% 13% 14% 13% 14% 20% 12% 0.5 1% 1% 2% 3% 4% 5% 6% 6% 7% 9% 5% 0.2 1% 0% 0% 1% 0% 1% 1% 1% 1% 2% 1% % 10% 10% 14% 14% 12% 10% 9% 10% 13% 11% 0.5 4% 7% 9% 6% 4% 5% 5% 5% 6% 8% 6% 0.2 1% 4% 6% 7% 7% 6% 4% 4% 4% 4% 4% % 22% 14% 6% 6% 7% 8% 8% 4% 4% 10% 0.4 Total 100% 100% 100% 100% 100% 100% 100% 100% 100% 100% 100% 4.4 Unweighted sample size (people) * Where the number of trip legs in the sam ple was less t han 120, the accuracy of the estimates m ay be unrel iable. 53
54 NATIONAL TRAVEL PROFILES PART A: DESCRIPTION OF DAILY TRAVEL PATTERNS Table 6.4 Proportions of trip legs/person/day, as categorised by age and trip leg purpose for males*. Trip leg purpose Home Work main job Work other job Work employer s business Education Shopping Personal business/services Medical/dental Social visits Recreational Change mode Accompany someone else Age bracket Total 100% 100% 100% 100% 100% 100% 100% 100% 100% 100% 100% 4.4 Unweighted sample size (people) * Where the number of trip legs in the sample was less than 120, the accuracy of the estimates may be unreliable. All Ages All trips (trip legs/ person/day) 35% 35% 35% 33% 28% 29% 30% 29% 30% 36% 31% 1.4 0% 0% 2% 7% 19% 23% 25% 27% 25% 5% 17% 0.8 0% 0% 0% 0% 0% 0% 1% 1% 1% 0% 0% % 0% 0% 1% 7% 2% 5% 4% 4% 1% 3% 0.1 4% 16% 16% 13% 3% 3% 1% 0% 0% 0% 4% 0.2 2% 3% 6% 9% 10% 10% 12% 10% 12% 18% 10% 0.5 1% 1% 2% 3% 4% 4% 5% 5% 7% 10% 5% 0.2 0% 0% 0% 0% 0% 0% 0% 0% 1% 2% 1% % 10% 10% 15% 14% 12% 8% 8% 8% 11% 10% 0.4 4% 7% 9% 6% 5% 5% 5% 5% 5% 8% 6% 0.3 1% 5% 5% 7% 5% 5% 4% 4% 4% 3% 4% % 22% 15% 5% 5% 7% 5% 6% 4% 4% 8% 0.4 Table 6.5 Proportions of trip legs/person/day, as categorised by age and trip leg purpose for females*. Trip Leg Purpose Home Work main job Work other job Work employers business Education Shopping Personal business/services Medical/dental Social visits Recreational Change mode Accompany someone else All Ages All trips (trip legs/ person/day) 34% 34% 34% 33% 29% 32% 32% 31% 31% 33% 32% 1.4 0% 0% 1% 7% 11% 12% 11% 13% 14% 2% 9% 0.4 0% 0% 0% 0% 1% 0% 0% 1% 1% 0% 0% % 0% 0% 1% 0% 2% 2% 2% 2% 0% 1% % 17% 16% 13% 7% 1% 2% 1% 1% 0% 4% 0.2 2% 4% 7% 9% 13% 16% 15% 16% 18% 22% 14% 0.6 0% 1% 2% 3% 4% 5% 7% 7% 8% 9% 6% 0.2 1% 0% 0% 0% 1% 1% 1% 1% 1% 2% 1% % 9% 10% 15% 15% 13% 11% 10% 12% 15% 12% 0.5 4% 7% 9% 6% 3% 5% 5% 6% 6% 7% 6% 0.2 1% 3% 7% 7% 10% 6% 4% 4% 4% 5% 5% % 23% 13% 5% 6% 7% 11% 10% 5% 5% 11% 0.5 Total 100% 100% 100% 100% 100% 100% 100% 100% 100% 100% 100% 4.3 Unweighted sample size (people) * Where the number of trip legs in the sample was less than 120, the accuracy of the estimates may be unreliable. 54
55 6. Travel purpose The proportions of trip legs/person/day categorised by different work purposes are illustrated in Figure 6.3. The figure shows that: On average, males make a higher proportion of work main job and work employer s business trip legs than females, showing proportions of 17% and 3%, compared with females (9% and 1%, respectively). The proportion of trip legs made for the purpose of work main job increases with age to a peak of 27% among males in the age group and 14% among females in the age group. The peaks then decline rapidly in line with the increase of those going into retirement beyond 64 years. Figure 6.3 purposes. The proportion of trip legs/person/day, categorised by different work 55
56 NATIONAL TRAVEL PROFILES PART A: DESCRIPTION OF DAILY TRAVEL PATTERNS The proportions of trip legs/person/day made for the purpose of shopping are illustrated in Figure 6.4. The analysis of the proportion of trip legs/person/day made for the purpose of shopping shows that: On average, females have higher shopping trip leg proportions compared with males (14% compared to 10%). The shopping trip leg proportion increases with age to a peak of 18% among males in the 65+ age group and 22% among females in the same age group. Figure 6.4 The proportion of shopping trip legs/person/day, categorised by gender. 56
57 6. Travel purpose The proportions of social visit trip legs/person/day are illustrated in Figure 6.5. The analysis of the proportion of social visit trip legs/person/day shows that: On average, females have a higher proportion of social visit trip legs compared with males (12% compared to 10%). The proportion of the number of trip legs for a social visit increases with age to a peak of 16% among males and females in the and age groups. Both curves follow a similar pattern after the peaks, with the proportion of trip legs for both females and males declining, reaching minimum points of 10% and 8% in the age group. Figure 6.5 The proportion of social visit trip legs/person/day, categorised by gender. 57
58 NATIONAL TRAVEL PROFILES PART A: DESCRIPTION OF DAILY TRAVEL PATTERNS The proportions of trip legs/person/day to accompany someone else are illustrated in Figure 6.6. This analysis shows that: On average, females make 2 % more trip legs to accompany someone else than males. The trip leg proportion for trip legs made for the purpose of accompany[ing] someone else for females declines rapidly with age but increases again to a peak of 12% in the age group. The males trip leg proportion curve follows a similar trend as the females from the 0 4 to age groups before levelling off below 6%. Figure 6.6 The proportion of accompany someone else trip legs/person/day, categorised by gender. 58
59 6. Travel purpose The proportions of recreational trip legs /person/day are illustrated in Figure 6.7. Analysis of this figure shows that: On average, both males and females make the same proportion of recreational trip legs, showing a 6% mean. The recreational trip proportions for both males and females increase with age to a peak of 9% and 10%, respectively, in the age group. The peaks decline rapidly, reaching minimum points of 5% in the age group for males and 4% in the age group for females. Recreational trip legs are significant in the 65+ age group for both genders, achieving the fifth highest trip proportion of all trip purposes. Figure 6.7 The proportion of recreational trip legs/person/day, categorised by gender. 59
60 NATIONAL TRAVEL PROFILES PART A: DESCRIPTION OF DAILY TRAVEL PATTERNS 6.5 Trip legs by purpose and day of the week Proportion of weekday and weekend trip legs by selected purposes The proportions of trip legs categorised by selected purposes on a weekday and weekend are presented in Table 6.6 and illustrated in Figure 6.8. The analysis of the proportion of trip legs, categorised by selected purposes, shows that: Trip legs made for the purposes of work main job or shopping, or to accompany someone else account for the second, third and fourth highest trip leg proportions on an average weekday. The trip legs made during the week that make up the highest proportion are those made for the purpose of going home (over 30%). Social visits trip legs are the second most prevalent trip legs on the weekend, accounting for 17% of all the trip legs in the weekend. Shopping trip legs and trip legs made to accompany someone else have the third and the fourth highest trip leg proportions during the weekend, respectively. The trip leg proportion for work main job trip legs is substantially higher on a weekday compared with those for the same purpose on the weekend, showing a difference of 11%. The trip leg proportions of shopping and social visits are (16% less 11%) 5% and (17% less 9%) 8% higher during the weekend than on a weekday. Table 6.6 weekends. The proportion of trip legs, categorised by trip leg purpose, on weekdays and Description Trip leg proportion (weekday) Trip leg proportion (weekend) Home 31% 34% Work main job 16% 5% Work other job 1% 0.3% Work employer s business 3% 1% Education 5% 1% Shopping 11% 16% Personal business/services 5% 5% Medical/dental 1% 0.2% Social visits 9% 17% Recreational 5% 9% Change mode 5% 2% Accompany someone else 9% 10% Total 100% 100% Total number of trip legs (unweighted)
61 6. Travel purpose Figure 6.8 weekends. The proportion of trip legs, categorised by trip leg purpose on weekdays and Trip leg duration by purpose weekdays and weekends The mean trip leg durations, defined by different purposes on weekdays and weekends, are presented in Table 6.7 and illustrated in Figure 6.9. Points to be noted in the figure and table include: On average, trip legs for work - employer s business trip legs have a relatively higher duration (19%) compared with other trip leg purposes on a weekday. On the weekend, r ecreational purposes have the highest trip leg duration (22 minutes) compared with trip legs made for other purposes. The highest increase in proportion from weekday to weekend mean trip leg duration was seen in trips made to accompany someone else an increase of four minutes. Th e highest drop in proportion from weekday to weekend mean duration (two minutes) was seen in work employer s business trip legs: 19 minutes during the week; 17 minutes at the weekend. 61
62 NATIONAL TRAVEL PROFILES PART A: DESCRIPTION OF DAILY TRAVEL PATTERNS Table 6.7 Mean trip leg duration and trip leg sample size, categorised by trip leg purpose, on weekdays and weekends. Description Unweighted weekday trip legs Average trip leg duration (min) Unweighted weekend trip legs Average trip leg duration (min) Home Work main job Work other job Work employer s business Education Shopping Personal business/services Medical/dental* Social visits Recreational Change mode Accompany someone else Totals and averages * Estimates for medical/dental weekend trip leg duration cannot be made because the number of trips legs sampled was less than 120. Figure 6.9 weekends. Mean trip leg duration, categorised by trip leg purpose, on weekdays and 62
63 6. Travel purpose 6.6 Summary After trip legs to home, trip legs to work main job make up the second highest proportion of personal trip legs among all the selected trip purposes. Work main job and shopping trip legs have the second and the third highest trip proportions per person for all age groups. Work employer s business has the highest mean trip leg distance (10.7 km). Recreational trip legs have the highest mean trip leg time (19.9 minutes). Overall, males make more trip legs per person than females, and males make more work-related trip legs than females. Trip legs for the purpose of work main job and shopping, and to accompany som eone else accounted for the second, third and fourth highest trip proportions on a weekday. Recreational trip leg duration is relatively higher compared to other trip legs on both weekdays and weekends. 63
64 NATIONAL TRAVEL PROFILES PART A: DESCRIPTION OF DAILY TRAVEL PATTERNS 7. Travel by trip leg purpose and travel mode 7.1 Introduction This chapter details individuals travel, categorised by trip leg purpose and the mode of travel. It includes tables of trip legs/person/day and the distance travelled per person per day, both categorised by purpose and mode. A figure showing the proportion of trip legs, categorised by purpose and mode, is also included in this chapter. 7.2 Trip legs/person/day by purpose and mode The number of unweighted trip legs and trip legs/person/day, categorised by purpose and mode, is shown in Tables 7.1 and 7.2, respectively. From these tables, the following points can be noted: Individual s travel more trip legs as vehicle drivers for nearly all trip leg purposes apart from education, and to change mo de and accompany someone else. Individuals travel more trip legs by walking compared with other mod es to change mode. Individuals travel more trip le gs as vehi cle passengers for educ ation and to accompany someone else. Table 7.2 The mean number of trip legs/person/day by mode, categorised by trip leg purpose. Purpose Walk Vehicle driver Vehicle passenger Mode Bicycle Bus Taxi Other Total Home Work main job Work other job Work employer s business Education Shopping Personal business/services Medical/dental Social visits Recreational Change mode Accompany someone else Totals
65 7. Travel by trip leg purpose and travel mode 7.3 Distance travelled/person/day by purpose and mode The distances travelled per person per day, categorised by trip leg purpose and mode of transport, are shown in Table 7.3 as mean distances in kilometres. Analysis of the data displayed in this table shows that: Individuals travel greater trip leg distances as vehicle drivers for most trip leg purposes. Only work other job, education and medical/dental purposes, and to change mode and accompany someone else have mean travel distances less than 1 kilometre. Individuals travel greater trip leg distances as vehicle passengers for shopping, social visits and recreational purposes, and to accompany someone else. Individuals travel the greatest trip leg distances by bus to change mode. Table 7.3 Mean distance travelled/person/day (in kilometres), categorised by trip leg purpose and mode of transport. Purpose Vehicle driver Vehicle passenger Mode Bicycle Bus Taxi Total Home Work main job Work other job Work employer s business Education Shopping Personal business/services Medical/dental Social visits Recreational Change mode Accompany someone else
66 NATIONAL TRAVEL PROFILES PART A: DESCRIPTION OF DAILY TRAVEL PATTERNS 7.4 Trip leg proportion by purpose and mode Trip leg proportions, categorised by trip leg purpose and mode of transport, are presented in Table 7.4 and illustrated in Figure Looking at the figure and the table, we c an see the follow ing: Trip legs made as a vehicle driver make up the highest proportion of trip legs travelled for wo rking pur poses. Sh opping, personal business/se rvices, social visit and medical/dental trip purposes show a similar pattern. Trip legs made as a vehicle passenger m ake up the highest proport ion of trip legs made for education and to accompany someone else, with proportions of 39% and 54%, respectively. Walking is the dominant mode of transport for trip legs made to change mode (42% of all change mo de trip legs). Buses were the most frequently used mode of public transport, being the fourth highest mode for education and the second highest for chang e mode trip le gs. 66

67 7. Travel by trip leg purpose and travel mode Table 7.4 Trip leg proportions categorised by trip leg purpose and mode of transport*. Purpose Walk Vehicle driver Vehicle passenger Mode Bicycle Bus Taxi Other Total Home 14% 56% 27% 2% 1% 1% 0.3% 100% Work main job 11% 78% 7% 2% 1% 0.2% 0.5% 100% Work other job 9% 77% 10% 2% 0.2% 1% 0..4% 100% Work employer s business 6% 87% 5% 1% 0.2% 0.5% 1% 100% Education 30% 15% 39% 3% 12% 0.5% 0.5% 100% Shopping 16% 61% 22% 1% 1% 0.2% 0.2% 100% Personal business/services 14% 69% 15% 1% 1% 0.05% 0.03% 100% Medical/dental 11% 62% 25% 1% 0.4% 1% 1% 100% Social visits 15% 49% 33% 1% 1% 1% 1% 100% Recreational 27% 38% 30% 3% 1% 0.3% 1% 100% Change mode 42% 17% 9% 1% 22% 0.5% 8% 100% Accompany someone 7% 38% 54% 0.3% 0.3% 0.1% 1% 100% else * Where the number of unweighted trip legs in the sample was less than 120, the accuracy of the estimates may be unreliable. Figure 7.1 Trip leg proportions, categorised by trip leg purpose and mode of transport. 67
68 NATIONAL TRAVEL PROFILES PART A: DESCRIPTION OF DAILY TRAVEL PATTERNS 7.5 Summary This chapter has considered how New Zealanders travel, by trip leg purpose and mode of transport. Highlights from this section include: Individuals travel more trip legs and trip leg distance as vehicle drivers for nearly all purposes apart from education, and to change mode and to accompany someone else. For all working purposes, trip legs made as a vehicle driver (56%) make up the highest proportion. Shopping, personal business/services, social visits and medical/dental trip legs purposes show a similar pattern. The purposes which have the highest proportion of trips made as a vehicle passenger are education (39%), social visits (33%) and recreation (30%). The purposes that showed the highest proportion of individuals walking were education (30%), followed by shopping (16%). The purposes that showed the highest proportion of bus use were change mode (22%) and education (12%). Recreation and education show the greatest proportion of bicycle use (3% each), followed by work trips (2%). Taxis are a minor contributor for trips to work (1%), and for medical/dental (1%) and social (1%) purposes. 68
69 8. Social inclusion and accessibility 8. Social inclusion and accessibility 8.1 Introduction This chapter provides information regarding how vehicle availability and different income categories affected households and individuals travel profiles, and includes tables and figures showing: variations in travel time, distance and trip legs according to car availability; variations in travel time, distance and trip legs according to the number of people in a household; and variations in travel mode and distance according to personal income bracket. 8.2 Variation in travel by household car availability Table 8.1 and Figure 8.1 show how travel patterns differ according to household car availability. Trip legs, distance and time per household per day are indexed to show the relative difference of variations in household car availability. For this index, a reading of 100 indicates the average, which is equivalent to 15 trips per household, 121 km per household and 227 minutes per household. Analysing the variations in travel categorised by household car availability shows that: Hou seholds with more than three cars generate more trip legs than households with one car or no cars. On average, households with more than three cars also travelled greater distances and spent more time travelling than those with one or no cars. Table 8.1 Variations in travel by household car availability. Number of cars in household Unweighted sample size (households) Trips/ household/ day Distance/ household/ day (km) Travel time/ household/ day (min) No Car Car Cars Cars Totals and means * 121* 227* * These values were used to calculate the 100 index for Figure
 8.")
70 NATIONAL TRAVEL PROFILES PART A: DESCRIPTION OF DAILY TRAVEL PATTERNS Figure 8.1 Mean variations in travel categorised by household car availability. * Index 100 = 15 trip legs/household = 121 km/household = 227minutes/household (as set out in Table 8.2) 8.3 Variation in travel by household size Variation in travel behaviour, categorised by number of people in a household, is shown in Table 8.2. Trip legs, distance and time travelled per household per day are illustrated in Figure 8.2, Figure 8.3 and Figure 8.4, respectively. The table shows that: Trip legs per household per day and travel time per household per day increase with the number of people in a household. The number of trip legs (6), the distance (50 km) and travel time (90 minutes) per person per day in a household is pretty much constant until the household size reaches 6+ people. Households with five people travel the greatest distance: 244 km per day. Trip legs and distances travelled increase rapidly with the number of people in a household. Table 8.2 Variations in travel by number of people in a household. No. of people in household Unweighted sample size (households) Trip legs/ household/ day 70 Distance/ household/day (km) Travel time/ household/day (min) All
71 8. Social inclusion and accessibility + Figure 8.2 household. Trip legs per household per day, categorised by number of people in the Figure 8.3 household. Distance per household per day, categorised by number of people in the 71
72 NATIONAL TRAVEL PROFILES PART A: DESCRIPTION OF DAILY TRAVEL PATTERNS Figure 8.4 household. Travel time per household per day, categorised by number of people in a 8.4 Trip legs/person/day by mode and personal income This section considers the influence of personal income on travel patterns. Table 8.3 shows the (unweighted) number of trip legs/person/day, while the mean distances travelled per person per day are shown in Table 8.4. Trip legs/person/day according to personal income are presented in graph form as follows: Figure 8.5 shows all modes combined, Figure 8.6 shows vehicle trip legs (driver and passenger), Figure 8.7 shows walking trip legs, Figure 8.8 shows cycling trip legs, and Figure 8.9 shows bus trip legs. The incomes are those provided by the individuals surveyed. Total household incomes have not been derived in this analysis. Given that only ages 16+ were asked their personal income, the analysis is based on ages 16+ only. The analysis of the numbers of trip legs/person/day, categorised by mode of travel and personal income bracket, shows that: The numbers of trip legs/person/day increase slightly with personal income. (Figure 8.5). The number of trip legs/person/day made as vehicle drivers increase with increasing personal income. The number of trip legs made as vehicle passenger decrease as personal income rises (Figure 8.6). 72
73 8. Social inclusion and accessibility Individuals who have a personal income under $10,000 make more walking trip legs per day than those in the other personal income ranges. The number of walking trip legs made per person decreases after the under $10,000 category and reach the minimum point of 0.55 trip legs per person in the $20,001 $30,000 personal income bracket (Figure 8.7). On the other hand, those who earn $20,001 $30,000 per annum make the highest amount of cycling trip legs (0.08) per day (Figure 8.8). Individuals earning under $10,000 make more trip legs by bus than those in other personal income brackets. The minimum number of bus trip legs/person/day occurs within the $15,001 $20,000 personal income bracket. Table 8.3 Mean number of trip legs/person/day, categorised by travel mode and personal income bracket. Income bracket Walk Vehicle driver Vehicle passenger Trip legs/person/day Mode Bicycle Bus Taxi Other All modes (total) Unweighted sample size (people) No income Under $10, $10,001 $15, $15, 001 $20, $20,001 $30, $30,001 $40, $40,001 $50, $50,001 $70, $70, 001 $ 100, $100,
74 NATIONAL TRAVEL PROFILES PART A: DESCRIPTION OF DAILY TRAVEL PATTERNS Figure 8. 5 Mean num ber of trip legs/ person/d ay, categorise d by personal income bracket. Figure 8.6 Mean number of vehicle driver and passenger trip legs/person/day, categorised by personal income bracket. 74
75 8. Social inclusion and accessibility Figure 8.7 Mean number of walking trip legs/person/day, categorised by personal income bracket. Figure 8.8 bracket. Mean number of cycling trip legs/person/day, categorised by personal income 75
76 NATIONAL TRAVEL PROFILES PART A: DESCRIPTION OF DAILY TRAVEL PATTERNS Figure 8.9 bracket. Mean number of bus trip legs/person/day, categorised by personal income 8.5 Distance travelled by mode and personal income The distances travelled per person per day, categorised by travel mode and personal income bracket, are shown in Table 8.4. The analysis of the distance travelled per person per day, categorised by mode of transport and personal income bracket shows that: Generally, the distance travelled per person per day increases with personal income. Considering all modes of travel, on average, individuals who earn more than $100,000 per annum travel twice the distance compared with those who fall into the $10,001 $15,000 personal income bracket. For vehicle drivers, on average, individuals who earn more than $100,000 per annum travel almost four times the distance compared with those who fall into the under $10,000 personal income bracket. Individuals who earn $70,001 $100,000 per day cycle more distance than those in other personal income brackets, travelling, on average, 0.8 km per day. Individuals who earn less than $10,000 per annum travel more distance by bus than those in the other personal income brackets, travelling 3.8 km per day. 76
77 8. Social inclusion and accessibility Table 8.4 Mean distance travelled/person/day, categorised by mode of transport. Income bracket Vehicle driver Vehicle passenger Trip legs/person/day Mode All Bicycle Bus Taxi modes (total) Unweighted sample size (people) No income Under $10,000 $10,001 $15,000 $15,001 $20,000 $20,001 $30,000 $30,001 $40,000 $40,001 $50,000 $50,001 $70,000 $70,001 $100, $100, Summary Trip legs, distance and time travelled per day per household increase with car availability. Trip legs and travel time per household per day increase with the number of people in a household. Households with five people travel the greatest distance: 244 km per day. Generally, the number of trip legs made and the distance travelled per person per day also increase with personal income. Individuals who fall into the no income category made fewer trip legs than those with other personal income ranges. The number of trip legs made per person as a vehicle driver increased relative to personal income level. On the other hand, the number of trip legs made per person as a vehicle passenger decreased with rising personal income. 77
78 NATIONAL TRAVEL PROFILES PART A: DESCRIPTION OF DAILY TRAVEL PATTERNS 9. Travel by time of day 9.1 Introduction This chapter provides informa tion on personal travel patterns categorised by time of day, day of the week and travel purpose. The tables and figure s show the total trip legs for all modes together. 9.2 Proportion of home-based daily departur es by purpose and time of day The proportions of home-based daily trip leg departu res (i.e. the time that individuals first leave home at the star t of a day), categorised by selected purposes and the time of day, are illu strated in Figures 9. 1 to Table 9. 1 shows the m orning and evening peak departure times from home for different purpose s on weekdays and weeke nds. These proportions of d aily flow sh own in the graph s are rep orted for the end of the hour shown (e.g. all trip legs made from 1301h to 1400h would be classified as 14 ). The estimates in this chapter have not been made where the total number of unweighted trip legs, categorised by purpose, are less than 120. The total number of unweighted trip legs for all modes together are categorised by trip leg purposes and day of the week, and are given in detail in Appendix D. Figure 9.1 Departure time from home for work (main job and other job) as a proportion of daily flow on weekdays and weekends. 78
79 9. Travel by time of day Figure 9. 2 Departure time from home for education as a proportion of daily flow on weekdays. Note: Estimates for weekend education cannot be made because the total number of trip legs samples was less than 120 (see Appendix D). Figure 9.3 Departure times from home for shopping trips as a proportion of daily flow on weekdays and weekends. 79
80 NATIONAL TRAVEL PROFILES PART A: DESCRIPTION OF DAILY TRAVEL PATTERNS Figure 9.4 Departure time from home for personal business/services trip legs as a proportion of daily flow on weekdays on weekends. Figure 9.5 Departure time from home for medical/dental trip legs as a proportion of daily flow on weekdays. Note: Estimates for weekend medical/dental trip legs are not included because the total number samples was less than 120 (see Appendix D). 80
81 9. Travel by time of day Figure 9.6 Departure time from home for social visits as a proportion of daily flow for weekends and weekdays. Figure 9.7 Departure time from home for recreation as a proportion of daily flow for weekends and weekdays. 81

82 NATIONAL TRAVEL PROFILES PART A: DESCRIPTION OF DAILY TRAVEL PATTERNS Figure 9.8 Departure times from home to change mode as a proportion of daily flow on weekdays and weekends. Table 9.1 Morning and evening peak times for leaving home for different purposes on weekdays and weekends. Trip purpose a.m. peak period a.m. peak % Weekday p.m. peak period p.m. peak % a.m. peak period a.m. peak % Weekend p.m. peak period p.m. peak % Work a % % % % b Education % % Shopping % % % % Personal business/services % % % % Medical/dental % % Social visits % % % % Recreational % % % % Change mode % % % % Notes: a Work trip leg purposes includes work main job and work other job. b Estimates could not be made in categories where the number of trip legs sampled was less than 120. In summary, these home-based departures reflect the four major home-based departures in the weekdays and weekends. These occur on the weekday at approximately hourly intervals between 0800h and 1100h. The patterns relate to trips on weekdays to: work (with a peak up to 0800h), education (with a peak up to 0900h), personal business/services (with a peak up to 1000h), and shopping (with a peak up to 1100h). 82
83 9. Travel by time of day 9. 3 Proportion of daily arrivals purpose and time of day The p roportions of daily trip leg arrivals, categorised by selected purpose and time of day, are illustrated in Figures 9.9 to The daily morning and evening peaks and proportions for the selected purposes are summarised in Table 9.2. In these figures, the propo rtions are reported for the end of the hour shown (e.g. all times from 0801h to 0900h are classed as 9 ). The analysis looks at when individuals arrive after setting out from home, considering all modes and purposes (home-based arrivals). It is important to point out that estimates in this section cannot be made where the number of unweighted trip legs, categorised by trip leg purpose, are less than 120. The total number of unweighted trip legs, categorised by trip leg purposes and day of the week for all modes, are shown in detail in Appendix D. In general, compared with arrivals and departures that are home-based or for education, the other trip leg purposes are spread more evenly throughout the day, resulting in typical peak hours varying between 10% and 18% for different trip purposes. Table 9.2 Morning and evening peak arrival times on weekdays and weekends, categorised by purpose. Trip leg purpose* a.m. peak period Weekday a.m. peak % Home % p.m. peak period 14 15; p.m. peak % p.m. peak period p.m. peak % Weekend p.m. peak period p.m. peak % 15% % % Work main job % % % % Work other job % % % % Work 06 07; employer s % % business 12% % Education % % % % Shopping % % % % Personal business/ % % % % services Medical/ dental % % Social visits % % % % Recreational % % % % Change mode % % % % * Estimates could not be made in categories where the number of trip legs surveyed was less than


84 NATIONAL TRAVEL PROFILES PART A: DESCRIPTION OF DAILY TRAVEL PATTERNS Figure 9.9 Proportion of daily trip leg arrivals at home from all origins by time of day. Figure 9.10 Proportion of daily trip leg arrivals at work main job by time of day. 84


85 9. Travel by time of day Figure 9.11 Proportions of daily trip leg arrivals at work other job by time of day. Figure 9.12 Proportions of daily trip leg arrivals at work employer s business by time of day. 85

86 NATIONAL TRAVEL PROFILES PART A: DESCRIPTION OF DAILY TRAVEL PATTERNS Figure 9.13 Proportions of daily trip leg arrivals for education by time of day. Figure 9.14 Proportions of daily trip leg arrivals for shopping by time of day. 86


87 9. Travel by time of day Figure 9.15 Proportions of daily trip leg arrivals for personal business/services by time of day. Figure 9.16 Proportions of daily arrivals for medical/dental trip legs by time of day*. * Estimates for weekend medical/dental trip legs cannot be made because the total number of trip legs sampled was less than 120 (see Appendix D). 87


88 NATIONAL TRAVEL PROFILES PART A: DESCRIPTION OF DAILY TRAVEL PATTERNS Figure 9.17 Proportions of daily trip leg arrivals for social visits by time of day. Figure 9.18 Proportions of daily arrivals for recreational trip legs by time of day. 88

89 9. Travel by time of day Figure 9.19 Proportions of daily trip leg arrivals to change mode by time of day. 9.4 Proportion of weekday and weekend arrivals for all purposes by time of day in MUAs The proportion of total weekday and weekend trip leg arrivals using motorised modes by time of day for all purposes and for all destinations in MUAs is illustrated in Figure The graph reflects traffic patterns occurring throughout a typical weekday and weekend. The numbers of unweighted weekday and weekend trip leg arrivals using motorised modes, by time of the day, are given in Appendix D. The unweighted samples on weekdays (37 983) and weekends (15 711) are large. The introduction of the weekend surveys is an important development of the NZHTS questionnaire design compared with previous surveys. The analysis of the proportions of total weekday and weekend trip leg arrivals, categorised by time of day in MUAs, shows that: Three peak hours are typical: the morning peak (approximately 0800h) is highest. The first afternoon peak occurs at approximately 1500h and the second afternoon peak occurs at approximately 1700h. The weekend peaks are not quite as great as the weekday peaks, and the highest occur at 1100h and 1200h. 89
, which might be used for design and policy formulation, are illustrated in Figures 9.1 to 9.20.")
90 NATIONAL TRAVEL PROFILES PART A: DESCRIPTION OF DAILY TRAVEL PATTERNS Figure 9.20 Total weekday and weekend arrival timess for motorised modes of transport as a proportion of daily flow. 9.5 Summary This chapter has brought together all the modes and sorted them by purpose, by departure time and arrival time. The typical daily variations and peak hours (and the offpeaks), which might be used for design and policy formulation, are illustrated in Figures 9.1 to Departures from home are analysed in Section 9.2, and the graphs and tables illustrate how they are distributed for the defined trip leg purposes according to time of day. Both the typical weekday and weekend are included on all the graphs. The departures from home in the 0800h 0900 hperiod are, of course, dominated by the trip legs to work and the trip legs to education providers (school or university). However, a range of shopping, recreation, social and other trip legs are also undertaken on an ongoing basis throughout the day. The unweighted number of trip legs surveyed that were used to derive these graphs are set out in Appendix D. The analysis of departures has not included non-home based trips i.e. all these graphs have trip legs starting from home. The data used in this analysis includes the travel surveyed in all three area types (MUAs, SUAs and RAs). In Section 9.3, the arrival patterns at the destinations are analysed. This covers all trip leg purposes, including those from home to other destinations, along with the arrivals at an activity from all other origins. Again, the unweighted trip legs contributing to these graphs and tables are included in Appendix D. 90
91 9. Travel by time of day Shopping, personal business/services, medical/dental, social and recreation trips tend to peak between 1100h and 1200h, and again at 1600h. However, recreation also has another peak after work between 1700h and 1800h. This information gives a clear indication as to the times when more detailed traffic surveys, and pedestrian and vehicle counts might be undertaken to study these trip leg purposes. To give an understanding of overall daily travel patterns, an analysis of the movement in the MUAs alone is provided in Section 9.4. The analysis considers arrivals using motorised transport for all trip purposes at all destinations for typical weekdays and at weekends (Figure 9.20). On weekdays, two arrival times dominate: h and also h. These each represent 11 % of all trip legs by all modes during the day. In the weekend, a slightly lower peak of 10% between 1100h and 1200h is typical, with the afternoon maintaining a steady 9% through to 1600h before it declines. 91
92 NATIONAL TRAVEL PROFILES PART A: DESCRIPTION OF DAILY TRAVEL PATTERNS 10. Summary and recommendations 10.1 Summary This report was commissioned as part of a National Travel Profile research project to analyse and make a Description of Daily Travel Patterns from the continuing NZHTS 2003 to It was designed to provide a summarised description of New Zealand travel profiles on a national basis. It originated from a desire to provide a readily available information source which was convenient to researchers and transportation planners. It also provides an initial step toward later research as a basis for further analysis of the NZHTS data to describe trends and travel variables suited to the future prediction of travel. It is presented through tables, graphs and diagrams in a concise form to meet the information needs of a wide range of persons and institutions who are involved in transportation policy and planning issues. The range of tables and graphs included cover comparisons of: personal travel, travel mode, travel purpose, social inclusion and accessibility, and travel by time of day. The data has been sorted according to MUAs, SUAs and RAs. The trip purposes, mode definitions and local government population groupings used here are those defined in the Ministry of Transport s NZHTS. The dataset used here has not provided a basis for assessing trend analysis, or regional or more detailed comparison of urban settlements of different sizes. Such trends and inter-regional comparisons will, however, be capable of analysis when the fourth year (2007) of NZHTS surveys are included in the continuing dataset. This report meets the research objectives of describing, on a national basis, the daily travel profile derived from the NZHTS. 92
93 10. Summary and recommendations 10.2 Some ongoing matters During this research, several issues emerged, some of which require further intensive investigation as research projects. This way, greater use could be made of the NZHTS datasets in the future. Other matters would also benefit from further analysis of the existing datasets. These would integrate the current research with a range of other related research projects. Three aspects warranting more analysis and research, and which also receive priority in the recommendations which follow, are: As already mentioned, this present project and report is limited by not having a five-year dataset. When the 2007 NZHTS surveys are added, this will enable regional and city-based analyses and comparisons of travel trends over the five year period to be undertaken. The present three groupings (MUA, SUA, RA) are defined by local government boundaries which, in some cases, do not reflect transportation catchments and the differences of travel generated by urban and rural settlement patterns. In some metropolitan urban regions, e.g. Auckland and Wellington, the present groupings will, after the 2007 surveys are added, enable comparative analysis. But in others, such as Canterbury, Nelson and the Bay of Plenty, the data should be disaggregated and regrouped, allowing valid comparison of MUA and RA household travel patterns. The conclusion of this research project is that such re-sorting of the dataset would bring a better understanding of the variations in travel patterns. It would also improve the prospect of being able to develop transportation models for trip calculation and prediction purposes from the NZHTS surveys. This would have significant benefits to those practitioners wishing to take advantage of the NZHTS data when developing transportation policy, planning and Regional Land Transport Strategies. The trip legs used in the NZHTS survey database are related to trip purposes with only some of the land uses defined at each end (e.g. home, shops and education are defined, but industries and offices are not). Progress is being made in other research that links the trip chains and tours. However, for transportation planning purposes, this will also need to be extended to include definitions of the land uses at each end of the significant trip chains so the information can be used in future spatial land-use/transportation modelling. Further work reconciling these two aspects, some of which is in hand in other research projects, would give the NZHTS greater usefulness in developing models for Regional Land Transport Strategies and transportation assessments necessary for the spatial planning associated with urban development strategies and district plan. The NZHTS datasets contain a wealth of information and many additional analyses might have been undertaken in this research using the present NZHTS dataset. In this group, 93
94 NATIONAL TRAVEL PROFILES PART A: DESCRIPTION OF DAILY TRAVEL PATTERNS other matters are identified here where, if time had permitted, additional analysis could have been undertaken: Vehicle trip types: Research should extend the analysis of the existing NZHTS data file to identify the proportion of trip legs or trip chains falling within the traffic engineering definitions of primary trips, bypass trips and diverted trips for different purposes. The research outcome would enable practitioners making development transportation assessments to identify these component parts and the transport effects caused by various types of development at different locations along a trip chain. This would then enable an assessment of whether the visits are newly generated trips, or whether they are diversions of existing trips or the primary destination of a particular trip. Active mode trips: Extending the analysis of the distance, time, locations and land uses visited by active modes (pedestrians and cyclists) would provide more detail and possible models to explain travel by these modes. This analysis might also identify walking/cycling thresholds on different street classes in different sizes of settlement to assist in future planning for sustainable transportation. This is complementary to the approved NZTA project Accessibility Research (LTR 50/07). Personal vehicle availability: Research should extend the household information analysis to discover each individual s use of household cars. This would involve merging the vehicle use and the vehicle database in the existing dataset to assess the trips, distance and time per person per year related to households having no car, one car, or two or more cars. It would also yield information on the frequency of vehicle driver and passenger trips in each of the household s cars. It is also observed that some of the information derived from this project as well as from the further analysis outlined above has immediate application to other research already commissioned by NZTA. This present project was proposed as a preliminary study. This was seen as leading to further analysis and grouping of variables for predicting future transportation planning. The matters referred above are relevant to testing variables for travel prediction and development of spatial planning policies at regional and district levels. Such regional and district planning will derive additional benefits from the results of the NZHTS when these are in a suitable form for assisting transportation planning, both at regional and district levels. 94
95 10. Summary and recommendations 10.3 Recommendations Recommendations to NZTA This report should be published and made available to practitioners working in the transportation field as a national summary of travel profiles derived from the NZHST. Arising from the conclusions now available, including the addition of the fourth year ( ) of the NZHTS survey, a further report should be prepared to identify trends in these travel profiles over time, and to ascertain the regional comparisons for the three MUAs, the SUAs and the RAs identifying travel patterns for communities of different sizes. The next stage in this research should be to investigate the variables obtained in the NZHTS. This would improve the definition of household characteristics, but it would also identify trip chains or tours which contribute to making up trip purposes between significant and defined land uses at the origin and destination of journeys. This would allow researchers and planners to: assess how well the factors surveyed in the NZHTS act as predictive variables in forecasting future travel patterns of trip generation and trip attractions; investigate variables used in the household characteristics surveyed in the NZHTS to determine if they can be used to define household categories suited for use in future travel prediction; compare the NZHTS household survey results with the Regional Council household surveys undertaken in Auckland, Wellington and Christchurch, and compare the NZHTS travel characteristics and surveyed variables with the predictive variables which have been selected in these complementary regional studies; and establish the degree of contrast between rural areas, urban settlements of varying sizes, major cities and the three metropolitan areas so as to provide descriptions of the differences. This information can then be applied to the Regional Long-Term Strategy in the different local government regions Recommendations to the MoT When the next phase of reporting the NZHTS is completed, a report covering the surveys (similar to that presented here) should be prepared, including travel trends over that period, and comparisons between metropolitan areas, other urban areas and rural settlements. Questions should be added to the survey that cover the personal situation and reasons (e.g. convenience, safety, economy, temporary situation etc.) for individuals selecting to travel to work or to shop by their selected mode. If, because of the length of the present survey, this cannot be included in the present NZHTS then some other national research, based on household surveys, is desirable to cover the reasons for choice of mode being made by individuals in different communities. 95
96 NATIONAL TRAVEL PROFILES PART A: DESCRIPTION OF DAILY TRAVEL PATTERNS 11. References Department for Transport National Travel Survey: London: Department for Transport. FHWA National Household Travel Survey User s Guide. Washington, DC: US Department of Transportation, Federal Highway Administration. Hallar, O., McDonnell, P., Mottau, C., Salathiel, D National Travel Survey 2003 & 2004 Technical Report. London: Department for Transport, UK. Hu, P National Household Travel Survey Summary of Travel Trends. Washington, DC: US Department of Transportation, Federal Highway Administration. Land Transport Safety Authority Travel Survey Report 1997/1998. Wellington: Land Transport Safety Authority. Land Transport New Zealand Pedestrian Planning and Design Guide. Wellington: Land Transport New Zealand. Ministry of Transport New Zealand Household Travel Survey, July 1989 June Traffic Research Report No.43. Wellington: MoT Traffic Research & Statistics Section. Ministry of Transport Preliminary results of Household Travel Survey Wellington: Ministry of Transport. Ministry of Transport. 2008a. Travel survey. Ministry of Transport. 2008b. Transport monitoring indicator framework glossary of terms. NSW Ministry of Transport Household Travel Survey Summary Report. Sydney: Transport Data Centre, NSW Ministry of Transport. NSW Government Department of Planning TPDC News. Sydney: Transport & Population Data Centre, NSW Department of Planning. O Fallon, C., Sullivan, C Trip chaining: understanding how New Zealanders link their travel. Transfund New Zealand Research Report No Wellington: Transfund New Zealand. 70 pp. 96
97 11. References O'Fallon, C. Sullivan, C Understanding and managing weekend traffic congestion. Paper presented at the ATRF Conference, October 2003, Wellington, New Zealand. Statistics New Zealand Glossary of common terms. 97
98 NATIONAL TRAVEL PROFILES PART A: DESCRIPTION OF DAILY TRAVEL PATTERNS Appendix A: NZHTS interviewer household response form 1 This appendix contains a facsimile of the household survey form used by investigators to collect the household information used in the NZHTS. 98
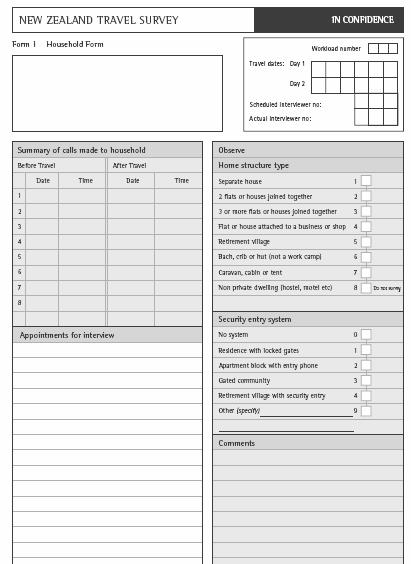
99 Appendices 99

100 NATIONAL TRAVEL PROFILES PART A: DESCRIPTION OF DAILY TRAVEL PATTERNS 100
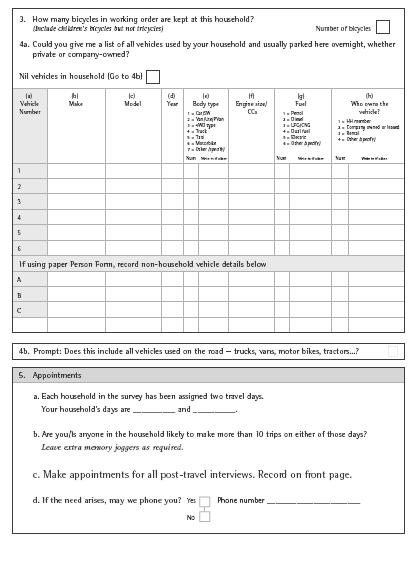
101 Appendices 101

102 NATIONAL TRAVEL PROFILES PART A: DESCRIPTION OF DAILY TRAVEL PATTERNS 102
103 Appendices 103
104 NATIONAL TRAVEL PROFILES PART A: DESCRIPTION OF DAILY TRAVEL PATTERNS Appendix B: NZHTS personal questionnaire form 2 This appendix contains a facsimile of the personal survey form used by investigators to collect the personal information used in the NZHTS. 104
105 Appendices 105
106 NATIONAL TRAVEL PROFILES PART A: DESCRIPTION OF DAILY TRAVEL PATTERNS 106
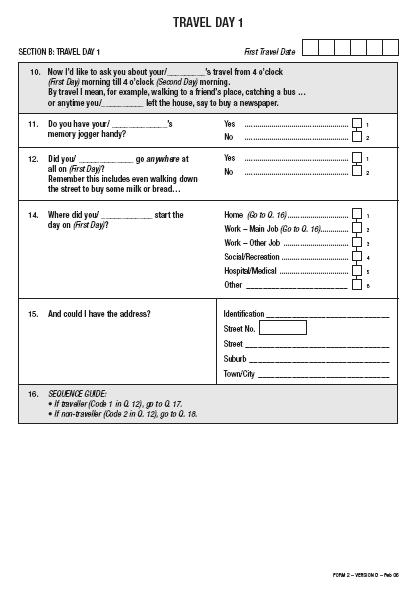
107 Appendices 107

108 NATIONAL TRAVEL PROFILES PART A: DESCRIPTION OF DAILY TRAVEL PATTERNS 108
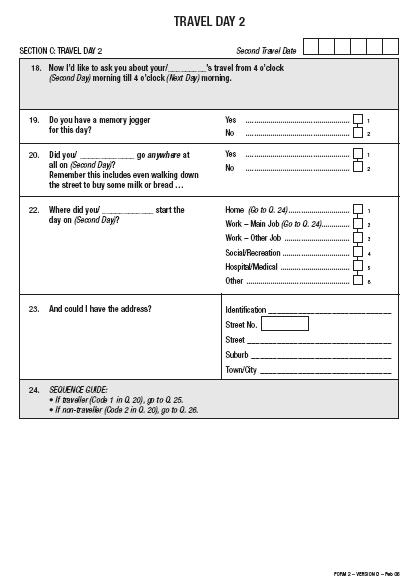
109 Appendices 109

110 NATIONAL TRAVEL PROFILES PART A: DESCRIPTION OF DAILY TRAVEL PATTERNS 110
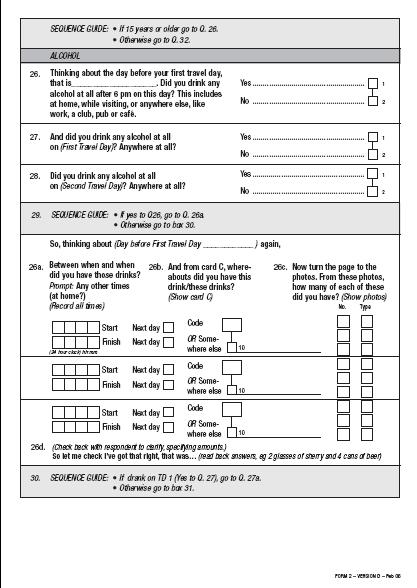
111 Appendices 111

112 NATIONAL TRAVEL PROFILES PART A: DESCRIPTION OF DAILY TRAVEL PATTERNS 112
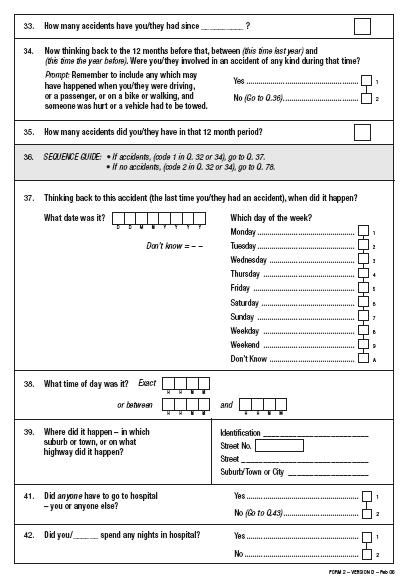
113 Appendices 113
114 NATIONAL TRAVEL PROFILES PART A: DESCRIPTION OF DAILY TRAVEL PATTERNS 114
115 Appendices 115

116 NATIONAL TRAVEL PROFILES PART A: DESCRIPTION OF DAILY TRAVEL PATTERNS 116
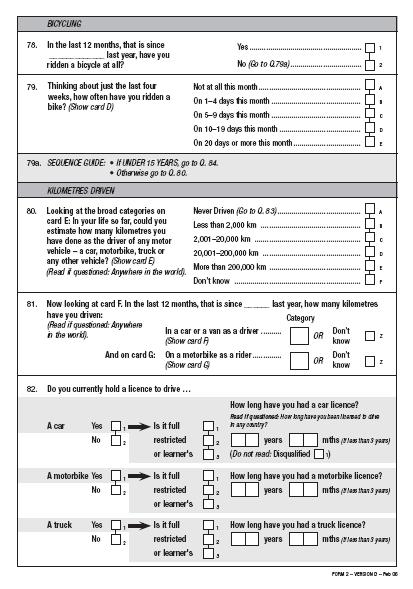
117 Appendices 117
National travel profiles part B: trips, trends and travel prediction December 2011
 National travel profiles part B: trips, trends and travel prediction December 2011 A Milne, S Rendall, S Abley Abley Transportation Consultants Ltd NZ Transport Agency research report 467 ISBN 978-0-478-38090-3
New Zealand Household Travel Survey December 2017
 New Zealand Household Travel Survey 2015-2017 December 2017 Disclaimer All reasonable endeavours are made to ensure the accuracy of the information in this report. However, the information is provided
Walking in New Zealand May 2013
 May 2013 Walking makes up 13 percent of total time travelled and 16 percent of the number of trip legs. On average women spend more time walking than men, walking 57 minutes per person per week, compared
New Zealanders travel patterns: trends in trip chaining and tours
 New Zealanders travel patterns: trends in trip chaining and tours Carolyn O Fallon, Pinnacle Research & Policy Ltd, Wellington Charles Sullivan, Capital Research, Wellington Keywords: household travel,
Trends in Trip Chaining and Tours: Analysing Changes in New Zealanders Travel Patterns Using the Ongoing New Zealand Household Travel Survey
 Trends in Trip Chaining and Tours: Analysing Changes in New Zealanders Travel Patterns Using the Ongoing New Zealand Household Travel Survey Carolyn O Fallon, Pinnacle Research & Policy Ltd, Wellington
Walking New Zealand Household Travel Survey September 2015
 Walking New Zealand Household Travel Survey 2011-2014 September 2015 Disclaimer: All reasonable endeavours are made to ensure the accuracy of the information in this report. However, the information is
1999 On-Board Sacramento Regional Transit District Survey
 SACOG-00-009 1999 On-Board Sacramento Regional Transit District Survey June 2000 Sacramento Area Council of Governments 1999 On-Board Sacramento Regional Transit District Survey June 2000 Table of Contents
PERSONALISED TRAVEL PLANNING IN MIDLETON, COUNTY CORK
 PERSONALISED TRAVEL PLANNING IN MIDLETON, COUNTY CORK Elaine Brick Principal Transport Planner AECOM Abstract Smarter Travel funding was awarded to the Chartered Institute of Highways and Transportation
TRANSPORTATION TOMORROW SURVEY
 Clause No. 15 in Report No. 7 of was adopted, without amendment, by the Council of The Regional Municipality of York at its meeting held on April 17, 2014. 15 2011 TRANSPORTATION TOMORROW SURVEY recommends
2011 Origin-Destination Survey Bicycle Profile
 TRANS Committee 2011 Origin-Destination Survey National Capital Region December 2012 TRANS Committee Members: City of Ottawa, including OC Transpo Ville de Gatineau Société de transport de l Outaouais
Baseline Survey of New Zealanders' Attitudes and Behaviours towards Cycling in Urban Settings
 Baseline Survey of New Zealanders' Attitudes and Behaviours towards Cycling in Urban Settings Highlights 67% of urban New Zealanders, 18 years of age or more own or have access to a bicycle that is in
Risk on the Road. Pedestrians, Cyclists and Motorcyclists August 2015
 Risk on the Road Pedestrians, Cyclists and Motorcyclists August 215 Contents Key Facts... 4 Pedestrians... 5 Pedestrian risk by time of day and age... 8 Cyclists... 11 Motorcyclists... 14 Glossary... 17
Modal Shift in the Boulder Valley 1990 to 2009
 Modal Shift in the Boulder Valley 1990 to 2009 May 2010 Prepared for the City of Boulder by National Research Center, Inc. 3005 30th Street Boulder, CO 80301 (303) 444-7863 www.n-r-c.com Table of Contents
Thursday 18 th January Cambridgeshire Travel Survey Presentation to the Greater Cambridge Partnership Joint Assembly
 Thursday 18 th January 2018 Cambridgeshire Travel Survey Presentation to the Greater Cambridge Partnership Joint Assembly Contents 1. Study Background 2. Methodology 3. Key Findings An opportunity for
1. Motor vehicle numbers as a "measure of deprivation"
 27 June 2003 Submission on Census 2006: Preliminary Views on Content (June 2003) Introduction The Cycling Advocates' Network of NZ (CAN) Inc. is this country's national network of cycling advocate groups.
Determining bicycle infrastructure preferences A case study of Dublin
 *Manuscript Click here to view linked References 1 Determining bicycle infrastructure preferences A case study of Dublin Brian Caulfield 1, Elaine Brick 2, Orla Thérèse McCarthy 1 1 Department of Civil,
Life Transitions and Travel Behaviour Study. Job changes and home moves disrupt established commuting patterns
 Life Transitions and Travel Behaviour Study Evidence Summary 2 Drivers of change to commuting mode Job changes and home moves disrupt established commuting patterns This leaflet summarises new analysis
Kilometres travelled and vehicle occupancy in urban areas: improving evaluation and monitoring
 Kilometres travelled and vehicle occupancy in urban areas: improving evaluation and monitoring Charles Sullivan, Capital Research Ltd, Wellington Carolyn O Fallon, Pinnacle Research & Policy Ltd, Wellington
Travel Patterns and Cycling opportunites
 Travel Patterns and Cycling opportunites The Household Travel Survey is the largest and most comprehensive source of information on the travel patterns of residents of the Sydney Greater Metropolitan Area
Accessibility, mobility and social exclusion
 Accessibility, mobility and social exclusion Dionisis Balourdos Kostas Sakellaropoulos Aim The aim of this paper is to present data from the four cities in the project SceneSusTech concerning the issues
Acknowledgements. Ms. Linda Banister Ms. Tracy With Mr. Hassan Shaheen Mr. Scott Johnston
 Acknowledgements The 2005 Household Travel Survey was funded by the City of Edmonton and Alberta Infrastructure and Transportation (AIT). The survey was led by a steering committee comprised of: Dr. Alan
Travel and Rider Characteristics for Metrobus
 Travel and Rider Characteristics for Metrobus 040829040.15 Travel and Rider Characteristics for Metrobus: 2012-2015 Overview The Miami Dade County Metropolitan Planning Organization (MPO) conducted a series
Executive Summary. TUCSON TRANSIT ON BOARD ORIGIN AND DESTINATION SURVEY Conducted October City of Tucson Department of Transportation
 Executive Summary TUCSON TRANSIT ON BOARD ORIGIN AND DESTINATION SURVEY Conducted October 2004 Prepared for: City of Tucson Department of Transportation May 2005 TUCSON TRANSIT ON BOARD ORIGIN AND DESTINATION
Route User Intercept Survey Report
 Route User Intercept Survey Report Hills Road, Cambridge Fieldwork: October 2016 Report published: December 2016 1 About Sustrans Sustrans makes smarter travel choices possible, desirable and inevitable.
AP-R361/10 AUSTROADS RESEARCH REPORT. The Road Safety Consequences of Changing Travel Modes
 AP-R361/10 AUSTROADS RESEARCH REPORT The Road Safety Consequences of Changing Travel Modes The Road Safety Consequences of Changing Travel Modes Published July 2010 Austroads Ltd. 2010 This work is copyright.
UWA Commuting Survey 2013
 UWA Commuting Survey 2013 September 2013 Project: UWA/10 UWA Commuting Survey 2013 September 2013 Client: University of Western Australia Project: UWA/10 Consultants: Donna Hill Petra Roberts Jennifer
Land Use and Cycling. Søren Underlien Jensen, Project Manager, Danish Road Directorate Niels Juels Gade 13, 1020 Copenhagen K, Denmark
 Land Use and Cycling Søren Underlien Jensen, Project Manager, Danish Road Directorate Niels Juels Gade 13, 1020 Copenhagen K, Denmark suj@vd.dk Summary: Research about correlation between land use and
Briefing Paper #1. An Overview of Regional Demand and Mode Share
 2011 Metro Vancouver Regional Trip Diary Survey Briefing Paper #1 An Overview of Regional Demand and Mode Share Introduction The 2011 Metro Vancouver Regional Trip Diary Survey is the latest survey conducted
Cycle journeys on the Anderston-Argyle Street footbridge: a descriptive analysis. Karen McPherson. Glasgow Centre for Population Health
 Cycle journeys on the Anderston-Argyle Street footbridge: a descriptive analysis Karen McPherson Glasgow Centre for Population Health March 2017 Key points: There were 116,334 cycle journeys made using
Value of time, safety and environment in passenger transport Time
 TØI report 1053B/2010 Author(s): Farideh Ramjerdi, Stefan Flügel, Hanne Samstad and Marit Killi Oslo 2010, 324 pages Norwegian language Summary: Value of time, safety and environment in passenger transport
21/02/2018. How Far is it Acceptable to Walk? Introduction. How Far is it Acceptable to Walk?
 21/2/218 Introduction Walking is an important mode of travel. How far people walk is factor in: Accessibility/ Sustainability. Allocating land in Local Plans. Determining planning applications. Previous
January Project No
 January 13 2015 Project No. 5070.05 Neil Connelly, Director University of Victoria, Campus Planning and Sustainability PO Box 1700 STN CSC Victoria, BC V8P 5C2 Dear Neil: Re: UVic 2014 Traffic Final Report
Transportation Trends, Conditions and Issues. Regional Transportation Plan 2030
 Transportation Trends, Conditions and Issues Regional Transportation Plan 2030 23 Regional Transportation Plan 2030 24 Travel Characteristics Why Do People Travel? Over one-half of trips taken in Dane
Customer Satisfaction Tracking Report 2016 Quarter 1
 Customer Satisfaction Tracking Report 2016 Quarter 1 May 2016 Prepared by: NRG Research Group Project no. 317-15-1445 Suite 1380-1100 Melville Street Vancouver, BC V6E 4A6 Table of Contents Background
GD 0043/18 ACTIVE TRAVEL STRATEGY
 GD 0043/18 ACTIVE TRAVEL STRATEGY 2018-2021 May 2018 Minister s Introduction There is strong evidence that regular physical activity reduces the risk of a range of health conditions. The best way to increase
Report on trends in mode share of vehicles and people crossing the Canal Cordon to 2013
 Report on trends in mode share of vehicles and people crossing the Canal Cordon 2006 to 2013 Dublin City Council, National Transport Authority, Civic Offices, Dun Scèine, Wood Quay, Harcourt Lane, Dublin
TECHNICAL NOTE THROUGH KERBSIDE LANE UTILISATION AT SIGNALISED INTERSECTIONS
 TECHNICAL NOTE THROUGH KERBSIDE LANE UTILISATION AT SIGNALISED INTERSECTIONS Authors: Randhir Karma NDip: Eng (Civil) B. Tech Eng (Civil) M Eng (Hons) (Transportation) Auckland Traffic Service Group Manager
WILMAPCO Public Opinion Survey Summary of Results
 Wilmington Area Planning Council WILMAPCO Public Opinion Survey Summary of Results Prepared by: 2955 Valmont Road, Suite 300 Boulder, Colorado 80301 t: 303-444-7863 f: 303-444-1145 www.n-r-c.com Table
National Bicycle and Pedestrian Documentation Project INSTRUCTIONS
 National Bicycle and Pedestrian Documentation Project INSTRUCTIONS The National Documentation Project (NBPD) is an annual bicycle and pedestrian count and survey effort sponsored by the Institute of Transportation
Guidelines for Providing Access to Public Transportation Stations APPENDIX C TRANSIT STATION ACCESS PLANNING TOOL INSTRUCTIONS
 APPENDIX C TRANSIT STATION ACCESS PLANNING TOOL INSTRUCTIONS Transit Station Access Planning Tool Instructions Page C-1 Revised Final Report September 2011 TRANSIT STATION ACCESS PLANNING TOOL INSTRUCTIONS
Travel Plan Monitoring Report. Bourton View, Wellingborough - Residential
 Travel Plan Monitoring Report Bourton View, Wellingborough - Residential Prepared by: Developer Eyes Property and Estate Management, Broughton Grange Business Centre, Headlands, Kettering, Northants, NN15
Reflections on our learning: active travel, transport and inequalities
 Reflections on our learning: active travel, transport and inequalities Jill Muirie Glasgow Centre for Population Health Active travel definition Active travel refers to walking, cycling or using some other
This objective implies that all population groups should find walking appealing, and that it is made easier for them to walk more on a daily basis.
 Walking for life The Norwegian Walking Strategy Guro Berge Norwegian public Roads Administration "Walking for life" is the slogan for the National Walking Strategy that is now being formulated in Norway.
BRIEFING PAPER 29 FINDINGS SERIES. Children s travel to school are we moving in the right direction?
 BRIEFING PAPER 29 FINDINGS SERIES Children s travel to school are we moving in the right direction? February 2011 FINDINGS SERIES 29 BRIEFING PAPER KEY FINDINGS National surveys show that while the level
2015 Origin/Destination Study
 2015 Origin/Destination Study Research Report for Prepared by: March 2016 Table of Contents Summary of Findings... 7 Rider Profile... 7 Frequency of Use... 7 Transit Dependence... 7 Age... 7 Income...
Market Factors and Demand Analysis. World Bank
 Market Factors and Demand Analysis Bank Workshop and Training on Urban Transport Planning and Reform. Baku, April 14-16, 2009 Market Factors The market for Public Transport is affected by a variety of
2012 Transit Study Randolph County
 2012 Transit Study Randolph County Appendix B Technical Memorandum 2011 Transportation Survey Prepared for: Randolph County Housing Authority Country Roads Transit Submitted by: July 1, 2012 Table of Contents
BICYCLE INFRASTRUCTURE PREFERENCES A CASE STUDY OF DUBLIN
 Proceedings 31st August 1st ITRN2011 University College Cork Brick, McCarty and Caulfield: Bicycle infrastructure preferences A case study of Dublin BICYCLE INFRASTRUCTURE PREFERENCES A CASE STUDY OF DUBLIN
Loughborough University Travel Planning
 Document Ti tle Client Name Loughborough University Travel Planning Loughborough University Travel Plan Executive Summary 2015-2020 23 December 2015 Loughborough University Travel Planning Project no:
GREY LYNN TOWN CENTRE PEDESTRIAN INTERCEPT SURVEY FINAL REPORT JUNE 2015
 GREY LYNN TOWN CENTRE PEDESTRIAN INTERCEPT SURVEY FINAL REPORT JUNE 2015 Prepared for: Auckland Transport Prepared by: Aleph Limited Table of Contents 1.0 INTRODUCTION... 3 2.0 METHODOLOGY... 4 3.0 RESULTS...
Summary of NWA Trail Usage Report November 2, 2015
 Summary of NWA Trail Usage Report November 2, 2015 Summary Findings: The study showed that Northwest Arkansas (NWA) had relatively high cyclist user counts per capita aggregated across the top three usage
Sport & Active Recreation Profile JOGGING & RUNNING FINDINGS FROM THE 2013/14 ACTIVE NEW ZEALAND SURVEY ACTIVE NEW ZEALAND SURVEY SERIES
 ACTIVE NEW ZEALAND SURVEY SERIES Te Rangahau Korikori o Aotearoa Sport & Active Recreation Profile JOGGING & RUNNING FINDINGS FROM THE 2013/14 ACTIVE NEW ZEALAND SURVEY www.sportnz.org.nz Introduction
To: The results of these surveys have been analysed and are summarised within this Technical Note.
 Technical Note Project: Histon Road / Milton Road, Cambridge Parking Surveys To: Andy Harrison Subject: Survey Report v1.6 From: Jonathan Barlow Date: 18 th February 2016 cc: Richard Jones / Dave Boddy
City of Davenport CitiBus Public Transportation Study. April 2015
 City of Davenport CitiBus Public Transportation Study April 2015 Overview Project Background Key Findings CitiBus Service Allocation Policy Discussion 2 Project Background 3 About CitiBus Operates 17 routes
Investigating Commute Mode and Route Choice Variability in Jakarta using multi-day GPS Data
 Investigating Commute Mode and Route Choice Variability in Jakarta using multi-day GPS Data Zainal N. Arifin Kay W. Axhausen Conference paper STRC 2011 Investigating Commute Mode and Route Choice Variability
Dockless Cycle Share
 Dockless Cycle Share Code of Practice December 2017 135 Albert Street Private Bag 92300, Auckland 1142 aucklandcouncil.govt.nz Ph 09 301 0101 1. Introduction Auckland has seen a significant increase in
Travel Planning WC & NWCD Cycling Group. Thursday 2 nd July Amanda Holden
 Travel Planning WC & NWCD Cycling Group Thursday 2 nd July Amanda Holden 1 Today s workshop What is Travel Planning? University Travel Plan NWCD Travel Plan Targets Cycling Initiatives Other Travel Plan
REGIONAL HOUSEHOLD TRAVEL SURVEY:
 Defining the Vision. Shaping the Future. REGIONAL HOUSEHOLD TRAVEL SURVEY: Profile Why we travel How we travel Who we are and how often we travel When we travel Where we travel How far and how long we travel
Travel Patterns and Characteristics
 DRAFT 2006 Transportation Fact Book SECTION 4 Travel Patterns and Characteristics 43 2006 Transportation Fact Book DRAFT 44 DRAFT 2006 Transportation Fact Book Why do we conduct travel surveys? The main
SUSTAINABLE TRAVEL TOWNS: RESULTS AND LESSONS
 SUSTAINABLE TRAVEL TOWNS: RESULTS AND LESSONS Joe Finlay Sustainable Travel Team Department for Transport (UK) Introduction I will: Give brief background on the Sustainable Travel Towns and the projects
March Maidstone Integrated Transport Strategy Boxley Parish Council Briefing Note. Context. Author: Parish Clerk 2 March 2016
 Context. Author: Parish Clerk 2 The Draft Integrated Transport Policy (DITS) sets out a vision and objectives, and identifies a detailed programme of interventions to support the Maidstone Borough Local
Post impact trajectory of vehicles at rural intersections
 Post impact trajectory of vehicles at rural intersections Doecke SD., Woolley JE. and Mackenzie JR. Centre for Automotive Safety Research Abstract This report describes the path of vehicles after a collision
How are your travelling? Travel Diary in Cork
 Measures to Influence transport Demand to Achieve Sustainability POLIS Working Group Environment and Health 14 th October 2008 - Paris How are your travelling? Travel Diary in Cork Cork County Council
VI. Market Factors and Deamnd Analysis
 VI. Market Factors and Deamnd Analysis Introduction to Public Transport Planning and Reform VI-1 Market Factors The market for Public Transport is affected by a variety of factors No two cities or even
NASHUA REGIONAL PLANNING COMMISSION REGIONAL BICYCLE AND PEDESTRIAN PLAN
 NASHUA REGIONAL PLANNING COMMISSION REGIONAL BICYCLE AND PEDESTRIAN PLAN June, 2005 Prepared by the Nashua Regional Planning Commission 2005 NRPC Regional Bicycle and Pedestrian Plan- JUNE 2005 ACKNOWLEDGEMENTS
Speed Limit Policy Isle of Wight Council
 APPENDIX B Speed Limit Policy Isle of Wight Council 2009 Contents Section 1 Introduction 1.1 Links with the Local Transport Plan Section 2 Speed Limits on Urban Roads and Residential Areas 2.1 20mph Limits
TORONTO TRANSIT COMMISSION REPORT NO.
 Form Revised: February 2005 TORONTO TRANSIT COMMISSION REPORT NO. MEETING DATE: May 30, 2012 SUBJECT: ADDITIONAL OPERATING RESOURCE REQUIREMENTS TO MEET INCREASING TTC RIDERSHIP ACTION ITEM RECOMMENDATIONS
MODELING THE ACTIVITY BASED TRAVEL PATTERN OF WORKERS OF AN INDIAN METROPOLITAN CITY: CASE STUDY OF KOLKATA
 MODELING THE ACTIVITY BASED TRAVEL PATTERN OF WORKERS OF AN INDIAN METROPOLITAN CITY: CASE STUDY OF KOLKATA WORK ARITRA CHATTERJEE HOME SHOPPING PROF. DR. P.K. SARKAR SCHOOL OF PLANNING AND ARCHITECTURE,
DEVELOPMENT OF A SET OF TRIP GENERATION MODELS FOR TRAVEL DEMAND ESTIMATION IN THE COLOMBO METROPOLITAN REGION
 DEVELOPMENT OF A SET OF TRIP GENERATION MODELS FOR TRAVEL DEMAND ESTIMATION IN THE COLOMBO METROPOLITAN REGION Ravindra Wijesundera and Amal S. Kumarage Dept. of Civil Engineering, University of Moratuwa
12. School travel Introduction. Part III Chapter 12. School travel
 12. School travel 12.1 Introduction This chapter presents the evidence on changes in travel patterns for the journey to school in the three towns over the period of the Sustainable Travel Town project.
Domestic Energy Fact File (2006): Owner occupied, Local authority, Private rented and Registered social landlord homes
: Owner occupied, Local authority, Private rented and Registered social landlord homes") Domestic Energy Fact File (2006): Owner occupied, Local authority, Private rented and Registered social landlord homes Domestic Energy Fact File (2006): Owner occupied, Local authority, Private rented
Domestic Energy Fact File (2006): Owner occupied, Local authority, Private rented and Registered social landlord homes Domestic Energy Fact File (2006): Owner occupied, Local authority, Private rented
Population & Demographics
 Population & Demographics Conditions and Trends When looking at trends in the total number of people living in Windham (population) and at the characteristics of the people who live here by factors such
Deaths/injuries in motor vehicle crashes per million hours spent travelling, July 2007 June 2011 (All ages) Mode of travel
 Mode of travel") Cyclists CRASH STATISTICS FOR THE YEAR ENDED 31 DECEMBER 211 Prepared by the Ministry of Transport CRASH FACTSHEET 212 Cyclists have a number of risk factors that do not affect car drivers. The main risk
Cyclists CRASH STATISTICS FOR THE YEAR ENDED 31 DECEMBER 211 Prepared by the Ministry of Transport CRASH FACTSHEET 212 Cyclists have a number of risk factors that do not affect car drivers. The main risk
Dalhousie University Commuter Study
 Dalhousie University Commuter Study 2015-2016 Prepared by: S.J. Campbell and M.A. Habib Prepared for: Office of Sustainability, Dalhousie University Technical Report 2016-000 April 2016 Dalhousie Transportation
ANNEX1 The investment required to achieve the Government s ambition to double cycling activity by 2025
 ANNEX1 The investment required to achieve the Government s ambition to double cycling activity by 2025 May 2016 About Sustrans Sustrans makes smarter travel choices possible, desirable and inevitable.
City of Perth Cycle Plan 2029
 Bicycling Western Australia s response City of Perth Cycle Plan 2029 2012-2021 More People Cycling More Often ABOUT BICYCLING WESTERN AUSTRALIA Bicycling Western Australia is a community based, not-for-profit
RE-CYCLING A CITY: EXAMINING THE GROWTH OF CYCLING IN DUBLIN
 Proceedings ITRN2013 5-6th September, Caulfield: Re-cycling a city: Examining the growth of cycling in Dublin RE-CYCLING A CITY: EXAMINING THE GROWTH OF CYCLING IN DUBLIN Brian Caulfield Abstract In the
People killed and injured per million hours spent travelling, Motorcyclist Cyclist Driver Car / van passenger
 Cyclists CRASH FACTSHEET 27 CRASH STATISTICS FOR THE YEAR ENDED 31 DEC 26 Prepared by Strategy and Sustainability, Ministry of Transport Cyclists have a number of risk factors that do not affect car drivers.
2014 QUICK FACTS ILLINOIS CRASH INFORMATION. Illinois Emergency Medical Services for Children February 2016 Edition
 2014 QUICK FACTS ILLINOIS CRASH INFORMATION February 2016 Edition Illinois Emergency Medical Services for Children www.luhs.org/emsc Illinois Emergency Medical Services for Children TABLE OF CONTENTS
BASKETBALL. Sport & Active Recreation Profile FINDINGS FROM THE 2013/14 ACTIVE NEW ZEALAND SURVEY ACTIVE NEW ZEALAND SURVEY SERIES.
 ACTIVE NEW ZEALAND SURVEY SERIES Te Rangahau Korikori o Aotearoa Sport & Active Recreation Profile BASKETBALL FINDINGS FROM THE 2013/14 ACTIVE NEW ZEALAND SURVEY www.sportnz.org.nz Introduction Content
Investment in Active Transport Survey
 Investment in Active Transport Survey KEY FINDINGS 3 METHODOLOGY 7 CYCLING INFRASTRUCTURE 8 Riding a bike 9 Reasons for riding a bike 9 Mainly ride on 10 Comfortable riding on 10 Rating of cycling infrastructure
2012 QUICK FACTS ILLINOIS CRASH INFORMATION. Illinois Emergency Medical Services for Children September 2014 Edition
 2012 QUICK FACTS ILLINOIS CRASH INFORMATION September 2014 Edition Illinois Emergency Medical Services for Children www.luhs.org/emsc Illinois Emergency Medical Services for Children TABLE OF CONTENTS
Exceeding expectations: The growth of walking in Vancouver and creating a more walkable city in the future through EcoDensity
 Exceeding expectations: The growth of walking in Vancouver and creating a more walkable city in the future through EcoDensity Melina Scholefield, P. Eng. Manager, Sustainability Group, City of Vancouver
Americans in Transit A Profile of Public Transit Passengers
 Americans in Transit A Profile of Public Transit Passengers published by American Public Transit Association December 1992 Louis J. Gambacclnl, Chairman Rod Diridon, Vice Chairman Fred M. Gilliam, Secretary-Treasurer
Final Plan 20 December 2016
 Final Plan 20 December 2016 Introduction Aims of the Travel Plan How do we travel? Understanding travel behaviours? The University Master Plan and its implications Galway City sustainable transport policies
Appendix 22 Sea angling from a private or chartered boat
 Appendix 22 Sea angling from a private or chartered boat LUC SMRTS2015 Final Report 359 March 2016 Appendix 22 Sea angling from a private or chartered boat Table A22.1: Summary of sample confidence levels
Travel Plan Monitoring Report. Buttercross Park, Whittlesey - Residential
 Travel Plan Monitoring Report Buttercross Park, Whittlesey - Residential Prepared by: Developer Eyes Property and Estate Management Limited Headlands, Kettering, Northants NN15 6XA Company Registration
Active Travel Towns Funding Scheme Project Proposal. Sligo. Sligo Local Authorities
 Active Travel Towns Funding Scheme 2014-2016 Project Proposal for Sligo by Sligo Local Authorities Introduction Over the last two years, Sligo Local Authorities have implemented years 1 & 2 of their 5
Active Travel Strategy Dumfries and Galloway
 Active Travel Strategy Dumfries and Galloway Our Active Travel Strategy The agreed Interventions for Dumfries and Galloway Council s Local Transport Strategy includes an action to Develop an Active Travel
Transport Poverty in Scotland. August 2016
 Transport Poverty in Scotland August 2016 About Sustrans Sustrans makes smarter travel choices possible, desirable and inevitable. We re a leading UK charity enabling people to travel by foot, bike or
Contents. Champaign-Urbana Mass Transit District Stop Placement Guidelines
 Contents Champaign-Urbana Mass Transit District Introduction... 1 Stop Spacing... 2 Rural... 2 Low Density Suburban... 2 General Urban... 2 Urban Core... 2 Operational Safety... 3 Stop Placement... 4 Nearside
Sun Metro Fixed Route Rider Survey
 University of Texas at El Paso DigitalCommons@UTEP IPED Technical Reports Institute for Policy and Economic Development 8-1-2006 Dennis L. Soden University of Texas at El Paso, desoden@utep.edu Mathew
The Case for New Trends in Travel
 The Case for New Trends in Travel The Future of Cities and Travel Steven E. Polzin, PhD. Center for urban Transportation Research University of South Florida October 19, 2008 Successful Strategies from
WALKING. Sport & Active Recreation Profile FINDINGS FROM THE 2013/14 ACTIVE NEW ZEALAND SURVEY ACTIVE NEW ZEALAND SURVEY SERIES.
 ACTIVE NEW ZEALAND SURVEY SERIES Te Rangahau Korikori o Aotearoa Sport & Active Recreation Profile WALKING FINDINGS FROM THE 213/14 ACTIVE NEW ZEALAND SURVEY www.sportnz.org.nz Introduction Content This
RVTD On-Board Passenger Study
 2014 RVTD Planning Department 12/31/2014 EXECUTIVE SUMMARY In the fall of 2014, RVTD conducted an on-board passenger survey. The survey was created by RVTD planners using methods from previous on-board
PRELIMINARY DRAFT FIRST AMENDMENT TO VISION 2050: A REGIONAL LAND USE AND TRANSPORTATION PLAN FOR SOUTHEASTERN WISCONSIN
 PRELIMINARY DRAFT FIRST AMENDMENT TO VISION 2050: A REGIONAL LAND USE AND TRANSPORTATION PLAN FOR SOUTHEASTERN WISCONSIN ESTABLISHING TARGETS FOR FEDERAL PERFORMANCE MEASURES: HIGHWAY SAFETY SOUTHEASTERN
Understanding Transit Demand. E. Beimborn, University of Wisconsin-Milwaukee
 Understanding Transit Demand E. Beimborn, University of Wisconsin-Milwaukee 1 Purpose To provide a basic understanding of transit ridership and some common misunderstandings. To explain concepts of choice
This document is downloaded from DR-NTU, Nanyang Technological University Library, Singapore.
 This document is downloaded from DR-NTU, Nanyang Technological University Library, Singapore. Title Comparison study of cycling in Tampines new town Author(s) Ng, Teik Ting Citation Ng, T. T. (2014). Comparison
2014 Ontario Works Transit Survey: Final Results
 2014 Ontario Works Transit Survey: Final Results Irena Pozgaj-Jones, Project Manager, Transportation September 2014 Overview Background Survey Purpose and Objectives Methodology Respondent Demographics
IGEM/TD/2 Edition 2 with amendments July 2015 Communication 1779 Assessing the risks from high pressure Natural Gas pipelines
 Communication 1779 Assessing the risks from high pressure Natural Gas pipelines Founded 1863 Royal Charter 1929 Patron: Her Majesty the Queen Communication 1779 Assessing the risks from high pressure Natural