Translating Research Into Public Policy:
|
|
|
- Linda Reed
- 6 years ago
- Views:
Transcription


1 An Active Living Program supported by The Robert Wood Johnson Foundation and administered by San Diego State University. Translating Research Into Public Policy: The Case of Active Living NCSL. November 17, 2008 James F. Sallis, Ph.D. San Diego State University
2 3Four50.com Oxford Health Alliance's key message: 3 risk factors tobacco use, poor diet, lack of physical activity Contribute to Four chronic diseases heart disease, type 2 diabetes, lung disease and some cancers Which, in turn, contribute to more than 50 percent of deaths in the world
3 Promoting exercise has not worked Source: Centers for Disease Control and Prevention Behavioral Risk Factor Surveillance System

4 Walking for Transport Is Declining, While the Number of Overweight Adults Is Climbing Based on data from the Nationwide Personal Transportation Survey and the Centers for Disease Control and Prevention.
5 60% Percentage of youth ages 6-19 meeting 60 min/day physical activity guidelines. Based on accelerometers. NHANES % 40% 20% 0% 35% 10% 3.4% 10% 5.4% Age Males Females Troiano, MSSE, 2007


6 Sleep Domains of Activity: The SLOTH Model Leisure Occupational Transportation Household


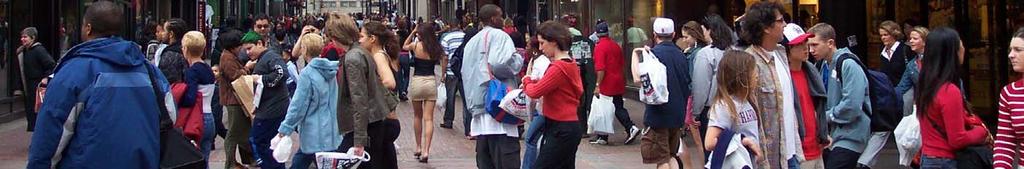
7 The nature of transportation has changed dramatically Tim Armstrong, WHO


8 Work is no longer physical work Tim Armstrong, WHO


9
10 The Political Debate The Political Debate The Right says People can choose to be active Educate them so they choose wisely The Left says We need to engineer society so it is easy for people to be active Change environments & policies The Evidence says People need activity-friendly places AND educational/motivational programs
11 A Multi-Level Approach Is Needed Policy Context Physical Environment Social/cultural Individual Biological Psychological Skills
12 Use of Physical Activity Facilities by Teens Commercial School- Weekend Girls Boys Rec Center School-after Park Neighborhood Hoefer, Mckenzie, et al., 2001, AJPM Times per Week N= 1678 parent reports; 24 schools Gender P=.001, except NS for commercial facilities
13 Neighborhood Physical Activity Settings Mixed use, connected streets Transportation facilities Sidewalks, bike lanes, transit Recreation facilities Parks, trails, private facilities, aesthetics Schools & workplaces Siting, buildings, rec facilities, showers
14 Research on Built Environment & Physical Activity Built Environment Attribute Youth Adults Seniors Walkability: mixed land use, street connectivity, residential density Sidewalks + +? Proximity of recreation facilities (parks, trails, private facilities) Aesthetics of recreation facilities Sallis & Kerr. For PCPFS Research Digest. 2007

15 Designing Activity-Friendly Communities

16 Designing for Active Transportation Walkability Proximity: Are there places nearby to walk to? Connectivity: Are there safe and direct ways to make the trip?


17 High walkable, low income Shopping

18 Low walkable, High income Residences

19 Our Heritage of Walkability
20 The Neighborhood Quality of Life (NQLS) Study: The Link Between Neighborhood Design and Physical Activity Funded by NHLBI, James Sallis Brian Saelens Lawrence Frank
21 MVPA minutes per day (Mean *) Accelerometer-based MVPA Min/day in Walkability-by by-income Quadrants Low Income High Income Walkability: p =.0002 Income: p =.36 Walkability X Income: p =.57 Low Walk High Walk * Adjusted for neighborhood clustering, gender, age, education, ethnicity, # motor vehicles/adult in household, site, marital status, number of people in household, and length of time at current address.
22 70 Percent Overweight or Obese (BMI>25) in Walkability-by by-income Quadrants Walkability: p =.007 Income: p =.081 Walkability X Income: p =.26 % Overweight or Obese Low Walk High Walk 0 Low Income High Income * Adjusted for neighborhood clustering, gender, age, education, ethnicity, # motor vehicles/adult in household, site, marital status, number of people in household, and length of time at current address.
23 NEWS Pedestrian/Traffic Safety in Walkability-by by-income Quadrants Income: p = <.0001 Walkability X Income: p = NEWS Pedestrian/Traffic Safety (Mean *) Low Income High Income Low Walk High Walk *All models adjusted for gender, age, education, ethnicity, # motor vehicles/adult in household, site, marital status, number of people in household, and length of time at current address. Neighborhood was included as a random effect to adjust for clustering.
24 Youth ages 5 to 18 years who live in mixed-use neighborhoods walk more for transportation 20% 15% 9% of children had walking trip over two days 18% of children had walking trip over two days 10% 5% 0% No mixed land use Mixed land use
25 Neighborhood Walkability and Active Commuting to School 201 parents reported on children aged 4 to 17 Active commuting to school: 25% in hi-walkable neighborhoods 11% in lo-walkable neighborhoods Parent concerns, mostly about traffic, were higher in lo-walkable neighborhoods Kerr, et al. MSSE, 2006

26 Walkable neighborhoods encourage more walking in older adults Older women who live within walking distance of trails, parks or stores recorded significantly higher pedometer readings than women who did not. The more destinations that were close by, the more they walked. King, W., Am. J. of Public Health 2003 Photo: Michael Ronkin, ODOT
27 2.50 Dose Response between Number of Environmental Correlates and Walking (Pooled Urban Sample) Odds Ratio Walk 150 minutes/week Total Number of Environmental Correlates (Zero is referent)
28 Multiple Pathways from Land Use to Health: Walkability Associations With Active Transportation, Body Mass Index, and Air Quality. J Am Plan Assoc 07. 5% increase in walkability associated with: 32% increase in walking for transport ¼ point decrease in BMI (about 1.25 pounds) 6.5% decrease in vehicle miles traveled 5.6% decrease in oxides of nitrogen (NOx) grams 5.5% decrease in volatile organic compounds (VOC) grams County government is acting on results
29 100% Support for Traditonally Designed Communities Increased between 2003 and 2005 Percent expressing support 80% 60% 40% 20% 44% 59% 0% Handy et al. J Am Plan Assoc National Surveys.


30 Commercialization of Active Living From home page: Stapleton, the nation s largest urban development, is an urban tapestry of homes, shops, offices, parks, and schools in a walkable community of classic city architecture
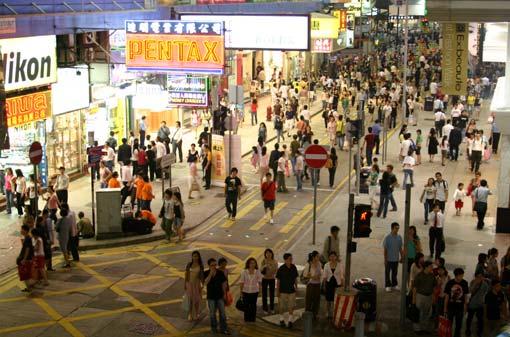


31 Different environments----different congestion
32 Walkability > Driving > Obesity? The more miles a person travels by vehicle, the more likely they are to be obese 30% 25% % 15% 10% % 0% Q1 Q2 Q3 Q4 Quartiles of vehicle miles traveled (VMT) Lopez Zetina 2006


33 Where do people bicycle? The role of infrastructure in determining bicycling behavior Jennifer Dill, Ph.D. Center for Transportation Studies
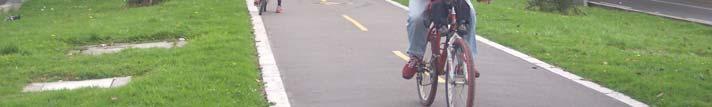
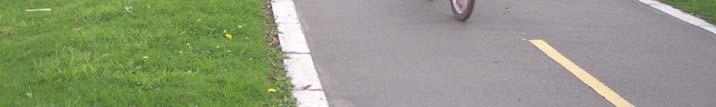
34 Men ride in bike lanes more Average % of bike travel (distance) Men Women sig? Primary arterials/highways, no bike lanes 3% 2% no Secondary arterials, no bike lanes 13% 11% no Minor streets, no bike lanes 33% 41% <0.05 Driveways, alleys, unimproved roads 2% 1% no Primary arterials/highways, with bike lanes 9% 4% <0.10 Secondary arterials, with bike lanes 12% 6% <.01 Minor streets, with bike lanes 6% 7% no Bike paths 12% 12% no Bike boulevards 9% 14% <0.10


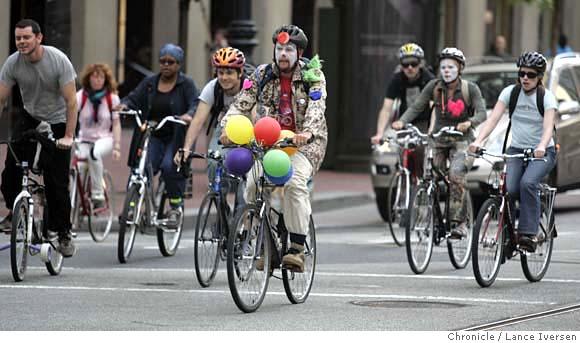
35 II - IV A culture of cycling

36 People with access to parks & recreation Facilities are more likely to be active
37 Access to Recreation Facilities Related to MVPA & Overweight in Youth Availability of recreational & PA facilities and relative odds of overweight and bouts of moderate and vigorous physical activity (MVPA) One Two Three Four Five Six Seven Number of facilities per block group Gordon Larsen Pediatr 2006
38 Myron Floyd Observed Physical Activity in Park Activity Zones (Chicago) Scheffe s post hoc test Softball/Baseball Open Area Playground Basketball Tennis/Racketball Volleyball Energy Expenditure (Kkcal/kg/min) Chicago, F = 10.20, p <.001
39 Built Environments May Be More Important for Minorities Percent being active with high and low recreational resources within 1 mile of home 55 Low recreational resources High recreational resources Diez-Roux Blacks & Hispanics Non-Hispanic Whites
40 % with no recreation facility 90% 80% 70% 60% 50% 40% 30% 20% 10% 0% Percent of census tracts without a recreational facility by race/ethnicity 70% 81% 38% African American Hispanic White


41 Lois Brink, U Colorado Denver Before After

42 What PE should be

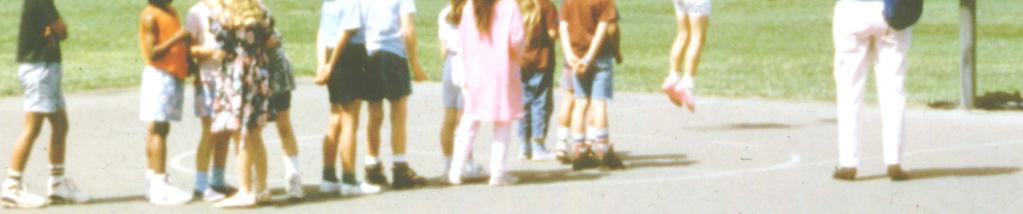
43 What PE is too often
 And Learn")
44 All Kids Should Be Active in PE (50% of class time) And Learn Skills
45 SPARK Outcomes PE specialists>trained classroom teachers> controls Improved quality of PE instruction Increased physical activity in PE Improved cardiorespiratory & muscle fitness Improved sports skills Positive impact on academic achievement Students enjoyed SPARK lessons SPARK is now serving 1 million kids/day

46 School Environment Interventions Stratton et al. from the UK conducted several studies showing simple markings on elementary playgrounds increases PA about 18 min/day Verstraete from Belgium showed Equipment at Recess increased PA
47 Investments in Active Living Walkable communities Pedestrian & cycling facilities Improved parks & programs School PE & other activity programs Potential savings to governments Redirect transport funds May be substantial, but offset by incr tax receipts Minor (recess) to substantial (PE reform)
48 Trails are cost-effective Wang studied 4 trails in Nebraska (Prev Med, 2004) Trail development cost $300,000, of which 73% was for construction Of 4000 trail users, 88% were active at least 3 days per week Annual cost per person becoming more active was $98 Inactive people cost $ more for health care

49 Promoting stair Use through Signs/prompts And aesthetic Improvements Is an effective, Low cost Intervention Principles: Access Aesthetics Advice/promotion

50 The challenge for governments: Connecting the silos transport housing education


51 Vision for The Future Less of this More of this


52 Amsterdam is a model for being friendly to pedestrians & cyclists The Incredible Bicycle Parking Structure At the Train Station


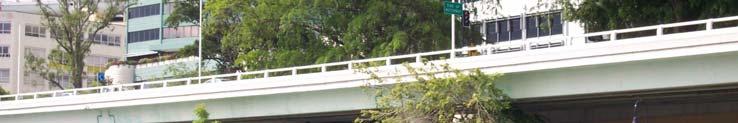
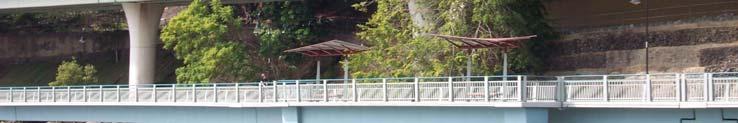


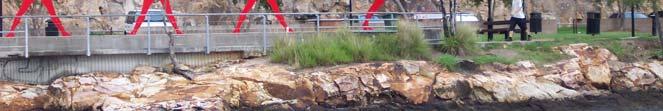

53 Brisbane, Australia has invested in pedestrian facilities *Beautiful pedestrian bridge *Walkways along the river *Pleasing aesthetics


54 Bogota, Colombia has invested heavily in walking, cycling, & PA events


55 Ciclovia in Bogota On Sundays & holidays Many streets are closed To cars. Bike supplies & Repairs; volunteer Traffic controllers.
56 Pedestrian Bridge Redding, CA. The $23.5 million Pedestrian bridge Is now Redding s No. 1 tourist Attraction. Mayor Dick Dickerson. LA Times 6/3/07

57 Decisions about Climate change and Active living Are related
58 NEWS Safety from Crime in Walkability-by by-income Quadrants Income: p = <.0001 Walkability X Income: p = NEWS Safety from Crime (Mean *) Low Walk High Walk 2.6 Low Income High Income *All models adjusted for gender, age, education, ethnicity, # motor vehicles/adult in household, site, marital status, number of people in household, and length of time at current address. Neighborhood was included as a random effect to adjust for clustering.
59 Multi-Level Physical Activity Promotion Framework for Governments Initiators Leaders Strategies Change Mechanisms Outcomes Communications, Mass media Psychological Individual Interagency Task force, Broad Coalition, Work Groups Capacity & resources for change Evidence-based programs & Policies in schools, worksites, Community orgs, health care Local Coalitions, Events, Communications, Mass media Policies Urban planning & design, Transportation facilities, Recreation facilities, Zoning, Building codes Implementation of strategies Organizations Social Cultural Built Environment Incentives -Mission- Physical Activity (Recreation Transportation), Obesity, Injuries, Air Quality -Money- Health care Costs, Infrastructure Costs Population-Specific Strategies and Community Participation Research and Evaluation
Active and Green: Healthy Communities Are Sustainable Communities
 Active and Green: Healthy Communities Are Sustainable Communities James Sallis, PhD San Diego State University www.drjamessallis.sdsu.edu For LISC Webinar May 4, 2011 Goals of talk Physical inactivity
Blueprint for Active Living Communities: Innovative Solutions. James Sallis University of California, San Diego For IOM PA Workshop.
 Blueprint for Active Living Communities: Innovative Solutions James Sallis University of California, San Diego For IOM PA Workshop. April 15, 2015 Outline of Talk Do built environments matter? Progress
RESEARCH James F. Sallis San Diego State University
 An Active Living Program supported by The Robert Wood Johnson Foundation and administered by San Diego State University. Active Living and Parks: Using Research to Inform Practice Active Living RESEARCH
Health and Community Design: The Local Government Role in Promoting Active Living
 Health and Community Design: The Local Government Role in Promoting Active Living Rich Killingsworth, Director Active Living by Design National Program Office University of North Carolina School of Public
Built Environment and Older Adults: Supporting Smooth Transitions Across the Life- Span. Dr. Lawrence Frank, Professor and Bombardier UBC
 Built Environment and Older Adults: Supporting Smooth Transitions Across the Life- Span Dr. Lawrence Frank, Professor and Bombardier Chair @ UBC The Hidden Health Costs of Transportation - Frank et al
Sandra Nutter, MPH James Sallis, PhD Gregory J Norman, PhD Sherry Ryan, PhD Kevin Patrick, MD, MS
 Objectively Measured Environmental Correlates of Adolescent Physical Activity Sandra Nutter, MPH James Sallis, PhD Gregory J Norman, PhD Sherry Ryan, PhD Kevin Patrick, MD, MS San Diego State University
DO OUR NEIGHBORHOODS REALLY MATTER FOR CHILDREN S HEALTH AND PHYSICAL ACTIVITY?
 DO OUR NEIGHBORHOODS REALLY MATTER FOR CHILDREN S HEALTH AND PHYSICAL ACTIVITY? Brian E. Saelens, Ph.D. Seattle Children s Research Institute, University of Washington Childhood Obesity and Public Health
Promoting Health in Low-Wealth Communities: Physical Activity
 Promoting Health in Low-Wealth Communities: Physical Activity Deborah Cohen, MD, MPH Funded by NIEHS #P50ES012383; NHLBI # R01HL71244; HRSA-MCH # R40MC00303 Large Health Disparities Exist Among Low Income
Walkable Communities and Adolescent Weight
 Walkable Communities and Adolescent Weight Sandy Slater, PhD Assistant Professor, University of Illinois at Chicago, School of Public Health Research Scientist, UIC Institute for Health Research and Policy
Summary Report: Built Environment, Health and Obesity
 Research and education Built Environment Edmonton Project Summary Report: Built Environment, Health and Obesity Introduction In 2007 the Canadian Institutes of Health Research and the Heart and Stroke
February Funded by NIEHS Grant #P50ES RAND Center for Population Health and Health Disparities
 Urban Use and Physical Activity Deborah Cohen, Thom McKenzie, Amber Sehgal, Stephanie Williamson, Daniela Golinelli, Multi-Cultural Area Health Education Center (MAHEC) Funded by NIEHS Grant #P50ES012383
Childhood Obesity: A Policy Perspective
 Leadership for Healthy Communities Advancing Policies to Support Healthy Eating and Active Living Childhood Obesity: A Policy Perspective Elizabeth Hinman elizabeth@leadershipforhealthycommunities.org
Health, Transportation and Bicycling: Connecting the Dotted Lines
 Portland State University PDXScholar Urban Studies and Planning Faculty Publications and Presentations Nohad A. Toulan School of Urban Studies and Planning 11-17-2010 Health, Transportation and Bicycling:
Neighborhood Environment Profiles Related to Physical Activity and Weight Status among Seniors: A Latent Profile Analysis
 Neighborhood Environment Profiles Related to Physical Activity and Weight Status among Seniors: A Latent Profile Analysis Marc A. Adams, Ph.D. University of California, San Diego & Adjunct Assistant Professor
The Impact of Policy and Environmental Outcomes on Youth Physical Activity
 The Impact of Policy and Environmental Outcomes on Youth Physical Activity Childhood Obesity Conference, San Diego, CA June 30, 2011 Sandy Slater, PhD Assistant Professor, University of Illinois at Chicago,
What s Health Got to Do With It? Health and Land Use Planning
 What s Health Got to Do With It? Health and Land Use Planning CANDACE RUTT, PH.D. EXECUTIVE DIRECTOR APRIL 13 TH, 2016 Planning and Public Health Planning + Public Health Healthy Communities Healthier
Where do People Bicycle? The Role of Infrastructure in Determining Bicycle Behavior
 Portland State University PDXScholar Urban Studies and Planning Faculty Publications and Presentations Nohad A. Toulan School of Urban Studies and Planning 4-11-2008 Where do People Bicycle? The Role of
Perceptions of the Physical Environment Surrounding Schools & Physical Activity among Low-income, Urban, African American Adolescent Girls
 Perceptions of the Physical Environment Surrounding Schools & Physical Activity among Low-income, Urban, African American Adolescent Girls Erin Hager, PhD Candice Gormley, BS Laura Latta, MHS M. Reese
Prioritizing Transportation Policy and Funding for Active Transportation, Safety, Equity and Health
 Mayor Karl Dean, Chairman Prioritizing Transportation Policy and Funding for Active Transportation, Safety, Equity and Health Leslie A. Meehan, AICP Planning and Implementing the Active Community Webinar
Increasing Exercise Adherence through Environmental Interventions. Chapter 8
 + Increasing Exercise Adherence through Environmental Interventions Chapter 8 + Environmental Influences on Eating & Physical Activity (French, Story, & Jeffrey, 2001) Consumption of daily fat doubled
Health Impact Analysis for Integrated Regional Land Use and Transportation Plan
 Health Impact Analysis for Integrated Regional Land Use and Transportation Plan Hsi-Hwa Hu, Guoxiong Huang, Frank Wen, Simon Choi (Southern California Association of Governments) Margaret Shih (Los Angeles
IMPACT OF BICYCLE INFRASTRUCTURE IMPROVEMENTS IN NEW ORLEANS, LOUISIANA. Kathryn M. Parker MPH, Janet Rice PhD, Jeanette Gustat PhD
 IMPACT OF BICYCLE INFRASTRUCTURE IMPROVEMENTS IN NEW ORLEANS, LOUISIANA Kathryn M. Parker MPH, Janet Rice PhD, Jeanette Gustat PhD Background A comparison of both self-reported and objectively measured
Active Community Design: Why Here? Why Now?
 Active Community Design: Why Here? Why Now? Chris Holm Development Review Coordinator 20 April, 2015 Sacramento, California Our environment has changed North Natomas We ve rapidly urbanize our open space
Incorporating Health in Regional Transportation Planning
 Mayor Karl Dean, Chairman Incorporating Health in Regional Transportation Planning Leslie A. Meehan, AICP Center TRT Intervention Webinar January 29, 2013 Objectives for Today Background About the Nashville
Evaluation of San Diego's First CicloSDias Open Streets Event
 Evaluation of San Diego's First CicloSDias Open Streets Event Funded by a grant from The California Endowment San Diego State University School of Public Affair University of California San Diego Department
Traffic Safety Barriers to Walking and Bicycling Analysis of CA Add-On Responses to the 2009 NHTS
 Traffic Safety Barriers to Walking and Bicycling Analysis of CA Add-On Responses to the 2009 NHTS NHTS Users Conference June 2011 Robert Schneider, Swati Pande, & John Bigham, University of California
2014 peterborough city and county. active. transportation. & health. indicators primer
 2014 city and county active transportation & health indicators primer executive summary Walking, cycling and transit are good for our personal health, our local economies, and the environment. Understanding
The Impact of Transportation on Health: Evidence, Practice and the Case for Mode Shift
 The Impact of Transportation on Health: Evidence, Practice and the Case for Mode Shift WE BUILD A BRIGHTER FUTURE Loel Solomon, Ph.D. Vice President, Community Health Kaiser Permanente Transportation Research
SUSTAINABILITY, TRANSPORT, & HEALTH. Ralph Buehler, Virginia Tech
 SUSTAINABILITY, TRANSPORT, & HEALTH Ralph Buehler, Virginia Tech Prepared for National Academies Roundtable on Science and Technology for Sustainability 6 December 2013 Overview Trends in Motorization
Discussion: Bicycle Benefits
 Discussion: Bicycle Benefits 3 Bicycling has increased in popularity over the last decade as Americans realize its health, transportation, and financial benefits. Cities across the United States and within
About the Active Transportation Alliance
 About the Active Transportation Alliance Chicagoland s voice for better biking, walking and transit Founded 1985 7,000 members, ~33 full time staff Serve Chicago metro region 1 More Cars, More Driving
Active People, Healthy Nation Creating an Active America, Together
 National Center for Chronic Disease Prevention and Health Promotion Division of Nutrition, Physical Activity, and Obesity Active People, Healthy Nation Creating an Active America, Together October 19,
 2 3 40 35 30 25 20 15 10 5 0 1986 1987 1988 1989 1990 1991 1992 1993 1994 1995 1996 1997 1998 1999 Recommended Activity Physical Inactivity 4 90 89 89.3 88 87 87.1 86 85 85 84 83.9 83 82 81 1977 1983 1990
VOICES FOR HEALTHY KIDS: ACTIVE PLACES
 VOICES FOR HEALTHY KIDS: ACTIVE PLACES Let s get moving to help underser ved communities Deb Hubsmith, Director Keith Benjamin, Street Scale Campaign Manager Mikaela Randolph, Shared Use Campaign Manager
Background and Goals of SRTS
 Safe Routes to School Background and Goals of SRTS Oklahoma Kick-off May 4, 2011 The Good, the Bad, and the Ugly Fewer kids are biking and walking More parents are driving 1969 2009 48% walked or biked
The best indicator of an individual s and expanding access to parks and open space.
 Health & Wellness Create a Safe and Healthy Built Environment Artist s rendering, 2014 Health is important to Loveland residents, and stakeholders see the many strong connections between quality of life,
Thank you to our Conference Sponsors
 Thank you to our Conference Sponsors PLATINUM SILVER BRONZE SUPPORTER/EXHIBITOR #ulihealth Cities on the Move: Innovations in Active Transportation 9:15 a.m. 10:30 a.m. #ulihealth Moderator Rachel MacCleery
The Built Environment and Obesity
 The Built Environment and Obesity Physical Activity Research in New Orleans Jeanette Gustat, PhD, MPH Tulane University School of Public Health and Tropical Medicine Tulane University Prevention Research
Perryville TOD and Greenway Plan
 Perryville TOD and Greenway Plan Greenway Glossary Pathway: A bicycle and pedestrian path separated from motorized vehicular traffic by an open space, barrier or curb. Multi-use paths may be within the
Complete Streets Policy and Practice
 Complete Streets Policy and Practice presented by Leslie Phemister, Nancy Wagner and Kasey Holloway Active Transportation Alliance 1 Learning Objectives Understand the connection between public health
A Holistic Approach to Community Connectivity. 50 th International Making Cities Livable Conference Portland, OR June 2013
 A Holistic Approach to Community Connectivity 50 th International Making Cities Livable Conference Portland, OR June 2013 Founded 2008 About GP RED Research Education Advocacy Focus on Health, Recreation
FACTS AND FIGURES: MAKING THE CASE FOR COMPLETE STREETS IN LEE COUNTY
 FACTS AND FIGURES: MAKING THE CASE FOR COMPLETE STREETS IN LEE COUNTY Safety: Close to 5,000 pedestrians and bicyclists die each year on U.S. roads, and more than 70,000 are injured. [Mean Streets, Surface
Incorporating Health in Regional Transportation Planning
 Mayor Karl Dean, Chairman Incorporating Health in Regional Transportation Planning Leslie A. Meehan, AICP Center TRT Intervention Webinar January 29, 2013 Objectives for Today Background About the Nashville
Factors influencing choice of commuting mode
 Factors influencing choice of commuting mode Lin Yang J. Aaron Hipp, Deepti Adlakha, Christine Marx, Rachel Tabak, and Ross Brownson Active Living Research February 24, 2015 Active commuting Background
Appendices. 1. Diary of Database Searches 2. Glossary 3. Annotated Bibliography. Appendices
 Appendices 1. Diary of Database Searches 2. Glossary 3. Annotated Bibliography Appendices Appendix 1: Diary of Database Searches Appendix 1: Diary of Database Searches HBEP literature review Appendix
2014 Regional Bicycle and Pedestrian Study Evaluation Tools Leslie A. Meehan, AICP MPO Technical Coordinating Committee Meeting April 1, 2015
 Mayor Mayor Kenneth Karl Dean, Wilber, Chairman 2014 Regional Bicycle and Pedestrian Study Evaluation Tools Leslie A. Meehan, AICP MPO Technical Coordinating Committee Meeting April 1, 2015 Evaluation
Categorizing Cyclists: What Do We Know? Insights from Portland, OR
 Categorizing Cyclists: What Do We Know? Insights from Portland, OR Jennifer Dill, Ph.D. Professor, Urban Studies & Planning Director, Oregon Transportation Research & Education Consortium (OTREC) Portland
Proximity of Parks and Schools Is Associated with Physical Activity in Adolescent Girls
 H e a l t h Proximity of Parks and Schools Is Associated with Physical Activity in Adolescent Girls An Ancillary Study to The Trial of Activity in Adolescent Girls (TAAG) RAND Deborah Cohen Scott Ashwood
Section 8. Partnerships and Funding
 This section discusses the potential partnership and funding options that the Town should consider in order to assist with the implementation of the recommendations provided in the Plan. Section 8. Partnerships
TR NEWS. Public Health and Transportation. Innovation, Intervention, and Improvements NUMBER 299 SEPTEMBER OCTOBER 2015
 TR NEWS NUMBER 299 SEPTEMBER OCTOBER 2015 Public Health and Transportation Innovation, Intervention, and Improvements Public Health and Transportation Measuring the Health Benefits of Walking and Bicycling
Strategies to Promote the Availability of Affordable Healthy Food and Beverages
 Strategies to Promote the Availability of Affordable Healthy Food and Beverages CDC Recommended Strategies and Measurements Strategy #1: Communities Should Increase Availability of Healthier Food and Beverage
El Paso County 2040 Major Transportation Corridors Plan
 El Paso County 2040 Major Transportation Corridors Plan Connect-our-County Online Transportation User Survey Preliminary Results June 24, 2010 Years of Residence 2. How many years have you LIVED HERE?
Health and Transportation: Integrated Transport and Health Impact Model in the Nashville Region. Leslie Meehan, AICP June 2015
 THE HONORABLE Mayor KEN WILBER, Karl Dean, CHAIRMAN Chairman Health and Transportation: Integrated Transport and Health Impact Model in the Nashville Region Leslie Meehan, AICP June 2015 Metropolitan Planning
Peel Health Initiatives Health and Urban Form
 Region of Peel Public Health Peel Health Initiatives Health and Urban Form alpha Conference June 9, 2008 Gayle Bursey Director, Chronic Disease and Injury Prevention Declaration No part of the information
NASHUA REGIONAL PLANNING COMMISSION REGIONAL BICYCLE AND PEDESTRIAN PLAN
 NASHUA REGIONAL PLANNING COMMISSION REGIONAL BICYCLE AND PEDESTRIAN PLAN June, 2005 Prepared by the Nashua Regional Planning Commission 2005 NRPC Regional Bicycle and Pedestrian Plan- JUNE 2005 ACKNOWLEDGEMENTS
National Association of REALTORS National Smart Growth Frequencies
 September 520, 2017 3,000 Weighted Online Respondents National Association of REALTORS National Smart Growth Frequencies Q.2 The first question is about the quality of life in your community. How satisfied
Making the Case for Healthy Planning & Initiatives
 Making the Case for Healthy Planning & Initiatives George Berger, AICP NC-ARTS Region 4 Coordinator Cabarrus REACH Safe Routes to School Coordinator Counties Served: Alexander, Cabarrus, Catawba, Cleveland,
CDC priorities to promote physical activity policy, system, and environmental (PSE) approaches: Plan4Health
 approaches: Plan4Health") CDC priorities to promote physical activity policy, system, and environmental (PSE) approaches: Plan4Health Claire Heiser, MS, RD Public Health Advisor Program Development and Evaluation Branch Division
CDC priorities to promote physical activity policy, system, and environmental (PSE) approaches: Plan4Health Claire Heiser, MS, RD Public Health Advisor Program Development and Evaluation Branch Division
Carbonless Footprints: Health and Environmental benefits of Active Transportation
 Carbonless Footprints: Health and Environmental benefits of Active Transportation Dr. Lawrence Frank, Professor and Bombardier Chair in Sustainable Transportation - University of British Columbia Health
PEOPLE ARE PEDESTRIANS BY DESIGN JOIN THE MOVEMENT AT
 PEOPLE ARE PEDESTRIANS BY DESIGN JOIN THE MOVEMENT AT WWW.WALKDENVER.ORG Our Vision: In 2040, Denver will be the most walkable city in the United States. As a result, its residents will be the country
TOWN OF WILLIAMSTON, SC BICYCLE AND PEDESTRIAN MASTER PLAN TOWN OF WILLIAMSTON, SC BICYCLE AND PEDESTRIAN MASTER PLAN
 TOWN OF WILLIAMSTON, SC BICYCLE AND PEDESTRIAN MASTER PLAN Americans Want Choices 55% of Americans would rather drive less & walk more. Transit use is growing faster than population or highway travel.
Public Healthy and Community Design
 Public Healthy and Community Design Jeffery Rosenhall, MA, LCI #2312 Health Program Manager, CDPH April 24, 2017 Stairwell interventions Urban bike track Public health and planning: A Road Map Planning,
Neighborhood environments and physical activity in youth: from research to practice
 Neighborhood environments and physical activity in youth: from research to practice Jordan Carlson, PhD Center for Children s Healthy Lifestyles and Nutrition Children s Mercy Kansas City Contributors
Public Health in the Public Realm: Influencing Street Design with Health in Mind Dr. David McKeown Medical Officer of Health
 Public Health in the Public Realm: Influencing Street Design with Health in Mind Dr. David McKeown Medical Officer of Health Complete Streets Forum April 23, 2010 Common Goals of Public Health and Complete
Leadership for Healthy Communities A 10 Year Retrospective Dr. Kristen Welker-Hood November 15, 2014
 Leadership for Healthy Communities A 10 Year Retrospective Dr. Kristen Welker-Hood November 15, 2014 About Us Leadership for Healthy Communities (LHC) is a national program of the Robert Wood Johnson Foundation
Helping Nova Scotians Achieve Better Health Through Walking
 Helping Nova Scotians Achieve Better Health Through Walking This publication is based on a report prepared by Mike Arthur for Heart and Stroke Foundation and funded by the Nova Scotia Department of Communities,
City of Novi Non-Motorized Master Plan 2011 Executive Summary
 City of Novi Non-Motorized Master Plan 2011 Executive Summary Prepared by: February 28, 2011 Why Plan? Encouraging healthy, active lifestyles through pathway and sidewalk connectivity has been a focus
Streets. Safe for Pedestrians 20% 2nd 5,000. Are We People-Friendly?
 Streets Safe for Pedestrians 20% Pedestrian deaths account for more than of all traffic-related fatalities in California each year. 600 More than people are killed and another 13,000 are injured every
Richard J Jackson MD, MPH, FAAP.
 We Are What We Eat And What We Build Richard J Jackson MD, MPH, FAAP HonASLA, HonAIA dickjackson@ucla.edu http://designinghealthycommunities.org/oram/ USA Today 10/20/2011 Commuting by driving is not
WALK- AND bike-friendly TURLOCK
 WALK- AND bike-friendly TURLOCK Ideas to Encourage Walking and Biking Benefits to the COMMUNITY Get Connected People who walk and bike have many more opportunities for casual interactions with friends
Community & Transportation Preferences Survey U.S. Metro Areas, 2015 July 23, 2015
 Community & Transportation Preferences Survey U.S. Metro Areas, 2015 July 23, 2015 Realtor.org trec.pdx.edu 1 Highlights: Generation gaps in everyday travel Only 71% of Millennials like driving (the lowest
Designing Healthier Environments to Conquer Disease Epidemics: Successes in NYC and Elsewhere. Karen K. Lee, MD, MHSc
 Designing Healthier Environments to Conquer Disease Epidemics: Successes in NYC and Elsewhere Karen K. Lee, MD, MHSc Can Design Help Address Today s Health Epidemics? THE 19th CENTURY: Infectious Diseases
Complete Streets 101: The Basics
 Complete Streets 101: The Basics Michigan Municipal League - Capital Conference March 21, 2017 Chip Smith, AICP - Senior Planner - Wade Trim Inc. and City Council member City of Ann Arbor 2017 MML Capital
Transit-Driven Complete Streets
 Questions: Type questions into the box at bottom of webinar panel. Panelists for today s webinar: Nimotalai Azeez, Program Associate with the National Complete Streets Coalition Rich Weaver, Director of
Multimodal Transportation Plan
 Multimodal Transportation Plan The Multimodal Transportation Plan will accommodate MILLENIALS ARE DRIVING LESS. WE CANNOT BUILD OUR WAY all modes of transportation by keeping pedestrians, OUT OF CONGESTION.
Agenda. US-1 Corridor Study and HIA Update. Pathway Diagram / Primary Indicators. Research Questions. Linking Multimodal Improvements to Indicators
 Icebreaker Agenda US-1 Corridor Study and HIA Update Pathway Diagram / Primary Indicators Research Questions Linking Multimodal Improvements to Indicators Vulnerable Populations US-1 Corridor Study Vision
WALK Friendly Communities: Creating Vibrant, Inclusive Places for People
 WALK Friendly Communities: Creating Vibrant, Inclusive Places for People Walkers are the indicator species for vibrant communities ~ Dr. Rodney Tolley, Director, Walk21 Imagine yourself walking safely
OC Healthy Communities Forum. The proportion of the population that live within a half mile of a major transit access point.
 OC Healthy Communities Forum Transit Access The proportion of the population that live within a half mile of a major transit access point. Use of public transit can result in decreased greenhouse gas emissions
Community & Transportation Preferences Survey
 Community & Transportation Preferences Survey Webinar: August 5, 2015 Hugh Morris, AICP, LEED Realtor.org Jennifer Dill, Ph.D. trec.pdx.edu 1 Introduction National Association of Realtors Over 1,000,000
2015 Florida Main Street Annual Conference. Complete Streets Equal Stronger Main Streets
 WHAT ARE COMPLETE STREETS? CASE STUDIES COMPLETING YOUR MAIN STREET 2015 Florida Main Street Annual Conference St. Petersburg, Florida August 19, 2015 WHAT ARE COMPLETE STREETS? CASE STUDIES COMPLETING
International Physical Activity Prevalence Study SELF-ADMINISTERED ENVIRONMENTAL MODULE
 International Physical Activity Prevalence Study SELF-ADMINISTERED ENVIRONMENTAL MODULE There is increasing interest in the contextual (environmental) barriers that prevent or limit the opportunity to
Creating Vibrant & Healthy Cities for ALL
 Creating Vibrant & Healthy Cities for ALL Gil (Guillermo) Penalosa Founder & Chair 8 80 Cities World Urban Parks Penalosa_G Association of Flemish Cities & Municipalities Ghent, Belgium October 12 th,
2017 North Texas Regional Bicycle Opinion Survey
 2017 North Texas Regional Bicycle Opinion Survey Sustainable Development Program Kevin Kokes, AICP Public Meetings April, 2018 North Central Texas Council of Governments MPO for the Dallas-Fort Worth Region
Bike Planner Overview
 Bike Planner Overview A Web-based Sketch Planning Tool for Los Angeles County presented by William E. Walter, GISP April 12, 2017 GIS-T Transportation leadership you can trust. Bike Planner Overview Guiding
WILMAPCO Public Opinion Survey Summary of Results
 Wilmington Area Planning Council WILMAPCO Public Opinion Survey Summary of Results Prepared by: 2955 Valmont Road, Suite 300 Boulder, Colorado 80301 t: 303-444-7863 f: 303-444-1145 www.n-r-c.com Table
Chapter 2. Bellingham Bicycle Master Plan Chapter 2: Policies and Actions
 Chapter 2 Bellingham Bicycle Master Plan Chapter 2: Policies and Actions Chapter 2: Policies and Actions The Bicycle Master Plan provides a road map for making bicycling in Bellingham a viable transportation
Chapter 14 PARLIER RELATIONSHIP TO CITY PLANS AND POLICIES. Recommendations to Improve Pedestrian Safety in the City of Parlier (2014)
") Chapter 14 PARLIER This chapter describes the current status and future plans for biking and walking in the City of Parlier. RELATIONSHIP TO CITY PLANS AND POLICIES The Parlier General Plan is the primary
Chapter 14 PARLIER This chapter describes the current status and future plans for biking and walking in the City of Parlier. RELATIONSHIP TO CITY PLANS AND POLICIES The Parlier General Plan is the primary
9/22/2014 VIA . RE: Butano Apartments Pre App (PAMP )
") 9/22/2014 VIA EMAIL Surinder Singh, Senior Planner Planning and Environmental Review Division Sacramento County 827 7th Street, Second Floor RE: Butano Apartments Pre App (PAMP2014-00012) Dear Mr. Singh:
9/22/2014 VIA EMAIL Surinder Singh, Senior Planner Planning and Environmental Review Division Sacramento County 827 7th Street, Second Floor RE: Butano Apartments Pre App (PAMP2014-00012) Dear Mr. Singh:
MASTER BICYCLE AND PEDESTRIAN PLAN
 VILLAGE OF NORTHBROOK MASTER BICYCLE AND PEDESTRIAN PLAN DRAFT PLAN OPEN HOUSE May 2, 2018 AGENDA 1. Community Engagement 2. Vision and Goals 3. General Structure of Plan 4. Recommendations Overview 5.
Complete Streets Basics and Benefits
 Complete Streets Basics and Benefits November 14, 2017 Complete Streets Workshop Ann Ogoreuc, AICP, Allegheny County Economic Development Hannah E. Hardy, Allegheny County Health Department Benefits of
EXECUTIVE SUMMARY: TRANSIT-ORIENTED DEVELOPMENT IN SMITHS FALLS, ONTARIO; A COMPARISON BETWEEN TWO SITES
 EECUTIVE SUMMARY: TRANSIT-ORIENTED DEVELOPMENT IN SMITHS FALLS, ONTARIO; A COMPARISON BETWEEN TWO SITES Topic and Purpose In 2007, the Mayor of Ottawa s Task Force on Transportation suggested adding a
Market Factors and Demand Analysis. World Bank
 Market Factors and Demand Analysis Bank Workshop and Training on Urban Transport Planning and Reform. Baku, April 14-16, 2009 Market Factors The market for Public Transport is affected by a variety of
10/30/2012 VIA
 10/30/2012 VIA EMAIL David Hung, Associate Planner Community Development Department, Current Planning Division City of Sacramento 300 Richards Blvd., 3 rd Floor Sacramento, CA 95811 RE: The Cannery On-Site
Complete Streets: Building Momentum in Connecticut
 Complete Streets: Building Momentum in Connecticut Tri-State Transportation Campaign, 2012 What are Complete Streets? Complete Streets are safe, comfortable, and convenient for travel for everyone, regardless
Proposed. City of Grand Junction Complete Streets Policy. Exhibit 10
 Proposed City of Grand Junction Complete Streets Policy Exhibit 10 1 City of Grand Junction Complete Streets Policy Vision: The Complete Streets Vision is to develop a safe, efficient, and reliable travel
Creating Complete Streets to Accommodate All Users
 Creating Complete Streets to Accommodate All Users Peter Lagerwey, Toole Design Group plagerwey@tooledesign.com Brian Dougherty, Seattle DOT brian.dougherty@seattle.gov International Conference on Urban
RESOLUTION NO ?? A RESOLUTION OF THE CITY OF NEPTUNE BEACH ADOPTING A COMPLETE STREETS POLICY
 RESOLUTION NO. 2018-?? A RESOLUTION OF THE CITY OF NEPTUNE BEACH ADOPTING A COMPLETE STREETS POLICY WHEREAS, safe, convenient, and accessible transportation for all users is a priority of the City of Neptune
CONNECTING PEOPLE TO PLACES
 CONNECTING PEOPLE TO PLACES 82 EAST BENCH MASTER PLAN 07 Introduction The East Bench transportation system is a collection of slow moving, treelined residential streets and major arteries that are the
8/31/2016 VIA . RE: Freeport Arco Fuel Station (P16-039)
") 8/31/2016 VIA EMAIL Garrett Norman, Assistant Planner City of Sacramento Community Development Department 300 Richards Boulevard, 3 rd Floor Sacramento, CA 95811 RE: Freeport Arco Fuel Station (P16-039)
8/31/2016 VIA EMAIL Garrett Norman, Assistant Planner City of Sacramento Community Development Department 300 Richards Boulevard, 3 rd Floor Sacramento, CA 95811 RE: Freeport Arco Fuel Station (P16-039)
INTEGRATING HEALTH INTO SCENARIO PLANNING
 INTEGRATING HEALTH INTO SCENARIO PLANNING Dr. Lawrence Frank, President UD4H, Inc. Seattle, Washington Professor in Population and Public Health and Urban Planning University of British Columbia Outline