An Analysis of the Efficacy of Rectangular-shaped Rapid-Flash LED Beacons to
|
|
|
- Chad Harris
- 6 years ago
- Views:
Transcription
1 An Analysis of the Efficacy of Rectangular-shaped Rapid-Flash LED Beacons to Increase Yielding to Pedestrians Using Crosswalks on Multilane Roadways in the City of St. Petersburg, FL. Dr. Ron Van Houten & Dr. J.E. Louis Malenfant Center for Education and Research in Safety 1
2 Executive Summary 4 Introduction 5 Experimental Method 11 Participants and setting 11 Apparatus 11 Measures 12 Yielding to pedestrians 14 Yielding distances 14 Driver passed or attempted to pass stopped vehicle 16 Car behind yielding car jams on brakes 16 Experimental design 16 Results 17 Yielding right-of-way to pedestrians 17 Yielding distance 20 Driver Passed or Attempted to Pass Stopped Vehicle 21 Abrupt braking 21 Night Evaluation of Rapid-Flash Devices 21 Inter-observer agreement 22 Statistical analysis 22 Comparison with Overhead and Side-Mounted Beacon 24 Participants and setting 24 Apparatus 24 Experimental design 25 Statistical analysis 26 Driver yielding behavior 26 Driver yielding distance behavior 27 Inter-observer agreement 28 Data for All 18 Sites 29 Data from Other Sites 29 Discussion 33 Determining a warrant for the rectangular-shaped rapid flash system 36 References 37 Appendix
3 LIST OF FIGURES FIGURE 1. FIGURE 2 FIGURE 3 FIGURE 4 FIGURE 5 FIGURE 6 FIGURE 7 FIGURE 8 FIGURE 9 Images depicting potential cause and screening effect of the multiple threat. Picture of two forward-facing rectangular-shaped LED beacon housing Photograph of the rectangular-shaped rapid flash LED beacon system s pedestrian activation. Photograph showing flags used for measuring motorists yielding distance as well as an arrow indicating the dilemma zone as calculated using the ITE signal timing formula. Line graphs showing initial yielding compliances for baseline, treatment conditions, and as a set of one year follow-up collection phases. The graphs represent site locations, in order, 22 nd Ave. N & 5 th St., 1 st St. & 37 th Ave. N, 31 st St. & 54 th Ave. N, and 58 th St. & 3 rd Ave. N. Line graph illustrating nighttime data during initial data collection phases as well as one year follow up for location 1 st. St. & 37 th Ave. N. Photographs showing a traditional over-head circular incandescent flashing beacon (left photograph) and a round side-mounted beacon (right photograph). Set of two bar graphs illustrating the effectiveness of the rectangularshaped rapid flash LED beacon when compared to either a traditional over-head mounted or side-mounted circular flashing beacon. Bar graph illustrating the effectiveness of the rectangular-shaped rapid flash LED beacon systems in eliciting yielding compliance averaged across sites for a duration up-to and including one year. One site has also been included that was evaluated at a two year interval. FIGURE 10 Photograph of one of the two installations in Miami Dade County. The device is a median unit shown during activation. TABLE 1 TABLE 2 Table statistical results from two-sample t-test of independent samples. Table of descriptive statistical analysis of yielding distances in percentages recorded during each treatment condition averaged across sites. 3
4 EXECUTIVE SUMMARY This evaluation examined research in St. Petersburg, FL. on the efficacy of the rectangular LED stutter flash beacon and the efficacy of a rectangular side mounted stutter-flash LED beacon system to increase motorist yielding to pedestrians in St. Petersburg, FL. Because the percentage of drivers yielding to pedestrians during baseline was so low in the city of St. Petersburg this evaluation represented a rigorous test of the rectangular stutter flash crossing system. This study reports on the day and nighttime effects of these devices on several roads in the city of St. Petersburg as well as long term citywide follow-up citywide data collected at 18 sites. We also compared the efficacy of the rectangular stutter flash beacon with a standard overhead flashing yellow beacon and a side-mounted standard flashing yellow beacon. The results indicated that the device increased yielding levels from single digit or low levels up to 20% to 30% to between 80 and 90% at most sites, and that yielding levels persisted for up to two years and did not decline over time. At several multilane pedestrians crossings the device produced yielding levels that are equivalent to a traffic signal. No other device without a red indication has produced similar yielding data. It is our recommendation that this system replace the ITS crosswalks in the city crosswalk report. These data are similar to those obtained in the city of Miami, FL. Based on these findings and the relatively low cost of this device we have recommended changes to the installation warrant allowing installation at other sites where it can be beneficial to the community. 4
5 INTRODUCTION Motorists often fail to yield right-of-way to pedestrians in crosswalks. Thus, being a pedestrian can be extremely dangerous. During the three-year period of 2004 through the end of 2006 there were a total of 14,340 pedestrian fatalities and 193,000 pedestrian injuries resulting from pedestrian-automobile crashes nation-wide (National Highway Traffic Safety Administration [NHTSA], 2008). Decreasing the occurrence of these crashes and increasing the incidence of drivers yielding right-of-way to pedestrians would increase both safety and the overall experience of walking. The majority of pedestrian crashes occur at mid-block crossings. Any alternative traffic control device that is not a traffic signal has historically had minimal effect on motorist yielding behavior on multilane roads. Because of the high cost of traffic signals their installation is restricted to intersections with high motor vehicle and pedestrian usage. The traffic signal warrant also limits the application of such devices to high pedestrian volume areas. One alternative to a traffic signal is the use the High Intensity Activated Crosswalk (HAWK) signal to assist pedestrians in crossing major streets. The HAWK beacon signal consists of two RED signal indications above a YELLOW signal indication forming a beacon signal that remains dark until activated by a pedestrian. Once activated the signal initiates a flashing yellow indication to warn approaching drivers, followed by a solid yellow identical to a normal signal to warn of impending requirement to stop. The solid yellow is followed by a brief solid red indication, which is followed by a wig wag flashing red signal requiring drivers to stop before proceeding. Although this signal has proven very effective in the city of Tucson, AZ, it is considerably more expensive to install than the relatively inexpensive rectangular stutter flash beacons evaluated in this report. 5
6 Turner et al. (2006) evaluated multiple treatments in an effort to increase motorist yielding to pedestrians at uncontrolled crosswalk locations. The Turner study included 11 separate treatments at sites across the country. The treatments included red signal devices (e.g., mid-block signals), active when present devices (e.g., pedestrian crossing flags, in-roadway warning lights and overhead flashing yellow beacon both with push button activation), and enhanced and/or high-visibility devices (e.g., in-street crossing signs, high-visibility signs and median refuge islands). Turner et al. found the most effective treatment for increasing yielding were the red signal devices. The treatment type that was second best, that did not include a red beacon, were the in-street crossing signs (87%) compliance. It should be noted however that these devices were evaluated on smaller two-lane roadways and would not perform as well on larger arterial roadways. The least effect devices were the high visibility signs (17%). Along with increased yielding compliance it is important to increase yielding distance on multilane roadways, particularly those with high vehicle traffic volumes. When a motorist yields close to the crosswalk on a multilane road they may block the ability of the pedestrian to see approaching traffic (Figures 1) in the lane adjacent to the yielding vehicle as well as blocking the ability of any approaching vehicle to see the crossing pedestrian. Crashes that result from this type of visual screening are referred to as multiple threat crashes (Van Houten et al., 2001). The probability of this occurring greatly increases on multi-lane roadways with a high ADT because as traffic volume increases, the chance that a vehicle will be approaching in a lane adjacent to the one in which a driver is yielding also increases. This increase in probability further stresses the need for yielding at increased distances at multilane crosswalks. With motorists yielding 6
7 at further distances, the screening effect is reduced thereby decreasing the chance that a motorist may strike a pedestrian. Van Houten (2001) explains two advantages, other than a decrease in the screening effect, produced by increased yielding distances. One additional advantage is a reduction in the chance of a vehicle approaching from behind the yielding vehicle that attempts to pass and go around the yielding vehicle will not see crossing pedestrian and not be able to stop. Second, there is a decrease in the chance that a yielding vehicle is struck from behind and propelled forward into the pedestrian. QuickTime and a decompressor are needed to see this picture. Figures 1. Multiple threat renderings One method for increasing yielding distance is in-roadway is the use of advance yield markings and Yield Here signs placed in advance to the crosswalk (Figures 2, 5, & 6). Van Houten, R. McCusker, D. Huybers, S., Malenfant, J.E.L., & Rice-Smith, D. (2003) evaluated the separate and combined effects of in-roadway advance yield markings and sign prompts. The advance yield markings consisted of a row of large white triangles made of reflective material that were placed in advance of crosswalks. The sign prompts were Yield Here to Pedestrian signs with either a white or yellowgreen background. These signs, when evaluated, were placed along side the in-roadway markings. The measures recorded were evasion conflicts and motorist yielding distances. The authors defined evasion conflicts as either the motorist swerving and/or braking 7
8 abruptly to avoid striking a pedestrian or either the pedestrian running, lunging, and/or jumping to avoid being struck by a vehicle. During baseline, evasion conflicts occurred during 15.5% of the crossings. Either sign decreased evasion conflicts by about 10% when compared to baseline. When the white sign was evaluated along with the roadway markings, evasion conflicts decreased to about 2.5%. Either sign also increased yielding at 3 meters or greater by about 20% over baseline. The white sign and roadway markings combination increased yielding 33% over the baseline condition. In a second experiment, (Huybers, Van Houten & Malenfant, 2004) the authors reversed the order of treatment introduction. In this experiment the in-roadway markings were evaluated alone first followed by the addition of the white signs. The markings alone decreased the average number of conflicts from 17.3% during baseline to 5.4%. The addition of the white sign showed no change in evasion conflicts. The markings also increased those yielding at 6 meters or more from 14.2% during baseline to 51% during treatment. The addition of the white sign to the roadway markings showed little change. Because of the risk of multiple threat signs on multilane roads with a high ADT, advance yield markings should be used whenever crosswalks are marked on such roads. Although advance yield or stop markings can increase the safety of crosswalks on multilane roads, they only produce a small increase in driver yielding. One inexpensive device to increase yielding rates on multilane roads is the use of pairs of rectangular yellow LED beacons that employ a stutter flash pattern similar to that used on emergency vehicles. This study evaluated the efficacy of the rectangular rapidflash LED flash beacons (the housing is shown in Figure 2) mounted to pedestrian signs along with advance yield markings during daytime and nighttime operation with and 8
. Figure 2.")
9 without a median island or pedestrian refuge island (see Figure 3 for a photograph of the beacon system attached to the pedestrian sign). Figure 2. A picture of the rectangular-shaped rapid flash LED beacon housing. 9


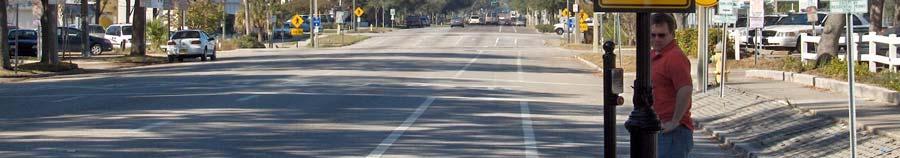
10 Figures 3 - A photograph of the rectangular-shaped rapid flash LED beacon system. 10
11 EXPERIMENTAL METHOD Participants and Setting Participants consisted of drivers traveling on 18 multilane roads in the city of St. Petersburg, Florida. More detailed evaluations were performed at the following locations: 1 st Street south of 37 th Avenue North; 58 th Street south of 3 rd Avenue North; 22 nd Avenue 7 th Street; and 31 st Street north 54 th Avenue South. The crosswalk at 1 st Street traversed four lanes, had a posted speed limit of 35MPH, and an ADT (Average Daily Traffic Count) of 8,596. This location provided a crossing between two bus stops and included a pedestrian refuge island in the middle of the crosswalk. The 58 th St. crosswalk traversed four lanes, had a posted speed limit of 35 MPH, and an ADT of 19,192. It also had a refuge island and provided a crossing for the residents of a near-by retirement center. The 22 nd Avenue North crosswalk traversed four lanes, had a posted speed limit of 35 MPH, and an ADT of 18,367. It is equipped with a refuge island and provided crossing for neighborhood residents to and from a large dog park. The 31 st St. crossing traversed three lanes at the crossing itself, had a posted speed limit of 35 MPH, and an ADT of 9,600. It had a refuge island and provided crossing between an over-flow parking lot and a large community sports complex. Each of the above sites is on roads carrying two-way traffic. Each site also had a Yield Here to Pedestrian advance yielding sign approximately 30 ft. in advance of the crosswalk along with the in-roadway advance yield markings. The data for these four sites will be presented first. Apparatus The treatment of primary interest in this experiment was two (2) rectangular LED flashing beacons as shown in Figure 2. The LED flashers on the front and back were 11
12 each six (6) inches wide, 2.5 inches high, and placed nine (9) inches apart. Each unit was dual indicated (LED's on front and back). Each side of the LED beacon flashed in a wigwag flashing sequence (left light on, then right) - the two LED's in combination flashed 190 times in the wig-wag flashing sequence during a 30 second cycle. Of the two LED's, the Left LED, flashed Two times (in a slower type of a rapid flash) each time it was energized followed by the Right LED, which flashed in a very fast rapid three (3) flash volley when energized. Four (4) signs along with beacons were installed at each crosswalk. Radio frequency transmitters linked the devices so a depression of any of the pedestrian call buttons activated the flashers on all four signs. A separate LED facing the pedestrian flashed to indicate to pedestrians that the system was operating. The system also presented an audible message instructing pedestrians that the light flashing across the street indicates that the device was operating, and instructing them to wait for cars to stop before crossing. The comparison device included a pre-existing traditional over-roadway incandescent yellow beacon. This beacon was located at the 58 th St. site described above. The system was activated with a pedestrian call button. The standard traditional systems employed two 12-inch diameter yellow beacons facing each direction of traffic. The beacons flashed at a rate of 55 times per minute. Measures During each session, data were collected on a sample of 20 pedestrian crossings. These crossings occurred when vehicles were present that could influence crossing behavior. Data were collected during both day and nighttime hours at two of these sites. All data were collected on weekdays when it was not raining. Observers measured the following 6 behaviors: the number of drivers who did and did not yield to pedestrians in 12
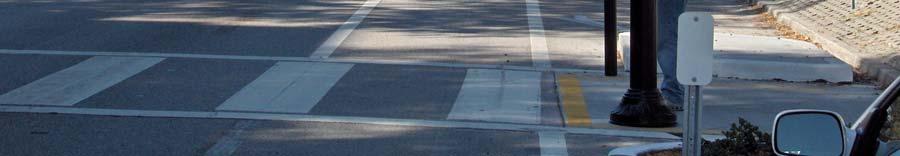
13 crosswalks, the percentage of drivers who yielded at <10ft., 10ft.-20ft., 20ft.-30ft., 30ft.- 50ft., 50ft.-70ft., 70ft.-100ft., and >100ft, the number of cars that passed or attempted to pass a stopped/yielding vehicle, and the number of cars that demonstrated a sudden and heavy, use of brakes behind a stopped car. Driver Yielding to Pedestrians Observers scored the percentage of motorists yielding and not yielding to pedestrians. A motorist was scored as yielding if he or she stopped or slowed and allowed the pedestrian to cross. A motorist was scored as not yielding if he or she passed in front of the pedestrian but would have been able to stop when the pedestrian arrived at the crosswalk. The ITE signal timing formula was used to determine the duration of the yellow signal phase on traffic lights was used to determine whether a driver could safely stop. Calculating the distance before which a motorist can safely stop for a pedestrian is essentially the same problem as calculating the distance that a motorist can stop for a traffic signal that changes to red. Traffic engineers use the signal-timing formula (Institute of Transportation Engineers, 1985), which takes into account driver reaction time, safe deceleration rate, the posted speed, and the grade of the road. A landmark associated with this distance was identified for vehicle approach to the crosswalk. The landmark at three of the sites was the start of a solid line lane divider painted on the roadway in place of the dashed lane lines (Figure 3). A fourth location was marked with white X s at the threshold point. Motorists who passed this landmark before the pedestrian started to cross could be scored as yielding to pedestrians but not for failing to yield because they may not have sufficient distance to safely stop. Motorists beyond the landmark when the pedestrian entered the crosswalk could be scored as yielding or not yielding because they had sufficient distance to safely stop. When the pedestrian first 13
14 started to cross, only drivers in the first half of the roadway were scored for yielding (e.g., approaching vehicles). Once the pedestrian reached the median, the yielding behaviors of motorists in the remaining two lanes were scored. This procedure was followed because it conformed to the obligation of motorists specified in the Florida Statutes. Staged crossings always followed a specific crossing protocol. First, the pedestrian placed one foot in the crosswalk when an approaching vehicle was just beyond the ITE dilemma zone. If the vehicle made no attempt to stop, the pedestrian did not proceed to cross and scored the vehicle as not yielding. If the vehicle clearly began to yield and the next lane was free, the staged pedestrian would begin crossing. The staged pedestrian always stopped just before the lane-dividing line and made sure the next lane was clear before proceeding. If a large gap appeared the staged pedestrian continued crossing to the median island where this protocol was continued until the crossing was complete. This is essentially the protocol followed by police officers when they conduct pedestrian crossing enforcement sting operations. This protocol ensures the safety of the staged pedestrians. Residents were only scored if they initiated a crossing in the same manner as the staged pedestrian by placing at least one foot in the crosswalk. Pedestrians that did not place a foot into the crosswalk were not scored because according to the Florida Statutes, drivers are not required to yield unless the pedestrian is in the crosswalk. Yielding distance The distances yielding motorists yielded in advance of the crosswalk was recorded. Each yielding motorist generated a yielding distance. The yielding distance was recorded by observing which of several colored flags the motorist yielded behind (see Figure 4). 14

15 Figure 4. The yellow arrow marks the dilemma zone calculated using the ITE signal timing formula. This Figure also shows the flags used to judge how far the motorists yielded in advance of the crosswalk. A series of different colored small utility-like flags were placed along side of the curb in each direction of traffic at the distances of 10ft., 20ft., 30ft., 50ft., 70ft., and 100ft. The colors of the flags were red, orange, yellow, green, blue, and red, respectively. This provided a simplified system for recording the distance motorists yielded in advance of 15
16 the crosswalk within the following distance categories: <10ft., 10ft.-20ft., 20ft.-30ft., 30ft.-50ft., 50ft.-70ft., 70ft.-100ft., and >100ft. The distance a motorist yielded in advance of the crosswalk was recorded only after the pedestrian had completely cleared the lane, was no longer in the path of the vehicle and, thus, the vehicle posed no threat. Yielding vehicles and their distances were recorded only on the front vehicles in each lane. That is to say that if the first car in each of four lanes yielded, only their yielding, distance, and other data were recorded. No data were recorded on the vehicles stopped behind the front cars due to the fact that it is impossible to discriminate whether the back vehicles stopped in order to yield to a pedestrian, to avoid striking the yielded vehicle in front of it, or both. Driver passed or attempted to pass stopped vehicle A driver was recorded as passing a stopped vehicle if they passed a vehicle that was yielding to the pedestrian. A driver was recorded as attempting to pass a stopped vehicle if they did not yield until after they were along side, or past, a yielding vehicle or if the driver behind a yielding vehicle changed lanes to go around but then yielded. This action is an offense under the Florida Statutes. Car behind yielding car jams on brakes A car was recorded as jamming on brakes if they were behind a yielding car and the front-end of the car was observed taking a sudden movement toward the ground. Design of Experiment Each session consisted of 20 crossings each. After collecting baseline data on all four roads the rectangular LED beacons were installed in a staggered fashion following a multiple baseline across sites design. The traditional overhead beacon was evaluated prior to the stutter flash beacon at the 58 th Street site. Because this treatment only produced a 16
17 small increase in yielding a return to baseline was not implemented prior to the introduction of the rectangular LED beacon at this site. The rectangular LED beacon was first only installed on each side of the road for a total of two beacon systems per site. Next two additional beacons were added to the pedestrian refuge island for a total of four beacon systems per site. This condition was followed by a return to the two-beacon system followed by the reinstatement of the four-beacon system. Each alternation of two and four systems received five data sheets of observation. This produced a total of 112 data sheets comprised of 2,240 crossings. Data were also collected at night (after civil twilight) at the 1 st Street site. Baseline data were collected for nine (9) data sheets with each alternating phase being collected for five (5) data sheets each. This produced a total of 29 sheets of data and 580 crossings. Night data were collected between the hours of 7:00PM through 11:30PM. RESULTS Yielding Right-of-way to Pedestrians. The percentage drivers yielding right-of-way to pedestrians during each session is presented on the next two pages in Figures 5. At the 22 nd Avenue N. at the 5 th St. site, the introduction of the rapid-flash beacon produced a marked increase in drivers yielding right-of-way to pedestrians from a baseline level of 28% to a two-beacon treatment level average of 84% and an average of 93% for the four-beacon treatment. Crossing 14 months latter with the beacon was associated with yielding of between 97 and 100% while crossing 14 months latter without the beacon lead to yielding of 23%. 17
18 22nd Ave N & 5th St. Day + Follow-Up 100% Baseline 2 BS 4 BS 2 BS 4 BS 4 BS BL 4 BS 90% 80% Yielding Compliance 70% 60% 50% 40% Begin 14 month follow-up 30% 20% 10% 0% 1st. & 37th Ave. N Day + Follow-Up 100% Baseline 2 BS 4 BS 2 BS 4 BS 4 BS BL 4 BS 90% 80% 70% Yielding Compliance 60% 50% 40% Begin 14 month follow-up 30% 20% 10% 0% Figure 5 Yielding Compliance 18
19 31st. & 54th Ave. N Day + Follow-Up 100% Baseline 2 BS 4 BS 2 BS 4 BS 4 BS 90% 80% 70% Yielding Compliance 60% 50% 40% Begin 14 month follow-up 30% 20% 10% 0% 58th St. & 3rd Ave. N Day+ Follow-Up 100% Baseline Standard Beacon 2 BS 4 BS 2 BS 4 BS 4 BS 90% 80% 70% Yielding Compliance 60% 50% 40% Begin 14 month follow-up 30% 20% 10% 0% Figure 5 Yielding Compliance 19
20 At the 1 st Street at 37 th Ave site the introduction of the rapid-flash beacon produced a marked increase in drivers yielding right-of-way to pedestrians from a baseline level of 18% to averages of 86% and 90% for the two- and four-beacon treatments, respectively. Data collected 14 months later was associated with yielding of 100% with the beacon and 27% without the beacon. At the 31 st St. at 54 th Ave. South site the introduction of the rapid-flash beacon produced a marked increase in drivers yielding right-of-way to pedestrians from a baseline level 15% to 73% and 80% for the two and four beacons treatments respectively. Data collected 14 months latter with the beacon was associated with 93% yielding. At the 58 th Street site the introduction of the standard overhead beacon produced a small increase in driver yielding to pedestrians from 10.9% to 15.5%. The introduction of the rapid-flash beacon at this site lead to a marked increase in yielding to 81.5% and the introduction of the four beacons system was associated with a further increase to 88.7%. Fourteen-month follow-up data at this site averaged 91%. Yielding Distance The majority of yielding across all four sites during each condition occurred between 30ft and 50ft intervals, which is behind the advance yield markings and signs. There were increases in yielding at >30ft. over baseline for the two and four light treatments of 8.3% and 9%, respectively. Yielding at >100ft. more than doubled over baseline for the two-beacon system and showed an even greater increase with the introduction of the four-beacon system. The absence of the standard beacon at the 58 th Street location produced a better effect on yielding distance than the standard overhead beacon. There were 48 motorists yielding at less than 30 feet during standard treatment with only 27 during baseline. These numbers are representative of 34% and 33% of the 20
21 yielding for this that occurred during baseline and standard treatment conditions, respectively. There were also only one more car yielding at >100ft. during the standard beacon treatment, 8 vehicles, when compared to baseline, 7 vehicles. Driver Passed or Attempted to Pass Stopped Vehicle During baseline across all four sites, there were a total of 48 passes or attempted passes. There were only 8 of these occurrences during treatment phases, three occurred during the two-beacon treatment and five occurrences during four-beacon treatment. It is also worth noting that at the 58 th Street location there were 14 occurrences during the standard beacon treatment but only 10 of these instances recorded during baseline. Abrupt Braking There were a total of only five occurrences of a vehicle braking hard behind another vehicle. There were two of these occurrences during the standard beacon treatment at the 58 th Street location and three of these occurrences during the two-beacon treatment combined from all sites. There were no reports of hard braking during the fourbeacon treatments at any location. Night Evaluation of Rapid-Flash Devices Data for nighttime yielding is presented in Figure 6. Baseline yielding compliance at night was 4.8% during nighttime data collection at the 1 st at 37 th Ave. North location. The introduction of the treatment was associated with an increase in nighttime yielding to 86.7% for the two-beacon system and 99.4% for the four-beacon system. These changes represent increases of 81.9% and 94.46% over baseline levels respectively. Nighttime yielding remained high during the 14 month follow-up. During baseline conditions, the majority of yielding occurred at the 30ft.-50ft. range (47.1%). The same is true for the two-beacon system and four-beacon system, 21
22 31.05% and 35.9%, respectively. During baseline there was no yielding recorded at either the 70ft.-100ft. or >100ft. intervals. However, with system activation there was a large increase in yielding at, or greater than, this distance. During the two-beacon system treatment, 70% of the yielding occurred at or greater than 30 feet. Over 74% of yielding occurred at these distances during the four-beacon treatment. Additional data for this location is provided in Figure 5 on the following page. Although we only have a complete set of night data for one site we have probe data for three other sites that show similar results. Inter-Observer Agreement. Inter-observer agreement on the occurrence of a yielding behavior averaged 92% with a range of 80% to 98%. Inter-observer agreement on yielding distance averaged 97.5%. Inter-observer agreement on evasive conflicts was 100%. Inter-observer agreement on whether the pedestrian was trapped in the center of the road averaged 100%; inter-observer agreement on vehicle passes or pass attempt averaged 100%, interobserver agreement on vehicles that jam on brakes averaged 100%. Statistical Analysis The results show average daytime yielding for baseline across all four sites to be 18%, two systems 78%, and four systems 88%. These represent increases of 60% more yielding over baseline for the two-system treatment and a 70% increase from baseline to the four-system treatment. A two-sample t-test for independent (uncorrelated) samples was performed to test the significance between the averages of the reported yielding percentages between the two- and four-beacon systems. The test showed significance at the.05 level (Table 1). 22
23 Figure 6. - Nighttime driver yielding compliance for 1 st Street location 1st. St. & 37th Ave. N Night 100% Baseline 2 BS 4 BS 2 BS 4 BS 4 BS 90% 80% Yielding Compliance 70% 60% 50% 40% Begin 14 month follow-up 30% 20% 10% 0% Table 1. Test of significance between two- and four-beacon yielding percentages Two-sample T-test T-Value P-Value df Obtained Critical 2 The daytime combined average yielding of all four sites during baseline are as follows: 0-10ft. = 3.6%; 10ft.-20-ft.= 10.3%; 20ft.-30ft.=16.8%; 30ft.-50ft.=36.6%; 50ft.-70-ft.=14.9%; 70ft.-100ft.=10.6%; and >100ft.=7.2%. Once the two-beacon system treatments were activated, the combined average yielding per distance was: 0-10ft.= 3.1%; 10ft.-20ft.= 7%; 20ft.-30ft.=12.3%; 30ft.-50ft.= 31%; 50ft.-70ft.=17.8%; 70ft.- 100ft.=13.7%; >100ft.=15.1%. The combined average yielding distance for the fourbeacon was: 0-10ft.= 2.3%; 10ft.-20ft.= 6.2%; 20ft.-30ft.=13.3%; 30ft.-50ft.=31.6%; 23
24 50ft.-70ft.=18%; 70ft.-100ft.=11.6%; and >100ft.=17.1%. The total average yielding distances for all four sites (>30ft.) is provided in Table 2. Table 2. Average yielding distances per condition greater than 30ft. 30ft-50ft 50ft-70ft 70ft-100ft >100ft Baseline 36.60% 14.90% 10.60% 7.20% 2 RF Beacons 4 RF Beacons 31% 17.80% 13.70% 15.10% 31.60% 18% 11.60% 17.10% COMPARISON WITH OVERHEAD AND SIDE MOUNTED BEACON Participants and Setting Participants consisted of drivers traveling on 58th St. N s/of 3rd Avenue and the crossing pedestrians. The location at 58th St. N s/of 3rd Avenue traversed four lanes of traffic, a posted speed limit of 35 MPH and an ADT of 19,192. It also had a median island and provided a crossing for the residents of a near-by retirement center. The second location was at 4th St. S & 18th Avenue. This location was equipped with a sidemounted system. This roadway traversed four lanes, has an ADT of 9,600, and a posted speed of 35 MPH. Apparatus The treatment in this experiment was the standard over-head yellow flashing beacon and a standard side-mounted yellow beacon (see Figure 7). These systems are activated with a pedestrian call button. The system employed two 12-inch diameter yellow beacons facing each direction. The beacons were flashed at a rate of 55 times per minute and the illumination period of the beacon was 50 percent of the time. 24


25 Experimental Design An ABCD design was employed at the 58th St. N s/of 3rd Avenue site to measure the efficacy of standard over-head beacons. This design was comprised of collecting baseline data in the absence of activation of the standard system. The system was activated during treatment. Collecting seven data sheets of data comprised of 20 crossings each. Following the standard beacon treatment, a rapid-flash two-beacon system was implemented followed by the four-beacon system. The rapid-flash treatments were repeated. Each rapid-flash treatment was observed for five data sheets each. This gave a total of 680 crossings. Figure 7 Standard Over-head and Side-mount Round Flashing Beacons An ABC design was used at the 4th St. 18th Avenue location. Baseline consisted of 46 crossings. After baseline, a side-mounted standard beacon system was evaluated for 70 crosses at seven and 30-day intervals. Following the B phase of treatment, a twobeacon rapid-flash system was installed and evaluated at the seven and 30-day intervals after rapid-flash installation. The standard and rapid-flash evaluations each consisted of 70 crossings. 25
26 Statistical Analysis Driver Yielding Behavior The average yielding compliance at the 58th St. N s/of 3rd Avenue site during baseline recording was 10.9%. The activation of the over-head standard beacon produced an average yielding compliance of 15.5%. This is an average increase of only 4.6% above baseline. The introduction of a two-beacon, rapid-flash, system produced an increase in yielding to 78.3%. A four-beacon system followed giving 88% yielding compliance. Reversal back to two beacons yielded 84.6% compliance followed by 89.3% yielding for the second four-beacon system treatment. The average yielding percentage for a twobeacon system was 81.5%. The average yielding compliance for the four-beacon system was 88.7%. With the introduction of a two- and four-beacon system came increases of 70.6% and 77.8% increases over baseline, respectively, and increases of 66% and 73.2% over the standard-beacon efficacy. (See figure 8). Standard Beacon VS 2RF and 4RF 100.0% 90.0% 88.0% 84.6% 89.3% 80.0% 78.3% 70.0% Yielding Compliance 60.0% 50.0% 40.0% 30.0% 20.0% 10.0% 10.9% 15.5% 0.0% BL Standard 2 RF 4 RF 2 RF 4 RF 26
27 Side-Mountd Standard VS Rapid-Flasah 100% 90% 80% 70% 64% 72% Percent Yielding 60% 50% 40% 30% 20% 10% 12.17% 17% 0% 0.00% BL Stnd. 7-Day Stnd. 30-Day 7 Day LED 30 Day LED Figure 8 Yielding Comparison between Standard and Rectangular-shaped Baseline data at the 4th St. & 18th Avenue site showed a 0.0% yielding compliance. Activating the side-mounted standard beacon produced a 12.2% yielding compliance after seven days. A 30-day analysis of the standard side-mounted system yielded 17% compliance. The rapid-flash produced 63.4% yielding compliance after 7 days and the 30-day analysis showed 72% yielding. The rapid-flash percentages are representative a two-beacon system only. The average yielding percentage for each of the two-beacon analysis is 67.7%. This number is 55.5% more yielding over the 12.2% observed during the standard beacon treatment. Driver Yielding Distance Behavior (58th St. N s/of 3rd Avenue only) The absence of the standard beacon actually produced a better effect on yielding distance than during standard overhead beacon. During treatment, light on, a higher percentage (one percent more) of the vehicles yielded at less than 30ft. However, there are more cars yielding during treatment and this produces a larger number of cars that 27
28 yielding at closer distance than in the absence of the light. There were 48 cars yielding at less than 30 feet during treatment with only 27 during baseline. There were also a smaller percentage of cars yielding at >100ft. during treatment, 5.6%, as opposed to 8.4% of vehicles yielding at >100ft. during baseline. The majority of yielding during both conditions occurred at the same distance, 30ft.-50ft. During baseline, 41% of motorists yielded at this distance and 42.7% during the standard beacon treatment. The majority of yielding during the two-beacon system occurred at the 30ft.-50ft. interval (43.5%). During the four-beacon system, the majority was at the same interval with 41.7%. The percentage of motorists yielding greater than 100ft. more than doubled from the twobeacon system to the four-beacon system with an increase from 5.6% to 12%. There were no significant results reported for Evasive action: pedestrian/vehicle, Pedestrian trapped in median or Car behind yielding or drivers jamming on brakes. Inter-observer agreement Inter-observer agreement on the occurrence of a yielding behavior averaged 92% with a range of 80% to 98%. Inter-observer agreement on evasive conflicts was 100%. Interobserver agreement on whether the pedestrian was trapped in the center of the road averaged 100%, inter-observer agreement on vehicle passes or pass attempt averaged 100%, inter-observer agreement on vehicles that jammed on brakes averaged 100%, and inter-observer agreement on stopping distance averaged 99%. 28
29 DATA FOR ALL 18 SITES The average yielding data for all sites for the first year are presented below in Figure 9. The data in Figure 9 shows that the device produces sustained yielding behavior over time. It should be noted that because all 18 devices were not installed simultaneously not all data point represent the average data for all 18 sites. The baseline, 7 day, 30 day, 60 day and 90 day data represent data for all 18 sites. The 180 day data only represents data for 17 sites, while the 270 day data represent data for 15 sites, and the 360 day data only represent data for 10 sites. The 730 day data point is only based on the first site to be installed. Yielding Percentage Across Time 100% 90% 80% 79.1% 85.6% 82.0% 80.4% 75.7% 86.0% 82.9% 82.9% 70% Yielding Compliance 60% 50% 40% 30% 20% 10% 0% 1.7% BL 7 Day 30 Day 60 Day 90 Day 180 Day 270 Day 365 Day 730 Day Figure 9 Effectiveness of the Rectangular-shaped Rapid Flashing LED Beacon 29

30 DATA FROM OTHER SITES To date only Miami Dade County have reported data on the installation of these beacons. This month rectangular stutter flash system was installed in Washington, D.C. and systems will be installed at three sites in Illinois this month. The site in Los Cruses NM has not been evaluated because of construction. We only have baseline and 7 day data for the D.C. site. The Miami research was particularly important because it studied both staged crossing and crossing by local residents. Baseline levels were similar for both, but the treatment results obtained observing yielding to local residents crossing was somewhat better than the results obtained from staged crossings. These data suggest that the data collected in St. Petersburg might somewhat under represent the magnitude of the effects produced by the rectangular LED stutter flash system. A picture of a Miami site is shown below. Figure 10 - One of the two installations in Miami Dade County. 30
31 The results obtained in Miami were very similar to the results obtained in St. Petersburg in a number of important regards. First, baseline-yielding behavior was as low at the Miami sites as it was at the St. Petersburg sites. Second, the effects of the rectangular stutter flash system were as striking in Miami as they were in St. Petersburg. Third, the night results obtained at both Miami sites were very similar to the night effect size obtained at several St. Petersburg sites. Preliminary data from Washington, D.C. communicated by their local engineer suggest that the device is producing a similar effect in D.C. at 7 days. These data suggest that the device may be expected to work in a similar manner across the U.S. However, additional data are needed to confirm this hypothesis. 31
32 DISCUSSION It is interesting that the average increase in yielding from baseline to a twobeacon system was 18.2% to 81.2%. The introduction of the four-beacon system was also associated with an average increase in yielding to 87.8%. This increase from two to four was found to be statistically significant (Table 1). It may be that these increases from two to four systems are due to the rapid-flash sequences and their visibility to the motorists occupying the inside lanes. That is, the middle lanes in which the motorists are more likely to see the median devices rather than those placed near the curb. The increase in yielding distances is also an important effect. With motorists yielding at further distances, the chance that a pedestrian may be struck by a motorists due to the inability to see the pedestrian and vice-versa due to a yielding vehicle is greatly reduced. An increase in yielding distance decreases the probability of a multiple threat. The amount of yielding occurring at >100ft. more than doubled over baseline during the four-system treatment. It was often observed that many of the motorists yielded at distances much greater than 100 feet upon activation of the rapid-flash devices. Since the research sites were only marked up to 100 feet, there was not a way to accurately record such distances. It was reported that it sometimes appeared that motorists were yielding at twice the distance as from the crosswalk to the 100ft. flag. This would be distances up to, and possibly in excessive of, 200 feet. It is suggested that this also occurs due to the visibility of the lights at such great distances. These distances were also reported during the two-system treatments, but not as often. The increases in yielding percentages and the yielding distances are, as should be, associated with a decrease in the number of vehicle passes, or attempts. This may also be due to the fact that, when activated, the signs are visible to all motorists and not only 32
33 those in the direct field of vision to the pedestrian. However, it may sometimes be the case that a larger vehicle, such as a panel or delivery truck, blocks the view of a driver in a smaller vehicle. The efficacy of the standard overhead beacon system appears to be minimal at best. There was only a small increase in yielding compliance over baseline with the activation of the standard lighting system. The rapid-flash system was installed and evaluated at the same location. The rapid-flash system produced yielding percentages of 81.5% (two beacon-system) and 88.7% (four beacon-systems). Since these numbers were recorded at the same site with the only differences being the device used, it is assumed that this is due to the rapid-flash system being more visible and in the line-ofsite to the motorists, as opposed to being highly elevated. The strongest data recorded for the effectiveness of the rapid-flash system were the data collected during nighttime observations. These data came closest to approaching a full 100% yielding compliance. During some observation periods, 100% was recorded. In fact, it was recorded during four straight observation periods during four-beacon treatment. That is 80 consecutive street crossings in the presence of automobiles with total yielding compliance. The higher yielding compliance can probably be contributed to the fact that the LED lights become much more visible and salient at night. The LED lights offer advantages, other than those produced in this study, when used instead of the conventional lighting sources (i.e., halogens or strobes). For one, LED lights require a very small amount of power to operate when compared to other forms of lighting. Second, LED s can be activated and deactivated very quickly, referred to as their ramping speed, within their lighting sequences. This means that there is no carry-over effect from one flash to the other. This eliminates stop motion action and 33
34 allows for greater conspicuity. Stop motion action is often encountered when one is in the presence of a strobe light. The Society of Automotive Engineers (SAE) has researched the different uses of ground vehicle LED lighting and their effects for over 20 years. They have suggested that an optimum flash rate is between flashes per minutes. This suggested flash rate is an attempt to have the lighting as perceivable as possible. The LED lighting sequence of the rapid-flash systems in this study produced a combined 390 flashes per minute for each set of forward facing lights. Since each set included two light sources flashing in a wigwag pattern, this means that there were actually only 190 flashes per minute, 60 flashes more than suggested by SAE. However, it should be noted that a flashing light is only perceived as being a steady lamp as they approach 1200 flashes per minute. It may be assumed that the separation between the lights allows for a slower perception of the flash rate of each individual light, thus, allowing a slightly higher than recommended flash rate to be effective. However it is also suggested that a study should be conducted with a slower, SAE recommended, flash rate. The Society of Automotive Engineers, in their extensive past, has conducted and concluded on several other properties of lighting and human perception. 1 It is suggested that a major factor in the increases in yielding compliance is due to the combination of the rapid-flash lights and the signage they are attached to. If the lights were installed alone, the yielding percentages would be expected to decrease. Without a message attached to the lights (pedestrian silhouette), the lights themselves convey no 1 Blue Advancing-Red Receding phenomenon. At night, the eye perceives high frequencies (blue/violet) as moving towards the observer while lower frequency colors (red) appears to be moving away. This aids in support of amber because there is no confusion of the placement of the lights relative to the automobile s speed. Also, nearly eight (8) percent of males have one of the three most common forms of color blindness while only about.5 percent of females exhibit the same. 34
35 useful information. It is often the case with emergency vehicles especially, that too many lights are used with too little direction (i.e., information) and that this may actually be counterproductive (Wells, 2006). The type of textual prompt associated with the flashing beacons should be analyzed. The message is explainable in that the sign serves as a visual stimulus for, basically, a generic representation of a crossing pedestrian. It can be assumed that the majority of drivers have all had some past exposure and reinforcement history with this type of sign. That is, drivers have learned that the signs are usually placed at pedestrian crosswalks and that yielding occurs at these places. Once the sign is attended to, there are then a set of contingencies that define the desired behavior and possible outcomes. It may be that seeing the sign is then associated with regulations requiring the yielding of motorists to pedestrians. Therefore, the sign may be serving as a rule/law to yield for pedestrians. It should be noted that during the approach some of the drivers are exposed to the Yield Here and State Law signs (Figure 2). These signs state the rule. Kudadjie-Gyamfi and Rachlin (2002) state that When rules signal current contingencies behavior usually adjusts faster to those contingencies than when no rules are provided. The signs do not directly state any outcome for yielding, or not, this could provide some explanation for lower yielding if the attached pedestrian signage and/or Yield Here signs were removed. There would be no stimulus associated with or explaining what behavior is expected and the desired behavior would eventually be a result of multiple trials. When provided as information about contingencies, rules work as verbal prompts that abbreviate the time and effort that are required by a full shaping process (Ribes- Inesta, 2000). 35
36 DETERMINING A WARRANT FOR THE RAPID - FLASH SYSTEM The results of this study clearly demonstrate the rapid-flash pedestrian crossing aids greatly increase driver-yielding behavior, as there were marked increases in yielding above the percentages reported during both baseline and the standard yellow flashing beacon. These are also the highest yielding levels reported for any crosswalk system that does not include a red indication. As a result of these findings, and the reduced cost of this type of system I have adjusted the warrant for the ITS crosswalk in the Pedestrian Crossing Task Order produced for the city of St. Petersburg. Because the cost of the system is a third to a quarter that of competing systems that include a mast arm I have revised the warrant numbers conservatively by half. The revised warrant document is included in Appendix 1. 36
37 References Ellis, R., Van Houten, R. and Kim, J.L. (2006). In-roadway yield to pedestrians signs : Placement distance and motorist yielding. Transportation Research Record. Huybers, S., Van Houten, R., & Malenfant, J. (2004). Reducing conflicts between motor vehicles and pedestrians: The separate and combined effects of pavement markings and a sign prompt. Journal of Applied Behavior Analysis, 37, Institute of Transportation Engineers, (1985). Determining vehicle change intervals: A proposed recommended practice. Washington, D.C. Kudadjie-Gyamfi, E., & Rachlin, H. (2002). Rule-governed versus contingencygoverned behavior in a self-control task: Effects of changes in contingencies. Behavioral Processes, 57, National Highway Traffic Safety Administration. (2003). Pedestrian roadway fatalities. (DOT Publication No. HS ). Washington, DC: U.S. Government Printing Office. National Highway Traffic Safety Administration. (2006). Motor vehicle traffic crash fatality counts and estimates of people injured for (DOT Publication No. HS ). Washington, DC: U.S. Government Printing Office. National Highway Traffic Safety Administration. (2008). Motor vehicle traffic crash fatality counts and estimates of people injured for (DOT Publication No. HS ). Washington, DC: U.S. Government Printing Office. Ribes-Inesta, Emilio. (2000). Instructions, rules, and abstractions: A misconstrued relation. Behavior and Philosophy, 28, Society of Automotive Engineers ground vehicle lighting standards manual (2001 ed.). (2001). Warrendale, PA: Society of Automotive Engineers. 37
Advance Yield Markings Reduce Motor Vehicle/Pedestrian. Conflicts at Multilane Crosswalks with an Uncontrolled Approach.
 Advance Yield Markings Reduce Motor Vehicle/Pedestrian Conflicts at Multilane Crosswalks with an Uncontrolled Approach by Ron Van Houten Mount Saint Vincent University J.E. Louis Malenfant Center for Education
ITS Animated LED Signals. Alert Drivers to Pedestrian Threats
 ITS Animated LED Signals Alert Drivers to Pedestrian Threats by Ron Van Houten and J.E. Louis Malenfant A good deal of evidence suggests that driver inattention is a major cause of motor vehicle crashes.
DPS 201 RECTANGULAR RAPID FLASHING BEACON (RRFB)
") DPS 201 RECTANGULAR RAPID FLASHING BEACON (RRFB) WHY? PEDESTRIANS NEED TO CROSS CASE STUDY: RRFB (ST. PETERSBURG, FL) St. Petersburg, FL Problem/Background Multi-lane, high-speed roadways Conflicts at
DPS 201 RECTANGULAR RAPID FLASHING BEACON (RRFB) WHY? PEDESTRIANS NEED TO CROSS CASE STUDY: RRFB (ST. PETERSBURG, FL) St. Petersburg, FL Problem/Background Multi-lane, high-speed roadways Conflicts at
Designing for Pedestrian Safety
 Designing for Pedestrian Safety Treatments at Unsignalized Pedestrian Crossings Presented by: Charlie Zegeer PBIC Director August 17, 2010 Crossing Crashes Part 1: General Principles 3 2 Why do people
Designing for Pedestrian Safety in Washington, DC
 Designing for Pedestrian Safety in Washington, DC February 25, 2014 George Branyan Pedestrian Program Coordinator District Department of Transportation DC Journey to work mode split: 2012 Means of Transportation
The Animated Eyes Symbol as Part of the WALK Signal: An Examination of the Generality of its Effectiveness Across a Variety of
 The Animated Eyes Symbol as Part of the WALK Signal: An Examination of the Generality of its Effectiveness Across a Variety of Intersection Geometries and Timing Parameters by Ron Van Houten Mount Saint
Rectangular Rapid Flashing Beacons
 Countermeasure Strategies for Pedestrian Safety Rectangular Rapid Flashing Beacons Mike Cynecki Lee Engineering November 5, 2015 Today s Presentation Introduction and housekeeping Audio issues? Dial into
PEDESTRIAN SAFETY IMPROVEMENT EVALUATION GUIDELINE FOR UNCONTROLLED CROSSINGS
 PEDESTRIAN SAFETY IMPROVEMENT EVALUATION GUIDELINE FOR UNCONTROLLED CROSSINGS Traffic Safety Engineering Division Updated: April 2018 EXECUTIVE SUMMARY NDOT Traffic Safety Engineering Division developed
Safety Benefits of Raised Medians and Pedestrian Refuge Areas. FHWA Safety Program.
 Safety Benefits of Raised Medians and Pedestrian Refuge Areas FHWA Safety Program http://safety.fhwa.dot.gov There s a signal up the block, but looking left there s a gap in traffi c. Looking right there
Memorandum MAR or in part.
 Interim U.& Department of Transportation federal Highway Administration Memorandum Correction issued 3/21/2018 Subject: - INFORMATION: MUTCD Approval for Optional Use of Pedestrian-Actuated Rectangular
EVALUATION OF HAWK SIGNAL AT GEORGIA AVENUE AND HEMLOCK STREET, NW IN THE DISTRICT OF COLUMBIA FINAL REPORT. August 30, 2010
 EVALUATION OF HAWK SIGNAL AT GEORGIA AVENUE AND HEMLOCK STREET, NW IN THE DISTRICT OF COLUMBIA FINAL REPORT August 30, 2010 Submitted to: Mr. George Branyan Pedestrian Program Manager Policy, Planning
USER GUIDE FOR R1-6 GATEWAY TREATMENT
 USER GUIDE FOR R1-6 GATEWAY TREATMENT FOR PEDESTRIAN CROSSINGS Prepared by: Western Michigan University T.Y. Lin International December 2016 Updated May 2018 Acknowledgements Michigan Department of Transportation
The DC Pedestrian Master Plan
 The DC Pedestrian Master Plan September 28, 2010 George Branyan Pedestrian Program Coordinator District Department of Transportation Presentation Agenda Scope of the Plan Methodology Recommendations Implementation
USER GUIDE FOR R1-6 GATEWAY TREATMENT
 USER GUIDE FOR R1-6 GATEWAY TREATMENT FOR PEDESTRIAN CROSSINGS Prepared by: Western Michigan University T.Y. Lin International December 2016 Acknowledgements Michigan Department of Transportation MDOT
PEDESTRIAN CROSSING STATISTICS
 PEDESTRIAN SAFETY UTILIZATION OF RRFB AND HYBRID BEACONS WILLIAM (BILL) MARSHALL PEDESTRIAN CROSSING STATISTICS STUDIES INDICATE CROSSWALK COMPLIANCE IS FROM 4% 30% HAWAII REPORTED 50 NON YIELDS TO PEDESTRIANS
STEP. Rectangular Rapid Flashing Beacons. Safe Transportation for Every Pedestrian
 STEP Safe Transportation for Every Pedestrian Rectangular Rapid Flashing Beacons Duane Thomas, Federal Highway Administration Megan McCarty Graham, Toole Design October 30, 2018 Housekeeping Problems with
HAWK Signal. Pedestrian Safety. Illinois Traffic Engineering & Safety Conference Thursday, October 21, 2010
 HAWK Signal Pedestrian Safety Illinois Traffic Engineering & Safety Conference Thursday, October 21, 2010 Background Information High-intensity Activated crosswalk Developed by the City of Tuscon, AZ First
CHAPTER 5 LITERATURE REVIEW
 CHAPTER 5 LITERATURE REVIEW This task includes identification of suitable pedestrian safety countermeasures for research at high pedestrian crash sites in high risk zones. Pedestrian Safety Countermeasures
RE: City of Portland Request to Experiment with HAWK/Bike signal
 October 4, 2005 Regina S. McElroy, Director Office of Transportation Operations HOTO Room 3401 400 7 th Street, S.W. Washington, D.C. 20590 RE: City of Portland Request to Experiment with HAWK/Bike signal
Field Research on a Passive. Railroad Crossing Animated Eyes Signal Unit. Ron Van Houten. J.E. Louis Malenfant
 Field Research on a Passive Railroad Crossing Animated Eyes Signal Unit by Ron Van Houten J.E. Louis Malenfant Center for Education and Research in Safety 1 Abstract Forty five percent of injury crashes
Appendix A: Crosswalk Policy
 Appendix A: Crosswalk Policy Appendix A: Crosswalk Policy Introduction This citywide Crosswalk Policy is aimed at improving pedestrian safety and enhancing pedestrian mobility by providing a framework
Chapter 5: Crossing the Street
 Chapter 5: Crossing the Street Whether walking or bicycling, a student s journey to school will more than likely require crossing one or more streets. Per the Safe Routes to School Guide, maintained by
The Corporation of the City of Sarnia. School Crossing Guard Warrant Policy
 The Corporation of the City of Sarnia School Crossing Guard Warrant Policy Table of Contents Overview And Description... 2 Role of the School Crossing Guard... 2 Definition of a Designated School Crossing...
Today s presentation
 Today s presentation Introduction and housekeeping PBIC Trainings http://www.walkinginfo.org/training Next PBIC Webinar Community Approaches to Pedestrian Safety Education Gillian Hotz and David Parisi
City of Albert Lea Policy and Procedure Manual 4.10 ALBERT LEA CROSSWALK POLICY
 4.10 ALBERT LEA CROSSWALK POLICY PURPOSE: Pedestrian crosswalks are an integral part of our transportation infrastructure. To be effective and promote safety, marked crosswalks must be installed after
MEMORANDUM. Date: 9/13/2016. Citywide Crosswalk Policy
 MEMORANDUM Date: 9/13/2016 Re: Citywide Crosswalk Policy Foreword Through the s Circulation Element and Complete Streets Policy, it is the City s goal to promote walking trips and provide safe facilities
GLOSSARY CROSSWALK. CROSSING TYPES
 CROSSWALK The part of a roadway at an intersection included within the connections of the lateral lines of the sidewalks on opposite sides of the street measured from the curbs, or in the absence of curbs
Broad Street Bicycle Boulevard Design Guidelines
 Broad Street Bicycle Boulevard Design Guidelines Building from the strategies introduced in the 2013 Bicycle Transportation Plan and community input received thus far, City Transportation Staff have identified
INCREASING MOTORIST COMPLIANCE AND CAUTION AT STOP SIGNS RON VAN HOUTEN RICHARD A. RETTING
 JOURNAL OF APPLIED BEHAVIOR ANALYSIS 2001, 34, 185 193 NUMBER 2(SUMMER 2001) INCREASING MOTORIST COMPLIANCE AND CAUTION AT STOP SIGNS RON VAN HOUTEN MOUNT SAINT VINCENT UNIVERSITY AND RICHARD A. RETTING
IMPROVING PEDESTRIAN SAFETY AT UNCONTROLLED CROSSINGS. Guidelines for Marked Crosswalks
 IMPROVING PEDESTRIAN SAFETY AT UNCONTROLLED CROSSINGS Presented by Nazir Lalani P.E. Traffex Engineers Inc. N_lalani@hotmail.com Guidelines for Marked Crosswalks Source: FHWA, Safety Effects of Marked
CROSSING GUARD PLACEMENT CONSIDERATIONS AND GAP ASSESSMENT
 CROSSING GUARD PLACEMENT CONSIDERATIONS AND GAP ASSESSMENT Many factors contribute to the need for a Crossing Guard. General federal guidance, provided by the FHWA MUTCD, states that adult crossing guards
DEPARTMENT OF ENVIRONMENTAL SERVICES. North Harrison Street (Lee Highway to Little Falls Road) Comparative Analysis. Prepared for:
 Comparative Analysis. Prepared for:") DEPARTMENT OF ENVIRONMENTAL SERVICES North Harrison Street (Lee Highway to Little Falls Road) Comparative Analysis Prepared for: Arlington County Department of Environmental Services 2100 Clarendon Boulevard,
DEPARTMENT OF ENVIRONMENTAL SERVICES North Harrison Street (Lee Highway to Little Falls Road) Comparative Analysis Prepared for: Arlington County Department of Environmental Services 2100 Clarendon Boulevard,
Improving Pedestrian Safety at Unsignalized Crossings. Shawn Turner, P.E. Texas A&M Transportation Institute
 Improving Pedestrian Safety at Unsignalized Crossings Shawn Turner, P.E. Texas A&M Transportation Institute Overview of Presentation What are the issues/problems? Framework for crossing treatments Marked
SCHOOL CROSSING PROTECTION CRITERIA
 CITY OF MADISON TRAFFIC ENGINEERING SCHOOL CROSSING PROTECTION CRITERIA January 2016 Adopted as Policy on August 31, 1976, by Common Council by Amended Resolution #29,540 Amended on September 14, 1976,
MEMORANDUM. Charlotte Fleetwood, Transportation Planner
 MEMORANDUM Date: Updated August 22, 2017 To: Organization: Charlotte Fleetwood, Transportation Planner Boston Transportation Department From: Jason DeGray, P.E., PTOE, Regional Director of Engineering
CHAPTER 1 STANDARD PRACTICES
 CHAPTER 1 STANDARD PRACTICES OBJECTIVES 1) Functions and Limitations 2) Standardization of Application 3) Materials 4) Colors 5) Widths and Patterns of Longitudinal Pavement Marking Lines 6) General Principles
Developed by: The American Traffic Safety Services Association (ATSSA) 15 Riverside Parkway, Suite 100 Fredericksburg, VA
 15 Riverside Parkway, Suite 100 Fredericksburg, VA") Addendum Developed by: The American Traffic Safety Services Association (ATSSA) 15 Riverside Parkway, Suite 100 Fredericksburg, VA 22406-1022 800-272-8772 This material is based upon work supported by
Addendum Developed by: The American Traffic Safety Services Association (ATSSA) 15 Riverside Parkway, Suite 100 Fredericksburg, VA 22406-1022 800-272-8772 This material is based upon work supported by
SCOPE Application, Design, Operations,
 SCOPE Application, Design, Operations, Maintenance, etc.: Typical Traffic Control Signals Pedestrian Hybrid Beacons Emergency Vehicle One-Lane/Two-Way Facilities, Freeway Entrance Ramps, and Movable Bridges
Designing for Pedestrian Safety. Alabama Department of Transportation Pre-Construction Conference May 2016
 Designing for Pedestrian Safety Alabama Department of Transportation Pre-Construction Conference May 2016 1 Designing for Pedestrians Marking Crosswalks at Signalized intersections High Visibility Markings
Pedestrian & Bicycle Safety Innovations & Applications
 Pedestrian & Bicycle Safety Innovations & Applications County Engineers Association of Maryland Spring, 2017 Conference May 25, 2017 George Branyan Pedestrian Program Coordinator District Department of
Citywide Sidewalk and Crosswalk Programs
 Citywide Sidewalk and Crosswalk Programs Council Meeting October 20, 2015 Presented by Rita Hu and Jamal Mahmoud Program Goals Implement the City s comprehensive plan. Provide pedestrian with safe walking
Taking a Step back, can we make crossing the street less chancy? Kerry Wilcoxon City of Phoenix Street Transportation Department
 Taking a Step back, can we make crossing the street less chancy? Kerry Wilcoxon City of Phoenix Street Transportation Department What are the realities? Pedestrian Source - Neighborhood - Bus Stop - Business
Pedestrian Hybrid Beacon Guide Recommendations and Case Study. FHWA Safety Program.
 Pedestrian Hybrid Beacon Guide ecommendations and Case Study FHWA Safety Program http://safety.fhwa.dot.gov A pedestrian hybrid beacon (PHB) is a traffic control device similar to a European pedestrian
Document 2 - City of Ottawa Pedestrian Crossover (PXO) Program
 Program") 40 Document 2 - City of Ottawa Pedestrian Crossover (PXO) Program OVERVIEW The City of Ottawa Pedestrian Crossover (PXO) Program provides the basis for PXO implementation in Ottawa. The program s processes
40 Document 2 - City of Ottawa Pedestrian Crossover (PXO) Program OVERVIEW The City of Ottawa Pedestrian Crossover (PXO) Program provides the basis for PXO implementation in Ottawa. The program s processes
Access Location, Spacing, Turn Lanes, and Medians
 Design Manual Chapter 5 - Roadway Design 5L - Access Management 5L-3 Access Location, Spacing, Turn Lanes, and Medians This section addresses access location, spacing, turn lane and median needs, including
Pedestrian Crossing Guidelines 2016
 Pedestrian Crossing Guidelines 2016 Engineering Services 1.0 Introduction and Background The City of Kingston s first Pedestrian Crossing Guidelines were approved by Council in 2008 in order to provide
RAMP CROSSWALK TREATMENT FOR SAN DIEGO AIRPORT, TERMINAL ONE
 RAMP CROSSWALK TREATMENT FOR SAN DIEGO AIRPORT, TERMINAL ONE AUTHORS Faisal Hamood, P.Eng, M.Eng. Scott O. Kuznicki, P.E. Leonard Perry, Ph.D. SUBMITTAL DATE Friday, May 12 th, 2017 SUBMITTED FOR THE Annual
CITY OF SARATOGA SPRINGS PEDESTRIAN CROSSING TOOLBOX
 CITY OF SARATOGA SPRINGS PEDESTRIAN CROSSING TOOLBOX This toolbox is to be used to guide pedestrian crossing improvements within the City of Saratoga Springs. Details for each crossing type are provided.
Broadway Street Pedestrian Safety Study Cass Street to 700 Feet North of Randall Avenue
 Broadway Street Pedestrian Safety Study Cass Street to 700 Feet North of Randall Avenue Prepared for: City of De Pere, Wisconsin Prepared by: June, 2017 Broadway Street Pedestrian Safety Study Cass Street
Guidelines for Pedestrian Treatments at Uncontrolled Locations January 18, 2018
 Est. Dec. 2014 Guidelines for Pedestrian Treatments at Uncontrolled Locations January 18, 2018 Presented by: Kyle Armstrong, Illinois DOT Yan Qi, Southern Illinois University Webinar Logistics Duration
In response to your request for information on mid-block pedestrian crossing policies and guidelines, the following information is enclosed:
 August 18, 2016 City of Brentwood, Tennessee Mr. Kirk Bednar City Manager 5211 Maryland Way P. O. Box 788 Brentwood, Tennessee 37024 VIA ELECTRONIC MAIL Dear Mr. Bednar: In response to your request for
ANIMATED LED EYES TRAFFIC SIGNALS
 Intelligent Transportation Systems Program ANIMATED LED EYES TRAFFIC SIGNALS Final Report for ITS-IDEA Project 73 Ron Van Houten, Center for Education and Research in Safety, Dartmouth, N.S., Canada December
Sharing the Road. with Pedestrians Edition. A guide for drivers and pedestrians published by the Arizona Department of Transportation
 Sharing the Road with Pedestrians 2017 Edition A guide for drivers and pedestrians published by the Arizona Department of Transportation Sponsored by Tips for Sharing the Road Legally and Safely This pocket
CHAPTER 6H. TYPICAL APPLICATIONS
 2006 Edition Page 6H-1 CHAPTER 6H. TYPICAL APPLICATIONS Section 6H.01 Typical Applications Support: Whenever the acronym TTC is used in this Chapter, it refers to temporary traffic control. Standard: The
Pedestrian Safety Guide for Transit Agencies
 Pedestrian Safety Guide for Transit Agencies FDOT/FTPA/CUTR Professional Development Workshop June 15, 2010 1 Purpose Presentation Overview Bus Stop Location and Design Process/Partnership 2 Purpose Every
Chapter 2: Standards for Access, Non-Motorized, and Transit
 Standards for Access, Non-Motorized, and Transit Chapter 2: Standards for Access, Non-Motorized, and Transit The Washtenaw County Access Management Plan was developed based on the analysis of existing
Addendum to SDDCTEA Pamphlet 55 17: Better Military Traffic Engineering Revision 1 Effective: 24 Aug Crosswalk Guidelines
 Addendum to SDDCTEA Pamphlet 55 17: Better Military Traffic Engineering Revision 1 Effective: 24 Aug 2017 Crosswalk Guidelines Warrants for Uncontrolled Crosswalk Locations Crosswalks at Midblock Locations
STREET CROSSINGS. Module 4. Part 2: Countermeasures
 STREET CROSSINGS Module 4 Part 2: Countermeasures Learning Outcomes 2 At the end of this module, you will be able to: Identify which crossing technique is appropriate Ensure oft-requested solutions (crosswalks,
Guidance for Installation of Pedestrian Crosswalks on Michigan State Trunkline Highways
 Guidance for Installation of Pedestrian Crosswalks on Michigan State Trunkline Highways Michigan Department of Transportation July 7, 2014 Engineering Manual Preamble This manual provides guidance to administrative,
GUIDELINES FOR EMERGENCY TRAFFIC CONTROL
 GUIDELINES FOR EMERGENCY TRAFFIC CONTROL TABLE OF Contents Page Introduction...1 Chapter 6I of the 2009 MUTCD...2 Reason for Control...6 Components of Incident Management Area...7 Traffic Control Devices
SCHOOL CROSSING PROTECTION CRITERIA
 CITY OF MADISON TRAFFIC ENGINEERING SCHOOL CROSSING PROTECTION CRITERIA AUGUST 1990 Adopted as Policy on August 31, 1976, by Common Council by Amended Resolution #29,540 Amended on September 14, 1976,
Pedestrians and Bicyclists. Bruce Friedman and Scott Wainwright FHWA MUTCD Team
 Impact of the New MUTCD on Pedestrians and Bicyclists Bruce Friedman and Scott Wainwright FHWA MUTCD Team Development of the 2009 MUTCD NPA published in the Federal Register on January 2, 2008 Received
Oregon Supplement to the Manual on Uniform Traffic Control Devices. Adopted July 2005 by OAR
 Oregon Supplement to the Manual on Uniform Traffic Control Devices Adopted July 2005 by OAR 734-020-0005 2003 Edition Oregon Supplement to the MUTCD Page 2 INTRODUCTION Traffic control devices installed
FHWA Experimentation #4-298(E) Modified HAWK Signal and Bike Signal - Draft Report
 Modified HAWK Signal and Bike Signal - Draft Report") FHWA Experimentation #4-298(E) Modified HAWK Signal and Bike Signal - Draft Report August 2, 2010 Table of Contents Preface... 1 Problem Statement... 1 Study Objectives... 2 Data Collection Methods...
FHWA Experimentation #4-298(E) Modified HAWK Signal and Bike Signal - Draft Report August 2, 2010 Table of Contents Preface... 1 Problem Statement... 1 Study Objectives... 2 Data Collection Methods...
Coquitlam Cross-town Bike Route Improving Bicycle Facilities in a Mature Suburban Environment
 Coquitlam Cross-town Bike Route Improving Bicycle Facilities in a Mature Suburban Environment Sarah Rocchi, Vice-President, Projects, Opus International Consultants (Main Presenter) Catherine Mohoruk,
Pedestrians safety. ROAD SAFETY SEMINAR PIARC/AGEPAR/GRSP Lome, Togo October 2006 Lise Fournier, Canada-Qu
 Pedestrians safety ROAD SAFETY SEMINAR Lome, Togo October 2006 Lise Fournier, Canada-Qu Québec Contents WHO s data Risk factors Pedestrian needs Pedestrian facilities Conclusion Source: WHO WHO reports
Traffic Control Devices
 533372 Highway Engineering Traffic Control Devices Traffic Control Devices o The media by which traffic engineers communicate with drivers o Every traffic law, regulation, or operating instruction must
The 2009 Manual on Uniform Traffic Control Devices (MUTCD) (Brief) Highlights for Arizona Practitioners. Arizona Department of Transportation
 (Brief) Highlights for Arizona Practitioners. Arizona Department of Transportation") The 2009 Manual on Uniform Traffic Control Devices (MUTCD) (Brief) Highlights for Arizona Practitioners Arizona Department of Transportation New 2009 MUTCD 9 Parts (down from 10 in 2003) 816 pages (up
The 2009 Manual on Uniform Traffic Control Devices (MUTCD) (Brief) Highlights for Arizona Practitioners Arizona Department of Transportation New 2009 MUTCD 9 Parts (down from 10 in 2003) 816 pages (up
Residential Traffic Calming Program Guide. Town of Ashland, Virginia
 Residential Traffic Calming Program Guide Town of Ashland, Virginia August 1, 2006 TABLE OF CONTENTS A. INTRODUCTION... 1 B. GOALS... 1 C. CRITERIA... 1 D. IDENTIFYING NEIGHBORHOOD TRAFFIC CONCERNS...
By Kay Fitzpatrick, Ph.D., P.E., Ann Do, P.E., and Bruce Friedman, P.E.
 feature shutterstock.com/dieter Hawlan Rapid-Flashing Beacons for Pedestrian Treatments By Kay Fitzpatrick, Ph.D., P.E., Ann Do, P.E., and Bruce Friedman, P.E. The rectangular rapid-flashing beacon has
November 2012: The following Traffic and Safety Notes were revised:
 CHANGE LIST for MDOT Traffic and Safety, TRAFFIC AND SAFETY NOTES Located at http://mdotcf.state.mi.us/public/tands/plans.cfm JANUARY 2014: The following Traffic and Safety Note was added: Note 705A Angled
FDOT Bicycle/Pedestrian Focused Initiative & Complete Streets
 Florida Department of TRANSPORTATION FDOT Bicycle/Pedestrian Focused Initiative & Complete Streets Billy L. Hattaway, PE District One Secretary Secretary s Pedestrian Safety Initiative Dangerous by Design
Rectangular Rapid Flashing Beacons (RRFB) Pilot Project
 Pilot Project") Rectangular Rapid Flashing Beacons (RRFB) Pilot Project Nominated for: The City of Calgary Category: Road Safety Engineering Award Contact: Surendra Mishra, P. Eng., Traffic Engineer, City of Calgary ABSTRACT
Rectangular Rapid Flashing Beacons (RRFB) Pilot Project Nominated for: The City of Calgary Category: Road Safety Engineering Award Contact: Surendra Mishra, P. Eng., Traffic Engineer, City of Calgary ABSTRACT
A Residential Guide to Neighborhood Speed Enforcement
 A Residential Guide to Neighborhood Speed Enforcement City of Delaware, Ohio A Residential Guide to Neighborhood Speed Enforcement Introduction: The perception of speeding on local streets is probably
Identify the letter of the choice that best completes the statement or answers the question.
 Chapter 10 - Practice Questions Multiple Choice Identify the letter of the choice that best completes the statement or answers the question. 1) Before passing a vehicle in your lane, a. anticipate the
Active Transportation Facility Glossary
 Active Transportation Facility Glossary This document defines different active transportation facilities and suggests appropriate corridor types. Click on a facility type to jump to its definition. Bike
1 To provide direction to Administration when determining the appropriate Pedestrian Crossing Control Device for a particular location.
 Purpose: 1 To provide direction to Administration when determining the appropriate Pedestrian Crossing Control Device for a particular location. Policy Statement(s): 2 The City installs Pedestrian Crossing
APPENDIX A: Complete Streets Checklist DRAFT NOVEMBER 2016
 APPENDIX A: Complete Streets Checklist DRAFT NOVEMBER 2016 Complete Streets Checklist MetroPlan Orlando s Complete Streets Checklist is an internal planning tool for staff to further implementation of
CHAPTER 6H. TYPICAL APPLICATIONS
 Section 6H.01 Typical Applications Support: CHAPTER 6H. TYPICAL APPLICATIONS Chapter 6G contains discussions of typical temporary traffic control activities. Chapter 6H presents typical applications for
California Manual on Uniform Traffic Control Devices
 California Manual on Uniform Traffic Control Devices FHWA s MUTCD 2009 Edition as amended for use in California 2012 Edition State of California Business, Transportation and Housing Agency Department of
TRANSMITTAL LETTER. Revision to Publication 149, Chapter 20 (Criteria for the Design of Traffic Signal Supports) - March 2009 Edition
 - March 2009 Edition") OS-299 (7-08) TRANSMITTAL LETTER PUBLICATION: Publication 149 - Traffic Signal Design Handbook DATE: 10/14/10 SUBJECT: Revision to Publication 149, Chapter 20 (Criteria for the Design of Traffic Signal
OS-299 (7-08) TRANSMITTAL LETTER PUBLICATION: Publication 149 - Traffic Signal Design Handbook DATE: 10/14/10 SUBJECT: Revision to Publication 149, Chapter 20 (Criteria for the Design of Traffic Signal
2009 Manual on Uniform Traffic Control Devices
 2009 Manual on Uniform Traffic Control Devices Tori Brinkly, PE Highway Safety Engineer WFL-FHWA April 20, 2010 Paragraphs are numbered. Standard Statements are bolded. Guidance statements are italicized.
Chapter Twenty-eight SIGHT DISTANCE BUREAU OF LOCAL ROADS AND STREETS MANUAL
 Chapter Twenty-eight SIGHT DISTANCE BUREAU OF LOCAL ROADS AND STREETS MANUAL Jan 2006 SIGHT DISTANCE 28(i) Chapter Twenty-eight SIGHT DISTANCE Table of Contents Section Page 28-1 STOPPING SIGHT DISTANCE
Including Revision 1 dated May 2012 and Revision 2 dated May 2012
 Including Revision 1 dated May 2012 and Revision 2 dated May 2012 Page 634 2009 Edition Notes for Figure 6H-1 Typical pplication 1 Work eyond the Shoulder 1. If the work space is in the median of a divided
STATIC AND DYNAMIC EVALUATION OF THE DRIVER SPEED PERCEPTION AND SELECTION PROCESS
 STATIC AND DYNAMIC EVALUATION OF THE DRIVER SPEED PERCEPTION AND SELECTION PROCESS David S. Hurwitz, Michael A. Knodler, Jr. University of Massachusetts Amherst Department of Civil & Environmental Engineering
ADA on Construction. Guidance for Section C Plan Preparers
 ADA on Construction Guidance for Section C Plan Preparers Some impacts cannot be avoided and those impacts apply to residents, businesses, motorists, and pedestrians alike. However, good planning can minimize
Accommodating Pedestrians in the Work Zone
 Accommodating Pedestrians in the Work Zone Guidance for Section C Plan Preparers Some impacts cannot be avoided and those impacts apply to residents, businesses, motorists, and pedestrians alike. However,
Agenda. Overview PRINCE GEORGE S PLAZA METRO AREA PEDESTRIAN PLAN
 PRINCE GEORGE S PLAZA METRO AREA PEDESTRIAN PLAN May 28, 2008 Agenda Welcome and introductions Project overview and issue identification Planning context and strengths Design challenges and initial recommendations
2014 FHWA Aging Road User Handbook. Recommendations to Accommodate Aging Pedestrians. Lifesaver National Conference. What is the Handbook?
 2014 FHWA Aging Road User Handbook Recommendations to Accommodate Aging Pedestrians Lifesaver National Conference March 17, 2015 Revised June 2014 1 What is the Handbook? 1998 1st Edition 2001 2nd Edition
POTENTIAL COUNTERMEASURES FOR IMPROVED PEDESTRIAN SAFETY A Report for the Sherman Oaks Neighborhood Council Public Safety Committee
 POTENTIAL COUNTERMEASURES FOR IMPROVED PEDESTRIAN SAFETY A Report for the Sherman Oaks Neighborhood Council Public Safety Committee by Jay Beeber Safer Streets L.A. www.saferstreetsla.org jay@saferstreetsla.org
Town of Windsor Pedestrian Crossing Guidelines
 Town of Windsor Pedestrian Crossing Guidelines Prepared for: Town of Windsor Engineering Department 301 Walnut Street Windsor, Colorado 80550 For More Information, please contact: Engineering Department
CURBSIDE ACTIVITY DESIGN
 5 CURBSIDE ACTIVITY DESIGN This chapter provides design guidance for separated bike lanes adjacent to curbside activities including parking, loading and bus stops. Typical configurations are presented
Bicycle Facilities Planning
 Bicycle Facilities Planning Overview Types of Cyclists Purpose for Riding Types of Facilities Bike Lanes Bicycle Boulevards Cycle Tracks Intersections Signals Signing and Marking Discussion Types of Bicyclists
Speed Reduction in School Zones
 Transportation Kentucky Transportation Center Research Report University of Kentucky Year 1976 Speed Reduction in School Zones Charles V. Zegeer James H. Havens Robert C. Deen Kentucky Department of Transportation
Safety Impacts: Presentation Overview
 Safety Impacts: Presentation Overview The #1 Theme How Access Management Improves Safety Conflict Points The Science of Access Management By Treatment Studies Themes for Texas Access Management Improve
Emergency Roadside Technician Dies When Struck by a Single-Unit Truck on an Interstate Shoulder. Incident Number: 05KY001
 Emergency Roadside Technician Dies When Struck by a Single-Unit Truck on an Interstate Shoulder Incident Number: 05KY001 Location on bridge where responder attempted to avoid semi. Kentucky Fatality Assessment
PEDESTRIAN ACCOMMODATIONS DPS 201 AT INTERCHANGES
 PEDESTRIAN ACCOMMODATIONS DPS 201 AT INTERCHANGES UNDERSTANDING THE ISSUES Intersections of freeway ramp terminals at crossroads are the most critical components of an interchange Challenge: balance mobility
Appendix B Warrants, Standards, and Guidelines for Traffic Control Devices used at Senior Citizen and Disabled Person Crossings
 Appendix B Warrants, Standards, and Guidelines for Traffic Control Devices used at Senior Citizen and Disabled Person Crossings B.1 General Minnesota Statute 169.215 and Highway Traffic Regulation 169.222
WORK ZONE TRAFFIC CONTROL PROCEDURES
 WORK ZONE SETUP / REMOVAL WORK ZONE TRAFFIC CONTROL PROCEDURES When installing a work zone, install the advance warning signs on all approaches prior to installing the traffic control devices. Perform
PEDESTRIAN CROSSING TREATMENTS
 PEDESTRIAN CROSSING TREATMENTS BEST PRACTICES Presented by: Doug Enderson, P.E., PTOE Cody Salo, P.E. 1 PRESENTER INTRODUCTIONS Doug Enderson, P.E., PTOE Ped Crossing Experience: ADA Design-Build ADA Inventory