pedestrian safety study Summary Report
|
|
|
- Ethel Morris
- 6 years ago
- Views:
Transcription

1 pedestrian safety study
2 April 24, 2012 CITY OF VANCOUVER PEDESTRIAN SAFETY STUDY SUMMARY REPORT Prepared by In association with Dr. Tarek Sayed, P.Eng., Department of Civil Engineering, University of British Columbia USL File No


3 Appendices Appendix A Appendix B Detailed Economic Cost of Pedestrian Collisions Collision Modelling Methodology Appendix C Review of Pedestrian Treatments Appendix D Appendix E Example Traffic Awareness Program References References i
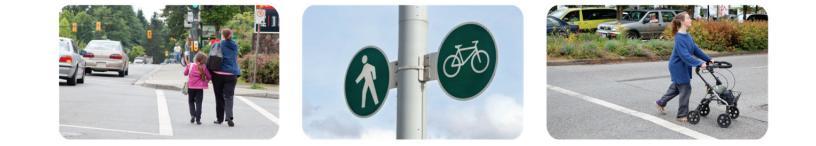
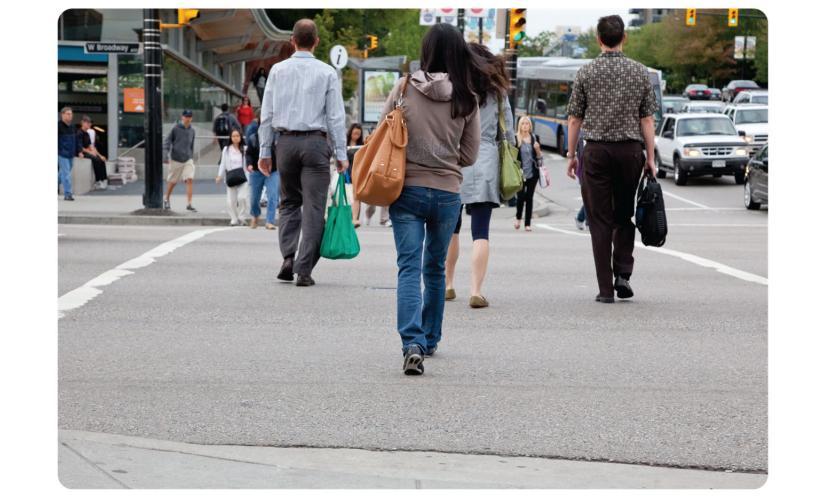
4 Walking is the most fundamental form of transportation. Walking is part of every trip, whether that trip is made by car, transit, or bicycle. The City of Vancouver is committed toward making walking a safe, accessible and enjoyable experience for residents and visitors alike. Walking was identified as the top transportation priority in the City s 1997 Transportation Plan and subsequently in the 2002 Downtown Transportation Plan. In addition, the City s Greenest City Action Plan recognizes the role that walking can play in helping the City work to its goal of being the greenest city in the world by 2020, and sets a target that the majority of trips in the City of Vancouver (over 50%) will be made on foot, bicycle or public transit. Vancouver is renowned as a walkable city. In fact, walking currently accounts for over 12% of all trips to work made in the City of Vancouver one of the highest walking mode shares among several Canadian and international peer cities, as shown in Figure 1. Figure 1 Walking Mode Share of Work Trips in Canadian and International Peer Cities Boston Vancouver Washington DC New York City San Francisco Seattle Philadelphia Ottawa Toronto Copenhagen Baltimore Chicago Edmonton Calgary Portland Stockholm Los Angeles 4% 4% 6% 6% 5% 7% 7% 7% 6% 9% 8% 8% 10% 10% 12% 11% 14% 0% 2% 4% 6% 8% 10% 12% 14% Significant steps have been taken to improve pedestrian safety in recent years, including the installation of a number of engineering treatments such as intersection safety cameras, pedestrian countdown timers, speed reader boards, and corner bulges, among other things. The City also recently formed an Active Transportation Advisory Committee to advise on matters that encourage and enhance walking as a means of transportation, recreation and health. The purpose of the is to help the City gain a better understanding of the effectiveness of existing pedestrian safety treatments, and 1
5 to help identify opportunities to improve pedestrian safety through engineering, enforcement and communication measures throughout the City. This study involved an in-depth analysis of all reported collisions involving pedestrians in the City of Vancouver between 2005 and The analysis examined where collisions were occurring, when they took place, who was involved in the collisions, and how the collision occurred. The analysis was based on collision data provided by the Insurance Corporation of British Columbia (ICBC) and the Vancouver Police Department (VPD) as well as a variety of other datasets, including data regarding infrastructure, spatial, demographic, weather, and light conditions. There were 3,066 reported collisions involving pedestrians between 2005 and 2010, equivalent to an average of 511 collisions involving pedestrians per year. In comparison, there was an average of 28,933 total reported traffic collisions over this period. As such, on average approximately 1.8% of all reported traffic collisions involved a pedestrian over this period. Looking back beyond 2005, the number of overall traffic collisions as well as the number of pedestrian collisions have been steadily declining in the City of Vancouver, as shown in Figure 2. Figure 2 Total number of collisions and pedestrian collisions ( ) ,000 Number of Pedestrian Collsions ,000 40,000 30,000 20,000 10,000 Number of Total Collisions Total Collisions Pedestrian Collisions 2
6 Based on ICBC data between 1996 and 2010, 2010 saw the fewest number of traffic collisions since This decrease in the number of collisions is notable, particularly because the City s population increased significantly over this period. In fact, despite an increase in the City s population of approximately 20% between 1996 and 2010, the total number of collisions in the City decreased by 52%, while the total number of collisions involving pedestrians declined by 34%. As a result, the annual pedestrian collision rate defined as the number of pedestrian collisions per 100,000 residents has been steadily declining since Between 2005 and 2010, the City of Vancouver had an overall traffic fatality rate for all reported collisions of 3.3 fatalities per 100,000 residents. This is a relatively low fatality rate as compared to most other large communities in British Columbia, as well as other peer cities across North America and internationally. When considering the number of pedestrian fatalities based on the overall number of walk to work trips, Vancouver has a pedestrian fatality rate of 1.0 pedestrian fatalities per million walk to work trips, which is relatively low compared to other peer cities, as shown in Figure 3. Figure 3 Pedestrian Fatalities per Million Walk to Work Trips Los Angeles Portland Philadelphia Chicago Baltimore Washington DC San Francisco New York City Edmonton Copenhagen Toronto Seattle Calgary Vancouver Ottawa Boston Stockholm Pedestrian Fatality Rate (Pedestrian Fatalities per Million Walk-to- Work Trips) Traffic collisions are considered a global epidemic of staggering, but often overlooked consequences. A recent study by Transport Canada estimates that the annual cost of traffic collisions to the Canadian economy, including health care, environmental damage, lost productivity, and induced traffic congestion, is 5.2 3


7 $CDN 62.7 billion approximately 5% of the Canadian Gross Domestic Product (GDP). Although all road users are impacted by the cost of collisions, nonmotorized and sustainable modes of travel such as walking and cycling suffer a higher level of risk because of their increased vulnerability. It is estimated that the average cost of a pedestrian collision in the City of Vancouver including human consequences as well as other costs such as lost earnings, medical care, administration costs and other indirect costs -- is approximately $234,000. Based on the number of pedestrian collisions in the City of Vancouver between 2005 and 2010, the total cost of pedestrian collisions in the City of Vancouver over the five year period was in excess of $760 million, or approximately $127 million per year, although this has declined significantly since 2008 due to the decline in the number of pedestrian collisions since Overall pedestrian collision patterns between 2005 and 2010 in the City of Vancouver are shown in Figure 4. The section below provides a brief summary of the key pedestrian safety issues that were identified based on the analysis of pedestrian collisions over the past six years in the City of Vancouver, including WHEN collisions took place, WHO was involved in the collisions, WHERE the collisions were occurring, and HOW the collision occurred Figure 4 City-Wide Pedestrian Collision Patterns ( ) 4
8 When Nearly half of all pedestrian collisions occurred between November and February. Most of the increase in collisions in winter months can be attributed to the increase in nighttime collisions as a result of the shorter days and longer nights, as shown in Figure 5. Figure 5 Total Pedestrian Collisions by Month and Light Conditions ( ) 450 Number of Collisions Jan Feb Mar Apr May Jun Jul Aug Sep Oct Nov Dec Morning Twilight Daytime Evening Month Twilight Night Time January accounted for the highest proportion of pedestrian collisions resulting in fatalities. Pedestrian collisions were more likely to occur on weekdays. The highest proportion of pedestrian collisions occurred during the PM peak period (3:00 6:00pm) Although late night pedestrian collisions (12:00 6:00am) were relatively infrequent, they were nearly twice as likely to lead to a fatality compared with other time periods. Pedestrians were particularly vulnerable when it was both dark and rainy. 5
9 Who Young adults aged 20 to 29 are the most likely to be involved in a collision as a pedestrian. As shown in Figure 6, this age group is much more likely to be involved in pedestrian collisions resulting in injury than would be expected based on the population distribution. Collisions involving young adults are more likely to result in injury and less likely to result in fatality. As shown in Figure 6, collisions involving seniors are more likely to result in fatality. In fact, the proportion of pedestrian collisions resulting in fatalities is significantly higher than could be expected based on the population distribution. On a positive note, children aged 9 and under account for 15.4% of walking trips in Vancouver, but represent only 3.9% of pedestrian collisions. Figure 6 Proportion of Pedestrian Injuries and Fatalities Compared to Overall Population Distribution 15% Proportion of Population / Incidents 12% 9% 6% 3% 0% 0 to 4 5 to 9 10 to to to to to to to to to to to 64 Age Group 65 to to to to to to to and over Population Injuries Fatalities Areas of Concern There is a relatively even distribution of pedestrian collisions involving males and females. Males are somewhat more likely to be involved in a collision resulting in fatality, as 54.9% of all pedestrian fatalities involved males, compared to 45.1% females. 6


10 Females aged 20 to 29 are more likely than males of the same age group to be involved in a pedestrian collision, as this age group accounts for 26.2% of collisions involving females compared to 22.7% of collisions involving males. Where A significant number of pedestrian collisions occurred in the Downtown core and along Primary Arterial streets, such as Broadway, 12 th Avenue, 41 st Avenue, Kingsway, Hastings Street, Main Street, Fraser Street, Knight Street, and Commercial Drive, among others The neighbourhoods with the highest number of pedestrian collisions per 100,000 residents and employees included Strathcona, Mount Pleasant, Grandview-Woodland, Shaughnessy, and Kensington Cedar Cottage, as shown in Figure 7. Figure 7 Total pedestrian collisions per 100,000 residents and employees by neighbourhood ( ) 7
11 Approximately 75% of all pedestrian collisions were located at intersections. The majority of pedestrian collisions at intersections (61%) were at signalized intersections, even though signalized intersections only represent 3.6% of all intersections in the City. 21 locations were identified that had 11 or more pedestrian collisions over the six year period. All of these locations are located at intersections and were also located at an intersection with an arterial road. Seven of these locations were identified as Collision Prone Locations which present the highest risk for pedestrian collisions. What & How The most common driver action in pedestrian collisions was a left turning movement. The vast majority of collisions at intersections involved drivers failing to yield to pedestrians when pedestrians had the right-of-way. One quarter of all pedestrian collisions took place at mid-block locations, where the pedestrian was either crossing the street at a mid-block crosswalk or a location without a traffic control, crossing a driveway or laneway, or was struck at the sidewalk or at a bus stop. The top five pedestrian collision types listed below accounted for approximately two-thirds of all pedestrian collisions: 1. Vehicle turns left while pedestrian crosses with right-of-way at signalized intersection (25.6% of known collision types); 2. Vehicle turns right while pedestrian crosses with right-of-way at signalized intersection (17.1%); 3. Pedestrian hit while crossing mid-block without a traffic control, or jaywalking (11.5%); 4. Vehicle proceeds straight through while pedestrian crosses at stop sign or crosswalk (6.9%); and 5. Pedestrian hit while crossing driveway or laneway (6.5%). The study included a comprehensive review of the effectiveness of a range of types of engineering treatments that can be considered to improve pedestrian safety. This includes a review of measures commonly used in Vancouver as well as measures with limited or no current use in Vancouver, as shown in Table 1. The effectiveness of each treatment was assessed based on a comprehensive 8
12 literature review and by contacting staff at five peer cities in Canada and the Pacific Northwest (Calgary, Toronto, Seattle, Portland, and San Francisco). Table 1 Relative Cost and Effectiveness of Pedestrian Treatments Treatment Relative Cost Relative Effectiveness Pedestrian Activated Signals High High Corner Bulges Moderate Moderate Speed Reader Boards Moderate Moderate-Low Pedestrian Countdown Timers Moderate-Low Moderate Crosswalks Moderate-Low Low Pedestrian Scrambles Moderate-High High Audible Pedestrian Signals Moderate-Low Moderate-Low Leading Pedestrian Intervals Low Moderate Left Turn Bays Varies Varies Greenways Varies Varies Crossing Guards Moderate-Low Moderate-Low Yield to Pedestrian Signs Low Low Raised Intersections Moderate-High Moderate-Low Midblock Crossings Varies Varies Raised Crosswalks Moderate-High Moderate Separated vs Mixed Modes Low Moderate New/Upgraded Intersection Lighting Moderate High Based on the results of the collision analysis, the study identified the following 12 key pedestrian safety issues. a. WHEN b. WHO c. WHERE d. WHAT & HOW Key Issue 1 Key Issue 2 Key Issue 3 Key Issue 4 Key Issue 5 Key Issue 6 Key Issue 7 Key Issue 8 Key Issue 9 Key Issue 10 Key Issue 11 Key Issue 12 Winter and Adverse Weather Conditions High Activity Periods Late Night Senior Fatalities Young Adults Intersections Arterial Corridors Local Street Intersections Left Turning Vehicles at Intersections Right Turning Vehicles at Intersections Jaywalking Driver Failure to Yield 9
13 The Action Plan includes a description of each issue as well as engineering, education and enforcement countermeasures recommended to address each issue, as described below. a. When Key Issue 1 Winter and Adverse Weather Conditions The collision data indicates that visibility is a key contributing factor in many pedestrian collisions. Pedestrian collisions are more common during the winter months, with the additional collisions largely taking place after dark. Days are shorter in winter and a greater percentage of pedestrian activity takes place during nighttime and adverse weather conditions. Strategies to address this issue include installing and upgrading lighting at key intersections and launching a road safety awareness campaign at the beginning of the winter season to remind pedestrians and motorists to exercise additional caution in dark and rainy conditions; remind motorists that safe speeds depend on weather and light conditions, not just the posted speed limit; and remind pedestrians to wear visible clothing in poor lighting conditions. Key Issue 2 High Activity Periods The highest proportion of pedestrian collisions occurs during the PM peak period between 5 and 7 pm. More generally, pedestrian collisions are most common between 3 and 8 pm, when pedestrian activity levels are high. The prominence of pedestrian collisions in the afternoon/evening peak period offers opportunities to efficiently improve safety, such as coordinating enforcement actions for speeding, jaywalking, and crosswalk yielding to occur more frequently during high activity periods and adjusting traffic signal timing during peak periods to provide additional time for pedestrians to complete crossings Key Issue 3 Late Night While pedestrian collisions are relatively uncommon late at night, when they do occur they are nearly twice as likely to result in a fatality as compared with other periods. With fewer cars on the road late at night, drivers are able to operate at higher speeds, contributing to increased collision severity. Because there are fewer pedestrians on the road during these times as well, motorists may be less likely to be looking for people walking. Potential pedestrian safety measures include installing and upgrading lighting at key intersections, installing speed cameras or implementing police enforcement on corridors where motorists tend 10
14 to speed, adjusting traffic signal timing to reduce the minimum green times for through movements, and developing a road safety awareness campaign aimed at minimizing drunk driving/walking. b. Who Key Issue 4 Senior Fatalities Older pedestrians are less likely to survive a pedestrian collision. For Vancouver residents to successfully rely on walking or public transportation as they age, it is essential that the transport system be pedestrian friendly and forgiving of mistakes in judgment and changes in walking speed that occur naturally. There are a number of ways to improve safety for seniors, including evaluating the presence of safe crossing facilities throughout the City and particularly areas with higher concentrations of seniors, conducting outreach to seniors, developing a safe routes for seniors program, and setting enforcement priorities for speeding and crosswalk yielding that include areas where seniors are more likely to be present. Key Issue 5 Young Adults Young adults aged 20 to 29 are over-represented in pedestrian collisions and are the age group most likely to be involved in a pedestrian collision. While not available in the data, young people may also be more likely to be under the influence of alcohol while walking, which can impair their ability to make good decisions about safe walking and crossing behaviour. Pedestrian safety measures include a road safety awareness campaign targeted towards young drivers and pedestrians, enforcement actions focusing on places where young people tend to congregate, and a safe routes to school program to instill road safety knowledge at an early age. c. Where Key Issue 6 Intersections The majority of pedestrian collisions in the City of Vancouver take place at intersections. Twenty-one intersections experienced 11 or more pedestrian collisions over the past six years, and seven intersections in particular were identified as Collision Prone Locations. Recommended pedestrian safety measures include pedestrian countdown timers, road safety awareness campaigns, and crosswalk enforcement. 11
15 Key Issue 7 Arterial Corridors The majority of both intersection and mid-block pedestrian collisions take place on primary and secondary arterial streets. Furthermore, pedestrian collisions tend to be concentrated along a number of arterial corridors in the Downtown core as well as along corridors such as Broadway, 12th Avenue, 41st Avenue, Kingsway, Hastings Street, Main Street, Fraser Street, Knight Street, and Commercial Drive, among others. The study recommended that the City undertake a corridor pedestrian safety strategy by evaluating groups of intersections along arterial corridors and considering packages of complementary mitigation measures to deal with primary collision types identified in the What & How Section. Potential treatments could include left turn bays/left turn signals at major cross-streets, or pedestrian signals/greenways/restricted left turns at minor traffic streets and major pedestrian corridors. A multi-agency approach is recommended that complements engineering treatments with police enforcement actions and road safety awareness campaigns aimed at arterial roadway users (i.e., at bus stop shelters). Key Issue 8 Local Street Intersections The majority of collisions in the City occur on arterial streets or at intersections with arterial streets. As a result, collision patterns on local streets become underrepresented in City-wide analyses. Although the vast majority of collisions on local streets are isolated incidents with only one reported collision over this period, 20 locations have been identified at local street locations with at least two reported collisions over this period. Potential pedestrian safety measures on local streets include a range of traffic calming measures such as corner bulges and raised crosswalks. d. What & How Key Issue 9 Left Turning Vehicles at Intersections The most common pedestrian collision type includes a left turning vehicle at an intersection. Most of these left turning collisions occur at signalized intersections and involve a pedestrian crossing with the right of way (i.e., with a walk signal). This is to be expected, as traffic signal phasing typically allows the pedestrian crossing phase to run simultaneously with the through and permitted turning movements on the parallel street segment. There are a number of measures that can reduce potential conflicts between pedestrians and left turning vehicles: 12
16 Leading Pedestrian Intervals give pedestrians an advanced walk signal, allowing them to clearly establish their right of way in the crossing before vehicles are given a green light. Left turn bays can be implemented at intersections where there is room for a dedicated left turn lane. Left turn bays provide a dedicated space for vehicles to make a left turn, allowing them to concentrate on making a safe turn with less pressure from following vehicles. Left turn movements can be given their own protected phase separate from the pedestrian walk phase. Left turns can also be prohibited at all times or at certain times of day at certain high collision intersections or at minor cross-streets to allow the turning movement to occur at a more appropriate location. A road safety awareness campaign can be directed at both drivers and pedestrians, reminding them to look out for each other at intersections. Enhanced enforcement by police can focus on intersections with high numbers of pedestrian collisions. Key Issue 10 Right Turning Vehicles at Intersections Collisions involving right turning vehicles are the second most common type of pedestrian collision. Similar to collisions involving left turning vehicles, most of these collisions occur at signalized intersections when the pedestrian is crossing with the walk signal. Actions to reduce potential conflicts between pedestrians and right turning vehicles are similar to those cited in above. In addition, right turn on red movements can be restricted at select intersections where this type of collision is common. Key Issue 11 Jaywalking The third most common type of pedestrian collision (11.5%) occurred where pedestrians were attempting to cross the street at a mid-block location without an intersection control. Potential pedestrian safety measures can include additional mid-block crossing facilities based on crossing demand and collision history, a cross at the corner road safety awareness campaign to remind pedestrians to cross at intersections or other dedicated crossing facilities, crossing guards, adjusting signal timing, and police enforcement at known jaywalking locations. 13
17 Key Issue 12 Driver Failure to Yield Failure to yield refers to cases where a driver fails to yield to a pedestrian that is crossing the street at a signalized intersection with the right-of-way, at a stop sign, or at a marked or unmarked crosswalk. Strategies to address failure to yield collisions include red light cameras, enhanced enforcement, and a pay attention road safety awareness campaign. Based on the actions identified for each of the twelve key issues identified above, the Action Plan identifies the following high priority measures that are anticipated to be particularly effective to address the identified pedestrian safety issues: Minimize conflicts between motorists and pedestrians at intersections o Continue to install countdown signal timers as standard practice for new signals and at high pedestrian collision intersections as resources permit. o Continue to install corner bulges and raised crosswalks on local streets. o Upgrade lighting at intersections with high night-time pedestrian volumes and/or collisions. o Assess high pedestrian collision intersections and consider installation of the following: Leading pedestrian intervals Left turn bays as well as protected or prohibited left turns Increased pedestrian walk and clearance intervals Improve visibility at night o Improve lighting to enhance visibility at key intersections. Use road safety awareness campaigns to target behaviour related to common collision types o Road safety awareness campaigns can be developed in partnership with other agencies such as ICBC and the Vancouver Police Department to focus on: Increased risk of pedestrian collisions at night and in adverse weather conditions Safe walking and driving by young adults 14
18 High incidence of conflicts between drivers and pedestrians at intersections Safe driving and crossing behaviour on arterial corridors Work with police to target enforcement actions to improve pedestrian safety o The City of Vancouver can partner with the Vancouver Police Department to tailor enforcement actions to occur: During high pedestrian activity periods At high collision intersections Along high collision corridors The improvement of pedestrian safety within the City of Vancouver will require the involvement and coordination of a number of agencies involved in pedestrian-related infrastructure, operations, services, and enforcement. These include the City of Vancouver, ICBC, Vancouver Police Department (VPD), the BC Ministry of Health (MoH), TransLink, and the Vancouver School Board (VSB). In addition, other stakeholders, such as the Vancouver Area Cycling Coalition (VACC) and the British Columbia Automobile Association (BCAA), could play a role in identifying needs, education and advocacy. Each of these agencies can contribute to pedestrian safety through four general areas: 1. Provision of primary data and information; 2. Planning/engineering/operations; 3. Communication; and 4. Enforcement. Each of the agencies could take on either a lead or supporting role in these areas, working together in cooperation to plan, deliver, and evaluate strategies to improve pedestrian safety. It is recommended that pedestrian collision data from various agencies be harmonized and include injury severity to enable a more robust analysis in the future and to facilitate the planning and evaluation process. 15


19 16 City of Vancouver
Safer Cycling: How the City of Vancouver is Proactively Improving Cycling Safety
 Safer Cycling: How the City of Vancouver is Proactively Improving Cycling Safety Brian Patterson, MCIP, RPP Urban Systems 2015 Canadian Association of Road Safety Professionals (CARSP) Conference Session
For Information Only. Pedestrian Collisions (2011 to 2015) Resolution. Presented: Monday, Apr 18, Report Date Tuesday, Apr 05, 2016
 Resolution. Presented: Monday, Apr 18, Report Date Tuesday, Apr 05, 2016") Presented To: Operations Committee For Information Only Pedestrian Collisions (0 to 0) Presented: Monday, Apr 8, 06 Report Date Tuesday, Apr 0, 06 Type: Correspondence for Information Only Resolution For
Presented To: Operations Committee For Information Only Pedestrian Collisions (0 to 0) Presented: Monday, Apr 8, 06 Report Date Tuesday, Apr 0, 06 Type: Correspondence for Information Only Resolution For
From: To: Date: Subject:
 From: To: Date: Subject: Attachments: Page 1 "Johnston, Sadhu" "Direct to Mayor and Council - DL" 2/2/2016 2:24:20 PM Request to Staff - RTS 1196
EMPHASIS AREA 1: PEDESTRIANS
 EMPHASIS AREA 1: PEDESTRIANS A pedestrian is seriously injured or killed every 3 days on Toronto s roads. Pedestrian collisions involve any person that is not riding in a vehicle or on a bicycle. 26% OF
Traffic Safety Plan Traffic Safety Plan 2015
 Traffic Safety Plan 2015 Purpose Airdrie s last Traffic Safety Plan was created in 2011. The 2015 Traffic Safety Plan is a revised model of the traffic operations for the City of Airdrie. The purpose of
PEDESTRIAN ACTION PLAN
 ATTACHMENT 2 CITY OF SANTA MONICA PEDESTRIAN ACTION PLAN CITY OF SANTA MONICA PEDESTRIAN ACTION PLAN This page intentionally left blank EXECUTIVE SUMMARY CHAPTER 1 EXECUTIVE SUMMARY Setting the Stage
Corporate. Report COUNCIL DATE: June 26, 2006 NO: C012 COUNCIL-IN-COMMITTEE. TO: Mayor & Council DATE: June 22, 2006
 Corporate NO: C012 Report COUNCIL DATE: June 26, 2006 COUNCIL-IN-COMMITTEE TO: Mayor & Council DATE: June 22, 2006 FROM: General Manager, Engineering FILE: 0410-20(MoT/Gate) SUBJECT: Surrey Response on
Pedestrian Crossing Guidelines 2016
 Pedestrian Crossing Guidelines 2016 Engineering Services 1.0 Introduction and Background The City of Kingston s first Pedestrian Crossing Guidelines were approved by Council in 2008 in order to provide
Minor Amendments to the Street and Traffic By-law 2849 and Skateboards in Protected Bike Lanes
 ADMINISTRATIVE REPORT Report Date: October 31, 2017 Contact: Lon LaClaire Contact No.: 604.873.7336 RTS No.: 12241 VanRIMS No.: 08-2000-20 Meeting Date: November 15, 2017 TO: FROM: SUBJECT: Standing Committee
Pedestrians safety. ROAD SAFETY SEMINAR PIARC/AGEPAR/GRSP Lome, Togo October 2006 Lise Fournier, Canada-Qu
 Pedestrians safety ROAD SAFETY SEMINAR Lome, Togo October 2006 Lise Fournier, Canada-Qu Québec Contents WHO s data Risk factors Pedestrian needs Pedestrian facilities Conclusion Source: WHO WHO reports
People killed and injured per million hours spent travelling, Motorcyclist Cyclist Driver Car / van passenger
 Cyclists CRASH FACTSHEET 27 CRASH STATISTICS FOR THE YEAR ENDED 31 DEC 26 Prepared by Strategy and Sustainability, Ministry of Transport Cyclists have a number of risk factors that do not affect car drivers.
DOWNTOWN MIAMI PEDESTRIAN PRIORITY ZONE
 DOWNTOWN MIAMI PEDESTRIAN PRIORITY ZONE AUGUST 6, 2013 DOWNTOWN MIAMI BY THE NUMBERS more than 200,000 people live, work, and play here every day is home to more than 1,000 events each year hosts more
Nanaimo Transportation Master Plan. Phase 1 Consultation Summary
 Nanaimo Transportation Master Plan Phase 1 Consultation Summary Transportation Advisory Committee Meeting Wednesday December 12, 2012 Agenda Study Update Phase 1 Consultation Process Phase 1 Consultation
City of Wilsonville 5 th Street to Kinsman Road Extension Project
 City of Wilsonville 5 th Street to Kinsman Road Walking Tour & Neighborhood Workshop Summary Report Public Outreach Overview On July 18 th, 2017, the City of Wilsonville hosted a neighborhood walking tour
NYC Pedestrian Safety Study & Action Plan. NYTMC Brown Bag Lunch Presentation December 15, 2010
 NYC Pedestrian Safety Study & Action Plan NYTMC Brown Bag Lunch Presentation December 15, 2010 1 Introduction DOT Safety Goal Strategic Plan: Reduce Fatalities by 50% by 2030 From 274 (2007) to 137 (2030)
May 5, 2009 File:
 MMM Group Limited Suite 600 1455 West Georgia Street Vancouver, BC V6G 2T3 t: 604-685-9381 f: 604-683-8655 www.mmm.ca May 5, 2009 File: 50-09001-007 1420 1055 West Hastings Street Vancouver, BC V6E 2E9
CITY OF ABBOTSFORD TRANSPORTATION AND TRANSIT MASTER PLAN
 CITY OF ABBOTSFORD TRANSPORTATION AND TRANSIT MASTER PLAN EXECUTIVE COMMITTEE MONDAY, OCTOBER 2, 2017 TRANSPORTATION & TRANSIT AGENDA 1. Plan Overview 2. Shaping Influences 3. Existing Conditions and What
Purpose and Need. Chapter Introduction. 2.2 Project Purpose and Need Project Purpose Project Need
 Chapter 2 Purpose and Need 2.1 Introduction The El Camino Real Bus Rapid Transit (BRT) Project (Project) would make transit and other transportation improvements along a 17.6-mile segment of the El Camino
Designing for Pedestrian Safety in Washington, DC
 Designing for Pedestrian Safety in Washington, DC February 25, 2014 George Branyan Pedestrian Program Coordinator District Department of Transportation DC Journey to work mode split: 2012 Means of Transportation
WELCOME Mission-Geneva Transportation Study
 WELCOME Mission-Geneva Transportation Study Study Process and Schedule 2005 2006 Oct Nov Dec Jan Feb Mar Apr May Jun Jul Aug Sept Oct Task 2 Develop Outreach Plan Task 3 Document Existing Conditions/ Prioritize
VISIONZEROPHL.COM #VISIONZEROPHL
 What is Vision Zero? What is Vision Zero? A policy that states clearly that traffic deaths are preventable and unacceptable. CORE PRINCIPLES: Human life takes priority over mobility; Human error is inevitable
Chapter 7. Transportation. Transportation Road Network Plan Transit Cyclists Pedestrians Multi-Use and Equestrian Trails
 Chapter 7 Transportation Transportation Road Network Plan Transit Cyclists Pedestrians Multi-Use and Equestrian Trails 7.1 TRANSPORTATION BACKGROUND The District of Maple Ridge faces a number of unique
Montgomery County Pedestrian Safety. Seneca Valley High School PTSA November 20, 2012
 Montgomery County Pedestrian Safety Seneca Valley High School PTSA November 20, 2012 Pedestrian Safety Program - The 3 E s Objective: Improve safety for pedestrians and make Montgomery County a more walkable
ECONOMY PEOPLE ENVIRONMENT
 Report Back on Local Transit Improvements May 29, 2013 ECONOMY PEOPLE ENVIRONMENT Intro Council Requested Report Back Topics Progress on Planning for Broadway Subway False Creek Bridges Local Transit Improvements
SIGNALIZED T-INTERSECTION SAFETY REVIEW
 SIGNALIZED T-INTERSECTION SAFETY REVIEW Mark Halpin, Transportation Planner, City of Port Moody Sean O Sullivan, Traffic Operations Engineer, City of Coquitlam Matthew Chan, Traffic Engineer, Parsons Project
CHAPTER 7.0 IMPLEMENTATION
 CHAPTER 7.0 IMPLEMENTATION Achieving the vision of the Better Streets Plan will rely on the ability to effectively fund, build and maintain improvements, and to sustain improvements over time. CHAPTER
FEDERAL HIGHWAY ADMINISTRATION APPLICATION
 FEDERAL HIGHWAY ADMINISTRATION APPLICATION REQUEST FOR PERMISSION TO EXPERIMENT WITH A BICYCLE BOX INTERSECTION TREATMENT Submitted by: City of Columbus Department of Public Service Date: June 26, 2009
Vision Zero in Canada. 9 th International Conference on Urban Traffic Safety August 2017
 Vision Zero in Canada 9 th International Conference on Urban Traffic Safety August 2017 Parachute National charity focused on preventable injuries Vision: An injury-free Canada with Canadians living long
MEMORANDUM. City Constituents. Leilani Schwarcz, Vision Zero Surveillance Epidemiologist, SFDPH
 MEMORANDUM TO: FROM: CC: City Constituents Leilani Schwarcz, Vision Zero Surveillance Epidemiologist, SFDPH Megan Wier, Co-Chair, San Francisco Vision Zero Task Force, SFDPH Commander Ann Mannix, Traffic
Woodward Hill Elementary School School Safety and Operation Review
 Address: 6082-142 nd Street Surrey, BC, V3X 1C1 Site Visit: March 7, 2011 Principal Anne Mackie Report Date: November 25, 2011 Phone: (604) 594-2408 Email: Mackie_A@sd36.bc.ca The following report is one
Transportation Planning Division
 Transportation Planning Division Presentation Outline Study Tasks Recap of Previous Meetings Data Collected Focus Areas within Study Limits Design Principles Tool Box Recommended Concepts Schedule Moving
Active Transportation Facility Glossary
 Active Transportation Facility Glossary This document defines different active transportation facilities and suggests appropriate corridor types. Click on a facility type to jump to its definition. Bike
The DC Pedestrian Master Plan
 The DC Pedestrian Master Plan September 28, 2010 George Branyan Pedestrian Program Coordinator District Department of Transportation Presentation Agenda Scope of the Plan Methodology Recommendations Implementation
MOBILITY WORKSHOP. Joint City Council and Transportation Commission May 5, 2014
 MOBILITY WORKSHOP Joint City Council and Transportation Commission May 5, 2014 Review of General Plan M-1 Develop world-class transit system M-3 Maintain/enhance pedestrian-oriented City M-4 Create comprehensive
Review of Considerations and Requirements for Automated Enforcement
 Review of Considerations and Requirements for Automated Enforcement Summary: The purpose of this report is to provide information related to expanding the use of automated enforcement in the City of Toronto,
A review of 2015 fatal collision statistics as of 31 December 2015
 A review of fatal collision statistics as of 31 December This report summarises the main trends in road fatalities that have emerged in. This has been prepared by the Road Safety Authority following analysis
Date: February 18, 2015 Page: 1 of 9. ICBC invests $1.195 million to improve Surrey, Delta & White Rock roads
 News release Date: February 18, 2015 Page: 1 of 9 Media contacts: Lindsay Olsen, 604-982-4759 ICBC invests $1.195 million to improve Surrey, Delta & White Rock roads You may have noticed the new pedestrian
POLICY AGENDA For Elder Pedestrian Safety
 POLICY AGENDA For Elder Pedestrian Safety Older adults and people with disabilities often have mobility, cognitive, and sensory limitations that affect their behavior as pedestrians and place them at risk
POLICY: TRAFFIC CALMING
 2006 MAY REFERENCE: COUNCIL APPROVED BY COUNCIL MAY 23, 2006 CITY OPERATIONS - NO. 608 POLICY: TRAFFIC CALMING A. All requests for traffic calming within the City shall be considered in accordance with
MTCF. Michigan Traffic Crash Facts FACT SHEETS
 FACT SHEETS This page left intentionally blank GENERAL FACTS The driver, the roadway, and the motor vehicle contribute in some measure to every crash. A preponderance of evidence, however, points to driver
CHAIR AND MEMBERS CIVIC WORKS COMMITTEE MEETING ON APRIL 25, 2016
 TO: FROM: SUBJECT: CHAIR AND MEMBERS CIVIC WORKS COMMITTEE MEETING ON APRIL 25, 2016 JOHN BRAAM, P. ENG. MANAGING DIRECTOR, ENVIRONMENTAL & ENGINEERING SERVICES AND CITY ENGINEER SCHOOL ZONE SPEED LIMIT
8 PROPOSED ROUNDABOUT DUFFERIN STREET AND KING VAUGHAN ROAD INTERSECTION CITY OF VAUGHAN
 8 PROPOSED ROUNDABOUT DUFFERIN STREET AND KING VAUGHAN ROAD INTERSECTION CITY OF VAUGHAN The Transportation Services Committee recommends the adoption of the recommendation contained in the following report
Appendix A: Crosswalk Policy
 Appendix A: Crosswalk Policy Appendix A: Crosswalk Policy Introduction This citywide Crosswalk Policy is aimed at improving pedestrian safety and enhancing pedestrian mobility by providing a framework
Standing Committee on Planning, Transportation and Environment
 ADMINISTRATIVE REPORT Report Date: May 13, 2013 Contact: Jerry Dobrovolny Contact No.: 604.873.7331 RTS No.: 9847 VanRIMS No.: 08-2000-20 Meeting Date: May 29, 2013 TO: FROM: SUBJECT: Standing Committee
City of San Diego Vision Zero Draft Strategic Plan FY 2017
 City of San Diego Vision Zero Draft Strategic Plan FY 2017 Engineering Objective: To develop and implement a strategy that employs best planning, design and engineering practices. Background: Over the
EL CAMINO REAL BUS RAPID TRANSIT (BRT) PROJECT
 PROJECT") Agenda Item #4.2 EL CAMINO REAL BUS RAPID TRANSIT (BRT) PROJECT VTA BOARD WORKSHOP MAY 1, 2015 ABOUT THIS PRESENTATION CONTEXT Existing conditions and planning for growth WHAT IS THE PROJECT? Project alternatives
Agenda Item #4.2 EL CAMINO REAL BUS RAPID TRANSIT (BRT) PROJECT VTA BOARD WORKSHOP MAY 1, 2015 ABOUT THIS PRESENTATION CONTEXT Existing conditions and planning for growth WHAT IS THE PROJECT? Project alternatives
NYC Pedestrian Safety Study & Action Plan. Research, Implementation & Safety Division of Traffic Operations
 NYC Pedestrian Safety Study & Action Plan Research, Implementation & Safety Division of Traffic Operations 1 Introduction DOT Safety GOAL Strategic Plan: Reduce Fatalities by 50% by 2030 From 274 (2007)
City of Novi Non-Motorized Master Plan 2011 Executive Summary
 City of Novi Non-Motorized Master Plan 2011 Executive Summary Prepared by: February 28, 2011 Why Plan? Encouraging healthy, active lifestyles through pathway and sidewalk connectivity has been a focus
We want to hear from you!
 Welcome Improvement Program We want to hear from you! As part of the Transportation 2040 plan, the City is implementing an ongoing cycling spot improvement program for existing bicycle routes. We are currently
Why Zone In on Speed Reduction?
 Learn it. Do it. Live it! SPEED REDUCTION IN THE ZONE Why Zone In on Speed Reduction? Speeding is a serious issue that plays a major role in the risk of serious injury and pedestrian fatality in a crash.
Appendix C 3. Bicycle / Pedestrian Planning
 Appendix C 3. Bicycle / Pedestrian Planning BICYCLE/PEDESTRIAN PLANNING 2005 Master Plan GOAL: Provide for safe and convenient bicycle and pedestrian circulation throughout the City. Develop a city-wide
ICBC invests $1.175 million to help make Surrey, Delta and White Rock s roads safer in 2013
 Date: March 18, 2014 Page: 1 of 8 Media contacts: Michelle Hargrave, 250-979-4642 Lindsay Olsen, 604-982-4759 ICBC invests $1.175 million to help make Surrey, Delta and White Rock s roads safer in 2013
Bike Routes Assessment: 95 Ave, 106 St & 40 Ave. Replace with appropriate image in View > Master.
 Bike Routes Assessment: 95 Ave, 106 St & 40 Ave Replace with appropriate image in View > Master. Transportation Committee October 15, 2014 City Council Direction What we are trying to achieve The Way Ahead:
SR 693 (Pasadena Avenue) Corridor Study from Shore Drive South to 66 th Street
 Corridor Study from Shore Drive South to 66 th Street") Welcome and Introduction Sign-in and comment sheets Restrooms and exits Meeting agenda and timeline Meeting goals / expectations Provide input to guide study recommendations Actively participate throughout
Welcome and Introduction Sign-in and comment sheets Restrooms and exits Meeting agenda and timeline Meeting goals / expectations Provide input to guide study recommendations Actively participate throughout
MTCF. Michigan Traffic Crash Facts FACT SHEETS
 FACT SHEETS This page left intentionally blank GENERAL FACTS The driver, the roadway, and the motor vehicle contribute in some measure to every crash. A preponderance of evidence, however, points to driver
102 Avenue Corridor Review
 February 26, 2015 102 Avenue Corridor Review Transportation Association of Canada Road Safety Engineering Award Submission for the City of Edmonton Introduction Transportation Association of Canada Road
An evaluation of pedestrian countdown timers in the Sydney CBD
 An evaluation of pedestrian countdown timers in the Sydney CBD Cleaver, M. A., Hislop, J., de Roos, M. P., Fernandes, R., Prendergast, M. (NSW Centre for Road Safety) Brisbane, G., Levasseur, M., McTiernan,
We re All Pedestrians
 We re All Pedestrians FINAL REPORT OF THE DOWNTOWN EASTSIDE PEDESTRIAN SAFETY PROJECT EXECUTIVE SUMMARY Introduction Traumatic pedestrian injury leads to about 4,000 hospitalizations in Canada each year.
Integrated Corridor Approach to Urban Transport. O.P. Agarwal World Bank Presentation at CODATU XV Addis Ababa, 25 th October 2012
 Integrated Corridor Approach to Urban Transport O.P. Agarwal World Bank Presentation at CODATU XV Addis Ababa, 25 th October 2012 What is the Integrated Corridor Approach for Urban Transport Public? Why
We re All Pedestrians
 We re All Pedestrians FINAL REPORT OF THE DOWNTOWN EASTSIDE PEDESTRIAN SAFETY PROJECT EXECUTIVE SUMMARY Introduction Traumatic pedestrian injury leads to about 4,000 hospitalizations in Canada each year.
Napier City road trauma for Napier City. Road casualties Estimated social cost of crashes* Major road safety issues.
 ISSN 1176-841X July 25 Land Transport New Zealand has prepared this road safety issues report. It is based on reported crash data and trends for the 2 24 period. The intent of the report is to highlight
2017 Annual Traffic Safety Report
 2017 Annual Traffic Safety Report City of Santa Cruz Public Works Department I. Introduction The purpose of the 2017 City of Santa Cruz Traffic Safety Report is to provide an overview of traffic safety
Bicycle Crashes. Number of Bike Crashes. Total Bike Crashes. are down 21% and severe bike crashes down 8% since 2013 (5 years).
.") Bicycle Crashes The City of Fort Collins is well known for its bike culture, and there is a strong focus on encouraging increased riding. Bike safety is an important component of supporting these efforts.
Bicycle Crashes The City of Fort Collins is well known for its bike culture, and there is a strong focus on encouraging increased riding. Bike safety is an important component of supporting these efforts.
INTRODUCTION THOROUGHFARE SYSTEM CLASSIFICATIONS
 INTRODUCTION The thoroughfare plan will assist public officials in the development of a specialized system for efficient and safe movement of vehicular traffic while minimizing potential conflicts with
STATUS OF 2009 PEDESTRIAN MASTER PLAN (AS OF DECEMBER 2013)
") Appendix P.1 STATUS OF 2009 PEDESTRIAN MASTER PLAN (AS OF DECEMBER 2013) The 2009 Pedestrian Master Plan establishes 21 core recommendations in three goal areas to improve pedestrian transportation in
Appendix P.1 STATUS OF 2009 PEDESTRIAN MASTER PLAN (AS OF DECEMBER 2013) The 2009 Pedestrian Master Plan establishes 21 core recommendations in three goal areas to improve pedestrian transportation in
Proposed. City of Grand Junction Complete Streets Policy. Exhibit 10
 Proposed City of Grand Junction Complete Streets Policy Exhibit 10 1 City of Grand Junction Complete Streets Policy Vision: The Complete Streets Vision is to develop a safe, efficient, and reliable travel
Central Oregon Intergovernmental Council
 Central Oregon Intergovernmental Council Regional Transit Master Plan (RTMP) Technical Advisory Committee Kick-Off Meeting May 16, 2012 Meeting Agenda Project Orientation Presentation of Survey Results
Coquitlam Cross-town Bike Route Improving Bicycle Facilities in a Mature Suburban Environment
 Coquitlam Cross-town Bike Route Improving Bicycle Facilities in a Mature Suburban Environment Sarah Rocchi, Vice-President, Projects, Opus International Consultants (Main Presenter) Catherine Mohoruk,
Developing a Safer Cycling Strategy for the ACT ACRS Conference August 2012
 Developing a Safer Cycling Strategy for the ACT ACRS Conference 2012 Peter Strang Canberra Manager Sarah Court Transport Consultant 10 August 2012 Presentation Outline Background Data Analysis (Stage 1)
APPENDIX C. Systems Performance Report C-1
 APPENDIX C Systems Performance Report C-1 System Performance Report & Requirements According to the FAST Act, a long range transportation plan needs to include a system performance report and subsequent
Safety and Active Transport. Dr. Maureen Carew, Medical Officer of Health Renfrew County and District Health Unit May 30, 2014
 Safety and Active Transport Dr. Maureen Carew, Medical Officer of Health Renfrew County and District Health Unit May 30, 2014 Active Transport Vision Increase levels of walking and cycling Reduce vehicle
Welcome! San Jose Avenue Open House August 25, 2015
 Welcome! San Jose Avenue Open House August 25, 2015 Vision Zero The City and County of San Francisco adopted Vision Zero San Francisco Vision Zero High Injury Network as a policy in 2014, committing an
road safety issues 2001 road toll for Gisborne district July 2002 Road user casualties Estimated social cost of crashes*
 GISBORNE DISTRICT road safety issues July 22 The Land Transport Safety Authority (LTSA) has prepared this Road Safety Issues Report. It is based on reported crash data and trends for the 1997 21 period.
10.0 CURB EXTENSIONS GUIDELINE
 10.0 CURB EXTENSIONS GUIDELINE Road Engineering Design Guidelines Version 1.0 March 2017 City of Toronto, Transportation Services City of Toronto Page 0 Background In early 2014, Transportation Services
Application of Demographic Analysis to Pedestrian Safety. Center for Urban Transportation Research University of South Florida
 Application of Demographic Analysis to Pedestrian Safety BDV25 TWO 977 30 Pei Sung Lin, Ph.D., P.E., PTOE, FITE Program Director Achilleas Kourtellis, Ph.D. Senior Research Associate CUTR, University of
Peterborough Council on Aging
 Peterborough Council on Aging Discussion paper series #4, 2015 Transportation Transportation, including accessible and affordable public transport is a key factor influencing active aging. in particular,
Pedestrian Safety Workshop SAN FRANCISCO, CALIFORNIA
 Pedestrian Safety Workshop 02 15 2011 SAN FRANCISCO, CALIFORNIA 1 Agenda Walking in San Francisco Accomplishments and Current Pedestrian Activities Mayor s Pedestrian Safety Executive Directive Next Steps
5. RUNNINGWAY GUIDELINES
 5. RUNNINGWAY GUIDELINES These guidelines should be considered collectively when making runningway decisions. A runningway is the linear component of the transit system that forms the right-of-way reserved
IMPLEMENTATION CHAPTER Identifying Priorities 7.2 Maintenance 7.3 Funding 7.4 Education and Enforcement IMPLEMENTATION
 CHAPTER 7.0 IMPLEMENTATION 7.1 Identifying Priorities 7.2 Maintenance 7.3 Funding 7.4 Education and Enforcement IMPLEMENTATION Achieving the vision of the Better Streets Plan will rely on the ability to
Transportation Planning Division
 Transportation Planning Division Presentation Outline Study Tasks Recap of Previous Meeting Stakeholder Interviews Data Collection Design Principles Tool Box Recommendations Schedule Moving Forward North
CITY OF COCOA BEACH 2025 COMPREHENSIVE PLAN. Section VIII Mobility Element Goals, Objectives, and Policies
 CITY OF COCOA BEACH 2025 COMPREHENSIVE PLAN Section VIII Mobility Element Goals, Objectives, and Policies Adopted August 6, 2015 by Ordinance No. 1591 VIII MOBILITY ELEMENT Table of Contents Page Number
City of Birmingham Draft Multi-modal Transportation Plan
 City of Birmingham Draft Multi-modal Transportation Plan City Commission Public Hearing Monday, November 25, 2013 7:30 pm Norman Cox, PLA, ASLA The Greenway Collaborative, Inc. Ann Arbor, Michigan The
Do As I Say Not As I Do: Observed Compliance vs. Stated Understanding of Pedestrian Crossing Laws in Florida
 Do As I Say Not As I Do: Observed Compliance vs. Stated Understanding of Pedestrian Crossing Laws in Florida Achilleas Kourtellis, Ph.D. July 9, 2015 CUTR Webcast Series Center for Urban Transportation
Spring Lake Park Mounds View North Oaks. Arden Hills. Shoreview. Roseville. Little Canada. Falcon Heights SNELLING. Lilydale. West Saint Paul 35E
 Coon Rapids Blaine Spring Lake Park Mounds View rth Oaks In 2011, Metro Transit embarked on the Arterial 494 Minnetonka Maple Grove Plymouth Hopkins Brooklyn Park New Hope Golden Valley Louis Park Edina
Simulation Analysis of Intersection Treatments for Cycle Tracks
 Abstract Simulation Analysis of Intersection Treatments for Cycle Tracks The increased use of cycle tracks also known as protected bike lanes has led to investigations of how to accommodate them at intersections.
CITY OF HAMILTON PLANNING AND ECONOMIC DEVELOPMENT DEPARTMENT Transportation Planning and Parking Division
 CITY OF HAMILTON PLANNING AND ECONOMIC DEVELOPMENT DEPARTMENT Transportation Planning and Parking Division TO: Chair and Members Public Works Committee COMMITTEE DATE: June 18, 2018 SUBJECT/REPORT NO:
SAN FRANCISCO MUNICIPAL TRANSPORTATION AGENCY
 THIS PRINT COVERS CALENDAR ITEM NO. : 10.2 DIVISION: Sustainable Streets BRIEF DESCRIPTION: SAN FRANCISCO MUNICIPAL TRANSPORTATION AGENCY Adopting Conceptual Proposal for Streetscape Improvements to Broadway,
EUCLID AVENUE PARKING STUDY CITY OF SYRACUSE, ONONDAGA COUNTY, NEW YORK
 EUCLID AVENUE PARKING STUDY CITY OF SYRACUSE, ONONDAGA COUNTY, NEW YORK CITY OF SYRACUSE DEPARTMENT OF PUBLIC WORKS 1200 CANAL STREET EXTENSION SYRACUSE, NEW YORK 13210 DRAFT REPORT DATE: November 13,
Sardis Elementary School Road Safety Plan. Produced by: Sardis Elementary School - Safer School Travel Team in cooperation with Safer City
 Sardis Elementary Road Safety Plan Produced by: Sardis Elementary - Safer Travel Team in cooperation with Safer City Plan completed in January 2016 1 Acknowledgements It takes commitment and community
From Mile Zero to Target Zero the Dawson Creek Case Study
 From Mile Zero to Target Zero the Dawson Creek Case Study Raheem Dilgir, President, TranSafe Consulting Ltd. and Kevin Henderson, Manager of Planning and Development, City of Dawson Creek Paper prepared
Deaths/injuries in motor vehicle crashes per million hours spent travelling, July 2007 June 2011 (All ages) Mode of travel
 Mode of travel") Cyclists CRASH STATISTICS FOR THE YEAR ENDED 31 DECEMBER 211 Prepared by the Ministry of Transport CRASH FACTSHEET 212 Cyclists have a number of risk factors that do not affect car drivers. The main risk
Cyclists CRASH STATISTICS FOR THE YEAR ENDED 31 DECEMBER 211 Prepared by the Ministry of Transport CRASH FACTSHEET 212 Cyclists have a number of risk factors that do not affect car drivers. The main risk
Richmond-Adelaide Cycle Tracks
 Public Drop-In Event Richmond-Adelaide Cycle Tracks June 25, 2018 12:00 p.m. 3:00 p.m. 4:30 p.m. 7:30 p.m. Metro Hall, Rotunda 55 John Street 1 Purpose of Event In Scope Communicate an update about the
CHAPTER 3: Vision Statement and Goals
 Davidson Walks & Rolls: Active Transportation Master Plan CHAPTER 3 Contents: Overview Vision Statement Measurable Goals Public Outreach CHAPTER 3: Vision Statement and Goals Overview The vision statement
Development of Arlington County s Marked Crosswalk Guidelines. Jon Lawler, P.E. Design Engineer Arlington County, VA
 Development of Arlington County s Marked Crosswalk Guidelines Jon Lawler, P.E. Design Engineer Arlington County, VA April 13, 2015 Transportation System Users Residents Estimated 215,000 in 2014 Lowest
Pedestrian & Bicycle Safety Innovations & Applications
 Pedestrian & Bicycle Safety Innovations & Applications County Engineers Association of Maryland Spring, 2017 Conference May 25, 2017 George Branyan Pedestrian Program Coordinator District Department of
Sixth Line Development - Transit Facilities Plan
 Memorandum Date: November 13, 2012 To: From: c.c. Subject: Rob Freeman (Freeman Planning) Kevin Phillips Sixth Line Development - Transit Facilities Plan 33016631 This memo was prepared to review the transit
Vision Zero & ITE. April 11, Toole Design Group. Jason DeGray, P.E., PTOE. Vision Zero & ITE
 Jason DeGray, P.E., PTOE Toole Design Group April 11, 2017 What is Vision Zero? Traffic deaths and serious injuries are preventable and unacceptable Human life takes priority over mobility Human error
Chapter 2: Standards for Access, Non-Motorized, and Transit
 Standards for Access, Non-Motorized, and Transit Chapter 2: Standards for Access, Non-Motorized, and Transit The Washtenaw County Access Management Plan was developed based on the analysis of existing
Briefing Paper #1. An Overview of Regional Demand and Mode Share
 2011 Metro Vancouver Regional Trip Diary Survey Briefing Paper #1 An Overview of Regional Demand and Mode Share Introduction The 2011 Metro Vancouver Regional Trip Diary Survey is the latest survey conducted
C C C
 C-012-001 Thank you for your support for the creation of new public space and nonmotorized access between downtown and the waterfront through the Overlook Walk, the East-West Connections, and the Promenade.