FINAL REPORT. Prepared for National Cooperative Highway Research Program Transportation Research Board of The National Academies
|
|
|
- Barnard Davidson
- 6 years ago
- Views:
Transcription
1 Project No / Task 283 COPY NO. Evaluation of the Flashing Yellow Arrow (FYA) Permissive Left-Turn and Yellow Arrow Change Indications in Protected/Permissive Left-Turn Control: The Impact of Separate and Shared Yellow Signal Sections and Head Arrangements FINAL REPORT Prepared for National Cooperative Highway Research Program Transportation Research Board of The National Academies David A. Noyce, Ph.D., P.E. Andrea R. Bill University of Wisconsin-Madison Madison, WI Michael A. Knodler, Jr., Ph.D. University of Massachusetts, Amherst Amherst, MA June, 2014
2 ACKNOWLEDGMENT OF SPONSORSHIP This work was sponsored by one or more of the following as noted: American Association of State Highway and Transportation Officials, in cooperation with the Federal Highway Administration, and was conducted in the National Cooperative Highway Research Program, Federal Transit Administration and was conducted in the Transit Cooperative Research Program, Federal Aviation Administration and was conducted in the Airport Cooperative Research Program, Research and Innovative Technology Administration and was conducted in the National Cooperative Freight Research Program, Pipeline and Hazardous Materials Safety Administration and was conducted in the Hazardous Materials Cooperative Research Program, Federal Railroad Administration and was conducted in the National Cooperative Rail Research Program, which is administrated by the Transportation Research Board of the National Academies. DISCLAIMER This is an uncorrected draft as submitted by the Contractor. The opinions and conclusions expressed or implied herein are those of the Contractor. They are not necessarily those of the Transportation Research Board, the National Academies, or the program sponsors.
3 Evaluation of the Flashing Yellow Arrow (FYA) Permissive Left-Turn and Yellow Arrow Change Indications in Protected/Permissive Left-Turn Control: The Impact of Separate and Shared Yellow Signal Sections and Head Arrangements FINAL REPORT Prepared for National Cooperative Highway Research Program Transportation Research Board of The National Academies David A. Noyce, Ph.D., P.E. Andrea R. Bill University of Wisconsin-Madison Madison, WI Michael A. Knodler, Jr., Ph.D. University of Massachusetts, Amherst Amherst, MA June, 2014
4 i CONTENTS Author Acknowledgments... vi Abstract... vii Summary... 1 Chapter Background Problem Statement Research Objectives and Scope Report Organization... 7 Chapter Review of the Literature Introduction Summary of PPLT Signal Control Literature Driver Comprehension Studies of the Flashing Yellow Arrow Comprehension of the Flashing Yellow Arrow Indication in Various Signal Display Arrangements Comprehension of the Flashing Yellow Arrow Indication with Separate Left-Turn Lanes Impact of Flashing Yellow Arrow Indication on the Circular Green Indication Impact of the Flashing Yellow Arrow Indication on the Steady Yellow Indication Pedestrian Safety at Intersections with the Flashing Yellow Arrow Indication Driver s Search for Information Comprehension of the Flashing Yellow Arrow Indication after Implementation Field Studies of Flashing Yellow Arrow Summary of Literature Review Chapter Research Approach Static Study Development Study Response Data Analysis Dynamic Study Methodology Experimental Results and Data Analysis... 48
5 ii Chapter Findings and Applications Demographics for Computer-Based Static Study Summary of Results for Computer-Based Static Study Summary of Results from Control Scenarios Summary of Results from Baseline and Experimental Scenarios Statistical Analysis Flashing Yellow Arrow Indication Location Comparisons Signal Display Comparisons Thru Indication Comparisons Signal Display and Thru Indication Comparisons Opposing Traffic Comparisons Demographic Comparisons Fail-Critical Comparison Observations from Study Study Demographics for Dynamic Study Summary of Results for Dynamic Study Summary of Results from Driving Simulator Summary of Results from Eye Tracker Chapter Conclusions and Discussion References Abbreviations, Acronyms, and Symbols APPENDIX A: Static Study Scenario and Response Summary APPENDIX B: Computer-Based Static Study APPENDIX C: Screen Shots of Intersections APPENDIX D: Vehicle Trajectories APPENDIX E: Box Plot Charts for the Eye Tracking Data APPENDIX F: Eye Tracker Heat Maps
6 LIST OF FIGURES AND TABLES iii Figure 1. FYA four-section all arrow vertical signal display (Brehmer et al. 2003) Figure 2. Five-section PPLT signal displays (a) five-section cluster, (b) fivesection vertical, and (c) five-section horizontal (Brehmer et al. 2003) Figure 3. Illustration of the yellow trap (MUTCD, 2009) Figure 4. Scenarios evaluated to analyze the impact of various FYA arrangements (Noyce and Smith 2003) Figure 5. Scenarios evaluated to analyze the impacts of simultaneous indications (Knodler et al. 2005) Figure 6. Scenarios evaluated to analyze the impacts of the FYA indication at intersections with wide medians (Knodler et al ) Figure 7. Permissive scenarios evaluated in the driving simulator (Knodler et al ) Figure 8. Permissive left-turn signal displays evaluated (Knodler and Noyce 2005) Figure 9. Partitioned driving simulator visual world (Knodler and Noyce 2005) Figure 10. Example research scenario and question in Missouri (Henery and Geyer 2008) Figure 11. Scenarios evaluated to analyze impacts of FYA implementation (Schattler et al. 2013) Figure 12. FYA signal displays evaluated Figure 13. Practice scenario used in study Figure 14. Example FYA indication and signal display scenario used in study Figure 15. University of Wisconsin-Madison driving simulator Figure 16. University of Wisconsin-Madison driving simulator Figure 17. University of Massachusetts driving simulator Figure 18. Wisconsin driving simulator data collection Figure 19. Driver simulator study experimental and baseline signal displays Figure 19 (con t). Driver simulator study experimental and baseline signal displays Figure 20. Screen capture of typical simulated intersection Figure 21. Route with module Figure 22. Route with module Figure 23. Route with module
7 iv Figure 24. Eye Tracker on a driver Figure 25. Depiction of a heat map of driver fixations Figure 26 Percentage of correct responses for FYA indication location based on signal display Figure 27. Percentage of Fail-critical responses for FYA indication location based on signal display Figure 28. Percentage of correct responses for FYA indication location based on thru indication Figure 29. Percentage of fail-critical responses for FYA indication location based on thru indication Figure 30. Percentage of correct responses in Wisconsin for FYA indication location based on signal display and thru indication Figure 31. Summary of eye tracking behavior Figure 32 Sample eye tracking behavior Figure 33. Heat map for five-section cluster signal display with simultaneous FYA and CR indications Figure 34. Heat map for three-section vertical signal display with FYA indication Figure B-1: Introduction Screen Figure B-2: Demographic Screen Figure B-3: Practice Screen Figure B-4: Question Screen Figure B-5: Thank You Screen Figure C-1. 62a- 5-Section Cluster FYA Bottom Figure C-2. 57b- 5-Section Cluster FYA Middle Figure C-3. 58a- 5-Section Cluster FYA Bottom Figure C Section Vertical Figure C or 18-4-Section Vertical Figure C or 18-4-Section Vertical Figure C-7. 9b or 10b- 3-Section Vertical FYA Middle Figure C-8. 9a or 10a- 3-Section Vertical FYA Bottom Figure D-1.Vehicle Trajectories for 9b, 58a, 58b, 17, 9a Figure D-2.Vehicle Trajectories for 18, 62a, 62b, 10a, 10b, Figure E-1Average Dwell Duration by Scenario Figure E-2. Dwell Count by Scenario Figure E-3. Total Dwell Duration by Scenario
8 v Table 1. Available responses for demographic questions Table 2. Example of raw static study data Table 3. Summary of demographic information Table 4. Summary of results based on signal display and FYA section Table 5. Formatting associated with p values Table 6. Chi-Squared analysis for FYA indication location comparisons Table 7. Average response time (seconds) based on FYA indication location Table 8. Chi-Squared analysis for signal display comparisons Table 9. Average response times based on signal display Table 10. Chi-Squared analysis for FYA indication location based on signal display Table 11. Chi-squared analysis for thru indication comparisons Table 12. Average response times based on thru movement indication Table 13. Chi-Squared analysis FYA indication location based on thru indication Table 14. Chi-Squared analysis for opposing traffic comparisons Table 15. Average response times based on opposing traffic Table 16. Chi-squared analysis for driving experience comparisons Table 17. Chi-squared analysis for age comparisons Table 18. Average response times based on driving experience Table 19. Average response times based on age Table 20. Summary of demographic information Table 21. Summary of Trajectory Data Table A-1. Static study signal display scenarios evaluated Table A-1. Static study signal display scenarios evaluated (cont t) Table A-1. Static study signal display scenarios evaluated (con t) Table A-1. Static study signal display scenarios evaluated (con t) Table A-1. Static study signal display scenarios evaluated (con t) Table A-1. Static study signal display scenarios evaluated (con t) Table A-1. Static study signal display scenarios evaluated (con t) Table A-1. Static study signal display scenarios evaluated (con t)
9 Author Acknowledgments The research project reported herein was performed under NCHRP Project 20-07/Task 283 by the Traffic Operations and Safety (TOPS) Laboratory at the University of Wisconsin-Madison in association with the University of Massachusetts, Amherst. The University of Wisconsin- Madison served as the contractor. Dr. David A. Noyce, P.E., Professor of Civil and Environmental Engineering at the University of Wisconsin-Madison, was the project director and principal investigator. The other authors of this report are Andrea R. Bill and Michael A. Knodler, Jr. The research team would like to thank Kelvin Santiago-Chapparo, Lingqiao Qin, Ibrahim Yousif Alsghan, Dongxi Zheng, Tracy Zafian, Curt Harrington, Foroogh Hajiseyedjavadi, Craig Schneider, Dale Veselsky, and Siby Samuel for their tremendous help with the Driving Simulator study and Daniel P. Reichl for his work with the computer-based study. The research team also wishes to thank all participants in this study. Their contribution was critical for the development of the report. vi
10 Abstract The objective of this research was to analyze driver behavior and comprehension related to the flashing YELLOW ARROW (FYA) permissive left-turn indication when added to three- and five-section traffic signal displays. FYA indications were evaluated bimodally with both the GREEN ARROW (GA) and YELLOW ARROW (YA) indications and compared with the recommended four-section vertical all arrow signal display. Findings from a computer-based static study showed no significant differences in driver comprehension when the FYA indication was presented bimodally in the bottom section or middle section of a three-section vertical signal display. However, driver comprehension was significantly lower when the FYA indication was added bimodally to the five-section cluster signal display with a simultaneous thru movement indication illuminated. Results of a full-scale driving simulator evaluation showed no significant differences in driver performance or vehicle operation between the evaluated traffic signal display combinations. Driver eye tracking data showed that participants spent considerably more time looking at opposing traffic than at the combination of FYA and thru movement indications. Research results support the recommendation that the FYA permissive left-turn indication can be effectively implemented bimodally with the YA indication in a three-section vertical signal display, but not bimodally with the GA or in any five-section cluster signal display. vii
11 Summary Evaluation of the Flashing Yellow Arrow (FYA) Permissive Left-Turn and Yellow Arrow Change Indications in Protected/Permissive Left-Turn Control: The Impact of Separate and Shared Yellow Signal Sections and Head Arrangements NCHRP 20-07/Task 283, Evaluation of the Flashing Yellow Arrow (FYA) Permissive Left- Turn and Yellow Arrow Change Indications in Protected/Permissive Left-Turn Control: The Impact of Separate and Shared Yellow Signal Sections and Head Arrangements had one primary research goal: 1 To analyze driver behavior and driver comprehension related to retrofitting existing threesection and five-section traffic signal displays by installing a flashing YELLOW ARROW (FYA) permissive left-turn indication in a bimodal traffic signal section. FYA indications were evaluated bimodally with both the GREEN ARROW (GA) (bottom section) and YELLOW ARROW (YA) (middle section) indications. In addition to the location of the FYA indication, other variables were analyzed to determine the extent of their impact on driver behavior and driver comprehension. These variables included signal display arrangement, thru indication, presence of opposing traffic, and driver demographics. Two study methodologies were employed: a computer-based static study and a full-scale driving simulator study. The computer-based static study queried participating drivers on how they would respond, when turning left, to 12 different combinations of left-turn signal indications and signal displays. Participants were provided four possible responses: Not allowed to turn left, stop; Allowed to turn left; however, you must wait for a large enough opening in the oncoming traffic before doing so, yield; Allowed to turn left since the oncoming traffic must stop, go; and Not sure whether or not a left-turn is allowed. Data collection was conducted in Madison, Wisconsin and Amherst, Massachusetts over a threeweek period in November and December of Over 440 drivers participated in the computerbased static study for a total of nearly 9,000 scenarios evaluated. After completing the computer-based static study data collection effort, a statistical analysis was completed to determine the impacts of the various traffic signal indications and display combinations on driver comprehension. For all signal display arrangements evaluated, there was not a statistically significant difference in driver comprehension when the FYA indication was located in the middle section or the bottom section of the signal display. In Wisconsin, scenarios involving a FYA indication in the middle section had a correct response rate of 77.4%, while scenarios involving a FYA indication in the bottom section had a correct response rate of 78.1%. In Massachusetts, the correct
12 2 response rates were 68.1% and 70.0%, respectively. Analyses were also completed to determine whether the location of the FYA indication was comprehended differently for selected signal displays and thru movement indications. There were no significant differences identified. When considering the traffic signal display arrangement, driver comprehension was the lowest for the five-section cluster signal display with simultaneously illuminated left-turn and thru movement indications. The fact that the five-section cluster signal display with simultaneous indications had the lowest correct response rate in both states was not surprising as previous research completed by Noyce and Kacir, and Knodler, et al., had shown that driver comprehension is significantly reduced with simultaneous indications (Noyce and Kacir 2005, Knodler, Noyce, Kacir, and Brehmer 2005). Overall, the results show that the signal display arrangement did not impact driver comprehension of the FYA indication. Driver comprehension was significantly impacted by the adjacent thru indication in Wisconsin. Left-turn signal displays with the FYA indication with a CIRCULAR GREEN (CG) thru movement indication had the highest correct response rate at 89.7%, followed by the CIRCULAR YELLOW (CY) indication with a correct response rate of 74.6%. When the adjacent indication was a CIRCULAR RED (CR) indication, the lowest correct response rate at 66.9% was observed. The differences between each of these adjacent thru indications was statistically significant. Massachusetts had similiar results with correct response rates of 79.1% with a thru CG indication, 69.9% with a thru CY indication, and 60.8% with a thru CR indication, respectively. Results show that the thru indication is considered in left-turn decision making and has a large impact on driver comprehension. A second research study included full-scale driving simulator evaluations completed in Madison, Wisconsin and Amherst, Massachusetts. Eye tracking technology was used to determine how a subset of participants searches for information within the visual scene. Vehicle trajectory was captured as the driver entered the left turn lane thus evaluating driver behavior as the signal changes indications. Vehicle trajectory data and eye tracking data were collected to evaluate driver behavior and how drivers search for permissive left-turn information. A total of 56 drivers participated in the driving simulator study providing 466 scenario responses. A bimodal FYA indication in a three-, and five-section signal display was featured in 339 of the scenarios evaluated. Eye tracking data was also collected for 16 drivers. Findings show no significant differences in driver comprehension when the FYA indication was presented bimodally in the bottom section or bimodally in the middle section of a three-section vertical signal display. Post-driving simulator participant queries found that 38% preferred the FYA indication in the middle section, 9% preferred the bottom section, and 54% indicated no preference. There was also no significant difference in correct responses between the threesection and four-section vertical signal displays. No significant differences were observed with bimodal sections in a five-section cluster signal display when a simultaneous thru movement indication was not illuminated. Although permissive left-turn indications presented in a fivesection cluster signal display without the adjacent thru movement indication is not allowable, the results show that signal display arrangement is not significant in driver comprehension. Driver comprehension was significantly lower when the FYA indication was added bimodally to the five-section cluster signal display and the simultaneous thru movement indication was illuminated. This result was most significant when the simultaneous thru movement indication was CR.
13 3 Speed trajectory data showed drivers decreasing their speed and/or stopping to wait for an acceptable gap in each of the experimental scenarios. Trajectories also showed vehicles stopping past the stop bar of the approach and then proceeding after selecting a gap. In multiple instances, drivers appeared to make a decision to proceed and continued moving, only to reconsider their decision by slowing to yield to opposing traffic and search for a gap. Observed behavior was expected when drivers were presented with a FYA indication. There was evidence to support the observation of driver confusion associated with the five-section cluster signal display and simultaneous CR thru indication. Average speed was lower and speed variance less at the stop bar location, indicating a greater number of drivers hesitated and/or stopped as they tried to comprehend the appropriate action. No differences in driving behavior were observed in the trajectories of scenarios with a bimodal indication and of those without the bimodal indication. Furthermore, no difference in the trajectories was observed when comparing those scenarios in which a RED ARROW (RA) indication was presented prior to the signal going into the FYA indication mode. Eye tracking data showed that participants spent more time looking at opposing traffic than at the combination of FYA and thru movement indications. Evidence of a more rapid search process between opposing traffic and the signal displays was observed when drivers did not completely comprehend the traffic signal displays. This evidence was clearly observed with the five-section cluster signal display with a simultaneous CR indication. Combined research results show that the FYA indication can be effectively used (retrofit) in existing three-section vertical signal displays, when combined bimodally within the YA or GA indication section, without negatively impacting driver behavior and comprehension. The FYA indication retrofit is not recommended for use in any section of a five-section cluster signal display with or without simultaneous indications. Other signal display arrangements do not impact driver comprehension of the FYA indication, as long as simultaneous indications are not used. Although the static and driving simulator studies do not show a difference in driver behavior and driver comprehension when the FYA indication is either in the middle or bottom section of the three-section signal display, the post-driving simulator questionairre clearly suggested that drivers prefer the FYA/YA bimodal signal indication within the middle section. Furthermore, with the FYA/GA bimodal indication in the go section of the signal display, the probability of a fail-critical error was increased. Recall that reduction in fail-critical errors has proven to be the significant contribution of using a FYA permissive left-turn indication. Although there is some concern with the FYA indication being bimodal with the YA indication in drivers detecting the change from FYA to solid YA during the change interval, post-driving simulator participant questionnaire responses, along with the high probability of a fail-safe response and no observed concerns in the experimental evaluations, makes the FYA/YA bimodal indication the most desirable retrofit. Therefore, researchers recommend that the FYA indication can be effectively used in a three-section traffic signal display only when used bimodally with the steady YA indication.
14 CHAPTER 1 4 Background In August of 2012, the National Academy of Sciences through the Transportation Research Board awarded a research contract under the National Cooperative Highway Research Program (Research Contract NCHRP 20-07/Task 283) to a team led by the Traffic Operations and Safety (TOPS) Laboratory at the University of Wisconsin-Madison. The research team included the University of Massachusetts, Amherst. Under this contract, the research team, working closely with the Research Project Panel, performed an evaluation of the flashing YELLOW ARROW (FYA) permissive left-turn indication in shared (bimodal) yellow and green arrow signal sections. To complete the research described in this report, the research team conducted a comprehensive literature review, performed a computer-based (static) study, a full-scale driving simulation (dynamic) study including the use of eye tracking technology, and completed statistical analyses to evaluate driver behavior and driver comprehension associated with the FYA permissive left-turn indication in three- and five-section traffic signal displays. Left-turns at signalized intersections continue to be a significant challenge for transportation professionals, from both a safety and operations standpoint. Navigating a left-turn can be a dangerous maneuver for drivers to complete because of the requirement to simultaneously focus on several dynamic aspects of the visual scene while crossing the opposing lane(s) of traffic. Specifically, prior to completing a left-turn, a driver must comprehend the meaning of the traffic signal indication, determine if the desired movement is protected or permissive, evaluate oncoming traffic movements and vehicle gaps, consider conflicting pedestrians in the crosswalk of the entering roadway, evaluate other visual, haptic and cognitive inputs, and then determine when it is safe to turn. The National Highway Traffic Safety Administration (NHTSA) estimated that approximately 22% of crashes occurring at intersections are associated with left-turn movements (Choi 2010). As a result, improving safety conditions for left-turning vehicles has the potential to significantly reduce crash rates and improve signalized intersection safety. To improve safety for left-turning drivers, a protected-only left-turn traffic signal phase is often used. However, from an operations standpoint, providing protected-only left-turns takes time away from opposing thru movements and typically reduces the overall capacity of the intersection. Many transportation professionals have implemented protected/permissive left-turn (PPLT) control as a way to maintain a safe operating environment while increasing left-turn capacity. In PPLT signal phasing, both a protected phase and a permissive phase are provided for left-turn drivers, within the same signal cycle. Additional benefits in traffic progression and overall corridor management can also be achieved. As a result, the use of PPLT phasing is commonly used by transportation professionals throughout the United States (Noyce et al. 2000). A wide variety of signal displays and indications have been used to implement permissive leftturn movement in PPLT control. Reasons for the variety are many, but include transportation professionals dissatisfaction with the safety and operation performance with the steady CIRCULAR GREEN (CG) permissive indication, and the lack of specific direction from the Manual on Uniform Traffic Control Devices (MUTCD). Many state and local jurisdictions use a five-section signal display that features a steady CIRCULAR GREEN (CG) indication for the permissive left-turn phase and a steady GREEN ARROW (GA) for the protected left-turn phase.
15 5 Previous research has shown conclusively what many transportation professionals believed; that is, the CG indication has the potential to create driver confusion and safety problems (Brehmer et al. 2003). This confusion stems from the fact that the CG indication provides a go message to thru vehicles, but provides a very different yield to oncoming traffic and select appropriate gap before proceeding message to left-turning vehicles. The dual meaning of the CG indication and associated safety problems led transportation professionals to experiment with an array of indications and signal displays to improve permissive left-turn communication with drivers. Specifically, experimental permissive left-turn indications included the use of the flashing CIRCULAR RED (FCR), flashing RED ARROW (FRA), flashing CIRCULAR YELLOW (FCY), and flashing YELLOW ARROW (FYA), in some form of a three-, four- or five-section signal display (Brehmer et al. 2003). One of the guiding principles since the inception of the MUTCD is traffic control devices should be placed and operated in a uniform and consistent manner (Federal Highway Administration 2009). The National Committee on Uniform Traffic Control Devices (NCUTCD) expressed concern about the lack of uniformity in regards to PPLT control (Brehmer et al. 2003). As a result, NCHRP Project 3-54 was conducted to evaluate the various indications used for PPLT control and to make a recommendation as to which PPLT indication (and signal display) conveyed the clearest and safest message to drivers. NCHRP Report 493 was published as a comprehensive summary of the research completed as part of NCHRP Project Results from the multiple studies described in NCHRP Report 493 found that drivers comprehended the FYA indication at a consistent level with the CG indication, including drivers who had not experienced the FYA indication previously (Brehmer et al. 2003). More significantly, drivers who did not correctly comprehend the permissive left-turn indication most often yielded with the FYA indication (fail-safe error) as compared to go with the CG indication (fail-critical error). The FYA indication also provided greater flexibility in signal phasing and could be used to eliminate the yellow trap condition. Recall that the yellow trap exists when the CG indication changes to a CY indication for a left-turning vehicle and the adjacent thru movement vehicles, while the opposing traffic continues with a thru CG indication. When this occurs, drivers turning left often assume that opposing traffic is also presented with a CY indication, and proceeds with a left-turn maneuver into non-stopping thru traffic creating a safety problem. NCHRP Report 493 recommended that the FYA indication be included in the MUTCD as an alternative to the CG indication for PPLT control. NCHRP Report 493 also recommended that the FYA be implemented in an exclusive four-section all arrow vertical signal display arrangement as shown in Figure 1. Based on research results highlighted in NCHRP Report 493, the Federal Highway Administration (FHWA) issued Interim Approval for the use of the FYA indication in March of 2006, followed by the inclusion of the FYA indication for permissive left- and right-turns in the 2009 MUTCD (Federal Highway Administration 2009). Since 2006, numerous states and municipalities around the country have implemented the FYA permissive left-turn indication.

16 6 Figure 1. FYA four-section all arrow vertical signal display (Brehmer et al. 2003). 1.1 Problem Statement Section 4D.20 of the 2009 MUTCD allows the use of a three-section vertical signal display for PPLT mode using the FYA indication. Reasons for using a three-section signal display is not specifically for retrofitting existing signal displays; rather, to accommodate locations in which vertical height or lateral position limitations prevent the use of a four-section signal display. When using a three-section signal display, the MUTCD requires that the FYA indication be bimodal with the GA indication in the bottom (or right) section of the signal display. Jackson County, Oregon is the first known transportation agency to implement a three-section vertical signal display to accommodate the use of the FYA indication in PPLT control. Jackson County implemented the FYA bimodally with the YA in the middle section of a retrofitted threesection vertical signal display, inconsistent with the MUTCD requirements. Other agencies have also considered retrofitting five-section signal displays to implement the FYA indication bimodally with either the GA or YA indication. Although the MUTCD allows the use of bimodal indications in a three-section signal display, and by all anecdotal measures the Jackson County retrofit has been effective, no research efforts have specifically focused on evaluating the effectiveness of implementing the FYA in a bimodal indication, or determining if it is best for the FYA indication to be bimodal with the GA or YA indication. Therefore, research was needed to evaluate driver behavior and comprehension of the FYA permissive left-turn indication when implemented in a three-section or five-section traffic signal display bimodally with either the steady GA or YA indication.
17 7 The underlying research hypothesis suggests that retrofitting existing signal displays will lead to a broader and more rapid implementation of the FYA permissive left-turn indication throughout the U.S. However, previous research has not specifically evaluated driver comprehension and behavior related to these retrofit signal displays. 1.2 Research Objectives and Scope The objective of this research was to analyze the human factors associated with retrofitting existing traffic signal displays with the FYA permissive left-turn indication. Specifically, this research focused on driver behavior and driver comprehension of the FYA indication and corresponding YA change interval indication when contained in the same signal section when implementing the FYA indication in protected/permissive left-turn control. Combining the FYA and GA indication in the same signal section, as described in the MUTCD, was also considered. The following six signal display arrangements and indications were evaluated: Three-Section Vertical: Bottom Section GA/FYA Bimodal; Three-Section Vertical: Middle Section YA/FYA Bimodal; Four-Section Vertical: All Arrow (Current MUTCD Standard); Four-Section Horizontal: All Arrow (Current MUTCD Standard); Five-Section Cluster: Bottom Left Section GA/FYA Bimodal; and Five-Section Cluster: Middle Left Section YA/FYA Bimodal. Driver behavior and driver comprehension were analyzed by conducting a computer-based static study and a full-scale driving simulator study. Both studies were completed in Madison, Wisconsin and Amherst, Massachusetts. Additionally, eye tracking technology was included with a subset of driving simulator participants to explore how these participants searched for information within the visual scene. Results from both studies were analyzed to determine if the location of the FYA indication section within any given signal display arrangement has a significant impact on driver behavior and comprehension. In order to limit the number of scenarios presented to drivers, only selected signal display arrangements and indication combinations were used. 1.3 Report Organization Chapter 2 of this report provides background information and a comprehensive review of the literature pertaining to previous evaluations of the FYA permissive left-turn indication. Chapter 3 summarizes the research approach used as well as details of the two study methods used to complete the research. Finally, Chapter 4 presents the results and conclusions of the research, along with recommendations for retrofitting the FYA indication in three- and five-section signal displays.
18 CHAPTER 2 8 Review of the Literature 2.1 Introduction The MUTCD identifies four modes of left-turn control that can be used at signalized intersection (Federal Highway Administration 2009): Permissive-Only: Left-turning vehicles must yield to oncoming traffic and pedestrians before completing the turn. This mode does not require an exclusive signal display. Protected-Only: Left-turning vehicles may go when there is a GA indication illuminated. This mode does require an exclusive signal display for left-turning vehicles. Protected/Permissive: Left-turning vehicles are provided with a protected interval and permissive interval during each signal cycle. This mode does require an exclusive signal display for left-turning vehicles for use with the FYA indication. Variable: The mode used to control left-turn movements changes throughout the day based on time of day and traffic volume. This mode requires an exclusive signal display for leftturning vehicles. Protected-only left-turn phasing is considered the safest mode of left-turn control because all conflicting movements are held when the left-turn movement takes place. The problem transportation professionals face with protected-only left-turn phasing is that operational efficiency can be significantly reduced, since time is taken away from higher traffic volume thru phases in order to provide time for the protected left-turn phase. PPLT signal control was developed to improve operational efficiency, as left-turning vehicles can complete the left-turn maneuver during the protected phases as well as a permissive phase if sufficient gaps are available in the oncoming traffic. Since many of the left-turning vehicles complete the turn while having a protected left-turn, PPLT phasing still offers many of the safety advantages of using protected left-turn control (Brehmer et al. 2003). Significant variation has developed over the years in how PPLT signal phasing information is presented to drivers. Variation has extended into traffic signal displays, signal display arrangements, and in the permissive left-turn indication used. Recently, the FYA indication has become the commonly used permissive left-turn indication for PPLT signal control. The following sections summarize the relevant research and literature that pertains to left-turn signal control and the development and implementation of the FYA indication. 2.2 Summary of PPLT Signal Control Literature NCHRP Report 493, published in 2003, identified MUTCD standards for PPLT control, alternative PPLT indications and signal displays used in the past, and summarized several research tasks conducted over a seven-year period as part of NCHRP Project The ultimate goal of this research was to identify the most effective permissive left-turn indication and traffic signal display for PPLT control.

19 9 Prior to NCHRP Report 493, PPLT left-turn indications were included within multiple traffic signal display configurations throughout the United States. Requirements outlined in Section 4D.13 of the MUTCD state that at an intersection a minimum of two primary signal faces shall be provided for the thru movement. If a signalized thru movement does not exist on an approach, a minimum of two primary signal faces shall be provided for the signalized turning movement that is considered to be the major movement from the approach (Federal Highway Administration 2009). A common scenario that meets this MUTCD requirement is to utilize a five-section cluster signal display for the left-turn and thru movements and an adjacent threesection signal display for thru and right-turn movements. Five-section horizontal and fivesection vertical signal displays are also used for combined left-turn and thru movements (Brehmer et al. 2003). Together, the five-section horizontal, vertical and cluster signal displays accounted for over 90% of all reported PPLT signal displays. The MUTCD standard for PPLT control includes a steady GA indication for the protected left-turn phase and a steady CG indication for the permissive left-turn phase. In five-section signal displays, as presented in Figure 2, both the GA indication and corresponding thru movement indication are illuminated simultaneously in the same signal display. Figure 2. Five-section PPLT signal displays (a) five-section cluster, (b) five-section vertical, and (c) five-section horizontal (Brehmer et al. 2003).
20 10 When the CG indication for the permissive left-turn signal indication was introduced, the indication had several disadvantages (Brehmer et al. 2003). The main disadvantage was that the dual meaning of the CG indication sends a conflicting message to drivers. For thru vehicles, the CG indication means that drivers have the right-of-way and can proceed cautiously through the intersection after yielding to road users lawfully in the intersection. For left-turning vehicles, the same CG indication means that drivers must yield to oncoming traffic and pedestrians, and search for an appropriate gap prior to making the left-turn maneuver. Driver confusion and associated safety problems are the result of a traffic signal indication with two different meanings. A second disadvantage in using the CG indication in PPLT lead-lag left-turn signal phasing is the potential introduction of a yellow trap condition, unless special signal sections are used to prevent adjacent thru traffic from observing the left-turn indications. The yellow trap condition exists when the CG indication changes to a CY indication for a left-turning vehicle, while the oncoming traffic maintains a CG indication, as shown in Figure 3. When this scenario occurs, drivers turning left enter the intersection when the maneuver is unsafe since opposing traffic still has a CG indication. Given the disadvantages associated with the CG permissive left-turn indication, transportation professionals have attempted to use an array of alternative indications for the permissive left-turn component of PPLT control, including the FCR, FRA, FCY, and FYA. Special lenses and louvers have also been tried to obscure conflicting indications associated with unique phasing schemes designed to eliminate the yellow trap. Based on the research results, NCHRP Report 493 recommended that the FYA indication should be included in the MUTCD as an alternative to the CG indication for PPLT control (Brehmer et al. 2003). A four-section all arrow vertical signal display was recommended. The four-section vertical signal display eliminates the need to illuminate simultaneous indications, uses a different section for each indication, and has been shown through previous research to be well comprehended by drivers. These recommendations were accepted by the Federal Highway Administration (FHWA) and are now included in the 2009 edition of the MUTCD. The steady CG indication also remains in the MUTCD as an acceptable permissive left-turn indication. While adding a FYA indication in a separate four-section all arrow vertical signal display is preferred, it may not be feasible in all locations. Hence, the implementation costs, logistics and infrastructure requirements needed to add this new signal display may prevent some agencies from implementing the FYA indication. Given that many jurisdictions currently use the shared five-section cluster signal display with the CG indication for PPLT movements, retrofitting a shared five-section cluster signal display may be one logical and inexpensive way to implement the FYA indication as an interim or long-term installation.
21 *N=north; S=south; E=east; W=west; NB=northbound; SB=southbound Figure 3. Illustration of the yellow trap (MUTCD, 2009). 11
22 Driver Comprehension Studies of the Flashing Yellow Arrow Numerous research studies pertaining to the FYA permissive left-turn indication have been completed since the publication of NCHRP Report 493. A large number of these studies focused on driver comprehension and response to the FYA indication, although several also focused on the safety aspects of using the FYA indication. Several terms commonly used in these studies and throughout this research and report are presented here in the form of definitions (Knodler, Noyce 2005). These terms include: Correct Response - the driver interpreted the PPLT signal indication correctly; Fail-Safe Response - the driver interpreted the PPLT signal indication incorrectly, but did not impede on the right-of-way of the opposing traffic; and Fail-Critical Response - the driver interpreted the PPLT signal indication incorrectly and did impede on the right-of-way of the opposing traffic. In a real world scenario, the Fail-Critical Response will likely result in a crash Comprehension of the Flashing Yellow Arrow Indication in Various Signal Display Arrangements NCHRP Report 493 recommended that the FYA indication be implemented using an exclusive four-section all arrow vertical signal display (Brehmer et al. 2003). Many agencies that currently use PPLT signal phasing do not use a separate signal display for the left-turn movement; rather, they use a five-section signal display which allows thru movement and left-turn movement requirements to be communicated through a single signal display. Retrofitting existing signal displays may make implementing the FYA indication easier and less expensive for agencies, but it will also continue to require the simultaneous and often conflicting illumination of left-turn and thru movement indications in the same signal display. Specifically, the FYA left-turn indication would be presented simultaneously with a thru movement CG, CY, or CR indication. Simultaneous indications in a single signal display have been shown to negatively impact driver comprehension and are not recommended (Noyce and Kacir 2002; Knodler, Noyce, Kacir, and Brehmer 2005). A number of studies have been completed which explored the impact of signal display arrangements on driver comprehension. Noyce and Smith evaluated driver comprehension of the FYA indication in various arrangements of five-section signal displays (Noyce and Smith 2003). A full-scale driving simulator study was completed in addition to a computer-based static driver comprehension study. A total of 15 scenarios were analyzed, as shown in Figure 4, which included the CG, flashing CY (FCY), FYA, flashing CR (FCR), and flashing RA (FRA) indications. The computer-based static study presented drivers with images of each of the 15 experimental scenarios (Noyce and Smith 2003). For each image they were given the following responses to choose from: Go, you have the right-of-way; Yield, go if an acceptable gap in opposing traffic allows;
23 G G G Y Y Y Y Y Y R R R R R R Permissive Indications: R = FLASHING RED Y = FLASHING YELLOW G = STEADY GREEN Figure 4. Scenarios evaluated to analyze the impact of various FYA arrangements (Noyce and Smith 2003).
24 Stop, then go if an acceptable gap in opposing traffic allows; and Stop, you do not have the right-of-way. 14 The driving simulator study included a total of 24 intersections, with 10 of the intersections involving permissive left-turns. Each participant completed four driving simulator modules, with the background scene and order of movements changed each time. A total of 991 responses were evaluated. Study results showed that the CG, FYA, and FCY indications were best understood (Noyce and Smith 2003). FCR or FRA indications were not well comprehended. The five-section horizontal signal display using the FCY indication was the best understood signal display. The CG indication had a significantly lower comprehension rate in the computer-based static study when compared to the driving simulator results. Researchers concluded that drivers do not understand the true meaning of the CG indication, and use other visual cues to determine the correct response at an intersection. This research study was one of the first to use full-scale driving simulation to evaluate traffic signal comprehension and was concluded to be a very effective research methodology. Researchers followed the Noyce and Smith study by conducting research to evaluate the impact of simultaneous indications with a retrofitted FYA indication on driver comprehension (Knodler et al. 2005). Implementation of the FYA indication in a five-section cluster signal display will require simultaneous illumination with either a CG, CY, or CR indication corresponding to the adjacent thru lanes and movement. A full-scale driving simulator study was completed, as well as a follow-up and independent driver comprehension evaluation. Multiple variations of the five-section cluster signal display were evaluated and compared to the foursection vertical signal display, as shown in Figure 5 (Knodler et al. 2005). A total of 54 drivers participated in the driving simulator study. Each driver participated in two modules that consisted of 14 intersections. Eight of the intersections featured permissive leftturns, whereas the rest of the intersections presented other movement types to add variability to the driver simulator scenario. Each scenario contained a PPLT signal display and opposing traffic, and the experiment included intersections that did not feature PPLT to ensure variability and to counterbalance the objective of the experiment. Every driver that completed the simulator study also completed a follow-up static study. An additional 210 participants were recruited to complete an independent static study (Knodler et al. 2005). Each participant was shown 29 scenarios, including the seven signal displays shown in Figure 5, resulting in over 2,300 scenarios evaluated. For each scenario, the participant was asked what they would do if they wanted to turn left. The following answers were available for selection: Go because you have the right of way; Yield and wait for a gap; Stop and then wait for a gap; and Stop and wait for a signal.
25 15 Sc. # PPLT Signal Indication Adjacent Through Signal Indication Sc. # PPLT Signal Indication Adjacent Through Signal Indication 1 5 G G Y G G 2 6 Y G G Y R R 3 7 Y R R Y Y Y 4 Y Y Y Figure 5. Scenarios evaluated to analyze the impacts of simultaneous indications (Knodler et al. 2005). Researchers found that the simultaneous illumination of the FYA indication and the adjacent thru movement indication did not significantly affect drivers understanding of the permissive indication. Research results also showed that the FYA indication improved driver comprehension when compared to the existing CG indication. In the follow-up driver comprehension study, 89% responded yield to the five-section cluster signal display with FYA and CG indications simultaneously illuminated. When only the CG indication was illuminated, 65% responded yield, which was found to be statistically significant when compared to the simultaneous display of the FYA and CG indications. The driving simulator study resulted in no significant differences between the percentages of yield responses. Nevertheless, researchers concluded that the use of the FYA indication in the five-section cluster signal display did not significantly reduce driver comprehension. Recall that previous research identified driver comprehension concerns associated with the use of simultaneous indications, leading to the
26 16 recommendation that the FYA indication could be implemented into a five-section cluster signal display only as an interim solution until agencies upgrade to the four-section all arrow vertical signal display (Noyce and Kacir 2002; Knodler, Noyce, Kacir, and Brehmer 2005). Drakopoulos and Lyles evaluated driver comprehension of flashing indications with respect to color combination, driver age, and driver location, using multivariate multiple response analysis of variance models (Drakopoulos and Lyles 2001). Almost 200 participants were shown 83 signalized intersections. Flashing red or yellow indications were included in 22 of those scenarios. For each scenario, participants were presented with five options describing proper left-turn maneuvers: Turn left, you have the right-of-way (protected left-turn). Turn left without stopping unless you have to wait for a large enough gap in the opposing traffic (permitted left-turn). Stop. Then turn left when there is a large enough gap in the opposing traffic. Stop. Then turn left when there is a large enough gap in the cross street traffic. Stop. Wait until the signal changes to indicate that you may proceed. Participants were asked to identify each maneuver as correct or incorrect for all scenarios, and responses were categorizes as correct, minor error (fail-safe), or serious error (fail-critical). Researchers used a repeated measures general linear model in order to analyze the simultaneous effect of study location, and subject age on serious error responses for multiple signal displays. Overall, the analysis proved that there was little to no distinction between age groups in comprehension of the signal indications. Results showed that the most well comprehended signal indication was a FYA. The FRA was the poorest comprehended indication Comprehension of the Flashing Yellow Arrow Indication with Separate Left-Turn Lanes Intersection geometry is a major factor that has potential to impact the probability that drivers erroneously comprehend the CG permissive left-turn indication and assume they have right-ofway. Wide intersections with left-turn lanes separated from the adjacent thru and right-turn lanes are one example of geometric design configurations that have this potential. This lane separation creates a scenario where left-turning vehicles do not see the traffic signal displays designated for thru vehicles, and as a result, can only see the signal display(s) associated with the left-turn lane. In this scenario, several jurisdictions have installed a FRA indication to indicate a permissive left-turn driver must a stop before selecting a gap and proceeding left. When the FYA indication was recommended in NCHRP Report 493, this particular geometric configuration was not thoroughly evaluated. Knodler, et al. conducted research to evaluate the effectiveness of the FYA indication when compared to the FRA indication at intersections with separated left-turn lanes (Knodler et al ). The experiment included a driving simulator study and a driver comprehension study. Four permissive signal displays, shown in Figure 6, were evaluated in both studies. Research was conducted in Massachusetts and Wisconsin, two states using the CG indication for PPLT signal phasing and only protected left-turn movements at wide intersections. As a result, researchers assumed that the study participants were unfamiliar with a FYA and FRA indication
27 as an alternative to the CG indication for permissive left-turns. Scenario #1 Scenario #2 Scenario #3 Scenario #4 17 R R Y Y Figure 6. Scenarios evaluated to analyze the impacts of the FYA indication at intersections with wide medians (Knodler et al ). A total of 54 participants were used in the driving simulator study (Knodler et al ). Each participant was exposed to 29 different scenarios, including the four permissive signals shown in Figure 6. The purpose of providing a wide range of scenarios was to increase the variability in the experiment and prevent participants from identifying the nature of the study. Every driver that completed the simulator study also completed a follow-up static study (Knodler et al ). An additional 100 participants were recruited to complete the same study without completing the driving simulator study. For each scenario, the participant was asked what they would do if they wanted to turn left. The following responses were available for selection: Go because you have the right of way; Yield and wait for a gap; Stop and then wait for a gap; and Stop and wait for a signal. The results for the driving simulator experiment showed that the two scenarios using the FYA indication resulted in a significantly higher percentage of yield responses, at approximately 70% (Knodler et al ). The two FRA indication scenarios resulted in a significantly higher percentage of Stop and Wait responses. The FYA indication scenarios did have more fail-critical go responses than the FRA indication scenarios. All but one of the go responses for the FYA indication scenario occurred on the driver s first observation of the FYA indication. The followup static study resulted in correct responses ranging from 91% to 93%. Once again, the FYA indication scenarios did have more fail-critical go responses than the FRA indication scenarios. The independent static study provided results similar to the driving simulation and follow-up study. FYA indication scenarios had a yield response rate of 62% and once again provided more fail-critical responses than the FRA indication scenarios. Researchers concluded that the FYA indication was not a recommended permissive left-turn indication at wide intersection locations where the left-turn lanes are separated from the thru and right-turn lanes, and the left-turn driver cannot see the thru movement indication.
28 2.3.3 Impact of Flashing Yellow Arrow Indication on the Circular Green Indication Since the FYA indication will not replace the steady CG indication for permissive left-turns, there will be two permissive left-turn indications in use for the next several years (Knodler et al ). Specifically, both the FYA and the CG indications will be used to communicate the same yield meaning to left-turning drivers. There were some concerns that as drivers become more familiar with the FYA indication, they will develop a different understanding of the CG indication. It is plausible that drivers would begin to comprehend the CG indication as a go indication in all scenarios, instead of a permissive left-turn yield, creating a fail-critical situation. Knodler, et al. conducted research to evaluate the impact of the FYA indication implementation on driver comprehension of the CG indication (Knodler et al ). The hypothesis of their research was that drivers are more likely to interpret the CG permissive indication to indicate a right-of-way situation if the FYA indication is implemented at a number of intersections and drivers comprehend the FYA indication. A static driver comprehension study and a driving simulator experiment were completed. Seven scenarios were used in this study with five featuring the FYA indication and two featuring the CG indication. A total of 100 participants completed the study (Knodler et al ). Prior to starting the study, each participant was provided with a tutorial informing him or her of what to do when they see a FYA indication. The tutorial also explained that they should yield to oncoming traffic, and clearly explained that they do not have the right-of-way and that they do not need to stop and wait for another signal cycle. For each scenario presented, participants were asked what they would do if they wanted to turn left. The following answers were available for selection: 18 Go, you have the right of way; Yield, then go if a gap in the opposing traffic exists; Stop, then go if a gap in the opposing traffic exists; and Stop and wait for the appropriate signal. A total of 25 participants also completed the driving simulator study (Knodler et al ). Each participant encountered 14 intersections and completed seven left-turns. Left-turns included a mix of FYA, CG, and protected GA indications. Results from this study were compared to the results of previous studies to see how driver comprehension of the CG indication changes after they have a better understanding of the FYA indication (Knodler et al ). A chi-squared analysis was used to complete the analysis and compare the results. Results from the driving simulator experiment showed that driver comprehension of the CG indication before exposure to the FYA indication did not significantly change from driver comprehension of the CG indication after exposure to the FYA indication. The static study showed similar results. In a follow-up study, drivers exposed to the FYA indication actually answered yield when the CG indication was presented more often than drivers who had not been exposed to the FYA indication. Researchers concluded that implementing the FYA indication did not impact driver comprehension of the CG indication.
29 2.3.4 Impact of the Flashing Yellow Arrow Indication on the Steady Yellow Indication Traffic engineers have voiced concern about how to effectively terminate a signal phase once the FYA permissive indication is implemented on a broad scale. The concern is based on the fundamental understanding that when drivers observe a yellow indication it means that a signal phase is being terminated. By implementing the FYA as a yellow indication that does not imply termination of another phase, driver understanding of the CY indication may be impacted. Additional concern was related to the identification of an effective way to indicate termination of the FYA indication and permissive left-turn phase. Knodler, et al. conducted research to evaluate the impact of the FYA indication on the steady yellow arrow (SYA) indication (Knodler et al ). To do this, a static computer-based study with a total of 212 participants was conducted. To examine the effects of the FYA indication, participants first answered questions regarding their understanding of the SYA indication without receiving any prior information about the FYA indication. Participants were then exposed to the FYA indication and its meaning. Following this study, another study was completed to evaluate driver comprehension of the SYA indication. Researchers concluded that there was not enough evidence to support a claim that the FYA permissive indication may negatively affect drivers understanding of the SYA indication. Study results found that 66% of the participants changed their responses to the SYA indication after being exposed to the FYA indication (Knodler et al ). Despite the large difference in responses, differences were cautious in nature and not indicative of a negative impact on the comprehension of the SYA indication after drivers were exposed to the FYA indication. In research completed by Knodler and Fisher, a study was conducted to establish a baseline understanding of how drivers comprehend the steady CY indication (Knodler and Fisher 2009). The purpose of this study was to develop a foundation of statistics that can be used to analyze future impacts of the FYA indication on driver comprehension of the CY indication. Study results confirmed a number of previously held assumptions. Drivers had a poor understanding of the steady CY indication. Only 80% of participants correctly understood that a red indication succeeded the SYA indication and that the preceding movement ends when the steady CY indication is illuminated. When presented with a SYA indication and a CG indication, only 58% of participants selected that the CG indication would be the next indication illuminated. Also, only about half of the participants correctly identified the MUTCD recommended length of the CY indication interval. These results indicated that many drivers do not understand the meaning of the steady CY indication and do not have a great grasp of how transportation professionals use the five-section cluster signal display to sequence signal indications Pedestrian Safety at Intersections with the Flashing Yellow Arrow Indication Pedestrian phases are commonly provided when the parallel thru traffic has a CG indication. When permissive left-turns are included in the signal phasing, a potential conflict is developed between left-turning vehicles and pedestrians crossing the side street. In these cases, the pedestrian has the right-of-way requiring vehicles to yield to pedestrians in the crosswalk. Several studies have been completed to analyze both pedestrian and driver comprehension of the FYA indication.
30 20 Knodler, et al. researched both pedestrian and driver comprehension of the FYA indication by conducting a driving simulator experiment, an evaluation of driver comprehension, and an evaluation of pedestrian comprehension (Knodler et al ). Figure 7 presents the five permissive left-turn signal display scenarios used in the experiment. Three of the scenarios used a FYA indication and two of the scenarios used a CG indication. A total of 36 drivers completed the simulation, each completing two modules. In the first module, pedestrians were present but never entered the crosswalk. In the second module, pedestrians did enter the crosswalk (Knodler et al ). A total of 139 participants completed the driver comprehension study (Knodler et al ). Each participant completed 25 scenarios, nine of which included permissive left-turn indications. Seven of the scenarios with permissive indications used the FYA indication and two used the CG indication. The pedestrian presence varied between no pedestrian, pedestrian waiting to cross and a visually impaired pedestrian with guide dog waiting to cross. With each scenario, participants were given the following responses to choose from: Figure 7. Permissive scenarios evaluated in the driving simulator (Knodler et al ).
31 Go, you have the right of way; Yield, then go; Stop first, then go; and Stop, wait for signal. 21 If the participant answered yield, then go, they were also asked an additional question about whom they must yield to, with the following available responses (Knodler et al ): Opposing Vehicles; Pedestrians; Cross-Street Vehicles; and None of the Above. For the pedestrian comprehension evaluation, participants were provided with various signal display alternatives (Knodler et al ). One hundred participants completed the study. With each scenario, the participant was asked if they were allowed to enter the crosswalk for the given traffic signal. The available answers were Yes, No, and Not Sure. Overall, the FYA indication performed better than the CG indication and had fewer incorrect go responses (Knodler et al ). Drivers exhibited low comprehension of the requirement to yield to pedestrians legally within the crosswalk. This finding was determined by combining the results of each permissive scenario evaluated by 36 drivers to find that the percentage of yield (correct) responses was lower than the percentage of fail-safe responses. At a T intersection, drivers were statistically more likely to respond correctly to the FYA indication scenario than the CG indication scenario. Drivers observing the FYA indication were statistically more likely to respond with a yield (correct) or stop and wait (fail-safe) response than observed with the standard three-section signal display with a CG indication. The CG indication scenario was statistically more likely to result in a driver response of go (incorrect). Less than half of the participants in the static evaluation of pedestrian comprehension understood correct crossing procedures. When no pedestrian signal heads were available, pedestrians correctly identified crossing opportunities more often when viewing the CG indication signal display scenario than the FYA indication display. Nevertheless, the results of this research study identified unexpected problems with driver s understanding of the appropriate pedestrian indication at pedestrian cross-walks and overall comprehension of pedestrian signal displays Driver s Search for Information Although NCHRP Report 493 concluded that the FYA indication is well comprehended by drivers, knowledge of the sources of information that are most important to permissive leftturning drivers can be used to further improve driver comprehension. Knodler and Noyce researched the eye movements of 11 drivers at six virtual intersections with permissive left-turn phases to identify what driver information is commonly used while executing the maneuver (Knodler and Noyce 2005). The study resulted in 66 evaluations using the full-scale driving simulator at the University of Massachusetts, Amherst. While drivers navigated the virtual roadway environment, an ASL Series 5000 eye tracker with head-mounted optics was used to monitor eye movement. The ASL unit converted the eye position to an external point of gaze by superimposing crosshairs on a projected video screen.
32 22 The experiment evaluated three permissive left-turn signal display and indication combinations installed at six intersections, as shown in Figure 8. Opposing vehicles were present at three of the permissive left-turning intersections, and absent at the remaining three intersections. To provide additional experimental variability, drivers were required to complete movements at eight intersections that did not include permissive left-turns. PPLT Signal Configuration and Permissive Indication G Y Y G Figure 8. Permissive left-turn signal displays evaluated (Knodler and Noyce 2005). Analysis of the experimental intersections included driver response and driver eye movements. In order to evaluate driver eye movements, the visual world was partitioned into multiple areas of interest. Each area of interest coincided with a potential cue that drivers might use to complete the permissive left-turn. Partitions included: the PPLT signal display, the adjacent thru signal display, the cross traffic, opposing vehicles and the location where pedestrians might be in the crosswalk to the left of the driver. Figure 9 shows the partitions used in the evaluation. Several trends were identified through this research and supporting literature (Knodler and Noyce 2005; Mourant and Rockwell 1970; Falkner et al. 2005; Chapman and Underwood 1998; Sadhi et al. 2002; Campbell et al. 2008). Drivers were found to use more sources for information when no opposing vehicles were present. Driver's eye primarily rested on the opposing traffic while peripheral vision monitored lane position, other vehicles and road signs. When glancing away from the eye resting point, drivers most often fixated on other sources of information for less than one second at a time. Novice drivers had longer fixation rates, fixated more on hazardous objects, and spread their fixations less along the horizontal meridian than experienced drivers. The number of scans and fixations decreased (visual tunneling) as drivers performed increasingly demanding cognitive tasks while driving. Scan rates and frequencies were not constant and they increased as the driving environment became more complex and risky. Drivers scanning multiple sources of information tended to scan from the right side of the intersection to the left. A recent study by Marnell used eye tracking equipment and a full-scale driving simulator to evaluate vehicle and pedestrian interactions at intersections (Marnell et al. 2013). The results of the research quantified a troubling behavior regarding the safety of pedestrians at intersections with a FYA indication. Driving subjects that were making a left-turn on a permissive indication paid more visual attention to pedestrians in the conflicting crosswalk when there were four pedestrians crossing compared to when there was one pedestrian crossing. Attention was measured by the average total fixation durations (ATFD). A more interesting statistic from the study revealed that regardless of the pedestrian activity (none, one, or four pedestrians), subjects
33 23 did not fixate on the pedestrian area in the conflicting crosswalk for 4% to 7% of the scenarios. Although the research included a FYA permissive left-turn indication, research results highlighted a broader problem of driver awareness of conflicting pedestrian movements during permissive left-turns, regardless of the type of permissive left-turn indication. Hurwitz and Monsere researched pedestrian safety at intersections with the FYA indication using a driving simulator located at Oregon State University (Hurwitz et al. 2013). The study varied the number of pedestrians, the number of opposing vehicles, and the signal display configuration. Both a three- and four-section vertical signal display configuration were considered. ASL Mobile Eye-XG equipment was used to track where the participants were looking during the study. Each participant was asked to complete a total of six left-turns. Results from this study showed that as pedestrian activity increased, participant drivers began to focus more on the pedestrians (Hurwitz et al. 2013). Drivers also focused more on pedestrians as the number of opposing vehicles increased. Approximately 7% of participants did not focus on pedestrians at all. There were no significant differences in driver behavior and comprehension between the use of three-section and four-section signal display configurations. The study did not compare the CG left-turn indication to a FYA left-turn indication but assumed the FYA leftturn indication was preferred for the PPLT configuration. Figure 9. Partitioned driving simulator visual world (Knodler and Noyce 2005).
.")
34 2.3.6 Comprehension of the Flashing Yellow Arrow Indication after Implementation In research completed by the Missouri Department of Transportation, a study was conducted to analyze how drivers in the Creve Couer, Missouri area comprehended the FYA indication (Henery and Geyer 2008). Each participant was given a series of six questions that featured a mix of scenarios using the FYA and CG left-turn indication: Five-section cluster signal display with CG and GA indication; Four-section vertical signal display with FYA left-turn indication and CR thru indication; Four-section signal display with GA and CR thru indications; Four-section signal display with CR and CG thru indications; Four-section vertical signal display with FYA left-turn indication and CG thru indication; and Five-section cluster signal display with CG indication only. A total of 204 participants completed the study. For each question, the participant could select one of three responses, Go, Yield, or Stop, as shown in Figure Figure 10. Example research scenario and question in Missouri (Henery and Geyer 2008).
35 25 The results showed that the five-section cluster signal display with the CG indication received the most correct responses, as 94% of the participants answered that question correctly (Henery and Geyer 2008). The CG permissive left-turn indication in the five-section cluster signal display was only analyzed with the CG thru indication illuminated simultaneously. In addition, the fivesection cluster display was accompanied with a supplemental sign reading LEFT TURN YIELD ON GREEN [GREEN CIRCLE]. Among all the scenarios with the FYA indication illuminated, participants correctly responded 72% of the time. When the FYA indication was presented with a simultaneous CG thru indication, participants correctly responded 79% of the time. The FYA indications were accompanied with a supplemental sign reading LEFT TURN SIGNAL. Researchers concluded that the most concerning response was how often participants answered go (10%) when the FYA was illuminated, creating potentially fail-critical situations compared to the 11% that chose Stop. Also, participants who had previously observed the FYA indication answered correctly more than those who had not. Researchers recommended that the Missouri DOT conduct a public information campaign to inform the driving public about what to do when they encounter the FYA indication. A critical review of the Missouri DOT study procedure shows that researchers may not have completed an unbiased comparison of the FYA and CG indication scenarios. Background photos were not the same for all scenarios evaluated. Additionally, opposing vehicle position in the background photo and associated thru movement indications varied. Each of these study variables have been shown to impact driver s comprehension of traffic signal indications, and the inherent inconsistency likely influenced the results. It is interesting to note that only 53% of participants had observed a FYA indication prior to completing the study, yet approximately 80% of participants correctly responded to the FYA indication. A significant number of drivers understood the FYA indication correctly without any prior training. Another study of recently implemented FYA indications was conducted in the Peoria, Illinois area. The Illinois Department of Transportation implemented the FYA indication at more than 100 intersections in Schattler evaluated driver comprehension of the FYA indications shortly after the implementation (Schattler et al. 2013). A total of 363 drivers in the Peoria area completed online evaluations, following the research protocol established in NCHRP The first phase of the research was completed five months after implementation of the FYA indications and the second phase was completed 16 months after implementation. The evaluation included driver response to seven left-turn scenarios, shown in Figure 11 (Schattler et al. 2013). For each scenario, drivers were asked if they had seen a similar traffic signal before. Drivers were also presented with three possible responses to answer each scenario: Go You have the right of way; Yield Wait for a gap; and Stop Wait for a signal.
")
36 26 Figure 11. Scenarios evaluated to analyze impacts of FYA implementation (Schattler et al. 2013). The results from the evaluation found that drivers had high comprehension rates for both FYA and CG left-turn indications; however, there were significantly higher incorrect go (fail-critical) responses with the CG indication when compared to the FYA indication scenarios (Schattler et al. 2013). Including supplemental signing that alerted drivers to yield on a FYA indication significantly improved driver comprehension. Not only was driver comprehension improved
37 27 with the supplemental signing, but there were also significantly fewer fail-critical responses. Drivers understood the FYA indication better when the adjacent thru signal indication was CG as compared to CR. Also, 66% of drivers answered that the FYA indication is the best way to indicate that the driver must yield to oncoming traffic before completing the left-turn. Results from the evaluation suggest that the FYA indication improves driver comprehension, and is further enhanced with the use of supplemental signing. It should be noted however that the inclusion of the supplemental signs as presented in the study methodology may have biased the research since the desired response to the signal display included in this static analysis was essentially given by observing the sign. Because of this bias, it cannot be concluded that supplemental signing significantly improved driver comprehension. Previous research found no significant improvement in driver comprehension with supplemental signing (Brehmer, et al 2003). 2.4 Field Studies of Flashing Yellow Arrow After NCHRP Report 493 recommended the use of the FYA indication for PPLT control, numerous transportation agencies began implementing the FYA indication. Noyce, et al. conducted a research study to examine the safety effectiveness of the FYA indication in the field, as part of NCHRP Project 20-7, Task 222 (Noyce et al. 2007). To complete this study, researchers compiled information about all the known FYA indication installations throughout the country and analyzed available crash data at each intersection. Results showed that implementing the FYA indication improved safety at intersections in which the traffic signal control used PPLT phasing before and after implementation. Crash rates did increase at intersections that had been converted from protected-only left-turn phasing to PPLT phasing with the FYA indication. Overall, researchers concluded that implementing the FYA indication improved intersection safety. Safety benefits were also shown to have a positive temporal effect since safety improved as the time between installation of the FYA indication and time of analysis increased. A number of other field studies of FYA indication implementation have been completed by various agencies throughout the country, as described below. Jackson County, Oregon A study was completed in Jackson County, Oregon to evaluate the implementation of the FYA indication (Niemeyer 2005). Several three- and four-section vertical signal displays implementing the FYA indication were installed at intersections throughout the county. Niemeyer completed the study by analyzing crash data, community feedback, and by performing a cost benefit analysis. A total of seven intersections were analyzed (Niemeyer 2005). Six of the intersections were changed from protected-only phasing to PPLT phasing using the FYA indication. At these intersections, a three-section vertical signal display was used instead of a four-section signal display in an effort to reduce the cost of implementing the FYA indication. The FYA indication was combined with the SYA indication in the middle section of the signal display to create a bimodal FYA/SYA indication. One of the intersections was already using PPLT phasing with the
38 28 five-section cluster signal display. This cluster signal display was replaced with a MUTCD recommended four-section vertical signal display. Results from the Jackson County study showed that the FYA indication significantly reduced crashes at the intersection that used PPLT phasing prior to implementing the FYA indication (Niemeyer 2005). The six intersections that were changed from protected-only phasing to PPLT phasing did experience an increased crash rate, as expected. However, these intersections also experienced significant reductions in delay. The benefit-cost ratio of implementing a FYA indication was well above 1.0 for each intersection. This result confirmed the hypothesis that PPLT signal phasing can improve traffic flow while still maintaining safety. The three-section vertical signal display with the bimodal FYA/SYA indication used in Jackson County has been somewhat controversial among transportation professionals (Niemeyer 2005). Combining the FYA with the SYA indication in a bimodal section is believed to have a negative impact on driver comprehension of the yellow change interval, and require drivers to determine when the yellow indication changes from flashing to steady without moving between signal display sections. The results from the Jackson County study showed that no reported crashes were related to the left-turn clearance phase and that there was no negative driver feedback regarding the transition from the FYA indication to the SYA indication. St. Louis, Missouri Lin, et al. conducted a field study to analyze driver reaction to the FYA indication at one approach of an intersection located in St. Louis, Missouri (Lin et al. 2008). Prior to this study, most studies involving driver comprehension of the FYA indication involved asking participants to complete a computer-based evaluation. The idea behind this study was to develop a new method to observe how drivers comprehend the FYA indication. The research was completed by using a video observation method (Lin et al. 2008). To perform this method, researchers categorized driver reactions to the various signal indications used in PPLT phasing. These reactions were then classified as correct, fail-safe, or fail-critical. Researchers also calculated a safe left-turn gap based on speed and distance to analyze whether drivers were entering the intersection with a large enough gap when the FYA indication was illuminated. Results showed that 89.9% of drivers gave a correct response, 5.2% of drivers gave a fail-safe response, and 4.9% of drivers gave a fail-critical response. These results were not compared to any results using the CG indication. Researchers concluded that using the video observation method may be more effective than using computer-based evaluations. Peoria, Illinois The Illinois Department of Transportation implemented the FYA indication at more than 100 intersections in 2010 (Schattler et al. 2013). Schattler conducted an operational and safety evaluation by performing a before and after study of 16 approaches in the Peoria, Illinois area. Signal operations did not change at any of the 16 intersection approaches; therefore, the only change that occurred was that the CG indication was replaced with a FYA indication. A total of 128 hours of data were collected, with 50% of the hours being before and 50% of the hours being after the installation of the FYA indications. The following data were collected for each of the approaches:
39 Size of accepted critical gap for left-turning vehicles; Left-turning vehicles that entered late in the steady CY interval; Left-turning vehicles that entered at the beginning of the CR interval; and Left-turn traffic conflicts. 29 The results from the before-and-after field study showed that there were no significant differences between the accepted critical gaps for the FYA and the CG indications (Schattler et al. 2013). CR and CY indication running also appeared to be minimally affected by conversion to the FYA indication; therefore, researchers concluded that there were no negative impacts on traffic operations when using the FYA indication. Charlotte, North Carolina Pulugurtha, et al. conducted a before and after evaluation of six intersections in Charlotte, North Carolina that were changed from a CG indication to an FYA indication for PPLT phasing (Pulugurtha et al. 2011). The Empirical Bayes (EB) method was used to evaluate the safety impact of the change to a FYA indication. The EB analysis method involves analyzing and comparing the actual number of crashes after the installation of the FYA indication and the predicted number of crashes over the same time period had the FYA indication not been installed. Results from the study showed that the actual number of crashes was lower than the predicted number of crashes at five of the six study intersections (Pulugurtha et al. 2011). Three of the intersections had a crash reduction of almost 50%. Altogether, the FYA indication did improve safety at the majority of the intersections studied, but due to the low sample size, it was not possible to generalize that installing a FYA indication will effectively improve safety at all signalized intersections. Further studies are required to analyze intersection crash characteristics at locations which use the FYA permissive left-turn indication. 2.5 Summary of Literature Review Several studies have analyzed driver behavior and driver comprehension related to the FYA permissive left-turn indication. Important findings cited in these studies are summarized below: Compared to the CG indication, the FYA indication shows a higher level of driver comprehension and lower fail-critical rate. The four-section vertical signal display is the recommended signal arrangement when implementing the FYA indication. Use of the FYA indication in a five-section cluster signal display may be an effective interim retrofit as transportation agencies upgrade to the four-section vertical signal display. However, the required simultaneous illumination of left-turn and thru movement indications can negatively impact driver comprehension. The FYA indication should not be installed at intersections with wide medians until the use of the FYA indication becomes more widespread. The FYA indication does not reduce comprehension of the CG indication. The FYA indication does not reduce comprehension of the SYA indication.
40 30 Pedestrian safety is not impacted by the use of a FYA indication. The Jackson County three-section vertical signal display with a bimodal FYA/SYA indication has not resulted in any known driver comprehension or safety problems. Studies found that many drivers do not understand the meaning of the steady CY indication. Field studies show that the implementation of the FYA indication can result in lower crash rates and improved traffic flow. Overall, the FYA indication has proven to be a significant improvement by increasing driver comprehension of permissive left-turn operations and consequently improving safety.
41 CHAPTER 3 31 Research Approach This research used a combination of static and dynamic studies to explore driver behavior and driver comprehension related to the FYA and yellow change interval indications selected for study. In others words, the experiments explored the significance of changes in mode (flashing to steady), shape (arrow to circular), location (signal section), and signal display arrangement (three-, four- and five-section; horizontal, vertical, cluster). To the extent possible, issues pertaining to separate versus shared left-turn signal displays and tightly spaced (less than 8 feet) signal displays were considered. Measures of effectiveness used in the experiments included driver behavior, driver comprehension and driver perception/reaction time. Vehicle trajectories on the approach to intersections and driver s visual search patterns were also considered. 3.1 Static Study Development Data for this research was collected by conducting a computer-based static study. The computerbased tool was developed using a Java Script that taps into HTML 5 application programming interface (API) of a Google Chrome browser. This design facilitated a robust deployment by not requiring Wi-Fi access since the data collection computer was running a local web server. Using Java Script, a time stamp of each event of user responses were continuously stored locally on the computer and could be retrieved later for analysis. Six different signal display arrangements were evaluated, as shown in Figure 12. All of these configurations featured different traffic signal arrangements using the FYA indication. In the three-section signal display, the FYA indication was located as a bimodal indication in the bottom section or middle section of the signal display, and combined with the GA or YA indication, respectively. The current MUTCD standard four-section all arrow vertical signal display was included as the baseline arrangement for the study. Additionally, a four-section horizontal signal display was evaluated. In the five-section cluster signal display, the FYA indication was included as a bimodal indication and was included in either the bottom left (bimodal with GA indication) or middle left (bimodal with YA indication) section. Additionally, the five-section cluster signal display involved scenarios that illuminated a FYA indication with a simultaneous thru movement indication and scenarios that illuminated a FYA indication without a simultaneous thru movement indication. Although it was understood that a permissive left-turn indication would not be presented in a five-section cluster signal display without the simultaneous and corresponding thru movement indication (per MUTCD), scenarios did include the five-section cluster signal display with and without simultaneous thru movement indications to further explore driver s comprehension of signal display arrangement and indication location. In addition to the scenarios presented in Figure 12, other signal displays that illuminated a RA, YA, or GA indication were included in the study to ensure variability in the study and provide control scenarios. Also, the presence of opposing traffic was varied with each signal display mentioned, with one scenario including opposing traffic and then the same scenario without. A complete list of scenarios, with figures, can be seen in Appendix A.


42 32 Figure 12. FYA signal displays evaluated. Scenarios were divided into three categories: Experimental, Baseline, and Control. The experimental and baseline scenarios included all the configurations shown in Figure 12. Experimental scenarios featured a bimodal FYA indication, while baseline scenarios feature a four-section signal display with a separate section for the FYA indication. The Control scenarios consisted of signals featuring an RA, YA, or GA indication. As mentioned, these scenarios were added to create variability in the study. They also provided a measure of data quality assurance, as these scenarios should feature a high rate of correct responses. Researchers completed the data collection effort by setting up tables and laptop computers at various locations and asked people passing by to complete the study. In Madison, studies were completed at the University of Wisconsin-Madison Union South building and the Wisconsin Department of Transportation Division of Motor Vehicles (DMV) east and west drivers license facilities. The Union South building was selected as a location because of its high student population, and the fact that a random set of students, staff, and visitors of all ages pass through the building each day. The DMV was selected because of its diverse population and the fact that
43 33 people tend to have available time while waiting for service. The study was also conducted in a similar manner by researchers on the campus of the University of Massachusetts, Amherst. Prior to beginning the study, participants were asked to read a disclaimer and agree to complete the study. Upon agreeing to complete the study, participants were asked to answer demographic questions regarding their gender, age, and driving experience. The available responses for age and driving experience were grouped into ranges, as shown in Table 1. The purpose of asking these demographic questions was to provide the opportunity to analyze those variables with respect to driver comprehension. Table 1. Available responses for demographic questions. Gender Age Driving Experience Male < 5 years to 9 years Female > 10 years Each participant was presented with 15 scenarios. Scenarios were programmed to be randomly selected; therefore, each subject observed a different set and different order of scenarios. The only caveat to that was if one of the scenarios that involved a signal display with the FYA indication as part of a bimodal indication was presented to a participant, the same signal display with the FYA indication in another bimodal section was also presented to assure the participant saw the FYA indication in both the middle and bottom sections of the signal display. For example, if a three-section vertical signal display with the FYA indication bimodal with the GA in the bottom section was shown, another scenario would present a three-section vertical signal display with the FYA indication bimodal with the YA in the middle section. This can be seen in greater detail in Appendix A, as scenarios with bimodal arrangements are labeled with an additional a and b designation. With every scenario presented, the participant was asked If you want to turn left and see the signal indications shown below, you are... with the following responses to choose from: Not allowed to turn left, stop; Allowed to turn left; however, you must wait for a large enough opening in the oncoming traffic before doing so, yield; Allowed to turn left since the oncoming traffic must stop, go; and Not sure whether or not a left-turn is allowed. Upon beginning the study, the participant first encountered a practice scenario, shown in Figure 13. The purpose of the practice scenario was to give the participant a chance to become familiar with the type of question being asked. Note that the practice scenario depicted in Figure 13 is shown with opposing traffic present.

44 34 Figure 13. Practice scenario used in study. An example of an actual study scenario featuring the FYA indication in a five-section cluster signal display is shown in Figure 14. The YA indication shown in Figure 14 was dynamically flashing when shown on the computer. This scenario in Figure 14 is shown without opposing traffic. Background images that accompanied the traffic signal included an actual intersection that provided the participant with the perspective that they were located in a separate left-turn bay of the intersection. Screenshots of the instructional and demographic pages, along with example scenarios with and without opposing traffic can be seen in Appendix B Study Response Data Analysis The study was completed on laptop computers, so the responses were recorded directly onto the computer as a.csv file. Table 2 shows an example of the unedited data output. Data were compiled into a single Microsoft Excel workbook for analysis. Microsoft Excel and statistical analysis package R were both used to complete the statistical analysis. The following items were included in the raw data and analyzed: Gender of Participant; Age of Participant; Driving Experience of Participant; Scenario Number; Question Response Time; and Selected Answer.
45 35 Figure 14. Example FYA indication and signal display scenario used in study. Table 2. Example of raw static study data. Time Stamp Age Group Gender Driving Experience Time To Complete Attempts Question Position Question Name 5 F b 5 F F b 5 F b 5 F b Image Name /g_exp/ 9b.gif /g_l/29. gif /g_exp/ 43b.gif /g_exp/ 60b.gif /g_exp/ 57b.gif Answer Results of the analysis were compared across each of the signal display arrangement and indication combinations evaluated. Note that the time from the initial presentation of the scenario until the time the participant responded was quantified in seconds as response time. Response time was hypothesized to be a surrogate measure of participant (driver) comprehension, under the theory that scenarios not well understood will take a longer time to process and respond.
46 Dynamic Study A second study was completed to explore driver s response to different combinations of signal display arrangements and FYA indications. Data collection was completed through the use of a full-scale driving simulator. The primary objective in using the driving simulator was to explore the key findings of the computer-based static study in a dynamic environment. In this way, driving behavior, workloads, information processing and conflicting visual cues were added to the study. Furthermore, a large number of traffic signal display indications, placements, and arrangements could be explored. Fixed-base fully interactive dynamic driving simulators at the University of Wisconsin-Madison and University of Massachusetts, Amherst were used to complete the study of driver comprehension and behavior associated with the FYA indications. Photos of the experimental driving simulators are shown in the Figures 15 through 18. The vehicle cab of the University of Wisconsin driving simulator is a full-sized Ford Fusion, which the driver operates just as he or she would on the road. One rear-facing and five forwardfacing projectors display the visual world on a 24-foot screen wrapped 240 degrees around the vehicle and on an additional screen spanning the rear of the vehicle. LCD screens installed in each of the side-view mirrors bring the total number of projectors contributing to the simulation environment to eight. As the driver turns the wheel, brakes, or accelerates, the roadway that is visible to the driver changes appropriately. A network of eight advanced RTI servers update the images 60 times per second. High-end multimedia video allows the servers to process the images at the same resolution as the human eye. Image resolution on each screen can be as high as 1080p. Logitech Dolby 2.1 Surround Sound speakers with subwoofer comprise the simulator s sound system. Realistic road, vehicle, and wind noise, along with appropriate direction, intensity and Doppler shift effects, enhance the virtual environment experience. Computer screens replacing the interior vehicle dashboard and center console allow testing of vehicle enhancements currently under development. Other capabilities include a dynamic messaging system, as well as haptic feedback for applications such as rumble strip evaluation. Finally, the vehicle is positioned in a front-to-back motion base capable of one degree of motion for movement tracking. The vehicle cab in the HPL Advanced Driving Simulator at the University of Massachusetts, Amherst is a full sized Saturn sedan. A driver operates the controls of the Saturn just as he or she would on the road. The visual world is presented on three screens, one in front of the car and two on each side. Each screen subtends 60 degrees in the horizontal direction and 30 degrees in the vertical direction. As the driver turns the wheel, brakes or accelerates, the roadway that is visible to the driver changes appropriately. The images themselves are updated 60 times a second using a network of four advanced RTI simulator servers which parallel process the images projected to each of the three screens using high end multimedia video processors. The image resolution on each screen can be as high as The sound system for the simulator consists of three Logitech Dolby 2.1 Surround Sound speakers, two located on the left and right sides of the car and one, a sub-woofer, located in front of the car. The system provides road, vehicle, wind and other noises with appropriate direction, intensity and Doppler shift.


47 37 Figure 15. University of Wisconsin-Madison driving simulator. Figure 16. University of Wisconsin-Madison driving simulator.


48 38 Figure 17. University of Massachusetts driving simulator. Figure 18. Wisconsin driving simulator data collection.
49 39 Data obtained from the driving simulator came in several forms. Computers models tracked X, Y, and Z plane coordinates throughout each simulator experiment. Velocity and acceleration data were captured, along with corresponding data from the vehicle components (brakes, steering, etc.). Video cameras were used to capture physical driver maneuvers within the experiment and associated vehicle position and driver behavior data. As depicted in Figure 18, researchers collect and analyze these data in real time. A state-of-the-art eye tracker, ASL Mobile Eye-XG, which is capable of sampling the position of the eye at 30 Hz, was used with selected driving simulator participants at the University of Wisconsin study site. The eye tracker device is capable of recording the visual scan pattern and eye movement of drivers under all driving conditions, along with the number of glances and the durations of fixations. All of these recordings were gathered in this study and this data will be used to determine the amount of time subjects spent looking at a particular area of the scenario Methodology Results of the static study were used to identify 12 signal display and indication combinations evaluated in the driving simulator study. Figure 19 presents the nine experimental signal displays and indications evaluated along with the three baseline signal display scenarios. Baseline or control signal display was the four-section all arrow vertical signal display as described in the MUTCD. Thru movement indications varied between CG and CR. The sequence of indications presented, random number generated to randomize the sequence of signal displays presented, and the module number in which the signal display was included is also presented in Figure 19. One intersection approach was created for each of the 12 PPLT signal display/indication combinations selected for evaluations. As with the static study, variables evaluated included changes from the permissive left-turn to change interval indications: Mode o Steady to steady; and o Flash to steady. Location o Bimodal; and o Section change. Signal Display Configuration o Three-section vertical bottom section GA/FYA bimodal; o Three-section vertical middle section SYA/FYA bimodal; o Four-section vertical All arrow; o Four-section horizontal All arrow; o Five-section doghouse bottom left section GA/FYA bimodal; and o Five-section doghouse middle left section SYA/FYA bimodal. Shape o Arrow to circular.


50 Figure 19. Driver simulator study experimental and baseline signal displays. 40


51 Figure 19 (con t). Driver simulator study experimental and baseline signal displays. 41
52 42 Figure 20 depicts a visual sample of a signalized intersection with PPLT signal phasing and FYA indication used in the driving simulator study. Screen captures of all 12 intersections are depicted in Appendix C. Additionally, several intersections that require the driver to evaluate different information and/or turn right, proceed straight, or turn left on a protected green arrow were included as part of the visual world. The additional movements were included to provide experimental variability and reduce the probability of the driver keying into the nature of the study. Variability in intersections also reduced the learning curve effects. Figure 20. Screen capture of typical simulated intersection. Additional variability was provided through the creation of multiple experimental modules, driving routes and starting positions. Three modules were developed by random number generation (Figure 19), each presenting experimental signal display/indications in a different order. Further, the order in which the modules were driven was varied to provide counterbalancing. Drivers observed each of the experimental signal displays only once by traversing the route in each module. Finally, the three routes were presented in various orders, which created numerous unique orders and starting point combinations. The three modules and associated routes are shown in Figure 21 through Figure 23. Note the signal display scenario at each intersection as presented in Figure 19.

53 43 Figure 21. Route with module 1. Figure 22. Route with module 2.

54 44 Figure 23. Route with module 3. Also note the last scenario in Figure 23 is labeled 9aH, which included signal display scenario 9b with different vehicle and traffic signal operations. In this scenario, when drivers approached the intersection, a FYA was shown instead of a steady GA. Thru movement had a CG indication. As the driver entered the left-turn bay of the intersection, the signal changed to a steady YA in the normal middle position. Scenario 9aH also had a same direction vehicle waiting to turn left in front of the driver. When the driver entered the left-turn bay the vehicle started to turn. The objective was to see if participating drivers made their turn decision by following the lead vehicle rather than solely on the traffic signal indications. Additionally, the objective was to see if drivers observed the FYA indication change to steady YA. Once the driver crossed the stop bar, the left-turn indication turned red. Only drivers at UW-Madison were exposed to scenario 9aH. All but scenario 9aH rested in green (GA indication for the left lane and CG indication for the thru lanes). Signal displays were changed to the test indications as the driver approached the intersection. Specifically, between 30 and 120 meters prior to the intersection stop bar, the PPLT signal display was triggered, changing from a GA indication to the selected permissive leftturn (or protected) indication.
55 45 A second trigger was placed at selected intersections to release queued opposing traffic and/or to change the signal indication from the FYA indication or other protected or permissive left-turn indication to a steady YA change interval indication. The locations of these trigger points varied by intersection scenario. Each of the PPLT signal displays were evaluated with opposing traffic at the intersection. The introduction of opposing traffic required drivers to simultaneously evaluate the PPLT signal display and indication, traffic movement, and opposing gaps before completing the permissive left-turn maneuver. This methodology was used to replicate the decision process required during actual operation of a motorized vehicle within the roadway system. At experimental intersections in which comprehension of the permissive left-turn indication was evaluated, all gaps in the opposing traffic were consistently applied. At least two vehicles were always positioned at the stop bar in the two thru lanes opposing the left-turn driver. The remaining opposing vehicles were positioned further upstream in a specified gap sequence. Past research has used gap sequences of three and seven seconds (Brehmer et al. 2003). To assure that gap selection was not a controlling variable in drivers decision to make a permissive leftturn, drivers were presented with opposing vehicle gaps of 8 to 10 seconds and 0 to 1 seconds. The aforementioned assumption is based on the critical gap value of 4.1 seconds found in the 2010 Highway Capacity Manual (HCM) for permitted left-turn maneuvers from the major road in the design of a four-lane roadway (HCM 2010). After creating the driving simulator scenarios, but prior to conducting the study, several drivers were recruited to beta test each module. The purpose of the beta test was to identify necessary modifications that can only become apparent after administering the experiment. In order to make sure the same procedure was followed between locations and with all drivers, the following procedure was established: Before driver arrives: Start simulator & projectors; Perform steering wheel calibration to industry standards; and Load scenarios and make sure everything is working properly. When driver arrives: Introduce yourself; Set driver up in the lobby, explain the three documents for them to fill out; o Research Participant Information and Informed Consent Form (per University policy); o Driver Behavior Questionnaire; and o Demographic Questionnaire. Ask about motion sickness and explain that some people do get motion sickness, at any point in time the driver can stop the experiment. Explain that the car is set to industry standards but, just like driving a rental car, each car does feel differently. To start the driver experiment:
56 46 After the paperwork has been filled out and collected, drivers are asked to fasten their seatbelt, adjust mirrors, and adjust the radio as they would in their own vehicle; Get driver set up with eye tracker equipment; Explain that there will be a camera to record the scenario and ask them to talk out loud in the vehicle about their experience; Explain speed limit - 35 mph; and Start scenario, observer stays back and record notes about the drive. When driver finishes: After driver finishes, make sure they are feeling OK and ask follow-up questions; o Are you feeling OK? Did you have problems with the simulation? Was there anything confusing? o Were the colors on the simulation real-enough for you? Is there anything that can be improved? o Think about the signals: did you notice there were different signal configurations? o Think about the location of the flashing yellow on the signal itself: do you have a preference for the location? Why one over the other? o How did you made the decision to go/stop when approaching the intersection? Were you relying on traffic or were you looking at the signals? Ask if they have anything to add about the experiment; Thank them for their contribution; Copy PLT file with driver number; Save Eye Tracking data; and Get the set up ready for the next participant. Participating drivers were asked to drive the simulator vehicle as they would drive their own vehicle. Specifically, do not drive overly conservative nor drive extremely aggressive. To avoid the need for verbal communication during the study, drivers were navigated through the modules by guide signs that were provided at each intersection approach. In addition, drivers were asked to observe speed limit signs (35 mph), providing a higher level of realism and speed control in the virtual network. The driving portion of the experiment required an average of 20 to 30 minutes. Driver responses to each PPLT signal display scenario were manually and electronically recorded. Correct responses were recorded accordingly and incorrect responses were categorized by the nature of the failure. A video record was completed with each experiment such that the video could be reviewed to confirm driver responses. Additionally, the driving simulator computer system recorded operational data and was used to determine vehicle speeds and path. Throughout the experiment, subject drivers were asked to think out loud and verbally express their thoughts about anything they observed. Research team members were present to record the results of the simulation, including the responses at each intersection and other driving related factors such as indecision, unnecessary braking, or any pertinent verbal comments made. Eye tracker data recorded driver eye fixation and dwell time for selected participants. Figure 24 shows a driver outfitted with the ASL Mobil Eye-XG head-mounted eye tracking equipment. A typical eye tracking analysis seeks to gain an insight into the attentive behavior of the user

57 47 (Duchowski, 2007). Therefore, heat maps were generated, as shown in Figure 25, to understand the intensity of fixations by area on the screen. A red area represents the highest number of fixations while a green one represents an area with the lowest number of fixations. Consistent with recently published literature (Marnell et. al., 2013), fixations, i.e., points on which the driver focused, were deemed as such if the fixation lasted more than 100 milliseconds. Heat maps along with box-and-whisker statistical plots were used to present the eye tracking data. After completing the driving simulator study, drivers were asked to complete some remaining paperwork. Finally, drivers were asked to complete a Payment Voucher for nominal compensation ($10-$15) that was provided for participating in this experiment. A total of 56 drivers completed the driving simulator experiment. Of the 56 drivers, 31 completed the study in Massachusetts while 25 completed the study in Wisconsin. The same age demographics as the static study were employed. Recruiting drivers to participate in the study was done through a variety of local mediums, including local advertisement on campus, through campus and community organizations, and using databases of past drivers. Again, drivers were screened for a valid driver s license, in addition to age/gender group categorization. Figure 24. Eye Tracker on a driver.

58 48 Figure 25. Depiction of a heat map of driver fixations. 3.3 Experimental Results and Data Analysis Once the data collection process was complete, the results of each experimental task were compiled and analyzed. Analysis focused on a distribution of qualitative and quantitative responses to the array of indications presented correlated to signal display type and position. Each study was statistically analyzed using commonly applied procedures. The distribution of responses was applied to an analysis of variance (ANOVA) procedure to determine the differences between the signal displays and indications evaluated. For each analysis, the appropriate 95% confidence interval was calculated based on a binomial proportion as follows: pq p n 95% C.I. = (1) Where: p = sample proportion; 1.96 = value associated with 95% confidence level; q = 1 p; and n = number of trials. Similarly, demographic data were analyzed simultaneously with the independent variables of both experiments to determine what, if any, interaction occurs between the parameters and their impact on the independent variables. A comparison of the results obtained using each experimental methodology was completed to determine the consistency of driver responses. Additionally, the randomization techniques applied (route, route order, and response order) were analyzed to determine the potential effect each variable may have had on the outcome variables.
59 CHAPTER 4 49 Findings and Applications 4.1 Demographics for Computer-Based Static Study Three hundred thirty-six participants completed the study in Wisconsin and 168 participants completed the study in Massachusetts resulting in a combined total of 447 participants. A total of 8,948 scenario evaluations were received with a bimodal FYA indication featured in 5,723 of the scenarios evaluated. Three demographic questions were asked in the study. Specifically, participants were asked to provide information regarding their gender, age, and driving experience. A summary of the demographics for the study is shown in Table 3. The proportion of respondents was weighted towards younger age groups due to data collection on college campuses. Table 3. Summary of demographic information. Wisconsin Massachusetts Category Level Total Percent Total Percent Gender Male Female Age Driving Experience Summary of Results for Computer-Based Static Study Summary of Results from Control Scenarios Overall, the control scenarios featured a high rate of correct responses. Previous literature has identified a correct response rate greater than 85% to represent high levels of driver comprehension (Brehmer et al. 2003). Scenarios that featured a GA in both Wisconsin and Massachusetts for the left-turn indication experienced a correct (go) response rate of 88.4%.
60 50 Almost all of the incorrect responses for scenarios that featured a GA indication were yield responses. The yield response could be considered a correct response, since the GA indication does require drivers to yield to other road users lawfully in the intersection (FHWA 2009). If yield responses are considered correct, the correct response rate for these scenarios is over 99%. Scenarios that featured a red arrow (RA) for the left-turn indication experienced a correct (Stop) response rate of 95.6%. Scenarios that featured a YA for the left-turn indication experienced a wide variety of responses. Response rates were 46.6% Yield, 31.6% Stop, 16.4% Go, and 5.3% I don t know (IDK). One potential reason as to why these scenarios featured such a wide variety of responses is that driver response to a YA indication varied largely based on the location of the vehicle when the indication changed to yellow. Also, drivers are familiar with observing the YA indication in a transition from green to red. Since the experiment involved a static signal display, this could also be a potential cause of confusion. Additionally, the steady YA has historically been a traffic signal indication in which the actual meaning is unclear. Altogether, the high levels of correct responses for the scenarios featuring a GA or RA indication indicate that participants correctly understood the questions being asked in the study. This finding is important as the computer-based study initially validates that the experimental scenarios can be used to conduct an analysis of this type. A comprehensive table of results associated with each scenario can be found in Appendix A Summary of Results from Baseline and Experimental Scenarios The baseline and experimental scenarios experienced an overall correct response rate of 74.6%. Table 4 displays percentages of correct responses seperated by signal display and the location of the FYA indication. The results show that scenarios featuring the FYA indication in the bottom section had a slightly higher rate of correct responses than scenarios featuring the FYA indication in the middle section. As described in Chapter 3, results in Table 4 also show the impact of simultaneous indications in a five-section cluster signal display by evaluting the FYA indication in a five-section cluster signal display with and without a simultaneous thru movement indication, knowing that presenting the FYA indication without a simultaneous thru movement indication is not an approved MUTCD signal display. Results of the statistical analysis are presented in Section Due to the large number of scenarios evaluated, detailed responses for every scenario are presented in Appendix A Statistical Analysis A chi-squared test was completed to compare the proportion of correct responses from the Wisconsin data to the proportion of correct responses from the Massachusetts data. The results from this analysis showed that the two datasets are significantly different, as Wisconsin participants had a significantly higher rate of correct responses. As a result, these datasets were kept separate for the statistical analysis.
61 Table 4. Summary of results based on signal display and FYA section. 51 Wisconsin Massachusetts Section for FYA Fail- Fail- Signal display Indication Correct Critical Correct Critical Four-Section Vertical Separate 76.9% 7.5% 73.2% 12.1% Four-Section Horizontal Separate 79.2% 5.6% 69.5% 11.4% Three-Section Vertical Five-Section Cluster without Simultaneous Thru Indication Five-Section Cluster with Simultaneous Thru Indication Middle 77.1% 6.5% 68.0% 8.8% Bottom 80.5% 6.7% 70.4% 9.9% Middle 79.1% 7.3% 73.9% 12.0% Bottom 78.5% 6.8% 76.2% 8.5% Middle 76.0% 5.4% 62.0% 12.7% Bottom 75.4% 6.3% 63.3% 11.4% A series of Pearson s chi-squared analyses were completed to identify statistically significant responses based on various variables. This analysis was completed by comparing the differences in correct response rates for various sets of scenarios and using a right-tailed p-value of less than a 5% (0.05) level of significance to indicate differences as significant. A p-value of less than 0.05 has been the statistical standard used in previous driver comprehension studies related to PPLT signal displays. The Pearson s chi-squared test was used in this analysis since two variables are tested to determine whether they are independent of each other. Throughout the statistical analysis, p-values are presented with a format and cell shading shown in Table 5 to help distinguish significance. Table 5. Formatting associated with p values. Significance P Value Format Highly Significant < Significant < Not Significant Figures displaying the 95% confidence intervals were also created. These confidence intervals were calculated using the Wilson score interval (Wallis 2013). In addition to completing several chi-squared analyses and creating plots with confidence intervals, the average response times for each analysis are also presented. The purpose of studying response time is that lower response times indicate a more confident response and could potentially correlate to higher driver comprehension.
62 4.2.3 Flashing Yellow Arrow Indication Location Comparisons This analysis compared all scenarios featuring the FYA indication in the middle section to all scenarios featuring the FYA indication in the bottom section, regardless of all other variables. Two chi-squared analyses were completed for each state. The first one examined differences between the percentage of correct responses, while the second examined differences between the percentage of fail-critical responses. In Wisconsin, scenarios involving an FYA indication in the middle section had a correct response rate of 77.4%, while scenarios involving an FYA indication in the bottom section had a correct response rate of 78.1%. In Massachusetts, the correct response rates were 68.1% and 70.0%, respectively. The chi-squared analyses showed that neither of these differences were statisitcally significant. There were also no differences in the percentage of fail-critical responses. The results from this analysis are shown in Table Table 6. Chi-Squared analysis for FYA indication location comparisons. FYA Section Wisconsin Massachusetts (%)* P Value (%)* P Value Middle Bottom *Percentage of Correct (Yield) responses FYA Section Wisconsin Massachusetts (%)** P Value (%)** P Value Middle Bottom **Percentage of fail-critical (Go) responses An analysis was also completed to determine the average response times based on the location of the FYA indication. In both states, the average response time was lower for the scenarios with the FYA indication in the middle section of the signal display. Additionally, maximum values observed and statistical standard deviations were also lower in the middle section of the signal display. Results are shown in Table 7. Table 7. Average response time (seconds) based on FYA indication location. Location of FYA Indicatio n Middle Section Wisconsin Averag e Max Min Massachusetts Std Dev. Average Max Min Std Dev Bottom
63 Section Signal Display Comparisons The main objective of this analysis was to identify if the signal display arrangement impacted driver comprehension for the experimental and baseline scenarios. Chi-squared analyses were completed to identify differences in the percentage of correct responses based on the signal display. The results are shown in Table 8. Note that Five-Section Clustered signal displays in Table 8 are those that did not include a simultaneous thru movement indication. Table 8. Chi-Squared analysis for signal display comparisons. Wisconsin Massachusetts Display Type 1 Display Type 2 1 (%)** 2 (%)** P Value 1 (%)** 2 (%)** P Value Three-Section Vertical Four-Section Vertical Three-Section Vertical Five-Section Cluster* Three-Section Vertical Five Section Cluster with Simultaneous Thru Indication Five-Section Cluster* Four-Section Vertical Five-Section Cluster* Five Section Cluster with Simultaneous Thru Indication Five Section Cluster with Simultaneous Thru Indication Four-Section Vertical *Without simultaneous thru movement indication **Percentage of Correct (Yield) responses for the corresponding Display Type In Wisconsin, the three-section vertical signal display had the highest correct response rate at 78.6% and the five-section cluster signal display with simultaneous indications had the lowest correct response rate at 75.8%. The five-section cluster signal display with simultaneous indications had a lower correct response rate than both the three-section vertical and five-section cluster signal display, but the differences were not significant. There were no significant differences between the other signal displays, essentially meaning that there is no obvious difference in comprehension between any of the signal displays. In Massachusetts, the five-section cluster signal display is the most common PPLT signal display used. The five-section cluster signal display had the highest correct response rate at 74.9% and the five-section cluster signal display with simultaneous indications had the lowest correct response rate at 62.6%. Note that the five-section cluster signal display with simultaneous indications had a significantly lower correct response rate than all other signal displays. The fivesection cluster signal display without simultaneous indications had a significantly higher correct response rate than the three-section vertical signal display. These results are consistent with previous findings that clearly show simultaneous indications reduce driver comprehension.
64 54 For the experimental signal displays in both states, the average response time was lowest for the three-section vertical signal display and highest for the five-section cluster signal display with simultaneous indications (Table 9). The fact that the average response time is highest for the five-section cluster signal display with simultaneous indications aligns with the hypothesis that scenarios with the lowest level of driver comprehension result in more time for drivers to process the information presented. Consistently, the five-section cluster signal display with simultaneous indications resulted in a significantly lower percentage of correct responses when compared to other signal displays. Table 9. Average response times based on signal display. Signal Display Type Wisconsin Average Max Min Massachusetts Std Dev. Average Max Min Std Dev. Four-Section Vertical Three-Section Vertical Five Section Cluster without Simultaneous Indication Five Section Cluster with Simultaneous Indication Another objective of this section was to identify if the location of the FYA indication was comprehended differently for each of the experimental signal displays. Chi-squared analyses were completed to examine differences between the FYA indication in the middle section and the FYA indication in the bottom section. The results are shown in Table 10. Table 10. Chi-Squared analysis for FYA indication location based on signal display. Signal display Type Three-Section Vertical Five-Section Cluster without Simultaneous Indication Five-Section Cluster with Simultaneous Indication FYA Wisconsin Massachusetts Location (%)* P Value (%)* P Value Middle Bottom Middle Bottom Middle Bottom * Percentage of Correct (Yield) responses There were no significant differences found in the chi-squared analyses. As a result, regardless of the signal display type shown, there was not a significant difference in driver comprehension when the the FYA indication is located in the middle section compared to the bottom section.


65 55 Additionally, Figures 26 and 27 depict the percentage of correct and fail-critical responses, respectively. Figure 26 Percentage of correct responses for FYA indication location based on signal display. Figure 27. Percentage of Fail-critical responses for FYA indication location based on signal display.
66 56
67 57 Note that Five-Section Cluster in Figures 26 and 27 are cluster signal display scenarios without the simultaneous thru movement indication, and Five-Section Simultaneous are cluster signal displays with simultaneous thru indications. Confidence intervals on the figures overlap, a commonly used identifier confirming that there were no significant differences. Figure 26 presents the results show in Table Thru Indication Comparisons The main objective of this analysis was to identify if the thru indication impacted driver comprehension for the experimental scenarios. Chi-squared analyses were completed to identify differences in the percentage of correct responses based on the thru indication at the time of the FYA indication. The results are shown in Table 11. In Wisconsin, the thru indication had significant impacts on driver comprehension of the FYA indication. The CG indication was associated with the highest correct response rate at 89.7%, the CY indication had a correct response rate of 74.6%, and the CR indication had the lowest correct response rate at 66.9%. All of these differences were highly significant (p<0.01). In Massachusetts, the thru indication also had significant impacts on driver comprehension of the FYA indication. The CG indication was associated with the highest correct response rate at 79.1%, the CY indication had a correct response rate of 66.9%, and the CR indication had the lowest correct response rate at 60.8%. All of these differences were significant (p<0.05). Table 11. Chi-squared analysis for thru indication comparisons. Thru Indication Thru Wisconsin Massachusetts 1 Indication 2 1 (%)* 2 (%)* P Value 1 (%)* 2 (%)* P Value Circular Green Circular Yellow Circular Circular Green Red Circular Circular Yellow Red * Percentage of correct (Yield) responses for the corresponding thru indication The average response times were similar for all scenarios in Wisconsin. Scenarios featuring a CG thru indication did have the lowest average response time, but were only 0.2 seconds lower than the average response times for scenarios featuring a CY or CR indication. In Massachusetts, the average response time showed a little more variation. Average response time was lowest for scenarios featuring a CG indication, while scenarios featuring a CR indication had the highest average response time. Average response times are shown in Table 12.
68 Table 12. Average response times based on thru movement indication. Thru Indicatio n Circular Green Circular Yellow Circular Red Wisconsin Average Max Min Std Dev. Averag e 58 Massachusetts Max Min Std Dev Another objective was to identify if the location of the FYA indication was comprehended differently for each of the thru indications. Chi-squared analyses were completed to examine for differences between the FYA indication in the middle section and the FYA indication in the bottom section. The results are shown in Table 13. Additionally, Figures 28 and 29 show the percentage of correct and fail-critical responses, respectively. Results find no significant differences in correct or fail-critical responses, in Wisconsin or Massachusetts, based on the location of the FYA indication given a specific thru movement indication. Confidence intervals in both Figure 28 and Figure 29 further show no significant differences. However, significantly higher correct response rates were observed with the CG thru movement indication when compared to the CY and CR thru movement indication, regardless of the placement location of the FYA indication. Although no differences were seen in fail-critical rates, results again show the impact of the thru movement indications on driver comprehension of the FYA permissive left-turn indication. Table 13. Chi-Squared analysis FYA indication location based on thru indication. FYA Wisconsin Massachusetts Through Indication Location (%)* P Value (%)* P Value Circular Green Middle Bottom Circular Yellow Middle Bottom Circular Red Middle Bottom *Percentage of correct (Yield) responses


69 59 Figure 28. Percentage of correct responses for FYA indication location based on thru indication. Figure 29. Percentage of fail-critical responses for FYA indication location based on thru indication.
70 4.2.6 Signal Display and Thru Indication Comparisons Since the thru movement indication appears to significantly impact driver comprehension, another analysis was completed to examine the impacts when both the signal display and thru indication are considered. The main objective of this analysis was to identify if the location of the FYA indication was comprehended differently for each combination of signal display and thru indication. Due to the limited sample size in Massachusetts, only the Wisconsin data were used for this analysis. Figure 30 presents the results. Note again that Five-Section Cluster are cluster signal display scenarios without the simultaneous thru movement indication, and Five- Section Simultaneous are cluster signal displays with simultaneous thru indications. The results show that the CG thru movement indication has an extremely high correct response rate for all of the experimental signal displays. By examining the confidence intervals, there is no significant difference in driver comprehension when the FYA indication is in the middle section compared to the bottom section of the signal display. When the thru indication was CY, the correct response rate was significantly lower than when the thru indication was CG. However, there is no significant difference in driver comprehension when the FYA indication is in the middle section compared to the bottom section. The CR thru indication also had a significantly lower correct response rate than the CG thru indication, but was not significantly different than the CY indication. There was a little more variation based on the location of the FYA indication in the scenarios involving a CR indication, again highlighting the problem with simultaneous indications, but there was no significant difference in driver comprehension when the FYA indication was in the middle section compared to the bottom section Opposing Traffic Comparisons The objective of this analysis was to identify if the presence of opposing traffic impacted driver comprehension for the experimental scenarios. Chi-squared analyses were completed to identify differences in the percentage of correct responses based on the presence of opposing traffic. The results are shown in Table 14. There were no significant differences found in the chi-squared analysis. This result essentially means that the presence of opposing traffic had no impact on driver comprehension. In a static environment, with a consistent visual background, driver response is focused on the comprehension of traffic signal indications with little influence of the other scene variables. Table 14. Chi-Squared analysis for opposing traffic comparisons. Opposing Wisconsin Massachusetts Traffic (%)* P Value (%)* P Value Yes No * Percent of correct (Yield) responses

71 Figure 30. Percentage of correct responses in Wisconsin for FYA indication location based on signal display and thru indication. 61
72 62 Table 15 shows the average response times for the opposing traffic comparisons. In both states, the average response times were lower when there was no opposing traffic, although the differences were quite small. Table 15. Average response times based on opposing traffic. Opposin Wisconsin Massachusetts g Traffic Average Max Min Std Averag Max Min Std Dev. Dev. e Yes No Demographic Comparisons The objective of this analysis was to identify if driving experience or age impacted driver comprehension in the experimental scenarios. Chi-squared analyses were completed to identify differences in the percentage of correct responses based on driving experience and age. The results from the driving experience analysis are shown in Table 16. The results from the age analysis are shown in Table 17. In Wisconsin, participants with less than five years of driving experience had a significantly lower correct response rate than participants with more than five years of experience. Age also played a significant role in correct response rate. The year old age group had the highest correct response rate at 85.0%, while the year old age group had the lowest correct response rate at 71.9%. The year old group had a significantly higher correct response rate compared to all other age groups. The year old group had a significantly lower correct response rate compared to all other age groups. In Massachusetts, participants with less than five years of driving experience also had a lower correct response rate than participants with more than five years of experience, but none of the differences were significant. For the age analysis, almost 90% of the participants were between the ages of 18 and 24. As a result, the sample size for other age groups is extremely small and is likely not truly representative of the population. Due to this fact, the results from the Massachusetts age analysis were not used to make any observations. Nevertheless, the results are still shown in the tables and plots associated with the age analysis. Table 16. Chi-squared analysis for driving experience comparisons. Driving Experience 1 Driving Experience 2 1 (%)* Wisconsin 2 P (%)* Value 1 (%)* Massachusetts 2 (%)* P Value Less than 5 Years 5 to 10 Years Less than 5 Years More than 10 Years to 10 Years More than 10 Years *Percentage of correct (Yield) responses for the corresponding driving experience
73 Table 17. Chi-squared analysis for age comparisons. 63 Age Group 1 Age Group 2 Wisconsin Massachusetts 1(%)* 2(%)* P Value 1(%)* 2(%)* P Value *Percentage of Correct (Yield) responses for the corresponding age group The average response times based on driving experience and age are shown in Tables 18 and 19, respectively. In both states, the average response time increased as age increased. Since age is strongly correlated with driving experience, participants with more than 10 years of driving experience also had longer response times than other participants. Table 18. Average response times based on driving experience. Driving Experience Less than 5 years 5 to 10 years More than 10 years Wisconsin Massachusetts Ave Max Min Std Dev. Ave Max Min Std Dev Table 19. Average response times based on age. Age Wisconsin Massachusetts Group Average Max Min Std Dev. Averag Max Min Std Dev. e 18 to to to
74 Fail-Critical Comparison To examine if there were any statistical differences in the fail-critical responses, a regression odds model was developed. The model has the following form: log odds for failcritical intercept 0.33 ThruCG 0.05 Opposing Traffic The model analysis for fail-critical errors found: Evidence that making a fail-critical response increases in association with a thru CG indication. Evidence that making a fail-critical response decreases in association with opposing traffic. No change associated with any of the left-turn signal display types. No change associated with any of the participant demographics. The regression odds model shows that there is no difference in making a fail-critical response based on driver age or gender; however, driver behavior does show reliance on thru indication (especially CG) and opposing traffic. These results were useful in developing the scenarios chosen for the driving simulator study Observations from Study In addition to the statistical analysis, several observations were made. Although none of these observations are statistically significant, they are considered in the overall study results. Three important observations include: Many participants in Madison, Wisconsin commented that they were being asked the same question over and over again. This finding indicates that many participants did not realize that the FYA indication was being presented in different signal display sections throughout the study. This observation aligns well with the results from the statistical analysis, as driver comprehension was similar when the FYA indication was placed in the middle section compared to the bottom section; When presented with a solid YA indication, some participants stated that the correct answer was not available. Some participants were searching for a correct answer of prepare to stop ; and In Wisconsin, most applications of the FYA indication is accompanied by a supplemental sign (R10-12 modified) explaining that drivers should yield to opposing traffic with a FYA. Some participants commented that they find the use of a supplemental sign helpful. 4.3 Study Demographics for Dynamic Study Twenty-five participants completed the driving simulator study in Wisconsin and 31 participants completed the driving simulator study in Massachusetts, resulting in a combined total of 56 participants. A total of 466 scenarios received responses, with a bimodal FYA indication presented in 339 of the scenarios evaluated.
75 65 Three demographic questions were asked in the study. Specifically, participants were asked to provide information regarding their gender, age, and driving experience. A summary of the demographics for the study is shown in Table 20. Table 20. Summary of demographic information. Wisconsin Massachusetts Category Level Total Percent Total Percent Gender Male Female Age Driving Experience Summary of Results for Dynamic Study Summary of Results from Driving Simulator As mentioned in the Research Approach, participating drivers were asked to speak out loud while navigating each intersection and route in the three experimental modules. Researchers recorded participant comments as well as observations of driver comprehension and driver behavior associated with each scenario. Comprehension associated with each experimental and baseline signal display was determined through visual observation of driver behavior. No driver comprehension issues were observed with the three-section and four-section vertical signal displays and FYA indication combinations. The adjacent thru indication and the location of the FYA indication, bimodal with either the YA or GA, did not have any observed impact on comprehension. Although some participating drivers hesitated in gap selection and may have not accepted a gap of sufficient size, there was no instance where variability in gap selection was deemed to be a result of a lack of comprehension of the FYA indication or signal display combination. Only the five-section cluster signal display with simultaneous indications illuminated presented comprehension problems for participating drivers. When the five-section cluster signal display with a FYA permissive indication in either the middle or lower section was presented with a red thru indication, more than 30% of drivers were visibly confused and either stopped and waited
76 66 for the signal to change, or asked if they could proceed with disregard to the indication presented. Similar problems were not observed with the five-section cluster signal display and simultaneous FYA and CG thru indications. Post-driving simulator driver queries found that when asked about their preference of the location of the FYA indication, 38% preferred the FYA indication in middle section, 9% preferred the bottom, and 54% indicated no preference. Some of the comments included: thinks it should be on the mid-section because it makes sense, preferred the mid-section but does not know why, Makes sense for the FYA to be in the middle because it keeps the order, Best in middle because yellow is normally in the middle, and Middle is better, tells me to slow down and be cautious. A second evaluation considered the coordinate output of the driving simulator and the vehicle speed trajectory information associated with each experimental scenario. The speed trajectory of the drivers (speed vs. distance) as they approached each of the signalized intersection scenarios was obtained by analyzing the coordinate output files produced by the driving simulator. It was hypothesized that operating speeds at each intersection was correlated to driver s level of comprehension. A series of figures showing the cumulative vehicle trajectories for each study intersection are presented in Appendix D. A summary of the maximum observed driver speeds at the start of the turn bay for each scenario is shown in Table 21. Recall that the posted speed limit throughout each module was 35 mph. A general trend was observed when analyzing the data. Drivers decrease their speed and/or stopped to wait for an acceptable gap in each of the experimental scenarios. In fact, in over 80% of the scenarios, drivers stopped or slowed down to a speed lower than 5 mph before crossing the opposing traffic. This trend can be confirmed by visual inspection of the trajectories shown in Appendix D. Table 21. Summary of Trajectory Data. Scenario* Average Maximum Speed (MPH) 9a 29 9b 29 10a 31 10b a 29 58b 31 62a 29 62b 33 *See Figure 19 for scenario descriptions
77 67 The trajectories in Appendix D also show vehicles stopping past the stop bar of the approach and then proceeding after selecting a gap. In multiple instances, drivers appeared to make a decision to proceed and continued moving, only to reconsider their decision by slowing to yield to opposing traffic and search for a gap, behaving as expected when presented with an FYA indication. There was some evidence to support the observation of driver confusion associated with the five-section cluster signal display and simultaneous CR thru indication. Average speed was lower and speed variance less at the stop bar location, indicating a great numbers of drivers who hesitated and/or stopped as they tried to comprehend the appropriate action. No differences in driving behavior were observed in the trajectories of scenarios with a bimodal indication and of those without the bimodal indication. Furthermore, no difference in the trajectories was observed when comparing those scenarios in which a RA indication was presented prior to the signal going into the FYA mode Summary of Results from Eye Tracker Eye tracking data was successfully collected for a total of 54 scenarios using a Mobile Eye-XG head-mounted data collection unit. Sixteen drivers that completed the scenarios at the University of Wisconsin participated in the eye tracking evaluation. Data from the eye tracker provided different insight into the behavior of drivers and how they searched for information when presented with a dynamic intersection containing traffic signal displays and the FYA indication. Knowledge can also be obtained by observing where drivers search for information when the meaning of a traffic signal indication may not be clear. While the driver comprehension and speed trajectory data support expected driver behavior when presented with all three- and foursection signal display and FYA indication combinations, the eye tracking data reveals that perhaps the decision made by the drivers is not always the result of correctly comprehending the traffic signal indications. When analyzing the time drivers spent dwelling on (e.g., looking at) opposing traffic, the FYA indication, and the thru signal indications when they approached the intersection and were near the stop bar, eye tracking data reveals that drivers spent a significantly larger amount of time looking at opposing traffic when compared to the time spent looking at the thru signal and the FYA indications. This behavior is summarized in Figure 31 by highlighting the area that drivers paid more attention to in red (area 1) and the area with the least attention in green (area 3).
78 68 2 FYA Thru Indication Opposing Traffic 3 1 Figure 31. Summary of eye tracking behavior. Figure 32 shows a box-and whisker plot of the total dwell duration by scenario. Recall that the box represents the median and 1st and 3rd quartiles, and the whiskers extend to the high and low data values. For all the scenarios evaluated, drivers spent a significantly longer amount of time observing opposing traffic (1.94 seconds), followed by the FYA indication (0.36 seconds), and thru indications (0.21 seconds). Appendix E contains additional box-and-whisker plots for the eye tracking data showing average dwell durations, total count of observations, and total dwell duration. When observing the five-section cluster signal displays, specifically scenario 62a and 62b which contained simultaneous FYA and CR indications, with CR thru movement indications, some drivers appeared to use a rapid search process by toggling back and forth between the traffic signal displays and the opposing traffic. More glances to the traffic signal displays are observed, but the primary decision point seems to come from opposing traffic. Figure 33 depicts a heat map supporting this result. This behavior appeared to support the fact that driver comprehension was lower for the five-section cluster signal displays with simultaneous indications, results in a different information search pattern. Some drivers were also observed spending the majority of their visual search on the opposing traffic, suggesting that the opposing traffic pattern was the primary source for left-turn decision information. Figure 34 presents a heat map of this scenario while Appendix F contains heat maps for each scenario. In some cases, it can be concluded that rapid driver comprehension of the FYA indication in a three-section vertical signal display allowed more time to be focused on observing opposing traffic and gap identification. A very different visual scan pattern was observed with scenario 9aH. Recall that in the scenario, when drivers approached the intersection, a FYA indication was shown instead of a GA. As the driver entered the left-turn bay of the intersection, the signal changed to a steady yellow in the middle section of the signal display. Scenario 9aH also had a same direction vehicle waiting to
79 69 turn left in front of the approaching driver. When the driver entered the left-turn bay, the vehicle started to turn. The objective was to see if participating drivers made their turn decision by following the lead vehicle rather than solely on the traffic signal indications. Once the driver crossed the stop bar, the left-turn indication turned red. The eye tracking data suggests that drivers looked at the opposing traffic and traffic signal displays multiple times. However, on average, drivers still spent a majority of their time dwelling on the opposing traffic. This behavior reinforces the findings from the analysis of eye tracking data on other scenarios: drivers rely significantly on the opposing traffic when making permissive left-turn decisions. Another important finding from observing driver in scenario 9aH is that drivers appeared to observe the change from FYA to steady YA and indicated no confusion with this change in indications.

80 Figure 32 Sample eye tracking behavior. 70


81 71 Figure 33. Heat map for five-section cluster signal display with simultaneous FYA and CR indications. Figure 34. Heat map for three-section vertical signal display with FYA indication.
82 CHAPTER 5 72 Conclusions and Discussion 5.1 Conclusions The objective of this research was to analyze driver behavior and driver comprehension impacts of retrofitting existing three- and five-section signal displays with the FYA indication. This objective was accomplished by conducting a computer-based static study at various locations in Madison, Wisconsin and Amherst, Massachusetts, and a dynamic driving simulator study at the same locations. The results from the studies were analyzed to determine if the location of the FYA indication within any given signal display arrangement had a significant impact on driver comprehension. In addition, other variables were analyzed to determine if they had any impact on driver comprehension. These variables included the signal display arrangement, the thru indication, the presence of opposing traffic, and demographics. Note that there is not enough sensitivity in the simulator to evaluate issues pertaining to the placement of separate versus shared left-turn signal displays and tightly spaced (less than 8 feet) signal displays. For all signal display arrangements evaluated, there was not a statistically significant difference in driver comprehension when the FYA indication was located in the middle section or the bottom section of the signal display. In Wisconsin, scenarios involving a FYA indication in the middle section had a correct response rate of 77.4%, while scenarios involving a FYA indication in the bottom section had a correct response rate of 78.1%. In Massachusetts, the correct response rates were 68.1% and 70.0%, respectively. Analyses were also completed to determine whether the location of the FYA indication was comprehended differently for selected signal displays and thru movement indications. There were no significant differences identified. When considering the traffic signal display arrangement, driver comprehension was the lowest for the five-section cluster signal display with simultaneously illuminated left-turn and thru movement indications. The fact that the five-section cluster signal display with simultaneous indication had the lowest correct response rate in both of the states is not surprising, as previous research completed by Noyce and Kacir, and Knodler, et al., had shown that driver comprehension is significantly reduced with simultaneous indications (Noyce and Kacir 2005, Knodler, Noyce, Kacir, and Brehmer 2005). Overall, the results show that the signal display arrangement did not impact driver comprehension of the FYA indication. Driver comprehension was significantly impacted by the adjacent thru indication in Wisconsin. Left-turn signal displays with the FYA indication with a CG thru movement indication had the highest correct response rate at 89.7%, followed by the CY indication with a correct response rate of 74.6%. When the adjacent indication was a CR indication, the lowest correct response rate at 66.9% was observed. The differences between each of these adjacent thru indications was statistically significant. Massachusetts had similiar results with correct response rates of 79.1% with a thru CG indication, 69.9% with a thru CY indication, and 60.8% with a thru CR indication, respectively. Results show that the thru indication is considered in left-turn decision making and has a large impact on driver comprehension.
83 73 A total of 56 drivers participated in the driving simulator study, providing 466 scenario responses. A bimodal FYA indication in a three-, and five-section signal display was featured in 339 of the scenarios evaluated. Eye tracking data was also collected for 16 drivers. Findings show no significant differences in driver comprehension when the FYA indication was presented bimodally in the bottom section or bimodally in the middle section of a three-section vertical signal display. Post-driving simulator participant queries found that 38% preferred the FYA indication in the middle section, 9% preferred the bottom, and 54% indicated no preference. There was also no significant difference in correct responses between the three-section and foursection vertical signal displays. Driver comprehension was significantly lower when the FYA indication was added bimodally to the five-section cluster signal display and the simultaneous thru movement indication was also illuminated. This result was especially true when the simultaneous and thru movement indication was CR. Speed trajectory data showed that drivers decreased their speed and/or stopped to wait for an acceptable gap in each of the experimental scenarios. Trajectories also showed vehicles stopping past the stop bar of the approach and then proceeding after selecting a gap. In multiple instances, drivers appeared to make a decision to proceed and continued moving, only to reconsider their decision by slowing to yield to opposing traffic and search for a gap. Observed behavior was expected when drivers were presented with an FYA indication. There was evidence to support the observation of driver confusion associated with the five-section cluster signal display and simultaneous CR thru indication. Average speed was lower and speed variance less at the stop bar location, indicating a greater number of drivers hesitated and/or stopped as they tried to comprehend the appropriate action. No differences in driving behavior were observed in the trajectories of scenarios with a bimodal indication and of those without the bimodal indication. Furthermore, no difference in the trajectories was observed when comparing those scenarios in which a RA indication was presented prior to the signal going into the FYA indication mode. Eye tracking data showed that participants spent more time looking at opposing traffic than at the combination of FYA and thru movement indications. Evidence of a more rapid search process between opposing traffic and the signal displays was observed when drivers did not completely comprehend the traffic signal displays. This evidence was clearly observed with the five-section cluster signal display with a simultaneous CR indication. Combined research results show that the FYA indication can be effectively used (retrofit) in existing three-section vertical signal displays, when combined bimodally within the YA or GA indication section, without negatively impacting driver behavior and comprehension. The FYA indication retrofit is not recommended for use in any section of a five-section cluster signal display with or without simultaneous indications. Other signal display arrangements do not impact driver comprehension of the FYA indication, as long as simultaneous indications are not used. Although the static and driving simulator studies do not show a difference in driver behavior and driver comprehension when the FYA indication is either in the middle or bottom section of the three-section signal display, the post-driving simulator questionaire clearly showed that drivers prefer the FYA/YA bimodal signal indication within the middle section. Furthermore, with the FYA/GA bimodal indication in the go section of the signal display, the probability of a failcritical error was increased. Recall that reduction in fail-critical errors has proven to be the significant contribution of using a FYA permissive left-turn indication. Although there is some concern with the FYA indication being bimodal with the YA indication in drivers detecting the
84 74 change from FYA to solid YA during the change interval, post-driving simulator participant questionnaire responses, along with the high probability of a fail-safe response and no observed concerns in the experimental evaluations, makes the FYA/YA bimodal indication the most desirable retrofit. Therefore, researchers recommend that the FYA indication can be effectively used in a three-section traffic signal display only when used bimodally with the steady YA indication. Speed trajectory data found that drivers decrease their speed and/or stopped to wait for an acceptable gap in each of the experimental scenarios. Trajectories also show vehicles stopping past the stop bar of the approach and then proceeding after selecting a gap. In multiple instances, drivers appeared to make a decision to proceed and continued moving, only to reconsider their decision by slowing to yield to opposing traffic and search for a gap. Observed behavior was expected when drivers were presented with a FYA indication. There was evidence to support the observation of driver confusion associated with the five-section cluster signal display and simultaneous CR thru indication. Average speed was lower and speed variance less at the stop bar location, indicating a great numbers of drivers who hesitated and/or stopped as they tried to comprehend the appropriate action. No differences in driving behavior were observed in the trajectories of scenarios with a bimodal indication and of those without the bimodal indication. Furthermore, no difference in the trajectories was observed when comparing those scenarios in which a RA indication was presented prior to the signal going into the FYA indication mode. Eye tracking data showed that participants spent more time looking at opposing traffic than at the combination of FYA and thru movement indications. Evidence of a more rapid search process between opposing traffic and the signal displays was observed when drivers did not completely comprehend the traffic signal displays. This evidence was clearly observed with the five-section cluster signal display with a simultaneous CR indication. Research results show that the FYA indication is an acceptable retrofit for existing three-section vertical signal displays when combined bimodally with the YA or GA indication section. The FYA indication retrofit is not recommended for use in any section of a five-section cluster signal display. The signal display arrangement does not impact driver comprehension of the FYA indication, as long as simultaneous thru movement indications are not used. 5.2 Discussion Although, the static study and driving simulator study do not show a difference in driver comprehension and driver behavior when the FYA indication is either the middle or bottom of the three-section signal display, the post-driving simulator questionairre presents evidence to suggest that drivers prefer the FYA/YA bimodal indication in PPLT signal displays. Additionally, with the FYA/GA bimodal indication is in the go section of the signal display, the probability of a fail-critical error is increased. Reduction in fail-critical errors has proven to be the significant contribution of using a FYA permissive left-turn indication. Although there is some concern with the FYA indication being bimodal with the YA indication in driving detecting the change from FYA to solid YA during the change interval, post-driving simulator participant query responses, along with the high probability of a fail-safe response, makes the FYA/YA bimodal indication the most desirable retrofit. Therefore, researchers recommend that the FYA indication can be effectively used in a three-section traffic signal display only when used bimodally with the YA indication.
85 References Brehmer, C.L., Kacir, K.C., Noyce, D.A. and Manser, M.P Evaluation of Traffic Signal Displays for Protected/Permissive Left-Turn Control. NCHRP Report 493. Transportation Research Board of the National Academies, Washington, D.C., Campbell, J. L., C. M. Richard, and J. Graham. Human Factors Guidelines for Road Systems Collection A. NCHRP Report 600A, TRB, National Research Council, Washington D.C., Chapman, Peter R., Underwood, Geoffrey. Visual Search of Driving Situations: Danger and Experience. Perception. Vol 27, Pp Choi, Eun-Ha. Crash Factors in Intersection-Related Crashes: An On-Scene Perspective. DOT HS National Highway Traffic Safety Administration, Published Drakopoulos, Alex and Lyles, Richard W. An Evaluation of Age Effects on Driver Comprehension of Flashing Traffic Signal Indications Using Multivariate Multiple Response Analysis of Variance Models. Journal of Safety Research. Vol 32, Pp Duchowski, Andrew. Eye Tracking Methodology: Theory and Practice. Vol Springer, Falkmer, Torbjorn, and Gregersen, Nils Peter. A Comparison of Eye Movement Behavior of Inexperienced and Experienced Drivers in Real Traffic Environments. Optometry and Vision Science. Vol 82, No 8, Pp Federal Highway Administration Interim Approval for Optional Use of Flashing Yellow Arrow for Permissive Left Turns (IA-10). United States Department of Transportation, Federal Highway Administration Policy Memorandum, Washinton, D.C., Federal Highway Administration Manual on Uniform Traffic Control Devices for Streets and Highways. United States Department of Transportation, Federal Highway Administration, Published 2009, Revised Henery, S., and Geyer, R Assessment of Driver Recognition of Flashing Yellow Left- Turn Arrows in Missouri. Report OR Missouri Department of Transportation, Hurwitz, D.S., Monsere, C., Tuss, H., Paulsen, K. and Marnell, P Improved Pedestrian Safety at Signalized Intersections Operating the FYA. Report OTREC-RR Oregon State University, Corvallis, OR, Knodler, M.A., Jr., Noyce, D.A., Kacir, K.C., and Brehmer, C.L Evaluation of FYA in Traffic Signal Displays with Simultaneous Permissive Indications. In Transportation Research Record: Journal of the Transportation Research Board, No. 1918, Transportation Research Board of the National Academies, Washington, D.C., 2005, pp Knodler, M. A., Jr. and D. A. Noyce. Tracking Driver Eye Movements at Permissive Left-Turns. Presented at the 3rd International Driving Symposium on Human Factors in Driver Assessment, Training, and Vehicle Design. Rockport, Maine, Knodler, M.A., Jr., Noyce, D.A., Kacir, K.C., and Brehmer, C.L Potential Application of the FYA Permissive Indication in Separated Left-Turn Lanes. In Transportation Research Record: Journal of the Transportation Research Board, No. 1973, Transportation Research Board of the National Academies, Washington, D.C., 2006, pp Knodler, M.A., Jr., Noyce, D.A., Kacir, K.C., and Brehmer, C.L An Analysis of Driver and Pedestrian Comprehension of Requirements for Permissive Left-turn Applications. In Transportation Research Record: Journal of the Transportation Research Board, No. 1982, Transportation Research Board of the National Academies, Washington, D.C., 2006, pp Knodler, M. A., Jr., Noyce, D.A. and Fisher. D.L Evaluating the Impact of Two Allowable Permissive Left-turn Indications. The 86th Annual Meeting of the Transportation Research Board, Washington, D.C., Knodler, M.A., Jr., Noyce, D.A., Kacir, K.C., and Brehmer, C.L An Evaluation of Driver Conprehension for Solid Yellow Indications Resulting from Implementation of the 75
86 76 FYA. The 86th Annual Meeting of the Transportation Research Board, Washington, D.C., Knodler, M. A., Jr., and Fisher, D An Evaluation of Driver Comprehension Related to Solid Yellow Change Indications and the Potential Impact of the FYA Permissive Indication. Report UMAR18-7. New England University Transportation Center, Lin, P.W., Thiagarajan, G. and Atie, D Analysis of Drivers Reaction to the FYA (FYA) Signal Design from Field Observation. 15th World Congress on Intelligent Transportation Systems, New York, NY, Marnell, Patrick, et al. "Permissive Left-Turn Behavior at the Flashing Yellow Arrow in the Presence of Pedestrians." 7th International Driving Symposium on Human Factors in Driver Assessment, Training, and Vehicle Design. No Mourant, Ronald, and Rockwell, Thomas. Mapping Eye-Movement Patterns to the Visual Scene in Driving: An Exploratory Study. Journal of the Human Factors and Ergonomics Society Niemeyer, E FYA for Protected/Permissive Left Turns at Signalized Intersection. ITE 2005 Annual Meeting, Melbourne, Australia, Noyce, D.A., Fambro, D.B., and Kacir, K.C Traffic Characteristics of Protected/Permissive Left-Turn Signal Displays. In Transportation Research Record: Journal of the Transportation Research Board, No. 1708, Transportation Research Board of the National Academies, Washington, D.C., pp Noyce, D.A., and Kacir, K.C Drivers Understanding of Simultaneous Traffic Signal Indications in Protected Left-Turns. In Transportation Research Record: Journal of the Transportation Research Board, No. 1801, Transportation Research Board of the National Academies, Washington, D.C., 2002, pp Noyce, D.A., and Smith, C.R Driving Simulators Evaluation of Novel Traffic-Control Devices: Protected-Permissive Left-Turn Signal Display Analysis. In Transportation Research Record: Journal of the Transportation Research Board, No. 1844, Transportation Research Board of the National Academies, Washington, D.C., 2003, pp Noyce, D.A., Bergh, C.R. and Chapman, J.R Evaluation of the FYA Permissive-Only Left-Turn Indication Field Implementation. NCHRP Web-Only Document 123. Transportation Research Board of the National Academies, Washington, D.C., Pulugurtha, S.S., Agurla, M. and Khader, K.S.C How Effective are FYA Signals in Enhancing Safety? 1st Integrated Transportation and Development Conference, Chicago, IL, Schattler, K.L., and Lund, J.A State-of-the-Art Literature Review on Permissive /Protected Left-Turn Control. Report FHWA-ICT Illinois Center for Transportation, Urbana, IL, Schattler, K.L., Rietgraf, A., Burdett, B. and Lorton, W Driver Comprehension and Operations Evaluation of Flashing Yellow Arrows. Report FHWA-ICT Illinois Center for Transportation, Urbana, IL, Sodhi, M., B Reimer, J. L. Cohen, E. Vastenburg, R. Kaars, S. Kirschenbaum. On-Road Driver Eye Movement Tracking Using Head-Mounted Devices. ETRA 02 Proceedings of the 2002 Symposium on Eye Tracking Research and Applications Wallis, S.A Binomial confidence intervals and contingency tests: mathematical fundamentals and the evaluation of alternative methods. Journal of Quantitative Linguistics, Vol. 20, No. 3, United Kingdom, 2013, pp
87 Abbreviations, Acronyms, and Symbols 77 CG DMV FCR FCY FHWA FRA FYA GA MUTCD PPLT RA YA Circular Green Department of Motor Vehicles Flashing Circular Red Flashing Circular Yellow Federal Highway Administration Flashing Red Arrow Flashing Yellow Arrow Green Arrow Manual on Uniform Traffic Control Devices Protected/Permissive Left-Turn Red Arrow Yellow Arrow
88 78 APPENDIX A: Static Study Scenario and Response Summary Table A-1. Static study signal display scenarios evaluated.
89 Table A-1. Static study signal display scenarios evaluated (cont t). 79 Table A-1. Static study signal display scenarios evaluated (con t).
90 80
91 Table A-1. Static study signal display scenarios evaluated (con t). 81
92 Table A-1. Static study signal display scenarios evaluated (con t). 82
93 Table A-1. Static study signal display scenarios evaluated (con t). 83
94 Table A-1. Static study signal display scenarios evaluated (con t). 84
95 Table A-1. Static study signal display scenarios evaluated (con t). 85

96 APPENDIX B: Computer-Based Static Study 86 Figure B-1: Introduction Screen Figure B-2: Demographic Screen
97 87 Figure B-3: Practice Screen Figure B-4: Question Screen
98 Figure B-5: Thank You Screen 88
99 APPENDIX C: Screen Shots of Intersections 89 Figure C-1. 62a- 5-Section Cluster FYA Bottom.

100 Figure C-2. 57b- 5-Section Cluster FYA Middle. 90
101 Figure C-3. 58a- 5-Section Cluster FYA Bottom. 91
102 Figure C Section Vertical. 92
103 Figure C or 18-4-Section Vertical. 93
104 Figure C or 18-4-Section Vertical. 94
105 Figure C-7. 9b or 10b- 3-Section Vertical FYA Middle. 95
106 Figure C-8. 9a or 10a- 3-Section Vertical FYA Bottom. 96


107 APPENDIX D: Vehicle Trajectories 97 Figure D-1.Vehicle Trajectories for 9b, 58a, 58b, 17, 9a.


108 Figure D-2.Vehicle Trajectories for 18, 62a, 62b, 10a, 10b,

109 99 Figure E-1Average Dwell Duration by Scenario. APPENDIX E: Box Plot Charts for the Eye Tracking Data

110 Figure E-2. Dwell Count by Scenario. 100
111 Figure E-3. Total Dwell Duration by Scenario. 101


112 APPENDIX F: Eye Tracker Heat Maps 102 Figure G1. Route 1 Scenario 9b Figure G2. Route 1 Scenario 18 Figure G3. Route 1 Scenario 58a Figure G4. Route 1 Scenario 62a


113 103 Figure G5. Route 2 Scenario 10a Figure G6. Route 2 Scenario 17 Figure G7. Route 2 Scenario 58b Figure G8. Route 2 Scenario 62b


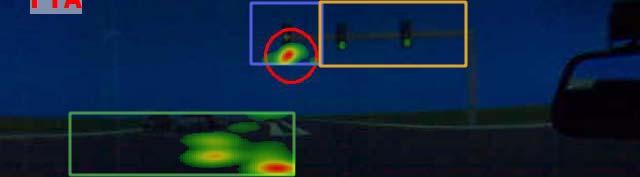
114 104 Figure G9. Route 3 Scenario 9a Figure G10. Route 3 Scenario 10b Figure G11. Route 3 Scenario 22 Figure G12. Route 3 Scenario 9aH
EVALUATING THE IMPACT OF TWO ALLOWABLE PERMISSIVE LEFT-TURN INDICATIONS
 EVALUATING THE IMPACT OF TWO ALLOWABLE PERMISSIVE LEFT-TURN INDICATIONS Michael A. Knodler Jr., Ph.D. Assistant Professor Department of Civil and Environmental Engineering University of Massachusetts-Amherst
New in the MUTCD: The Flashing Yellow Arrow Presented at the 57 th Annual Traffic and Safety Conference May 17, 2006
 New in the MUTCD: The Flashing Yellow Arrow Presented at the 57 th Annual Traffic and Safety Conference May 17, 2006 David A. Noyce, Ph.D., P.E. University of Wisconsin - Madison The FYA Story Research
Driving Simulators for Evaluation of Novel Traffic-Control Devices
 Transportation Research Record 1844 25 Paper No. 03-3625 Driving Simulators for Evaluation of Novel Traffic-Control Devices Protected Permissive Left-Turn Signal Display Analysis David A. Noyce and Christopher
Driver Behavior in the Presence of Pedestrians at Signalized Intersections Operating the Flashing Yellow Arrow
 Portland State University PDXScholar Civil and Environmental Engineering Faculty Publications and Presentations Civil and Environmental Engineering 2-2013 Driver Behavior in the Presence of Pedestrians
DRIVER COMPREHENSION AND OPERATIONS EVALUATION OF FLASHING YELLOW ARROWS
 CIVIL ENGINEERING STUDIES Illinois Center for Transportation Series No.13-021 UILU-ENG-2013-2018 ISSN: 0197-9191 DRIVER COMPREHENSION AND OPERATIONS EVALUATION OF FLASHING YELLOW ARROWS Prepared By Kerrie
Flashing Yellow Arrows (A different left turn option) ASCE Meeting June 9, 2015 Kerry C. NeSmith, PE Deputy State Maintenance Engineer
 ASCE Meeting June 9, 2015 Kerry C. NeSmith, PE Deputy State Maintenance Engineer") Flashing Yellow Arrows (A different left turn option) ASCE Meeting June 9, 2015 Kerry C. NeSmith, PE Deputy State Maintenance Engineer What IS the flashing yellow arrow??? Traditional left turn signal
Flashing Yellow Arrows (A different left turn option) ASCE Meeting June 9, 2015 Kerry C. NeSmith, PE Deputy State Maintenance Engineer What IS the flashing yellow arrow??? Traditional left turn signal
Abstract. Background. protected/permissive operation. Source: Google Streetview, Fairview/Orchard intersection
 ITE 2015 Western District Annual Meeting Ada County Highway District s Flashing Yellow Arrow Initiative Primary Author: Tim Curns, PE Ada County Highway District Traffic Engineer Author: Andrew Cibor,
DRIVER STUDY USING DRIVING SIMULATOR TECHNOLOGY (CONFIRMATION STUDY) Working Paper 7
 Working Paper 7") Evaluation of Traffic Signal Displays for Protected-Permissive Left-Turn Control NCHRP 3-54(2) DRIVER STUDY USING DRIVING SIMULATOR TECHNOLOGY (CONFIRMATION STUDY) Working Paper 7 June 2002 Prepared by:
Evaluation of Traffic Signal Displays for Protected-Permissive Left-Turn Control NCHRP 3-54(2) DRIVER STUDY USING DRIVING SIMULATOR TECHNOLOGY (CONFIRMATION STUDY) Working Paper 7 June 2002 Prepared by:
TRANSMITTAL LETTER. Revision to Publication 149, Chapter 20 (Criteria for the Design of Traffic Signal Supports) - March 2009 Edition
 - March 2009 Edition") OS-299 (7-08) TRANSMITTAL LETTER PUBLICATION: Publication 149 - Traffic Signal Design Handbook DATE: 10/14/10 SUBJECT: Revision to Publication 149, Chapter 20 (Criteria for the Design of Traffic Signal
OS-299 (7-08) TRANSMITTAL LETTER PUBLICATION: Publication 149 - Traffic Signal Design Handbook DATE: 10/14/10 SUBJECT: Revision to Publication 149, Chapter 20 (Criteria for the Design of Traffic Signal
NCUTCD Proposal for Changes to the Manual on Uniform Traffic Control Devices
 1 2 3 4 5 6 7 NCUTCD Proposal for Changes to the Manual on Uniform Traffic Control Devices Attachment No.: 2 Item # 18B-RW-02 8 9 10 11 12 13 14 15 16 17 18 19 20 21 22 23 24 25 26 27 28 29 30 31 TECHNICAL
PENNSYLVANIA IMPLEMENTATION OF FLASHING YELLOW ARROW
 PENNSYLVANIA IMPLEMENTATION OF FLASHING YELLOW ARROW RECOMMENDED PRACTICE LAST REVISED: MARCH 7, 2017 CONTENTS Introduction... 2 What is Flashing Yellow Arrow?... 2 History of Left-Turn Signals... 3 Background...
Development of Left-Turn Operations Guidelines at Signalized Intersections
 TxDOT 0-5840-1 http://itri.tsu.edu/reports/txdot_5840-r1.pdf Development of Left-Turn Operations Guidelines at Signalized Intersections August 2008 By Lei Yu, Ph.D., P.E., Yi Qi, Ph.D. Hongxi Yu Lei Guo
Improved Pedestrian Safety at Signalized Intersections Operating the Flashing Yellow Arrow
 Portland State University PDXScholar TREC Final Reports Transportation Research and Education Center (TREC) 4-2013 Improved Pedestrian Safety at Signalized Intersections Operating the Flashing Yellow Arrow
Safety and Operations Guidance for Using Timeof-Day Protected-Permissive Left-Turn Phasing Using Flashing Yellow Arrows
 Safety and Operations Guidance for Using Timeof-Day Protected-Permissive Left-Turn Phasing Using Flashing Yellow Arrows http://www.virginiadot.org/vtrc/main/online_reports/pdf/19-r10.pdf F. ADAM KING Engineer
An Analysis of Reducing Pedestrian-Walking-Speed Impacts on Intersection Traffic MOEs
 An Analysis of Reducing Pedestrian-Walking-Speed Impacts on Intersection Traffic MOEs A Thesis Proposal By XIAOHAN LI Submitted to the Office of Graduate Studies of Texas A&M University In partial fulfillment
STATIC AND DYNAMIC EVALUATION OF THE DRIVER SPEED PERCEPTION AND SELECTION PROCESS
 STATIC AND DYNAMIC EVALUATION OF THE DRIVER SPEED PERCEPTION AND SELECTION PROCESS David S. Hurwitz, Michael A. Knodler, Jr. University of Massachusetts Amherst Department of Civil & Environmental Engineering
Flashing Yellow Left Turn Arrows Scottsdale s Experience
 Flashing Yellow Left Turn Arrows Scottsdale s Experience 2013 ITE Western District Conference July 16, 2013 Todd Taylor, P.E., PTOE City of Scottsdale Senior Traffic Engineer FYLTA Review Question NCHRP
Driver Understanding of the Flashing Yellow Arrow and Dynamic No Turn on Red Sign for Right Turn Applications
 University of Massachusetts Amherst ScholarWorks@UMass Amherst Masters Theses Dissertations and Theses 2018 Driver Understanding of the Flashing Yellow Arrow and Dynamic No Turn on Red Sign for Right Turn
Shortening or omitting a pedestrian change interval when transitioning into preemption
 Signals #1 NOTE: This is a recommendation by the Signals Technical Committee of the NCUTCD. It is being distributed to the NC Sponsoring agencies for review and is subject to revision. This recommendation
Flashing Yellow Arrow Left-Turn Signal Guidelines
 Flashing Yellow Arrow Left-Turn Signal Guidelines General What Is It? It s a new type of signal placed OVER the left-turn lane at a signalized intersection. The signal display includes a flashing yellow
IC Chapter 3. Traffic Control Signals
 IC 9-21-3 Chapter 3. Traffic Control Signals IC 9-21-3-0.5 "Pedestrian hybrid beacon" Sec. 0.5. As used in this chapter, "pedestrian hybrid beacon" means a traffic control signal used to warn and control
TRAFFIC AND SAFETY CONFERENCE October 18, 2017 FLASHING YELLOW ARROWS
 TRAFFIC AND SAFETY CONFERENCE October 18, 2017 FLASHING YELLOW ARROWS FLASHING YELLOW ARROWS LEFT TURN YIELD ON FLASHIN G ARROW How did it get started Early Research Our projects Outreach Construction
Washington St. Corridor Study
 FIGURE 7.17 Bridge Alternatives - Cross Sections 86 Discarded Alternative: Short-Term Bridge Repair Short-term repairs and west bridge span replacement were considered during analysis. Short-term repairs
IC Chapter 3. Traffic Control Signals
 IC 9-21-3 Chapter 3. Traffic Control Signals IC 9-21-3-0.5 "Pedestrian hybrid beacon" Sec. 0.5. As used in this chapter, "pedestrian hybrid beacon" means a traffic control signal used to warn and control
METHODOLOGY. Signalized Intersection Average Control Delay (sec/veh)
") Chapter 5 Traffic Analysis 5.1 SUMMARY US /West 6 th Street assumes a unique role in the Lawrence Douglas County transportation system. This principal arterial street currently conveys commuter traffic
Chapter 5 Traffic Analysis 5.1 SUMMARY US /West 6 th Street assumes a unique role in the Lawrence Douglas County transportation system. This principal arterial street currently conveys commuter traffic
ATTACHMENT NO. 11. RRLRT No. 2. Railroad / Light Rail Transit Technical Committee TECHNICAL COMMITTEE: Busway Grade Crossings STATUS/DATE OF ACTION
 ATTACHMENT NO. 11 RRLRT No. 2 TECHNICAL COMMITTEE: TOPIC: Railroad / Light Rail Transit Technical Committee Busway Grade Crossings STATUS/DATE OF ACTION RRLRT TC Draft: 06/23/2011 RRLRT TC Approval: 06/27/2014
Crash Analysis of I-64 Closure in St. Louis County
 Report # MATC-MST: 341 Final Report 25-1121-0001-341 Crash Analysis of I-64 Closure in St. Louis County Ghulam H. Bham, Ph.D. Professor Department of Civil, Architectural, and Environmental Engineering
Yellow and Red Intervals It s Just a Matter of Time. 58 th Annual Alabama Transportation Conference February 9, 2015
 Yellow and Red Intervals It s Just a Matter of Time 58 th Annual Alabama Transportation Conference February 9, 2015 Presentation Content Background on Timing Methodology Findings and Recommendations from
Module 3 Developing Timing Plans for Efficient Intersection Operations During Moderate Traffic Volume Conditions
 Module 3 Developing Timing Plans for Efficient Intersection Operations During Moderate Traffic Volume Conditions CONTENTS (MODULE 3) Introduction...1 Purpose...1 Goals and Learning Outcomes...1 Organization
2016 THE Short Course
 2016 THE Short Course Flashing Yellow Arrows Mike Dolde, PE, PTOE CBB Randy Laninga - IDOT SHORT COURSE OBJECTIVES History Operation Planning Design Implementation Evaluation Lessons Learned HISTORY OF
Simulation Analysis of Intersection Treatments for Cycle Tracks
 Abstract Simulation Analysis of Intersection Treatments for Cycle Tracks The increased use of cycle tracks also known as protected bike lanes has led to investigations of how to accommodate them at intersections.
Strategies to Re capture Lost Arterial Traffic Carrying Capacities
 Strategies to Re capture Lost Arterial Traffic Carrying Capacities Chalap K. Sadam, P.E. and Albert L. Grover, P.E. Over the years, many arterials that were initially designed to carry tens of thousands
ENHANCED PARKWAY STUDY: PHASE 2 CONTINUOUS FLOW INTERSECTIONS. Final Report
 Preparedby: ENHANCED PARKWAY STUDY: PHASE 2 CONTINUOUS FLOW INTERSECTIONS Final Report Prepared for Maricopa County Department of Transportation Prepared by TABLE OF CONTENTS Page EXECUTIVE SUMMARY ES-1
PART 4 HIGHWAY TRAFFIC SIGNALS
 2016 Edition Page 111 PART 4 HIGHWAY TRAFFIC SIGNALS CHAPTER 4A. GENERAL [This is a new section. There is no corresponding section in the MUTCD.] Section 4A.100 Traffic Control Device Alternatives for
By Kay Fitzpatrick, Ph.D., P.E., Ann Do, P.E., and Bruce Friedman, P.E.
 feature shutterstock.com/dieter Hawlan Rapid-Flashing Beacons for Pedestrian Treatments By Kay Fitzpatrick, Ph.D., P.E., Ann Do, P.E., and Bruce Friedman, P.E. The rectangular rapid-flashing beacon has
EFFICIENCY OF TRIPLE LEFT-TURN LANES AT SIGNALIZED INTERSECTIONS
 EFFICIENCY OF TRIPLE LEFT-TURN LANES AT SIGNALIZED INTERSECTIONS Khaled Shaaban, Ph.D., P.E., PTOE (a) (a) Assistant Professor, Department of Civil Engineering, Qatar University (a) kshaaban@qu.edu.qa
Rules of the Road Committee (RORC)
") 1 2 3 4 5 6 ATTACHMENT No. 1 ROR UVC No. 1 7 8 9 10 11 12 13 14 15 16 17 18 19 20 21 22 23 24 25 26 27 28 29 30 31 32 33 34 35 36 37 38 39 40 41 42 43 44 45 NOTE: The Rules of the Road Committee (RORC)
1 2 3 4 5 6 ATTACHMENT No. 1 ROR UVC No. 1 7 8 9 10 11 12 13 14 15 16 17 18 19 20 21 22 23 24 25 26 27 28 29 30 31 32 33 34 35 36 37 38 39 40 41 42 43 44 45 NOTE: The Rules of the Road Committee (RORC)
SCOPE Application, Design, Operations,
 SCOPE Application, Design, Operations, Maintenance, etc.: Typical Traffic Control Signals Pedestrian Hybrid Beacons Emergency Vehicle One-Lane/Two-Way Facilities, Freeway Entrance Ramps, and Movable Bridges
Safety Assessment of Installing Traffic Signals at High-Speed Expressway Intersections
 Safety Assessment of Installing Traffic Signals at High-Speed Expressway Intersections Todd Knox Center for Transportation Research and Education Iowa State University 2901 South Loop Drive, Suite 3100
Geometric Categories as Intersection Safety Evaluation Tools
 Geometric Categories as Intersection Safety Evaluation Tools John R. Campbell Ayres Associates N19 W24075 Riverwood Drive, Suite 300 Waukesha, WI 53188 campbellj@ayresassociates.com Keith K. Knapp Engineering
Chapter V TRAFFIC CONTROLS. Tewodros N.
 Chapter V TRAFFIC CONTROLS www.tnigatu.wordpress.com tedynihe@gmail.com Lecture Overview Traffic markings Longitudinal markings Transverse markings Object markers and delineator Traffic signs Regulatory
Department of Transportation
 Department of Transportation I. Internal Scan The number of older drivers in the United States will double over the next 30 years. By 2030 one in five Americans will be age 65 or older. On a licensed-driver
Oregon Supplement to the Manual on Uniform Traffic Control Devices. Adopted July 2005 by OAR
 Oregon Supplement to the Manual on Uniform Traffic Control Devices Adopted July 2005 by OAR 734-020-0005 2003 Edition Oregon Supplement to the MUTCD Page 2 INTRODUCTION Traffic control devices installed
Operational Comparison of Transit Signal Priority Strategies
 Operational Comparison of Transit Signal Priority Strategies Revision Submitted on: November, 0 Author: Adriana Rodriguez, E.I Assistant Engineer Parsons Brinckerhoff 0 South Orange Avenue, Suite 00 Orlando,
Developed by: The American Traffic Safety Services Association (ATSSA) 15 Riverside Parkway, Suite 100 Fredericksburg, VA
 15 Riverside Parkway, Suite 100 Fredericksburg, VA") Addendum Developed by: The American Traffic Safety Services Association (ATSSA) 15 Riverside Parkway, Suite 100 Fredericksburg, VA 22406-1022 800-272-8772 This material is based upon work supported by
Addendum Developed by: The American Traffic Safety Services Association (ATSSA) 15 Riverside Parkway, Suite 100 Fredericksburg, VA 22406-1022 800-272-8772 This material is based upon work supported by
Transportation Curriculum. Survey Report
 Transportation Curriculum Survey Report Jennifer Dill, Ph.D. Lynn Weigand, Ph.D. Portland State University Center for Urban Studies Center for Transportation Studies Initiative for Bicycle and Pedestrian
Borough of Danville, PA Traffic Calming Program Guidelines
 Borough of Danville, PA Traffic Calming Program Guidelines Adopted by Borough Council on 1 INTRODUCTION Speeding Traffic is a major concern in the Borough of Danville because of its detrimental impacts
Access Location, Spacing, Turn Lanes, and Medians
 Design Manual Chapter 5 - Roadway Design 5L - Access Management 5L-3 Access Location, Spacing, Turn Lanes, and Medians This section addresses access location, spacing, turn lane and median needs, including
Comparison of the Green Arrow and the Circular Green for Turn Prohibition to Reduce Wrong-Way Movements at Interchange Terminals
 Comparison of the Green Arrow and the Circular Green for Turn Prohibition to Reduce Wrong-Way Movements at Interchange Terminals Jin Wang Department of Civil Engineering Auburn University March 27, 2017
Evaluation of Work Zone Strategies at Signalized Intersections
 Evaluation of Work Zone Strategies at Signalized Intersections Khaled Shaaban Qatar University/Department of Civil and Architectural Engineering, Doha, Qatar Email: kshaaban@qu.edu.qa Dina Elnashar Qatar
by MUTCD standards and guidance include signs, signals, pavement
 Hari Kalla W hile the roadway of tomorrow isn t here just yet, the rules of the roadway of tomorrow are getting closer. Thanks to the work of scores of road safety experts around the nation, the first
Texas Transportation Institute The Texas A&M University System College Station, Texas
 1. Report No. FHWA/TX-05/0-4084-P1 4. Title and Subtitle GUIDELINES FOR THE USE OF COUNTERMEASURES TO REDUCE CRASHES ON APPROACHES TO SIGNALIZED INTERSECTIONS NEAR VERTICAL CURVES 2. Government Accession
Tight Diamond Interchange versus Single Point Urban Interchange: Pedestrians Prospective
 Tight Diamond Interchange versus Single Point Urban Interchange: Pedestrians Prospective Ahmed Amer, M.S. Ph.D. Candidate Graduate Research/Teaching Assistant Department of Civil & Environmental Engineering
Traffic Impact Study. Westlake Elementary School Westlake, Ohio. TMS Engineers, Inc. June 5, 2017
 TMS Engineers, Inc. Traffic Impact Study Westlake Elementary School Westlake, Ohio June 5, 2017 Prepared for: Westlake City Schools - Board of Education 27200 Hilliard Boulevard Westlake, OH 44145 TRAFFIC
2004 NC Supplement to the Manual on Uniform Traffic Control Devices (MUTCD)
") 2004 NC Supplement to the Manual on Uniform Traffic Control Devices (MUTCD) CHAPTER 4D. TRAFFIC CONTROL SIGNAL FEATURES Section 4D.04 Meaning of Vehicular Signal Indications Standard: Vehicular traffic
2004 NC Supplement to the Manual on Uniform Traffic Control Devices (MUTCD) CHAPTER 4D. TRAFFIC CONTROL SIGNAL FEATURES Section 4D.04 Meaning of Vehicular Signal Indications Standard: Vehicular traffic
TRAFFIC IMPACT STUDY CRITERIA
 Chapter 6 - TRAFFIC IMPACT STUDY CRITERIA 6.1 GENERAL PROVISIONS 6.1.1. Purpose: The purpose of this document is to outline a standard format for preparing a traffic impact study in the City of Steamboat
The 2009 Manual on Uniform Traffic Control Devices (MUTCD) (Brief) Highlights for Arizona Practitioners. Arizona Department of Transportation
 (Brief) Highlights for Arizona Practitioners. Arizona Department of Transportation") The 2009 Manual on Uniform Traffic Control Devices (MUTCD) (Brief) Highlights for Arizona Practitioners Arizona Department of Transportation New 2009 MUTCD 9 Parts (down from 10 in 2003) 816 pages (up
The 2009 Manual on Uniform Traffic Control Devices (MUTCD) (Brief) Highlights for Arizona Practitioners Arizona Department of Transportation New 2009 MUTCD 9 Parts (down from 10 in 2003) 816 pages (up
Chapter 5 5. INTERSECTIONS 5.1. INTRODUCTION
 Chapter 5 5. INTERSECTIONS 5.1. INTRODUCTION Intersections are the physical component of the roadways where two highways intersect. They are the most complex element of roadways, since it requires more
DOT HS September Crash Factors in Intersection-Related Crashes: An On-Scene Perspective
 DOT HS 811 366 September 2010 Crash Factors in Intersection-Related Crashes: An On-Scene Perspective DISCLAIMER This publication is distributed by the U.S. Department of Transportation, National Highway
Effects of Traffic Signal Retiming on Safety. Peter J. Yauch, P.E., PTOE Program Manager, TSM&O Albeck Gerken, Inc.
 Effects of Traffic Signal Retiming on Safety Peter J. Yauch, P.E., PTOE Program Manager, TSM&O Albeck Gerken, Inc. Introduction It has long been recognized that traffic signal timing can have an impact
RAMP CROSSWALK TREATMENT FOR SAN DIEGO AIRPORT, TERMINAL ONE
 RAMP CROSSWALK TREATMENT FOR SAN DIEGO AIRPORT, TERMINAL ONE AUTHORS Faisal Hamood, P.Eng, M.Eng. Scott O. Kuznicki, P.E. Leonard Perry, Ph.D. SUBMITTAL DATE Friday, May 12 th, 2017 SUBMITTED FOR THE Annual
THIS PAGE LEFT BLANK INTENTIONALLY
 GA SR 25 Spur at Canal Road Transportation Impact Analysis PREPARED FOR GLYNN COUNTY, GEORGIA 1725 Reynolds Street, Suite 300 Brunswick, Georgia 31520 PREPARED BY 217 Arrowhead Boulevard Suite 26 Jonesboro,
Project Report. South Kirkwood Road Traffic Study. Meadows Place, TX October 9, 2015
 Meadows Place, TX October 9, 2015 Contents 1 Introduction... 1 2 Data Collection... 1 3 Existing Roadway Network... 2 4 Traffic Volume Development... 2 5 Warrant Analysis... 3 6 Traffic Control Alternative
STANLEY STREET December 19, 2017
 STANLEY STREET December 19, 2017 Welcome Mike Wiza, Mayor Scott Beduhn, Director of Public Works Agenda 1. Introduction 2. Existing Roadway Conditions 3. Current Alternative Improvements 4. Summary of
The Effect of Pavement Marking on Speed. Reduction in Exclusive Motorcycle Lane. in Malaysia
 Contemporary Engineering Sciences, Vol. 3, 2010, no. 3, 149-155 The Effect of Pavement Marking on Speed Reduction in Exclusive Motorcycle Lane in Malaysia Seyed Farzin Faezi PhD student in highway and
EVALUATION OF HAWK SIGNAL AT GEORGIA AVENUE AND HEMLOCK STREET, NW IN THE DISTRICT OF COLUMBIA FINAL REPORT. August 30, 2010
 EVALUATION OF HAWK SIGNAL AT GEORGIA AVENUE AND HEMLOCK STREET, NW IN THE DISTRICT OF COLUMBIA FINAL REPORT August 30, 2010 Submitted to: Mr. George Branyan Pedestrian Program Manager Policy, Planning
US Hwy. 64/264 Pedestrian Crossing at the Little Bridge Alternatives Analysis Public Meeting
 Town of Nags Head US Hwy. 64/264 Pedestrian Crossing at the Little Bridge Alternatives Analysis Public Meeting Prepared by: Department of Public Works August 8, 2013 Where traffic-control signals are not
Roundabout Design 101: Roundabout Capacity Issues
 Design 101: Capacity Issues Part 2 March 7, 2012 Presentation Outline Part 2 Geometry and Capacity Choosing a Capacity Analysis Method Modeling differences Capacity Delay Limitations Variation / Uncertainty
ADOT Statewide Bicycle and Pedestrian Program Summary of Phase IV Activities APPENDIX B PEDESTRIAN DEMAND INDEX
 ADOT Statewide Bicycle and Pedestrian Program Summary of Activities APPENDIX B PEDESTRIAN DEMAND INDEX May 24, 2009 Pedestrian Demand Index for State Highway Facilities Revised: May 29, 2007 Introduction
CHAPTER 1 STANDARD PRACTICES
 CHAPTER 1 STANDARD PRACTICES OBJECTIVES 1) Functions and Limitations 2) Standardization of Application 3) Materials 4) Colors 5) Widths and Patterns of Longitudinal Pavement Marking Lines 6) General Principles
Complete Street Analysis of a Road Diet: Orange Grove Boulevard, Pasadena, CA
 Complete Street Analysis of a Road Diet: Orange Grove Boulevard, Pasadena, CA Aaron Elias, Bill Cisco Abstract As part of evaluating the feasibility of a road diet on Orange Grove Boulevard in Pasadena,
Residential Traffic Calming Program Guide. Town of Ashland, Virginia
 Residential Traffic Calming Program Guide Town of Ashland, Virginia August 1, 2006 TABLE OF CONTENTS A. INTRODUCTION... 1 B. GOALS... 1 C. CRITERIA... 1 D. IDENTIFYING NEIGHBORHOOD TRAFFIC CONCERNS...
S 0659 S T A T E O F R H O D E I S L A N D
 LC0 0 -- S 0 S T A T E O F R H O D E I S L A N D IN GENERAL ASSEMBLY JANUARY SESSION, A.D. 0 A N A C T RELATING TO MOTOR AND OTHER VEHICLES - TRAFFIC CONTROL DEVICES Introduced By: Senators McCaffrey,
Existing Conditions. Date: April 16 th, Dan Holderness; Coralville City Engineer Scott Larson; Coralville Assistant City Engineer
 Date: April 16 th, 2015 To: From: Re: Dan Holderness; Coralville City Engineer Scott Larson; Coralville Assistant City Engineer Darian Nagle-Gamm, Traffic Engineering Planner Highway 6 (2 nd Street) /
IMPROVING PEDESTRIAN SAFETY AT UNCONTROLLED CROSSINGS. Guidelines for Marked Crosswalks
 IMPROVING PEDESTRIAN SAFETY AT UNCONTROLLED CROSSINGS Presented by Nazir Lalani P.E. Traffex Engineers Inc. N_lalani@hotmail.com Guidelines for Marked Crosswalks Source: FHWA, Safety Effects of Marked
TRAFFIC SIGNAL WARRANT STUDY
 TRAFFIC SIGNAL WARRANT STUDY 5 th STREET & ENCHANTED PINES DRIVE JANUARY 2013 TRAFFIC OPERATIONS ENGINEERING SERVICES/PUBLIC WORKS DEPARTMENT TABLE OF CONTENTS INTERSECTION LOCATION MAP ii INTRODUCTION
MUTCD (HAWK) 2016 & Adapting the Pedestrian Hybrid Beacon (HAWK) to Facilitate Bicycle Use. ITE-IMSA March, 2014
 2016 & Adapting the Pedestrian Hybrid Beacon (HAWK) to Facilitate Bicycle Use. ITE-IMSA March, 2014") MUTCD (HAWK) 2016 & Adapting the Pedestrian Hybrid Beacon (HAWK) to Facilitate Bicycle Use Presented By Richard Nassi, P.E., Ph.D. PAG Engineering Consultant Services, CA 0344 Traffic Engineering Gabriel
MUTCD (HAWK) 2016 & Adapting the Pedestrian Hybrid Beacon (HAWK) to Facilitate Bicycle Use Presented By Richard Nassi, P.E., Ph.D. PAG Engineering Consultant Services, CA 0344 Traffic Engineering Gabriel
RE: City of Portland Request to Experiment with HAWK/Bike signal
 October 4, 2005 Regina S. McElroy, Director Office of Transportation Operations HOTO Room 3401 400 7 th Street, S.W. Washington, D.C. 20590 RE: City of Portland Request to Experiment with HAWK/Bike signal
Introduction to Traffic Signal Timing
 Introduction to Traffic Signal Timing Course No: C-7 Credit: PDH Jeffrey W. Buckholz, Ph.D., P.E., PTOE Continuing Education and Development, Inc. 9 Greyridge Farm Court Stony Point, NY 98 P: (877) -58
GUIDELINES FOR USING DECISION SIGHT DISTANCE AT IGNALIZED INTERSECTIONS NEAR VERTICAL CURVES
 1. Report No. FHWA/TX-05/0-4084-P2 4. Title and Subtitle 2. Government Accession No. 3. Recipient's Catalog No. GUIDELINES FOR USING DECISION SIGHT DISTANCE AT IGNALIZED INTERSECTIONS NEAR VERTICAL CURVES
Title: Modeling Crossing Behavior of Drivers and Pedestrians at Uncontrolled Intersections and Mid-block Crossings
 Title: Modeling Crossing Behavior of Drivers and Pedestrians at Uncontrolled Intersections and Mid-block Crossings Objectives The goal of this study is to advance the state of the art in understanding
Proposed changes to Massachusetts MUTCD Supplement
 Proposed changes to Massachusetts MUTCD Supplement John F. Carr National Motorists Association October 24, 2002 This document contains recommendations as to the contents of the Massachusetts MUTCD supplement
Bureau of Planning and Research. Project No.: (C14) Phase II Final Report March 2, 2007 CMA
 Phase II Final Report March 2, 2007 CMA") Bureau of Planning and Research Safer Driver Actions at Stop Signs Project No.: 04-01 (C14) Phase II Final Report March 2, 2007 CMA Technical Report Documentation Page 1. Report No. 2. Government Accession
Bureau of Planning and Research Safer Driver Actions at Stop Signs Project No.: 04-01 (C14) Phase II Final Report March 2, 2007 CMA Technical Report Documentation Page 1. Report No. 2. Government Accession
TRAFFIC STUDY GUIDELINES Clarksville Street Department
 TRAFFIC STUDY GUIDELINES Clarksville Street Department 9/1/2009 Introduction Traffic studies are used to help the city determine potential impacts to the operation of the surrounding roadway network. Two
A Traffic Operations Method for Assessing Automobile and Bicycle Shared Roadways
 A Traffic Operations Method for Assessing Automobile and Bicycle Shared Roadways A Thesis Proposal By James A. Robertson Submitted to the Office of Graduate Studies Texas A&M University in partial fulfillment
Significant Changes to California's Yellow Signal Timing Protocols
 Significant Changes to California's Yellow Signal Timing Protocols Previous Yellow Interval Timing Rules Permitted to use posted speed limit or prima facie speed limit in calculating the minimum yellow
Appendix A: Crosswalk Policy
 Appendix A: Crosswalk Policy Appendix A: Crosswalk Policy Introduction This citywide Crosswalk Policy is aimed at improving pedestrian safety and enhancing pedestrian mobility by providing a framework
Traffic Impact Analysis (TIA) Process and Procedures Manual. September 2017
 Process and Procedures Manual. September 2017") Traffic Impact Analysis (TIA) Process and Procedures Manual Post Office Box 664 101 Huntersville-Concord Road Huntersville, NC 28070 Phone 704-766-2220 Fax 704-992-5528 www.huntersville.org (c) 2017, Town
Traffic Impact Analysis (TIA) Process and Procedures Manual Post Office Box 664 101 Huntersville-Concord Road Huntersville, NC 28070 Phone 704-766-2220 Fax 704-992-5528 www.huntersville.org (c) 2017, Town
Use of Throw Distances of Pedestrians and Bicyclists as Part of a Scientific Accident Reconstruction Method 1
 contents Introduction xi CHAPTER 1 Use of Throw Distances of Pedestrians and Bicyclists as Part of a Scientific Accident Reconstruction Method 1 Introduction 2 Basis of Speed Calculation 2 New Results
TECHNICAL COMMITTEE: Bicycle Technical Committee and Signals Technical Committee. Recommendation Bicycle Signal Faces
 1 2 3 ATTACHMENT NO. 18 Joint BTC/STC #1 4 5 6 7 8 9 10 11 12 13 14 15 16 17 18 19 20 21 22 23 24 25 26 27 28 29 30 31 32 33 34 35 36 37 38 39 40 41 42 NOTE: This is a recommendation to FHWA on changes
2014 FHWA Aging Road User Handbook. Recommendations to Accommodate Aging Pedestrians. Lifesaver National Conference. What is the Handbook?
 2014 FHWA Aging Road User Handbook Recommendations to Accommodate Aging Pedestrians Lifesaver National Conference March 17, 2015 Revised June 2014 1 What is the Handbook? 1998 1st Edition 2001 2nd Edition
PBIC Crash Types Series Left-Turn Crashes Involving Pedestrians
 PBIC Crash Types Series Left-Turn Crashes Involving Pedestrians Libby Thomas UNC Highway Safety Research Center David Hurwitz Oregon State University Chris Monsere Portland State University Bradley Topol
Pedestrian Safety Guide for Transit Agencies
 Pedestrian Safety Guide for Transit Agencies FDOT/FTPA/CUTR Professional Development Workshop June 15, 2010 1 Purpose Presentation Overview Bus Stop Location and Design Process/Partnership 2 Purpose Every
Technical Memorandum TRAFFIC IMPACT STUDY. RIDLEY ROAD CONVENIENCE STORE Southampton County, VA. Prepared for: Mr. David Williams.
 Technical Memorandum TRFFIC IMPCT STUDY RIDLEY ROD CONVENIENCE STORE Southampton County, V Prepared for: Mr. David Williams By: Charles Smith, P.E., PTOE EPR Charlottesville, V July 2014 1 TBLE OF CONTENTS
PEDESTRIAN CROSSING STATISTICS
 PEDESTRIAN SAFETY UTILIZATION OF RRFB AND HYBRID BEACONS WILLIAM (BILL) MARSHALL PEDESTRIAN CROSSING STATISTICS STUDIES INDICATE CROSSWALK COMPLIANCE IS FROM 4% 30% HAWAII REPORTED 50 NON YIELDS TO PEDESTRIANS
TECHNICAL MEMORANDUM VDOT Central Region On Call Task Order
 Kittelson & Associates, Inc. T R A N S P O R T A T I O N E N G I N E E R I N G / P L A N N I N G 1850 Centennial Park Drive, Suite 130, 20191 P 703-885-8970 F 703-885-8971 TECHNICAL MEMORANDUM VDOT Central
Right turns at signalised intersections: Can they be standardised?
 Right turns at signalised intersections: Can they be standardised? By : S Dumakude Why standardise right turning movements at signalised intersections? Are there any benefits to standardising right turns?
Boudart, Foster, Koonce, Maus, & Okimoto 1 IMPROVING THE BICYCLE DETECTION PAVEMENT MARKING SYMBOLS TO INCREASE COMPREHENSION AT TRAFFIC SIGNALS
 Boudart, Foster, Koonce, Maus, & Okimoto 0 0 0 0 IMPROVING THE BICYCLE DETECTION PAVEMENT MARKING SYMBOLS TO INCREASE COMPREHENSION AT TRAFFIC SIGNALS Jesse Boudart, E.I. * Kittelson & Associates, Inc.
Using SHRP 2 s NDS Video Data to Evaluate the Impact of Offset Left-Turn Lanes on Gap Acceptance Behavior Karin M. Bauer & Jessica M.
 Using SHRP 2 s NDS Video Data to Evaluate the Impact of Offset Left-Turn Lanes on Gap Acceptance Behavior Karin M. Bauer & Jessica M. Hutton 4 th International Symposium on Naturalistic Driving Research
Pavement Markings (1 of 3)
") Pavement Markings (1 of 3) DESCRIPTION AND DEFINITION Disadvantages Relatively high cost (over typical Crash reduction as yet unknown painted edge line) No tactile effect The STOP AHEAD pavement marking
Pavement Markings (1 of 3) DESCRIPTION AND DEFINITION Disadvantages Relatively high cost (over typical Crash reduction as yet unknown painted edge line) No tactile effect The STOP AHEAD pavement marking