Transit Signal Priority Demonstration Project Fargo-Moorhead Metro Area Transit
|
|
|
- Amanda Rodgers
- 6 years ago
- Views:
Transcription

1 430 IACC Building Fargo, ND Tel Fax Transit Signal Priority Demonstration Project Fargo-Moorhead Metro Area Transit Final Report June 2008 Prepared for: Fargo-Moorhead Council of Governments Prepared by: Advanced Traffic Analysis Center Upper Great Plains Transportation Institute North Dakota State University Fargo, North Dakota
2 BACKGROUND The Metro Area Transit (MAT) provides public transportation to the cities of Fargo, Moorhead, and West Fargo. The service primarily consists of a fixed-route bus system; however, a paratransit service is also available. Currently, the bus system consists of 11 Fargo routes, 6 Moorhead routes, 1 West Fargo route, and 2 NDSU campus circulator routes. In addition, most of the routes operate using 30-minute headways. The agency would like to reduce the travel time for some of its routes. If travel times are reduced, MAT may be able to combine routes and expand service to other areas. Transit signal priority has been used in large metropolitan areas for many years. Normally these areas have moderate to high transit demand and have bus headways of 15 minutes or less. Limited information is available for determining the benefits of TSP in smaller urban areas, such as Fargo-Moorhead. However, a study was conducted in 2001 by Kiel Ova and Ayman Smadi of the Advanced Traffic Analysis Center (ATAC) to determine the potential benefits of implementing TSP in downtown Fargo, ND (1). The study used a traffic simulation model (VISSIM) to evaluate various TSP strategies during two peak periods. The results of the simulation study and three other field studies are provided in the following sections. It should be noted that the results are more specific to the corridor where TSP was applied. Evaluation of Transit Signal Priority Strategies for Small-Medium Cities, Fargo (1) 14% reduction in bus travel time 38% reduction in bus stop delay 14% increase in side-street person delay Cermak Road Bus Preemption Study, Illinois (2) 8.2 sec/veh increase in cross-street stopped delay 83 sec (eastbound buses) and 12 sec (westbound buses) reduction in bus travel time 8% (eastbound buses) and 1% (westbound buses) reduction in bus travel time King County Demonstration Project, Washington (3) 13% decrease (AM peak) to a 9% increase (midday peak) in non-transit traffic delay 34% (AM peak) and 24% (midday peak) reduction in intersection bus delay 8% reduction in bus travel time 13% decrease (AM peak) to a 8% increase (midday peak) in person delay St. Cloud Transit Priority Evaluation Project, Minnesota (4) 43% reduction in bus delay caused by signalized intersections 24 bus riders were required to balance the person delay OBJECTIVES The main objective of the TSP implementation is to reduce the travel time of Route 11 by at least one minute. Travel time savings of one to two minutes may allow Routes 11 and 12 to be combined into one route. Other objectives of the study include the following: 1. Determining and installing the required hardware/software to the traffic signals and transit vehicles 2. Evaluating the before and after transit vehicle travel time 3. Documenting the lessons learned from the demonstration that may assist future implementations TSP OVERVIEW Transit signal priority is a tool to help the transit system become more reliable and cost effective. Using a variety of traffic signal timing hardware and control strategies, transit vehicles can incur less delay time at signalized intersections by giving them more right-of-way (priority) over other motor vehicles. Therefore, the transit vehicle may be able to complete its route in a shorter amount of time. However, there are usually negative impacts on other traffic that must be taken into consideration. Page 1
3 Preemption vs. Priority Signal priority and signal preemption are often used interchangeably; however, they refer to different processes (note Table 1). Signal preemption interrupts normal traffic signal operation to service railroad crossings and emergency vehicles. This special control mode allows opposing signal movements (phases) to be shortened or skipped until the signal transfers back to normal operations. The objectives of preemption at railroad crossings are to reduce train/vehicle crashes, while emergency vehicle preemption reduces emergency response time, improves safety of emergency vehicle personnel, and reduces emergency vehicle crashes at signalized intersections. Signal priority provides preferential treatment within normal control operation to service transit, emergency service vehicles, and commercial fleet vehicles. This strategy allows less drastic adjustments of opposing signal movements (phases) while providing some preferential treatment to the targeted vehicles. The objectives of signal priority, specifically transit signal priority, include reduced transit travel time (i.e., to improve schedule adherence) while minimizing the impacts to normal traffic operations. Table 1. Signal Preemption and Priority Information Signal Strategy Signal Priority Signal Preemption Strategy Objectives Reduce transit vehicle travel time (improve schedule adherence) Reduce train/vehicle crashes Reduce emergency response time Improve safety of emergency personnel Reduce crashes at signalized intersections Typical Applications Transit vehicle passage Commercial vehicle passage Servicing railroad crossings Emergency vehicle passage Traffic Signal Operation Preferential treatment Does not disrupt normal control Transfers control to special mode Does affect normal control Transit Signal Priority Components The major components used for a TSP implementation include transit vehicle detection and a traffic signal controller capable of responding to a signal priority request (note Figure 1). Transit vehicle detection (Pd) is a location upstream of the intersection where the priority request is sent to the traffic signal controller (C). The traffic signal controller processes the priority request and determines how to serve the request based on the defined priority control strategies (based on hardware/software capabilities). When the transit vehicle clears the intersection (Pc), the controller will then revert back to the normal signal timing parameters. Figure 1. TSP Basic Components (5) Page 2
4 TSP Strategy Options TSP objectives of reducing transit travel times can be met using several options, which include passive, active, and adaptive priority strategies. Passive and active strategies are the most commonly used strategies; therefore, these will be discussed further in the following sections. Passive Priority Passive priority strategies do not require any additional hardware or software for the transit vehicles or traffic controllers. This strategy attempts to benefit transit vehicle by retiming/adjusting signal plans to reduce travel time. Reductions in transit vehicle travel time may occur by providing signal coordination that favors transit vehicles and using shorter coordination cycle lengths. Active Priority Active priority strategies provide preferential treatment to a transit vehicle after the traffic controller detects the approaching vehicle. The controller responds to the priority activation (call) via two main strategies: 1) green extension, and 2) early green. Green Extension This strategy extends the green time for the movement (phase) having the transit vehicle. When the movement is displaying a green indication, transit vehicle detection extends the green interval allowing the transit vehicle to clear the intersection. Green extension is one of the most effective TSP strategies since it can prevent the transit vehicle from stopping at the signalized intersection. Early Green This strategy shortens the green time of preceding (opposing) phases when the transit vehicle is detected. If the movement with the transit vehicle is displaying a red indication, the controller will shorten the red interval of that movement by shortening (truncating) the green of the cross-street movements. Typically, early green and green extension strategies are available together within TSP environments but only one can be used per signal cycle. FARGO TSP IMPLEMENTATION Metro Area Transit (MAT) is always looking to expand its services to more areas of the metro area while maintaining its current headway, which is typically 30 minutes. The bus headway provides sufficient time for the bus to traverse its route and return to the main ground terminal center (GTC) or other transfer points. Each route has approximately 5 minutes of slack (buffer) time to ensure the buses stay on schedule. The slack time can be consumed by boarding/alighting (stop) frequency, stop duration, and traffic congestion. Initially, two routes were identified to incorporate TSP: Route 11 and Route 15. However, traffic controller tests revealed significant traffic impacts would occur when using TSP along a major arterial, which Route 15 traverses, without performing significant modification to the traffic controllers (these impacts will be discussed later in this document). Therefore, Route 15 was removed from this study. Routes 11 and 12 provide service to the north side of Fargo (Figure 2). The routes run parallel to each other (two blocks apart) for approximately two miles. Route 12 remains on 4 th St. until 19 th Ave. N. where it traverses east to Elm St. At Elm St., the route travels north to 32 nd Ave. N. where it makes a loop using Cherry Lane and 35 th Ave. N. prior to traveling back to the GTC. Route 11 remains on Broadway until 32 nd Ave. N. where it circles back to Broadway prior to traveling back to the GTC. The route combination may allow MAT to create another route in a different part of the metro area using one of the buses that currently serves Route 11 or 12. Page 3

5 Figure 2. MAT Routes 11, 12, and potential combination route Page 4
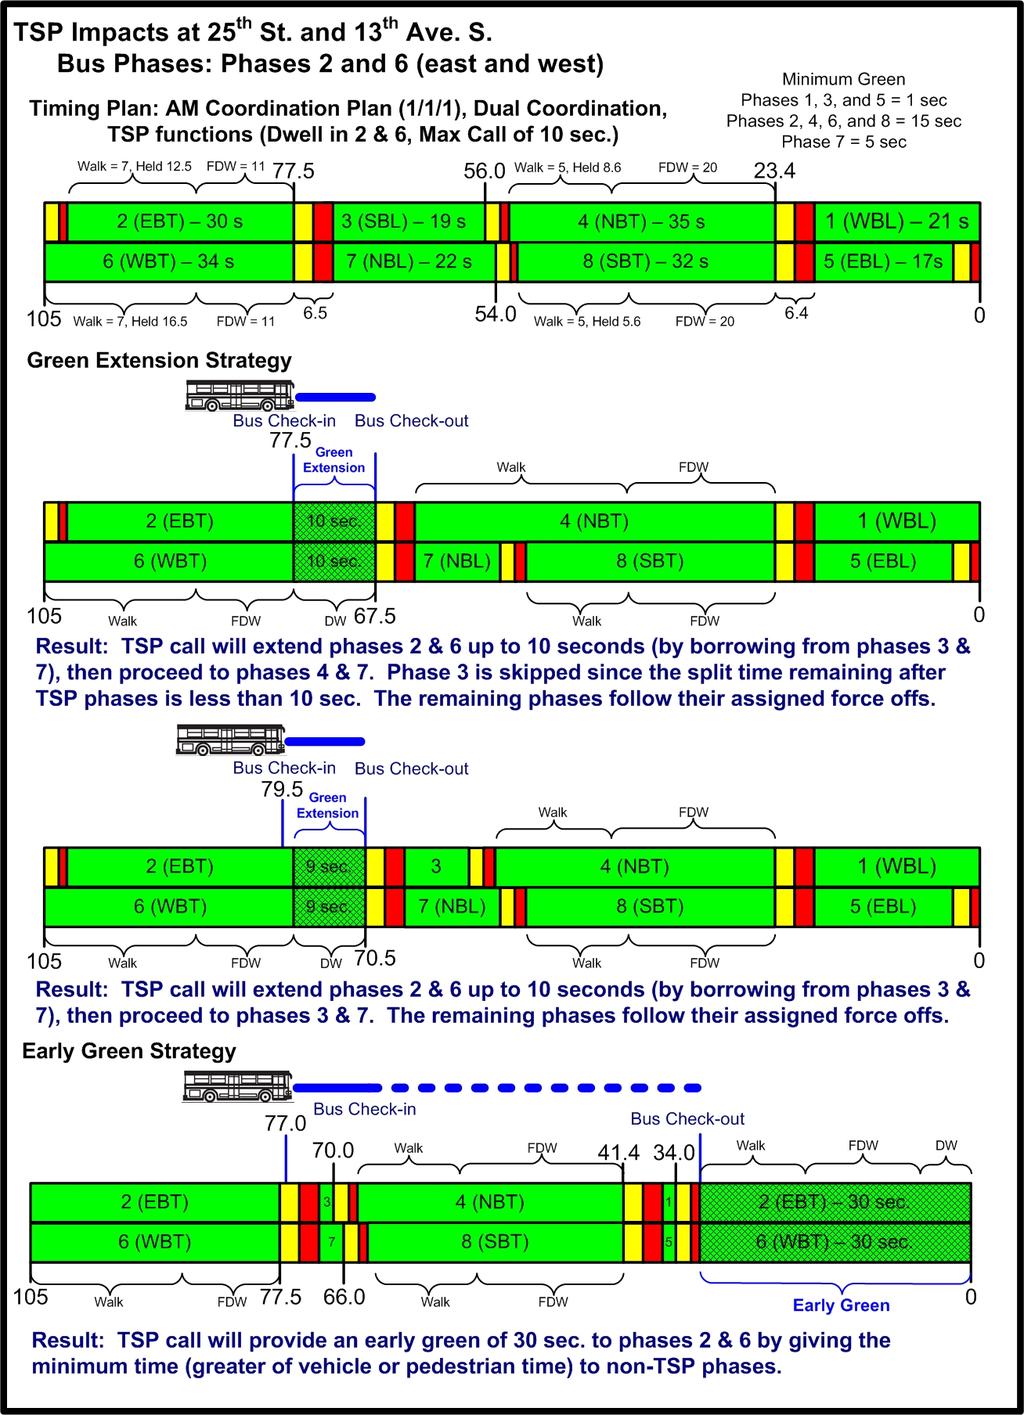
6 Traffic Signal System The City of Fargo uses Eagle traffic controllers (primarily NEMA TS 1) for the city s traffic signal system. Most of the signalized intersections incorporate vehicle loop detectors and operate as actuatedcoordinated. Emergency vehicles are allowed to preempt the signalized intersection using the Opticom Infrared System. Therefore, implementing TSP would not require significant resources since the Opticom Phase Selector/Discriminator and Opticom Detector are already installed and configured. However, Opticom Detectors are currently installed for only the approaches that are relevant for the emergency route (primarily along the major streets). Route 11 contains 13 traffic signals: 12 vehicle-actuated signals and 1 pedestrian-actuated signal. Most of these signalized intersections have some level of Opticom implementation (Figure 3). However, several of the approaches used by Route 11 do not have Opticom Detectors, which include the following: Broadway & 29 th Ave. N. (westbound) Broadway & 4 th Ave. N. (westbound and southbound) 5 th St. & NP Ave. (northbound and southbound) 5 th St. & 1 st Ave. (northbound and southbound) Implementing Opticom Detectors for these approaches should increase TSP performance. However, the city did not want to add additional hardware for the TPS demonstration. TSP Signal Modifications Although the Eagle EPAC300 traffic controllers do not have a specific TSP module/program, the controller handles a TSP call as a low priority call. Since TSP has not been used in the area before, the Advanced Traffic Analysis Center (ATAC) performed extensive traffic controller testing to determine the effects of implementing the system. The testing was performed using the exact signal timing parameters of two intersections: Broadway and 19 th Ave. N. and 25 th St. and 13 th Ave. S. Using a controller interface device developed by ATAC (ATACid), low priority calls were placed during different times within the cycle length during the AM peak-hour coordination timing plan. The results of the signal controller tests are shown in Appendix A. When TSP calls were placed during the green extension strategy, the previous signal phases would be skipped if the call was active too long (a constant call could hold the green indefinitely). Therefore, it was decided to use the max call parameter. A value of 10 seconds was selected based on a literature review and judgment by City of Fargo traffic engineering staff. When incorporating the max call time of 10 seconds, the preceding phase after the TSP call was only skipped if its phase split (green time, clearance interval, and change interval) was less than 20 seconds. An Eagle EPAC controller needs to have a phase split time of at least 10 seconds to serve that phase. Therefore, phase 3 is skipped for the intersection of 25 th St. and 13 th Ave., since only 9 seconds is available when the max call time is used. In addition, the early green extension TSP strategy may also create some problems, especially with leftturn phases by providing short green time for non-tsp phases. When a TSP call is received while its phase is displaying a red indication, the signal cycles through the preceding phases by only providing the phase minimum time (vehicle or pedestrian). Therefore, the left-turn phases of 25 th St. and 13 th Ave. S. would terminate after one or three seconds even when demand for the phase exists. Due to the adverse effects to the left-turn phases of the major signalized intersections, Route 15 was removed from the TSP demonstration since this route has several major intersections having left-turn phases. Based on the controller testing, data were entered for only two low priority parameters, which include max call and dwell phase. The low priority data used for the implementation included the following: Max Call = 10 seconds Dwell Phase(s) = 2 and 6 (main street approaches) Page 5

7 Figure 3. Preemption/priority detection equipment on Route 11 Page 6


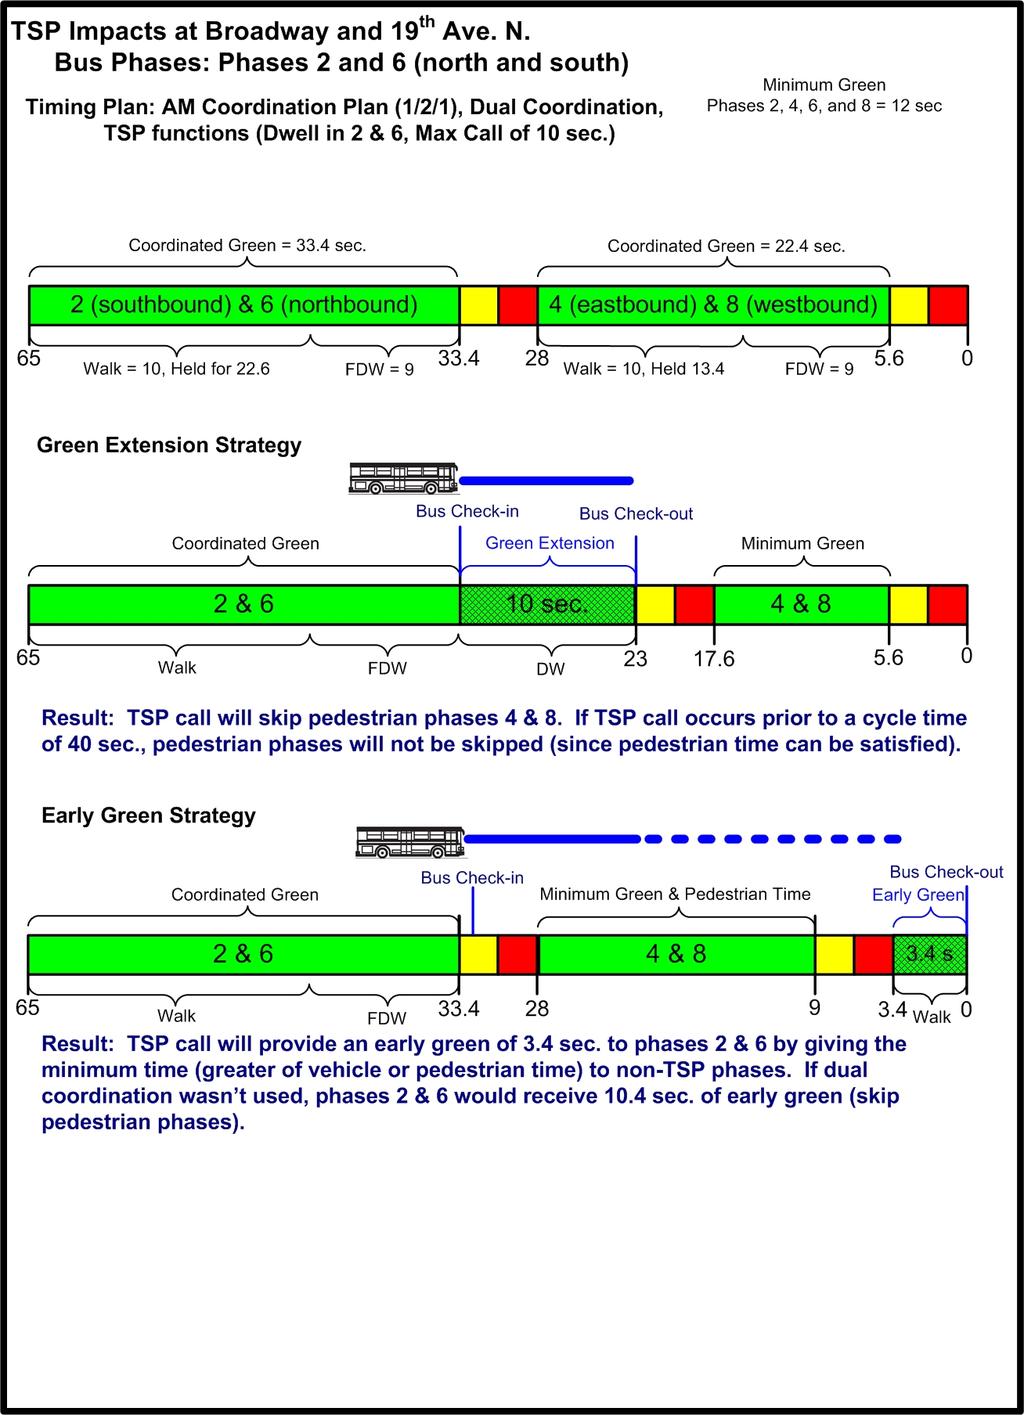
8 The max call parameter is critical to minimizing the impacts of the TSP call. If a non-zero value is not entered, the dwell phases could receive and maintain the green indication indefinitely. Although the threat of this occurrence is low, entering the appropriate max call time will ensure that the signal phases will not be skipped and coordination will be maintained. The dwell phase setting is used to establish which phase(s) receive the green time for the TSP call. When using the max call time of 10 seconds, the controller of Broadway and 19 th Ave. N. operated as expected by providing a green extension of up to 10 seconds and an early green of up to 3.4 seconds. An additional 6 seconds of early green could be realized if the controller didn t operate as dual coordinated, providing 10.4 seconds of early green. After the controller tests were completed, the TSP signal parameters were entered into the Eagle controller supervisor software (MARC NX) and downloaded to the required signal controllers from the traffic signal shop. Bus Modifications The buses that operate on Route 11 were installed with the required TSP hardware. Each day, two buses rotate among Routes 11, 12, and 17 (which has a 60-minute headway). These two buses and two additional buses had low priority emitters (Opticom Model 792T) mounted on the top of the bus and a switch (Opticom 793B Switch) mounted in the dash for activating the emitter (Figures 4 and 5). It should also be noted that the low priority emitter incorporated a visible light filter. Figure 4. Bus equipped with Opticom emitter Figure 5. Operator using the emitter switch TSP Range Setting Setting the range for detecting the TSP call was performed by traffic engineering staff. An emitter (Opticom Model 792T) was installed on a service vehicle along with the range setting switch (Opticom 793R Switch). Using a speed limit of 25 mph, a max call of 10 seconds, and assuming an equipment response time of 1 second, the range was calculated and set at 405 feet from the approach stop line. The range was set by stopping the TSP equipped service vehicle in the travel lane 405 upstream from the stop line (which was already measured and marked by lathe) and turning on the low priority emitter. While this was being performed, another signal technician was at the signal cabinet to verify the call was correctly received. Page 7
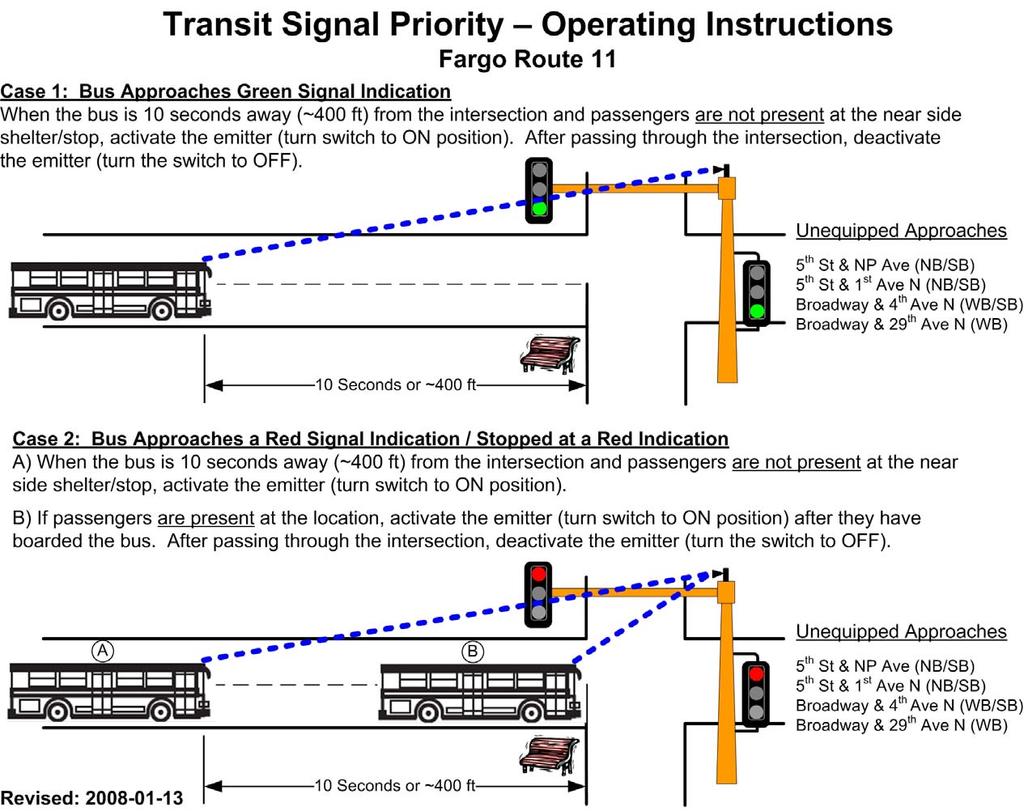
9 TSP Field Test After the appropriate hardware and parameters were installed/entered, a TSP equipped bus performed a test run. The test run incorporated staff from MAT, Fargo Traffic Engineering, and ATAC. The goal of the test run was to demonstrate how to properly use the TSP hardware and determine if any traffic signal issues would occur. The test went without incident; however, two unexpected issues were observed. First, the confirmation light at the TSP detector was illuminated when the emitter was turned on. This was not expected since TSP doesn t take control of the signal. The Eagle signal controller cannot disable the confirmation light directly, but the controller vender provided information on how to modify the signal cabinet to do so. Engineering staff decided not to modify the cabinet, which will assist the bus drivers in determining if the TSP call is received by the controller. The second issue observed during the test run related to the delay between turning on the emitter and seeing the confirmation light illuminate. A more significant equipment delay time was observed than was initially anticipated. During the laboratory testing, a delay time of approximately a half second was observed; however, the field test determined a delay of approximately four seconds. Therefore, approximately three and a half seconds of delay/response time occurs between the Opticom Detector receiving the emitter signal and the priority call being placed to the traffic signal. Based on field tests, approximately one and a half seconds were required to verify/discriminate the TSP call by the Opticom Phase Selector. The remaining response time (two seconds) relates to the Opticom Phase Selector activating its output to the traffic controller as a low priority call. It should be pointed out that the discrimination component occurs when the emitter signal is initially received, but it doesn t activate the TSP output until the appropriate range has been achieved. For example if the emitter is turned on at 405 feet upstream from the approach, the signal controller will activate the TSP call 4 seconds later, which would be approximately 260 feet from the stop line (if traveling at free-flow speed). This would equate to seven seconds of green extension for the bus. Bus Driver Training Since the TSP call is performed manually by bus drivers operating Route 11, training was required to ensure proper use of the system. If the system is not used properly, the bus travel time for the route can actually increase. This occurrence is explained when a TSP call is placed during the green indication at an intersection approach having a near-side bus stop and a passenger waiting to be served. The traffic signal will extend the green time unnecessarily while the bus stops to pick up the passenger and will display a red indication by the time the bus finally approaches the stop line. Since the TSP call can only be served once per cycle, a second TSP call for the bus will be disregarded and the opposing movement will be served. The opposing movement s green time may be longer since these vehicles had up to 10 seconds longer to queue. Bus drivers for Route 11 were given training by ATAC and MAT staff. Operating instructions were prepared by ATAC to illustrate how and when to place a TSP call and notes the signalized intersection approaches that are not equipped with TSP devices (Appendix B). ATAC staff presented the information to the drivers and discussed the capabilities and limitations of the system. MAT staff reinforced the operating instructions through both verbal and written methods. To assist drivers in determining the 405 ft distance to activate the emitter, traffic engineering staff placed cones adjacent to the travel lanes approaching a TSP equipped signal. TSP Evaluation The purpose of evaluating the TSP implementation is to quantify the impacts on both transit and traffic operations and document the lessons learned from this demonstration. This information will assist in determining the feasibility of future TSP implementations. Since traffic data were not collected during this study, it will only focus on the impact to the bus operation. It is assumed that TSP operation will negatively affect vehicular traffic for the opposing approaches. However, since this study occurred in a corridor with relatively low traffic volume, the side-street impact should not be significant. The tasks associated with the evaluation include the following: Page 8
10 Analyze bus travel time information provided by MAT (before and after TSP) Analyze traffic controller reports related to priority calls (frequency) Document the findings Bus Travel Time Originally, the bus travel time comparisons were going to use the information collected by MAT. One of roles of the dispatchers at the GTC is to report the bus arrival time as they enter the bus stanchion. The main reason for this observation was to track how often the buses arrived late and those that were late enough to miss its transfer. It should be noted that the arrival time reported is not an exact measurement. The dispatchers report the arrival time in minutes and are rounded down to the nearest minute unless the next minute is within five seconds. In addition, the actual bus departure time is not reported. To obtain a more accurate bus travel time, the departure time for the routes used the larger of the scheduled departure time or arrival time of the previous interlining bus if it arrived late. Due to some potential inaccuracies with the GTC arrival time information, ATAC staff obtained travel time information from a portable GPS device. Originally, the GPS data were going to be used for determining the potential improvements of TSP at the signalized intersections. However, it was also used to obtain bus travel time information. The antenna and recording unit were installed by MAT service technicians on a bus used for Route 11 (#1141). ATAC staff would go to the MAT garage in the evening to set up the travel time study and download the data, which were based on five-minute intervals. Due to several issues, which include GPS device technical problems, bus technical problems (electrical problems), and snow storms, usable bus travel time information was obtained from three days. The GPS unit was installed in a Route 15 bus and 5 days of data were collected. However, these data were not analyzed since the route was removed from the TSP deployment. GTC Travel Time Results Although the GTC arrival time is not as accurate as the GPS data, this information was compared due to the large sample sizes between strategies. The statistical tests for these data are to determine if the pre- TSP deployment travel times are statistically different than the TSP deployment travel times. The average travel time for the pre-tsp deployment (549 runs) and TSP deployment (587 runs) were 27:57 and 27:16, respectively. It was determined that the TSP deployment reduces travel time on Route 11. At a 95% confidence interval, travel time reductions using TSP will range from 21 seconds to 61 seconds (Table 2). Due to the lower fidelity in GTC travel time data, it was primarily used to determine that the TSP deployment provides travel time savings that are statistically significant. Table 2. Route 11 Travel Time Results Using GTC. Pre-TSP Deployment (December 2007) TSP Deployment (February 2008) Avg. Travel Time 27:57 27:16 Standard Deviation 3:05 2:40 # of Samples Difference in Means :41 Confidence Interval 95% Lower Bound :21 Upper Bound 1:01 Using Large Sample Confidence Interval for (µ 1 -µ 2 ): Independent Sample Note: Recorded GTC time does not include seconds. GPS Travel Time Results Compared to the GTC travel time, GPS travel time provides a much higher level of accuracy but at a much lower sample size. Based on the GPS data, TSP deployment produced significantly lower travel times. The average travel time for the pre-tsp deployment (23 runs) and the TSP deployment (43 runs) was 27:22 and 25:13, respectively (Table 3). The difference between the means was 2:09. At a 95% confidence interval, travel time reductions using the TSP ranged from 1:16 to 3:02. This range exceeds the goal of a one minute travel time reduction using TSP. Page 9
11 Table 3. Route 11 Travel Time Results Using GPS Pre-TSP Deployment (December 2007) TSP Deployment (February 2008) Avg. Travel Time 27:22 25:13 Standard Deviation 2:08 1:28 # of Samples Difference in Means 2:09 Confidence Interval 95% Lower Bound 1:16 Upper Bound 3:02 Using Small Sample Confidence Interval for (µ 1 -µ 2 ): Independent Sample TSP Usage Since the TSP system requires the bus driver to activate the Opticom emitter, the system s success is dependent on the proper emitter activation. A review of the traffic signal log files was performed on three occasions to get an idea of how often the emitter was used at the intersection of Broadway and 19 th Ave. N. Since this intersection incorporates far-side bus stops, the driver should activate the emitter every time they approach the intersection from the south (outbound) and north (inbound). Typically, the controller s event log (Local Status Report) can retain several days of data before it is overwritten. However, the controller event log for the Broadway and 19 th Ave. N. intersection contained unexplained gaps of as many as 10 days. Therefore, the last download only obtained a partial day of February 29 th. Typically, the northbound approach had the highest level of usage, ranging from 71% to 100% (Table 4). The southbound approach had level of usage ranging from 54% to 88%. Overall level of usage for the five days ranged from 63% to 90%. Variations in the levels of usage may be explained by a couple of reasons. First, bus drivers may use the emitter more northbound compared to southbound since it is a lot earlier in the route (approximately 1/3 of the route). If drivers feel they are ahead of schedule when they return to the intersection (inbound or southbound), they may not use the emitter. Second, variability in TSP usage may be a result of having several drivers assigned to the route. Continued driver reinforcement and training should assist in level of usage. It should be pointed out that the level of usage at the intersection of Broadway and 19 th Ave. N. does not necessarily mean that the emitter is activated appropriately at the remaining intersections along Route 11. While not related to this project, ATAC staff has witnessed the emitter switch left on while they rode a portion of Route 11. Since these occurrences were reported, a timer was implemented into the emitter switch. Power will be terminated to the emitter after 15 seconds after it is turned ON. To reactivate the emitter, power must be cycled OFF and then ON. Table 4. TSP (priority) Calls from Signal Controller Log. Max Actual Start End Date TSP Calls TSP Calls Time Time (NB) (NB) Level of Usage (NB) Max TSP Calls (SB) Actual TSP Calls (SB) Level of Usage (SB) Overall Level of Usage Feb. 4, % % 71% Feb. 5, % % 63% Feb. 16, % % 88% Feb. 18, % % 67% Feb. 29, % % 90% Page 10
12 LESSONS LEARNED As with any system implementation, several issues/problems arise throughout the process. The goal is to minimize and overcome these issues in a timely manner or change the course of action. The biggest issue that was identified during the TSP implementation related to how the traffic signal controller responded to the TSP call. Initially, the TSP was going to evaluate Routes 11 and 15. However, controller testing provided valuable insight related to the impacts of non-tsp phases at critical intersections along Route 15, which disqualified it from having TSP. Several other lessons were learned during this study, which are listed below: Traffic Signal Controllers (Eagle EPAC300) Operation with TSP call o Phases less than 10 seconds will be skipped if they follow a TSP phase o Phase (non-tsp) will only receive minimum green during the early green strategy Traffic Signals with Preemption but without TSP o Program Opticom Phase Selector to disregard TSP call (otherwise acts as high-priority call) (14 controllers in Fargo had to be adjusted to eliminate the preemption possibility) Equipment Response/Delay Time o 4 seconds (verify/discriminate call, phase selector output, and traffic controller output) TSP Hardware o Range setting distance should account for equipment response/delay time o Incorporate a timer to deactivate an emitter that was left ON. Agency Notification o Inform local police department about TSP (citizen concerns) o Inform police, fire departments, and ambulance services about TSP (staff concerns) RECOMMENDATIONS Although the TSP evaluation has shown to provide statistically significant benefits to Route 11, several factors will continue to play a role in maintaining the travel time reductions. Factors that MAT and Fargo s Traffic Engineering Department can control relate to equipment and bus drivers. TSP audits can determine if equipment and/or driver issues are evident. Recommended tasks for assisting in continued benefits from TSP include the following: Equipment Maintenance o Clean emitter lens daily o Clean detector annually o Replace emitter bulbs every three years Driver Training o Provide quarterly education to current bus drivers and adequate training for new drivers TPS Audits o Perform travel time measurements annually incorporate bus GPS o Download traffic signal log files annually determine driver level of usage This study illustrated that the TSP demonstration on Route 11 was successful in reducing bus travel time. According to the GPS data, travel time savings could be realized by 1:16 to 3:02 at a 95% confident interval. Additional benefits may be realized if Opticom detectors are installed at the previously identified intersections. Signal timing adjustments for the intersections of 5 th St. and NP Ave. and 5 th St. and 1 st Ave. N. may provide additional benefits to the Route 11 travel time. It should also be pointed out that higher gas prices have caused an increase in ridership. A continued increase in ridership may result in more frequent and longer stops, causing longer route travel times. Page 11
13 REFERENCES 1. Ova, Kiel and Smadi, Ayman. Evaluation of Transit Signal Priority Strategies for Small-Medium Cities, December Illinois Department of Transportation. Cermak Road Bus Preemption Study, Technical Memoranda. Civiltech Engineering, Inc. Itasca, IL & JRH Transportation Engineering, Eugene, OR, October, 1993b. 3. Innovative Transportation Concepts, Inc. Rainier Avenue S TSP Field Evaluation. Corvallis, OR, October 2000a. 4. Westwood Professional Services, Inc. St. Cloud Metropolitan Transit Commission, Transit Priority Evaluation Project, Eden Prairie, MN, November United States Department of Transportation. Transit Signal Priority (TSP): A Planning and Implementation Handbook, May 2005.
14 Appendix A: TSP Traffic Controller Tests 25 th St. and 13 th Ave. S and Broadway and 19 th Ave. N.
15
16
17 Appendix B: Operating Instructions for Transit Signal Priority
18
Transit Signal Preemption and Priority Treatments
 Transit Signal Preemption and Priority Treatments Peter Koonce, PE Portland, OR Today s Message Transit signal priority presents an opportunity to partner with an agency that isn t always recognized as
Operational Comparison of Transit Signal Priority Strategies
 Operational Comparison of Transit Signal Priority Strategies Revision Submitted on: November, 0 Author: Adriana Rodriguez, E.I Assistant Engineer Parsons Brinckerhoff 0 South Orange Avenue, Suite 00 Orlando,
Transit Signal Priority: Help or Hype? Peter G. Furth Northeastern University
 Transit Signal Priority: Help or Hype? Peter G. Furth Northeastern University Transit Signal Priority Help or Hype? Zurich: nearly zero traffic delay and impeccable punctuality for trams Portland, San
Module 3 Developing Timing Plans for Efficient Intersection Operations During Moderate Traffic Volume Conditions
 Module 3 Developing Timing Plans for Efficient Intersection Operations During Moderate Traffic Volume Conditions CONTENTS (MODULE 3) Introduction...1 Purpose...1 Goals and Learning Outcomes...1 Organization
Arterial Traffic Analysis Actuated Signal Control
 Arterial Traffic Analysis Actuated Signal Control Dr. Gang-Len Chang Professor and Director of Traffic Safety and Operations Lab. University of Maryland-College Park Actuated Signal Control Fully Actuated
Multimodal Approach to Planning & Implementation of Transit Signal Priority within Montgomery County Maryland
 Multimodal Approach to Planning & Implementation of Transit Signal Priority within Montgomery County Maryland A Path to Successful Implementation James Allday Bunch - Sabra, Wang & Associates, Inc. ITS
DESIGN CONSIDERATIONS FOR BUS PRIORITY ABSTRACT
 DESIGN CONSIDERATIONS FOR BUS PRIORITY J COETZEE and G WESSELS ITS Engineers (Pty) Ltd E-Mail: jan@itse.co.za ; gerrit@itse.co.za ABSTRACT Providing priority to buses at traffic signals is widely used
METHODOLOGY. Signalized Intersection Average Control Delay (sec/veh)
") Chapter 5 Traffic Analysis 5.1 SUMMARY US /West 6 th Street assumes a unique role in the Lawrence Douglas County transportation system. This principal arterial street currently conveys commuter traffic
Chapter 5 Traffic Analysis 5.1 SUMMARY US /West 6 th Street assumes a unique role in the Lawrence Douglas County transportation system. This principal arterial street currently conveys commuter traffic
Traffic Circulation Study for Neighborhood Southwest of Mockingbird Lane and Airline Road, Highland Park, Texas
 ARIZONA TEXAS NEW MEXICO OKLAHOMA February 13, 2015 Mr. Meran Dadgostar P.E., R.S. Town of Highland Park 4700 Drexel Dr. Highland Park, Texas 75205 Re: Traffic Circulation Study for Neighborhood Southwest
Traffic Study North Shore School District 112
 Traffic Study North Shore School District 112 Proposed Expansion of Northwood Junior High School Prepared By: May 1, 2015 1. Introduction Kenig, Lindgren, O Hara, Aboona, Inc. (KLOA, Inc.) has been retained
University of California, Davis Transit Signal Priority Implementation Study
 Proposal University of California, Davis Transit Signal Priority Implementation Study Prepared for: Prepared by: University of California, Davis 2990 Lava Ridge Court Suite 200 Roseville, CA 95661 November
3 TRAFFIC CONTROL SIGNAL TIMING AND SYNCHRONIZATION
 Report No. 8 of the Transportation Services Committee Regional Council Meeting of October 20, 2011 3 TRAFFIC CONTROL SIGNAL TIMING AND SYNCHRONIZATION The Transportation Services Committee recommends:
ENHANCED PARKWAY STUDY: PHASE 2 CONTINUOUS FLOW INTERSECTIONS. Final Report
 Preparedby: ENHANCED PARKWAY STUDY: PHASE 2 CONTINUOUS FLOW INTERSECTIONS Final Report Prepared for Maricopa County Department of Transportation Prepared by TABLE OF CONTENTS Page EXECUTIVE SUMMARY ES-1
MoPac South: Impact on Cesar Chavez Street and the Downtown Network
 MoPac South: Impact on Cesar Chavez Street and the Downtown Network Prepared by: The University of Texas at Austin Center for Transportation Research Prepared for: Central Texas Regional Mobility Authority
Traffic Engineering for Transit Operations
 Traffic Engineering for Transit Operations Improving Speed & Reliability Owen Kehoe, PE, PTOE King County Metro Transit Systems & Traffic Engineering Group OVERVIEW Speed & Reliability Tools Transit Signal
Traffic Signal Optimization Project (Hosman Road) (Future Coordinated Corridor)
 (Future Coordinated Corridor)") Onondaga County Department of Transportation Traffic Signal Optimization Project (Hosman Road) (Future Coordinated Corridor) Prepared for: Syracuse Metropolitan Transportation Council 126 North Salina
Onondaga County Department of Transportation Traffic Signal Optimization Project (Hosman Road) (Future Coordinated Corridor) Prepared for: Syracuse Metropolitan Transportation Council 126 North Salina
Lincoln Avenue Road Diet Trial
 Lincoln Avenue Road Diet Trial Data Collection Report June 1, 2015 Department of Transportation Table of Contents I. Introduction...... 3 II. Data Collection Methodology & Results...... 5 A. Traffic Volume
Self-Organizing Signals: A Better Framework for Transit Signal Priority
 Portland State University PDXScholar TREC Friday Seminar Series Transportation Research and Education Center (TREC) 3-13-2015 Self-Organizing Signals: A Better Framework for Transit Signal Priority Peter
Introduction to Traffic Signal Timing
 Introduction to Traffic Signal Timing Course No: C-7 Credit: PDH Jeffrey W. Buckholz, Ph.D., P.E., PTOE Continuing Education and Development, Inc. 9 Greyridge Farm Court Stony Point, NY 98 P: (877) -58
TRAFFIC IMPACT ANALYSIS
 TRAFFIC IMPACT ANALYSIS FOR THE CHAMPAIGN UNIT#4 SCHOOL DISTRICT PROPOSED HIGH SCHOOL (SPALDING PARK SITE) IN THE CITY OF CHAMPAIGN Final Report Champaign Urbana Urbanized Area Transportation Study 6/24/2014
IMPACT OF TRANSIT SIGNAL PRIORITY (TSP) ON BUS TRAVEL TIMES, LATE BUS RECOVERY, DELAY AND LEVEL OF SERVICE (LOS)
 ON BUS TRAVEL TIMES, LATE BUS RECOVERY, DELAY AND LEVEL OF SERVICE (LOS)") IMPACT OF TRANSIT SIGNAL PRIORITY (TSP) ON BUS TRAVEL TIMES, LATE BUS RECOVERY, DELAY AND LEVEL OF SERVICE (LOS) Presenter: Sotonye Ikiriko 1, Deo Chimba 1 College of Engineering, Tennessee State University,
IMPACT OF TRANSIT SIGNAL PRIORITY (TSP) ON BUS TRAVEL TIMES, LATE BUS RECOVERY, DELAY AND LEVEL OF SERVICE (LOS) Presenter: Sotonye Ikiriko 1, Deo Chimba 1 College of Engineering, Tennessee State University,
Abstract. Background. protected/permissive operation. Source: Google Streetview, Fairview/Orchard intersection
 ITE 2015 Western District Annual Meeting Ada County Highway District s Flashing Yellow Arrow Initiative Primary Author: Tim Curns, PE Ada County Highway District Traffic Engineer Author: Andrew Cibor,
MEMORANDUM. TO: Transportation Planning and Programming Committee December 4, 2008 of the Boston Region Metropolitan Planning Organization
 MEMORANDUM TO: Transportation Planning and Programming Committee December 4, 2008 of the Boston Region Metropolitan Planning Organization FROM: Mark S. Abbott, PE Efi Pagitsas RE: MBTA Transit Signal Priority
State Street Transit Signal Priority Study
 State Street Transit Signal Priority Study April 2015 The Delaware Valley Regional Planning Commission is dedicated to uniting the region s elected officials, planning professionals, and the public with
5858 N COLLEGE, LLC N College Avenue Traffic Impact Study
 5858 N COLLEGE, LLC nue Traffic Impact Study August 22, 2016 Contents Traffic Impact Study Page Preparer Qualifications... 1 Introduction... 2 Existing Roadway Conditions... 5 Existing Traffic Conditions...
Evaluation of Transit Signal Priority Strategies for Bus Rapid Transit on 5600 West Street in Salt Lake County, Utah
 Evaluation of Transit Signal Priority Strategies for Bus Rapid Transit on 5600 West Street in Salt Lake County, Utah Dr. Peter T. Martin Professor Milan Zlatkovic Research Assistant University of Utah
Figure 1: Vicinity Map of the Study Area
 ARIZONA TEXAS NEW MEXICO OKLAHOMA May 5, 2016 Mr. Anthony Beach, P.E. BSP Engineers 4800 Lakewood Drive, Suite 4 Waco, Texas 76710 Re: Intersection and Access Analysis along Business 190 in Copperas Cove
Arterial Traffic Analysis Some critical concepts. Prepared by Philip J. Tarnoff
 Arterial Traffic Analysis Some critical concepts Prepared by Philip J. Tarnoff Agenda Fundamentals Signal timing concepts Actuated signal controllers Developing timing plans Types of signal control First
TECHNIQUES TO IMPROVE SAFETY AND OPERATIONS AT SIGNALIZED DIAMOND INTERCHANGES IN NEVADA
 TECHNIQUES TO IMPROVE SAFETY AND OPERATIONS AT SIGNALIZED DIAMOND INTERCHANGES IN NEVADA FINAL REPORT Prepared for Nevada Department of Transportation Authors Zong Z. Tian, PhD, PE Ahmed Abdel Dayem Department
TABLE OF CONTENTS 1. INTRODUCTION 2. TRAFFIC ENGINEERING FUNDAMENTALS 9. SYSTEM CONTROL 3. DATA COLLECTION 4. SIGNAL PHASING 10. SPECIAL OPERATIONS
 TABLE OF CONTENTS 1. INTRODUCTION 2. TRAFFIC ENGINEERING FUNDAMENTALS A. Volume, Demand, and Capacity 2-1 B. Performance Measures 2-7 C. Critical Lane Volume Analysis 2-9 3. DATA COLLECTION 4. SIGNAL PHASING
Queue Jump Lane, Transit Signal Priority, and Stop Location: Evaluation of Transit Preferential Treatments using Microsimulation
 Queue Jump Lane, Transit Signal Priority, and Stop Location: Evaluation of Transit Preferential Treatments using Microsimulation Burak Cesme (corresponding author) AECOM 1 Wilson
HENDERSON DEVELOPMENT 213, 217, 221, 221 ½, 223 HENDERSON AVENUE and 65 TEMPLETON STREET OTTAWA, ONTARIO TRANSPORTATION OVERVIEW.
 HENDERSON DEVELOPMENT 213, 217, 221, 221 ½, 223 HENDERSON AVENUE and 65 TEMPLETON STREET OTTAWA, ONTARIO TRANSPORTATION OVERVIEW Prepared for: 2294170 Ontario Inc. February 2, 2017 117-652 Report_1.doc
Appendix B: Forecasting and Traffic Operations Analysis Framework Document
 Existing Conditions Report - Appendix Appendix B: Forecasting and Traffic Operations Analysis Framework Document This document defines the methodology and assumptions that will be used in the traffic forecasting
RESPONSIVE ROUNDABOUTS MYTH OR REALITY
 RESPONSIVE ROUNDABOUTS MYTH OR REALITY Andy Poole WSP UK Three White Rose Office Park Millshaw Park Lane Leeds LS11 0DL andy.poole@wspgroup.com Keywords: Traffic signals, optimisation, micro-simulation,
Low Level Road Improvements Traffic Analysis. Report
 Low Level Road Improvements Traffic Analysis Report June, 22 Table of Contents. INTRODUCTION.... LOW LEVEL ROAD PROJECT....2 STUDY AREA....2. West-End Corridor Improvements... 2.2.2 East-End Corridor Improvements...
Appendix C. NORTH METRO STATION AREA TRAFFIC IMPACT STATEMENT 88th Avenue Station
 Appendix C NORTH METRO STATION AREA TRAFFIC IMPACT STATEMENT 88th Avenue Station Prepared for: Regional Transportation Department and URS Corporation as part of the North Metro EIS David Evans and Associates,
Gratiot Avenue Transit Study Tech Memo #4: Ridership
 Gratiot Avenue Transit Study Tech Memo #4: Ridership 5/31/2016 Table of Contents 1 INTRODUCTION... 3 PROJECT DESCRIPTION... 3 2 TECH MEMO #4 OVERVIEW... 5 METHODOLOGY... 5 3 THE ALTERNATIVES AND POTENTIAL
Transit Signal Priority (TSP) Application to Miami-Dade Transit
 Application to Miami-Dade Transit") Transit Signal Priority (TSP) Application to Miami-Dade Transit Amar Sarvepalli Parsons Brinckerhoff Southeast Florida FSUTMS Users Group August 15, 2008 Overview PART A WHAT IS TSP INTRODUCTION PURPOSE
Transit Signal Priority (TSP) Application to Miami-Dade Transit Amar Sarvepalli Parsons Brinckerhoff Southeast Florida FSUTMS Users Group August 15, 2008 Overview PART A WHAT IS TSP INTRODUCTION PURPOSE
Chapter Capacity and LOS Analysis of a Signalized I/S Overview Methodology Scope Limitation
 Chapter 37 Capacity and LOS Analysis of a Signalized I/S 37.1 Overview The Highway Capacity Manual defines the capacity as the maximum howdy rate at which persons or vehicle can be reasonably expected
MEMORANDUM. Charlotte Fleetwood, Transportation Planner
 MEMORANDUM Date: Updated August 22, 2017 To: Organization: Charlotte Fleetwood, Transportation Planner Boston Transportation Department From: Jason DeGray, P.E., PTOE, Regional Director of Engineering
A REAL-TIME SIGNAL CONTROL STRATEGY FOR MITIGATING THE IMPACT OF BUS STOPS ON URBAN ARTERIALS
 A REAL-TIME SIGNAL CONTROL STRATEGY FOR MITIGATING THE IMPACT OF BUS STOPS ON URBAN ARTERIALS Celeste Chavis 1, and Eleni Christofa 2 1 Department of Transportation and Urban Infrastructure Studies, Morgan
ITS-NY ANNUAL MEETING Bus Rapid Transit in New York City: Bus Lane Operations on One-Way Arterial Streets
 ITS-NY ANNUAL MEETING Bus Rapid Transit in New York City: Bus Lane Operations on One-Way Arterial Streets June 9, 2011 Ted Orosz AICP, Director Long Range Bus Planning MTA New York City Transit 1 Overview
Harrah s Station Square Casino
 Transportation Analysis Harrah s Station Square Casino Pittsburgh, Pennsylvania Submitted To: City of Pittsburgh and Pennsylvania Gaming Control Board Prepared By: DKS Associates GAI Consultants December
Intersection of Massachusetts Avenue and Maple Street in Lexington Signalized Intersection and Roundabout Comparison
 Intersection of Massachusetts Avenue and Maple Street in Lexington Signalized Intersection and Roundabout Comparison Michael Wallwork, Roundabout Expert, Orange Park, Florida Tom Bertulis (MS, PE, PTOE),
Traffic Signal Design
 Traffic Signal Design Instructor: S. M. Mahdi Amiripour m.amiripour@gmail.com 2 Introduction Intersection is an area shared by two or more roads Designated for the vehicles to turn to different directions
ROADS, RAILS, AND RUNNING SHOES: DEVELOPING MULTI-MODAL SIGNAL TIMING FOR A NEW LIGHT RAIL CORRIDOR IN AURORA, COLORADO
 Presentation for the ITE Western District Annual Meeting, July 2016, Albuquerque, NM ROADS, RAILS, AND RUNNING SHOES: DEVELOPING MULTI-MODAL SIGNAL TIMING FOR A NEW LIGHT RAIL CORRIDOR IN AURORA, COLORADO
HIGHBURY AVENUE/HAMILTON ROAD INTERSECTION IMPROVEMENTS PUBLIC INFORMATION CENTRE 1 MAY 14, 2015
 HIGHBURY AVENUE/HAMILTON ROAD INTERSECTION IMPROVEMENTS Municipal Class Environmental Assessment PUBLIC INFORMATION CENTRE 1 MAY 14, 2015 ACCESSIBILITY Under the Accessibility Standards 2015 for Customer
Purpose and Need. Chapter Introduction. 2.2 Project Purpose and Need Project Purpose Project Need
 Chapter 2 Purpose and Need 2.1 Introduction The El Camino Real Bus Rapid Transit (BRT) Project (Project) would make transit and other transportation improvements along a 17.6-mile segment of the El Camino
Chapter 4 Traffic Analysis
 Chapter 4 Traffic Analysis PURPOSE The traffic analysis component of the K-68 Corridor Management Plan incorporates information on the existing transportation network, such as traffic volumes and intersection
Comparison of Turning Movement Count Data Collection Methods for a Signal Optimization Study. White Paper
 Comparison of Turning Movement Count Data Collection Methods for a Signal Optimization Study White Paper Grand Rapids Southfield Traverse City www.urscorp.com May 2011 Comparison of Turning Movement Count
Simulation Analysis of Intersection Treatments for Cycle Tracks
 Abstract Simulation Analysis of Intersection Treatments for Cycle Tracks The increased use of cycle tracks also known as protected bike lanes has led to investigations of how to accommodate them at intersections.
1. Provide a dedicated westbound approach bus lane at the intersection;
 3. MODIFICATIONS AT HIGHWAY 417 WESTBOUND OFF-RAMP/PINCREST ROAD - PUBLIC HEARING COMMITTEE RECOMMENDATIONS Having held a public hearing, that Council approve the preliminary design for the proposed modifications
Transit Priority. Peter G Furth
 Transit Priority Peter G Furth Fourth in a series of Policy Briefings to Boston City Council s Committee on Parks, Recreation, & Transportation Feb 2, 2017 What Does Transit Priority Look Like? Zurich
Operation Green Light Traffic Signal Coordination Report North Oak Trafficway - New Mark Drive to NE 42nd Street
 Introduction Operation Green Light Traffic Signal Coordination Report North Oak Trafficway - New Mark Drive to NE 42nd Street Operation Green Light (OGL) is a regional effort to improve traffic flow and
Richmond-Adelaide Cycle Tracks
 Public Drop-In Event Richmond-Adelaide Cycle Tracks June 25, 2018 12:00 p.m. 3:00 p.m. 4:30 p.m. 7:30 p.m. Metro Hall, Rotunda 55 John Street 1 Purpose of Event In Scope Communicate an update about the
TRAFFIC MANAGEMENT PLAN
 April 19, 018 PK# 415-17.387 TRAFFIC MANAGEMENT PLAN Project: In Dallas, Texas Prepared for: City of Dallas On behalf of: Dallas Independent School District Prepared by: Hunter W. Lemley, P.E. 7557 Rambler
Simulating Street-Running LRT Terminus Station Options in Dense Urban Environments Shaumik Pal, Rajat Parashar and Michael Meyer
 Simulating Street-Running LRT Terminus Station Options in Dense Urban Environments Shaumik Pal, Rajat Parashar and Michael Meyer Abstract The Exposition Corridor transit project is a light rail project
MUTCD Part 6G: Type of Temporary Traffic Control Zone Activities
 MUTCD Part 6G: Type of Temporary Traffic Control Zone Activities 6G.01 Typical Applications Each temporary traffic control (TTC) zone is different. Many variables, such as location of work, highway type,
Dear Mr. Tweed: Sincerely, Min Zhou, P.E. Vice President
 December 17, 2012 Mr. Steve Tweed City of Long Beach, Department of Public Works Traffic & Transportation Bureau, 10 th Floor City Hall 333 West Ocean Boulevard Long Beach, CA 90802 Subject: Broadway and
5. RUNNINGWAY GUIDELINES
 5. RUNNINGWAY GUIDELINES These guidelines should be considered collectively when making runningway decisions. A runningway is the linear component of the transit system that forms the right-of-way reserved
North Shore Transportation Improvement Strategy
 North Shore Transportation Improvement Strategy Preliminary, Near-term Recommendation 2016 April Transportation Improvement Strategy (TIS) Comprehensive and Analytical A multi-modal transportation strategy
Bellevue Downtown Association Downtown Bike Series
 Bellevue Downtown Association Downtown Bike Series Meeting 2 Franz Loewenherz Andreas Piller Kyle Potuzak Chris Long October 26, 2017 Today s Agenda: 1) Meeting Purpose 2) 9/28 Meeting Recap 3) Candidate
M14A/D Select Bus Service
 M14A/D Select Bus Service Manhattan Community Board 6: April 1, 2019 New York City Transit 2 Background M14 Select Bus Service M14 was identified as a critical future SBS corridor in past BRT studies as
OTTAWA TRAIN YARDS PHASE 3 DEVELOPMENT CITY OF OTTAWA TRANSPORTATION IMPACT STUDY. Prepared for:
 OTTAWA TRAIN YARDS PHASE 3 DEVELOPMENT CITY OF OTTAWA TRANSPORTATION IMPACT STUDY Prepared for: The Ottawa Train Yards Inc. 223 Colonnade Road South, Suite 212 Nepean, Ontario K2E 7K3 January 17, 2012
Detection Range Setting Methodology for Signal Priority
 Detection Range Setting Methodology for Signal Priority Peter Koonce and John Ringert, Kittelson and Associates Tom Urbanik, University of Tennessee Willie Rotich and Bill Kloos, City of Portland Abstract
Mission Bay Loop (MBL) Public Meeting
 Public Meeting") Mission Bay Loop (MBL) Public Meeting La Scuola Internazionale di San Francisco, November 18, 2014 Frequently Asked Questions 1. When would construction have to start before the SFMTA loses TIGER funds?
Mission Bay Loop (MBL) Public Meeting La Scuola Internazionale di San Francisco, November 18, 2014 Frequently Asked Questions 1. When would construction have to start before the SFMTA loses TIGER funds?
MILTON ROAD ~ MITCHAM'S CORNER PARAMICS MODEL INITIAL OPTION TESTING
 MILTON ROAD ~ MITCHAM'S CORNER PARAMICS MODEL INITIAL OPTION TESTING NOVEMBER 216 MILTON ROAD ~ MITCHAM'S CORNER PARAMICS MODEL INITIAL OPTION TESTING Cambridgeshire County Council Type of document (version)
City of Wayzata Comprehensive Plan 2030 Transportation Chapter: Appendix A
 A1. Functional Classification Table A-1 illustrates the Metropolitan Council s detailed criteria established for the functional classification of roadways within the Twin Cities Metropolitan Area. Table
Complete Street Analysis of a Road Diet: Orange Grove Boulevard, Pasadena, CA
 Complete Street Analysis of a Road Diet: Orange Grove Boulevard, Pasadena, CA Aaron Elias, Bill Cisco Abstract As part of evaluating the feasibility of a road diet on Orange Grove Boulevard in Pasadena,
Analysis of the Impacts of Transit Signal Priority on Bus Bunching and Performance
 Analysis of the Impacts of Transit Signal Priority on Bus Bunching and Performance Eric Albright Graduate Research Assistant Portland State University eea@pdx.edu Miguel Figliozzi* Associate Professor
4 DISRUPTION MANAGEMENT PLAN HIGHWAY 7 RAPIDWAY CONSTRUCTION BETWEEN BAYVIEW AVENUE AND WARDEN AVENUE TOWNS OF MARKHAM AND RICHMOND HILL
 4 DISRUPTION MANAGEMENT PLAN HIGHWAY 7 RAPIDWAY CONSTRUCTION BETWEEN BAYVIEW AVENUE AND WARDEN AVENUE TOWNS OF MARKHAM AND RICHMOND HILL The Transportation Services Committee recommends the adoption of
2. NORTEL CARLING CAMPUS EXPANSION - PROPOSED MODIFICATIONS TO MOODIE DRIVE (REGIONAL ROAD 59) AND HIGHWAY 417 INTERCHANGE
 AND HIGHWAY 417 INTERCHANGE") 2. NORTEL CARLING CAMPUS EXPANSION - PROPOSED MODIFICATIONS TO MOODIE DRIVE (REGIONAL ROAD 59) AND HIGHWAY 417 INTERCHANGE COMMITTEE RECOMMENDATIONS AS AMENDED That Council approve: 1. The endorsement
2. NORTEL CARLING CAMPUS EXPANSION - PROPOSED MODIFICATIONS TO MOODIE DRIVE (REGIONAL ROAD 59) AND HIGHWAY 417 INTERCHANGE COMMITTEE RECOMMENDATIONS AS AMENDED That Council approve: 1. The endorsement
DUNBOW ROAD FUNCTIONAL PLANNING
 DUNBOW ROAD FUNCTIONAL PLANNING Final Report August 3, 216 #31, 316 5th Avenue NE Calgary, AB T2A 6K4 Phone: 43.273.91 Fax: 43.273.344 wattconsultinggroup.com Dunbow Road Functional Planning Final Report
Contents. Champaign-Urbana Mass Transit District Stop Placement Guidelines
 Contents Champaign-Urbana Mass Transit District Introduction... 1 Stop Spacing... 2 Rural... 2 Low Density Suburban... 2 General Urban... 2 Urban Core... 2 Operational Safety... 3 Stop Placement... 4 Nearside
DOWNTOWN TUPELO MAIN STREET: ROAD DIET STUDY
 DOWNTOWN TUPELO MAIN STREET: ROAD DIET STUDY Since mid-2009, RPM Transportation Consultants (RPM) has worked with the Downtown Tupelo Main Street Association to evaluate traffic conditions and potential
Public Works Committee Meeting Richard E. Mastrangelo Council Chamber November 20, 2017
 Public Works Committee Meeting Richard E. Mastrangelo Council Chamber November 20, 2017 Purpose of Meeting Why are we here? Project Recap/Updates Project Limits/Segments Road Diet Concept Lessons Learned
A Comprehensive HCM 2010 Urban Streets Analysis Using HCS 2010 US 31W in Elizabethtown, KY
 A Comprehensive HCM 2010 Urban Streets Analysis Using HCS 2010 US 31W in Elizabethtown, KY Ashley McLain, PE, PTOE Abstract The HCS 2010 Streets module was used to analyze a segment of the US 31W corridor
APPENDIX E Evaluation of Improvement Alternatives
 APPENDIX E Evaluation of Improvement Alternatives Table E-1 Preliminary Comparison of Design Alternatives, Concord Table E-2 Preliminary Comparison of Route 2 Improvement Packages, Acton and Concord TABLE
Mathematics of Planet Earth Managing Traffic Flow On Urban Road Networks
 Mathematics of Planet Earth Managing Traffic Flow On Urban Road Networks Adrian George Manager Network Improvements Anthony Fitts Manager Signal Design Melbourne s transport demands are growing 5m people
City of Moorhead Committee of the Whole Meeting
 City of Moorhead Committee of the Whole Meeting Corridor Study Limits Center Avenue (Red River to 8th Street) TH 10 (Red River to TH 336) TH 75 (20th Ave S to Main Avenue) 2 Study Need: Project Overview
ADVANCED TRANSIT OPERATIONS AND MODELING
 SOUTHERN DISTRICT OF INSTITUTE OF TRANSPORTATION ENGINEERS (SDITE) 2017 ADVANCED TRANSIT OPERATIONS AND MODELING SURESH KARRE, PE, PTOE ROBERT DUBNICKA, PE, TE, PTOE AGENDA Background Transit operations
ALLEY 24 TRAFFIC STUDY
 ALLEY 24 TRAFFIC STUDY in City of Frostburg, Maryland January 2013 3566 Teays Valley Road Hurricane, WV Office: (304) 397-5508 www.denniscorporation.com Alley 24 Traffic Study January 2013 Frostburg, Maryland
Waterford Lakes Small Area Study
 Waterford Lakes Small Area Study Existing Traffic Conditions PREPARED FOR: ORANGE COUNTY PUBLIC WORKS DEPARTMENT TRAFFIC ENGINEERING DIVISION ORLANDO, FLORIDA PREPARED WITH: INWOOD CONSULTING ENGINEERS
102 Avenue Corridor Review
 February 26, 2015 102 Avenue Corridor Review Transportation Association of Canada Road Safety Engineering Award Submission for the City of Edmonton Introduction Transportation Association of Canada Road
Glenn Avenue Corridor Traffic Operational Evaluation
 Glenn Avenue Corridor Traffic Operational Evaluation PREPARED FOR: THE CITY OF AUBURN PREPARED BY: DECEMBER 2007 Glenn Avenue Corridor Study--Auburn, Alabama TABLE OF CONTENTS Introduction... 1 Background
Evaluation and Changes to Pedestrian Priority Phase Signal (Scramble Crossing) at Bay Street and Bloor Street
 at Bay Street and Bloor Street") PW2.2 STAFF REPORT ACTION REQUIRED Evaluation and Changes to Pedestrian Priority Phase Signal (Scramble Crossing) at Bay Street and Bloor Street Date: February 12, 2015 To: From: Public Works and Infrastructure
PW2.2 STAFF REPORT ACTION REQUIRED Evaluation and Changes to Pedestrian Priority Phase Signal (Scramble Crossing) at Bay Street and Bloor Street Date: February 12, 2015 To: From: Public Works and Infrastructure
KING STREET TRANSIT PILOT
 STREET TRANSIT PILOT Update toronto.ca/kingstreetpilot #kingstreetpilot HIGHLIGHTS PREVIOUS HIGHLIGHTS TRANSIT RELIABILITY TRANSIT TRAVEL TIMES 85% of streetcars arriving within 4 minutes westbound during
Service Development 1600 Franklin Street, Oakland CA 94612
 Service Development 1600 Franklin Street, Oakland CA 94612 January 11, 2018 Jeff Bond Community Development Director 1000 San Pablo Avenue Albany, CA 94706 Dear Mr. Bond, AC Transit is requesting that
Bay to Bay Boulevard Complete Streets Project
 Bay to Bay Boulevard Complete Streets Project Dale Mabry Highway to Bayshore Boulevard February 08, 2018 Photo Source: Tampa Bay Times Alessandra Da Pra Meeting Format Introduction Resurfacing Information
Indiana Traffic Signal Hi Resolution Data Logger Enumerations
 Purdue University Purdue e-pubs JTRP Data Papers 11-2012 Indiana Traffic Signal Hi Resolution Data Logger Enumerations James R. Sturdevant INDOT, jsturdevant@indot.in.gov Timothy Overman INDOT Eric Raamot
The Traffic Monitoring Guide: Counting Bicyclists and Pedestrians. APBP 2017 June 28: 11:15am-12:45pm
 The Traffic Monitoring Guide: Counting Bicyclists and Pedestrians APBP 2017 June 28: 11:15am-12:45pm 2 Presentation Organization Why count bicyclists and pedestrians? Why report count data? What resources
Donahue Drive Corridor Traffic Operational Evaluation
 Donahue Drive Corridor Traffic Operational Evaluation PREPARED FOR: THE CITY OF AUBURN PREPARED BY: JANUARY 2007 Donahue Drive Corridor Study--Auburn, Alabama TABLE OF CONTENTS Introduction... 1 Background
Southwest Bus Rapid Transit (SW BRT) Functional Planning Study - Executive Summary January 19 LPT ATTACHMENT 2.
 Functional Planning Study - Executive Summary January 19 LPT ATTACHMENT 2.") Southwest Bus Rapid Transit (SW BRT) Functional Planning Study - Executive Summary 2011 January 19 1 of 19 Introduction This executive summary presents the results of the Southwest Bus Rapid Transit (SW
Southwest Bus Rapid Transit (SW BRT) Functional Planning Study - Executive Summary 2011 January 19 1 of 19 Introduction This executive summary presents the results of the Southwest Bus Rapid Transit (SW
Title Option One. Why Travel Time Reliability Isn t Just for Drivers. Getting there on Time: Ian Barnes, PE
 Getting there on Time: Why Travel Time Reliability Isn t Just for Drivers Title Option One Ian Barnes, PE 2017 ITE Western District Annual Meeting June 19, 2017 Traditional travel time reliability Source:
Mission-Geneva Transportation Study Community Workshop 2 July 8, 2006
 Community Workshop 2 July 8, 2006 Small Group Workbook 1 Basic Improvements on Mission Street Streetscape. Pedestrian-scale lighting; landscaping; community art on utility boxes; more (possibly unique)
SIDRA INTERSECTION 6.1 UPDATE HISTORY
 Akcelik & Associates Pty Ltd PO Box 1075G, Greythorn, Vic 3104 AUSTRALIA ABN 79 088 889 687 For all technical support, sales support and general enquiries: support.sidrasolutions.com SIDRA INTERSECTION
TRAFFIC MANAGEMENT PLAN
 May 4, 018 PK# 415-17.387 Z 178-150 TRAFFIC MANAGEMENT PLAN Project: In Dallas, Texas Prepared for: City of Dallas On behalf of: Dallas Independent School District Prepared by: Hunter W. Lemley, P.E. 7557
Active Transportation Facility Glossary
 Active Transportation Facility Glossary This document defines different active transportation facilities and suggests appropriate corridor types. Click on a facility type to jump to its definition. Bike
Transit Signal Priority Systems Application and Technology Investigation. Christopher G. Hedden Cambridge Systematics, Inc.
 NJ-2009-001 Transit Signal Priority Systems Application and Technology Investigation FINAL REPORT March 2009 Submitted by Christopher G. Hedden Cambridge Systematics, Inc. NJDOT Research Project Manager
133 rd Street and 132 nd /Hemlock Street 132 nd Street and Foster Street MINI ROUNDABOUTS. Overland Park, Kansas
 133 rd Street and 132 nd /Hemlock Street 132 nd Street and Foster Street MINI ROUNDABOUTS Overland Park, Kansas September 1, 2017 TABLE OF CONTENTS 1. INTRODUCTION... 1 2. LITERATURE REVIEW... 1 3. CONCEPT