INTEGRATING HEALTH INTO SCENARIO PLANNING
|
|
|
- Theresa Lee
- 6 years ago
- Views:
Transcription


1 INTEGRATING HEALTH INTO SCENARIO PLANNING Dr. Lawrence Frank, President UD4H, Inc. Seattle, Washington Professor in Population and Public Health and Urban Planning University of British Columbia
2
3 Outline Need for evidence based tools to evaluate health impacts of land development and transportation investments HIA s to date are largely qualitative Leveraging large scale data collection efforts funded by NIH and other entities over past decade Scenario planning provides an opportunity to incorporate health impacts Varying scales of analysis Two UD4H approaches to health modeling in California CommunityViz California and Toronto Vision California (Urban Footprint)
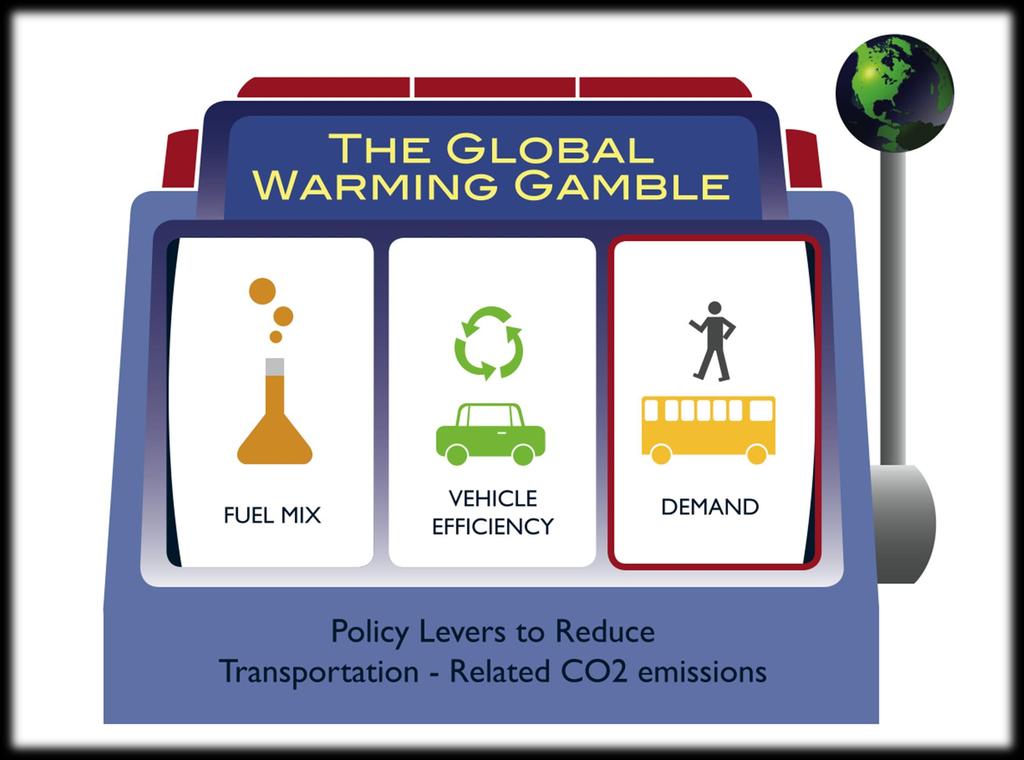
4 Scenario planning overview Scenario planning is a tool for analyzing and comparing the impacts of various land use and transportation alternatives Typical impacts considered include financial costs, transportation accessibility, housing availability, etc. Results are used to inform decisionmaking about infrastructure investments, master planning, development proposals, etc.
5 Integrating health Growing body of evidence documenting built environment influences on active and sedentary time from travel, recreational behavior, and diet Health-related outcomes and costs need to be considered when making transportation & land use decisions Integrating health metrics into scenario planning results in a quantitative Health Impact Assessment tool
6 CONCEPTUAL MODEL Land Use Patterns Built Environment Travel Choice Physical Activity & Dietary Patterns Body Mass Index Path I - Behavioral Chronic Disease Onset Health Care Utilization Patterns & Transportation Investments Travel Patterns Vehicle Emissions Respiratory Function Health Care Costs Path II - Exposure Note: Diet and nutrition, age, gender, income, genetics, and other factors also impact weight and chronic disease and to the extent possible are controlled in analyses. Vehicle age and climate impacts emissions and air quality, and respiratory function is also impacted by a variety of factors Dr. Lawrence Frank
 study in Puget Sound region, WA Neighborhood Quality of Life Studies (National Institutes of Health) Canadian Scenario Planning Tool Toronto")
7 Translating evidence into policy California tools build upon previous UD4H projects: Strategies for Metropolitan Atlanta s Regional Transportation and Air Quality (SMARTRAQ) Land Use, Transportation, and Air Quality (LUTAQ) study in Puget Sound region, WA Neighborhood Quality of Life Studies (National Institutes of Health) Canadian Scenario Planning Tool Toronto Application

8 Kavage, Frank, and Kolian 2010 American Public Health Association
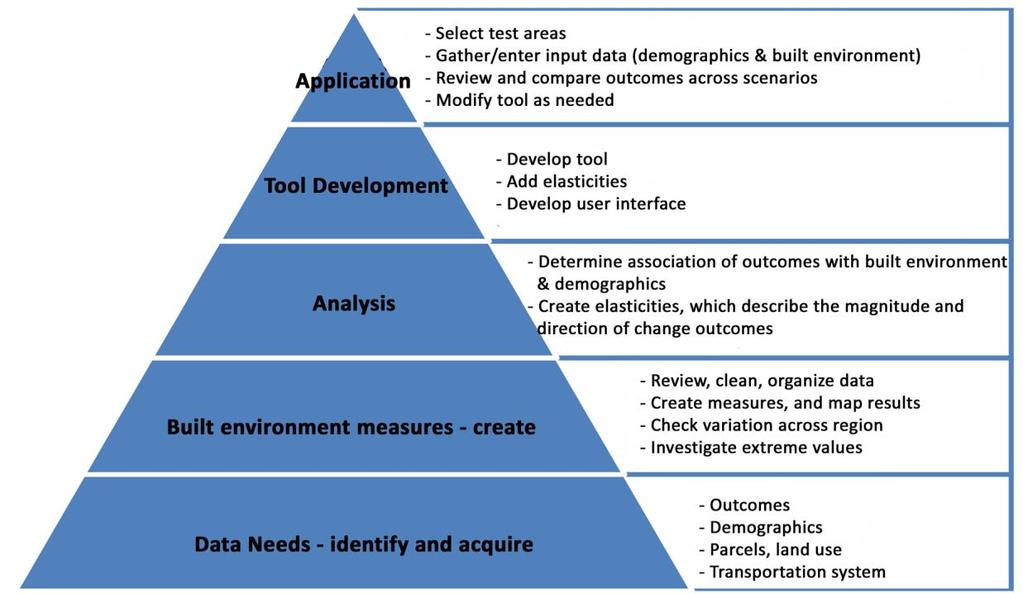
9 Tool Development


10 SANDAG Healthy Works LFC, Inc. February 13, 2009
11 Health modeling in San Diego A program of the County of San Diego Health and Human Services Agency Funded by 2009 Communities Putting Prevention to Work (CPPW) grant and 2011 Centers for Disease Control Community Transformation Grant Goal was to integrate health considerations into regional land use and transportation decision making using CommunityViz scenario planning tool


12 Built Environment Data Sources Assessors / Parcel data Residential density, land use mix, retail FAR Public Health Food locations GIS Data Layers Roads, trails, bicycle facilities, sidewalks BUILT ENVIRONMENT MEASURES (Independent variables) Ministry of Education Schools Transit Agencies Transit stops and mode Other Farmers markets, crime Census Demographic covariates
13 Built Environment Measures Residential density Land use mix Non-residential floor-to-area ratio (FAR) Access to schools, parks, retail food outlets Street connectivity Transit level of service Sidewalk, bike lane, and trail coverage Proximity to high-volume streets Steep slopes

14 Made up of: Residential density, retail Floor Area Ratio, intersection density, land use mix Regional walkability distribution, by block group Google SANDAG Healthy Communities Atlas
15 Health/activity data Physical activity (utilitarian & leisure) Body mass index, overweight/obese status Walking to/from school Type II diabetes High blood pressure, cardiovascular disease Asthma General health status Risk of pedestrian or cyclist collisions with automobiles
16 Directly Linking Health Surveys With Urban Form Difficult to get data at the address level First two projects to effectively make linkage at the small area level One of the first efforts to be able to directly link health outcomes (e.g. diabetes and cardiovascular) with built environment measures Results provide a basis to predict changes in health outcomes based on changed in built environment features
17 Health Outcomes in CViz Tool California Health Interview Survey data Amount of physical activity, leisure walking / walking to school (all age groups) BMI, obese / overweight likelihood (all age groups) Likelihood of high blood pressure, diabetes (adults) Likelihood of asthma (all age groups) General health (adults) Likelihood of visiting a park (adults, teens) Walking to school (child, teens) Fast food consumption (child) Travel Related Injury SWTRS data Pedestrian and bicycle collision rate SANDAG travel survey data Likelihood of making a walk trip (adults, youth under 16) Daily minutes of walking (adults, youth under 16) Likelihood of making a car trip Daily minutes of driving/ riding in a car
18 Key findings Features most commonly associated with better health: park accessibility, intersection density, residential density, floor-to-area ratio, transit accessibility, sidewalk coverage, grocery store accessibility, school accessibility Feature most commonly associated with poor health: traffic volume density Mixed land use index was often related to more utilitarian walking and less car travel but less leisure physical activity

19 Palomar Gateway Case Study Neighborhood-scale, using a parcel-level tool Located just east of I-5 in southern Chula Vista 100 acres of vacant, retail, and industrial land near Palomar St, with residential to the north and south Identified in the City s 2005 General Plan as one of the top locations for infill and redevelopment Case study tested health impacts of potential Specific Plan alternatives
20 Built environment changes RESULTS ARE PRELIMINARY AND FOR ILLUSTRATIVE PURPOSES ONLY Name Base Scenario Change Scenario Units Single Family DU housing units Multi-Family DU housing units Total Population people Residential Area acres Net Residential Density units/acre Retail Floorspace square feet Retail Area acres Retail FAR Office Floorspace square feet Office Area acres Office FAR Civic and Education Floorspace square feet Recreation and Entertainment Floorspace square feet Park Area acres Number of Schools 0 0 Number of Transit Stops 3 3 Number of Grocery Stores 1 2 Total Road Centerline Miles miles Total Sidewalk Miles miles Sidewalk Coverage 53% 66% Total Bike Miles miles
21 Change in health outcomes Name Base Scenario Change Scenario Units Adult Transportation Walking minutes per adult per day Adult Leisure Walking minutes per adult per day Adult Leisure Moderate Physical Activity minutes per adult per day Adult Time in Private Automobiles minutes per adult per day Adult Body Mass Index Adults Overweight or Obese 69% 67% Adults Obese 33% 32% Adults with Type 2 Diabetes 8.6% 7.8% Adults with High Blood Pressure 31% 26% Adult Self-Rated General Health scale of 1-5 (poor-excellent) Adults Visiting a Park in the Last 30 Days 57% 59% in past month Teen/child transportation walking minutes per child/teen per day Teens walking to/from school 44% 47% Teen moderate/vigorous physical activity days with at least 60 minutes per teen per week Teen body mass index Teen park visitation 31% 36% in past month Children walking to/from school 19% 24% Child body mass index Child park visitation days per child per month Pedestrian/bicycling risk factor scale of (low-high)

22 Toronto Walkability Index


23 West Don Lands (Toronto) Example Pilot study site for software tool application: Substantial planning already done 80 acres significant changes in built environment dense/mixed use development housing units 1 million sq ft of office/retail 2 new streetcar stops new park space Redevelopment is part of revitalizing Toronto's waterfront Site of athlete s village for Pan American Games (2015)
 scenario(s) Report existing/future conditions Review results and adjust scenarios as necessary")
24 Steps 1-2. Prepare and Add Data Data preparation Loading data Define the analysis area Build the future (change) scenario(s) Report existing/future conditions Review results and adjust scenarios as necessary Data type Postal code boundaries with built environment measures Bicycle facilities Trail network Food retail locations Parks Road network School locations Sidewalk network Transit stops Used to Measure Residential density Land use mix Retail floor area ratio Office floor area ratio Walkability index Metres of bicycle facilities Metres of trails Metres of bicycle facilities and trails Supermarket density Convenience store density Farmer market density Restaurant density Take-out restaurant density Park area Metres of all walkable roads Number of intersections Intersection density Crow-fly distance to nearest major arterial Network distance to nearest school School density Sidewalk coverage Network distance to nearest transit stop Transit stop density
 Built environment features Transit stop School Road Bicycle facility Trail River Square neighbourhood")
25 Comparing Scenarios West Don Lands Example West Don Lands Place Types Undeveloped postal code Mill Street neighbourhood Front Street neighbourhood Don River Park neighbourhood Don River Park neighbourhood (park) Built environment features Transit stop School Road Bicycle facility Trail River Square neighbourhood
26 Outcome Changes West Don Lands Outcome Study Area* Impacted Area** City** Base Future Base Future Base average active trips/person/day average transit trips/person/day average automobile trips/person/day average trip kilometers/person/day average CO2 generated (kg/hh/day) walking for exercise monthly freq walk to work/school monthly freq bicycle for exercise monthly freq bicycle to work/school monthly freq daily energy expenditure (kcal/kg/day) body mass index high blood pressure (likelihood) *Average of postal code values ** Population weighted average of postal code values

27 Vision California
28 Vision California > Urban Footprint Purpose: to develop scenario planning tools to be used by California regions to evaluate development and infrastructure impacts on the environment, health, land use, etc. Funded by the California High Speed Rail Authority in Partnership with the Strategic Growth Council Health models implemented in Calthorpe s Urban Footprint tool
29 CALIFORNIA S URBAN FOOTPRINT MODEL Data source Sample King County Neighborho od Quality of Life Study (NQLS) SMARTRAQ Atlanta Regional Commission Household Travel Survey Built environment inputs 1,228 adults Walkability (composed of land use mix, street connectivity, net residential density, and floor-to-area ratio) 16,873 participants 5 years or older Spatial unit for built environment Data sources analysis Walkability (composed of land use mix, street connectivity, net residential density) 1-kilometer buffer of respondent s home 1-kilometer buffer of respondent s home Demographic/ socioeconomic inputs Gender, age, education, ethnicity, number of children under 18, household income, vehicle ownership Gender, age, education, ethnicity, number of children under 18, household income, vehicle ownership Health outcomes BMI, objectively measured levels of physical activity, depressive symptoms, social cohesion BMI, transportationrelated physical activity, time spent in automobiles, social cohesion
30 Two modeling approaches A. Adaptation of non-california regression models to multi-region California data B. Adaptation of published associations to multi-region California data Both approaches were used to predict health outcomes within 150-meter grid cells resulting from different planning scenarios.
31 Predicted Health Outcomes Daily adult moderate or vigorous physical activity objective physical activity data Adult body mass index Likelihood of adult obesity or overweight Likelihood of adult obesity Daily adult time spent in cars Sense of community* Depressive symptoms* *Not implemented in Urban Footprint
32 Literature-based health models developed Prevalent child asthma* Prevalent adult rhinitis* Health impacts of obesity/overweight Pedestrian/motor vehicle collisions Fiscal impacts of above health conditions *Not implemented in Urban Footprint

33 San Diego: Predicted MVPA


34 Dr. Lawrence Frank, PhD Professor in Population and Public Health and Urban Planning University of British Columbia Mr. Jared Ulmer, Senior Scientist Urban Design 4 Health, Inc.
35 Background on use of Walk Score Health researchers have been regularly using Walk Score as a measure of the built environment for study participants Strengths: Cheap & easy to acquire Available using a consistent methodology for any location in the United States Weaknesses: Has never been calibrated/validated against objectively measured physical activity data Lack of transparency regarding changes in underlying data (threatens validity of longitudinal comparisons)
 Four age cohorts: seniors 66+, adults 20-65, teens 12-16, children 6-11 Multi-region NIH funded data (NQLS & TEEN PI Sallis; SNQLS PI King; NIK PI")
36 Purpose of this research Improve methods used to measure distances used in the Walk Score calculation (Phase I) Calibrate Walk Score Algorithm using National Institutes of Health data from the Neighborhood Quality of Life Studies (Phase II) Four age cohorts: seniors 66+, adults 20-65, teens 12-16, children 6-11 Multi-region NIH funded data (NQLS & TEEN PI Sallis; SNQLS PI King; NIK PI Saelens): Seattle, Baltimore, San Diego Validate results using external data when possible (Phase II) Strategies for Metropolitan Atlanta s Regional Transportation and Air Quality (SMARTRAQ) data for seniors and adults Compare ability of Walk Score to Walkability Index to predict physical activity (Phase II)


37 Implemented and tested airline versus network distance measurement for Walk Score: Network method resulted in stronger bivariate association (as compared to airline method) with daily minutes of moderate or vigorous physical activity**, body mass index*, obesity, overweight**, and daily time spent in an automobile** ** = p <0.01, * = p < 0.05
38 Note: Child data were inconclusive, so a simple linear distance decay function was employed

39 Walk Score component Adult Senior Teen Child Banks Books Parks Coffee Entertainment Grocery Restaurants/bars Shopping Link:node ratio Average block length Note: weights sum to 1.00 for each age cohort
40 Implications and next steps Both tools are finished and ready for use for local or regional planning Being applied in other regions of both nations Immediate next steps: Urban Footprint: develop new models using California-specific data CommunityViz Create generalizability methods, validate results, apply in other regions Calibrate tools using widely available data Improved WalkScore Census Block Group Data


41 The Beginning!
42 Approach A: Regression modeling Project timing made use of CHIS data infeasible Instead, UD4H data from other regions (Seattle & Atlanta) were used to fit new regression models Associations between the built environment and health outcomes using these same UD4H data have been published in peer-reviewed journals: American Jrnl of Preventive Medicine (Frank, 2004) American Jrnl of Preventive Medicine (Frank, 2004) Journal of the American Planning Assn (Frank, 2006) Social Science & Medicine (Saelens, 2009) Regression modeling methods were similar to those used for SANDAG
43 Approach B: Published research When UD4H data did not include key variables of interest (e.g. diabetes status), models were adapted from published research Example references: Guh DP et al. The incidence of co-morbidities related to obesity and overweight: A systematic review and metaanalysis. BMC Public Health. 2009; 9: 88. Ferreira J, Minikel E. Pay-as-you-drive Auto Insurance in Massachusetts: A Risk Assessment and Report on Consumer, Industry, and Environmental Benefits. Conservation Law Foundation Report. November Thorpe et al. The Impact of Obesity on Rising Medical Spending. Health Affairs
44 Pedestrian/vehicle collisions VMT per capita is estimated for each planning scenario Tied to built environment features We then use VMT per capita to predict the number of pedestrian/vehicle collisions A 10% reduction in vehicle miles of travel (VMT) per capita is associated with a 10% reduction in pedestrian/vehicle collisions (Ferreira 2010)
45 Obesity-related health conditions Few models exist that associate obesityrelated health conditions (e.g. cardiovascular disease, diabetes) with the built environment But substantial literature exists linking physical activity levels or obesity status to these health conditions Thus, we can model changes in the population distribution across obesity categories, then estimate the results impact on obesity-related health conditions.
46 Diabetes Being overweight (versus normal weight) increases the diabetes risk by over 3 times. (Guh, 2009) Being obese (versus normal weight) increases the diabetes risk by almost 9.5 times. (Guh, 2009) A planning scenario with reduced prevalence of overweight and obesity will also have a reduced prevalence of diabetes.
Dr. Lawrence Frank, Professor, University of British Columbia & President, Urban Design 4 Health, Inc.
 Dr. Lawrence Frank, Professor, University of British Columbia & President, Urban Design 4 Health, Inc. On 350 calories one apple tart or a special slice of Ray's Pizza a cyclist can travel 10 miles, a
Peel Health Initiatives Health and Urban Form
 Region of Peel Public Health Peel Health Initiatives Health and Urban Form alpha Conference June 9, 2008 Gayle Bursey Director, Chronic Disease and Injury Prevention Declaration No part of the information
Built Environment and Older Adults: Supporting Smooth Transitions Across the Life- Span. Dr. Lawrence Frank, Professor and Bombardier UBC
 Built Environment and Older Adults: Supporting Smooth Transitions Across the Life- Span Dr. Lawrence Frank, Professor and Bombardier Chair @ UBC The Hidden Health Costs of Transportation - Frank et al
TRANSPORTATION RESEARCH BOARD. Straight to Recording for All: Methods to Measure Walkability: From Qualitative to Quantitative
 TRANSPORTATION RESEARCH BOARD Straight to Recording for All: Methods to Measure Walkability: From Qualitative to Quantitative Methods to Measure Walkability: From Qualitative to Quantitative Organized
Carbonless Footprints: Health and Environmental benefits of Active Transportation
 Carbonless Footprints: Health and Environmental benefits of Active Transportation Dr. Lawrence Frank, Professor and Bombardier Chair in Sustainable Transportation - University of British Columbia Health
What s Health Got to Do With It? Health and Land Use Planning
 What s Health Got to Do With It? Health and Land Use Planning CANDACE RUTT, PH.D. EXECUTIVE DIRECTOR APRIL 13 TH, 2016 Planning and Public Health Planning + Public Health Healthy Communities Healthier
Public Health in the Public Realm: Influencing Street Design with Health in Mind Dr. David McKeown Medical Officer of Health
 Public Health in the Public Realm: Influencing Street Design with Health in Mind Dr. David McKeown Medical Officer of Health Complete Streets Forum April 23, 2010 Common Goals of Public Health and Complete
Summary Report: Built Environment, Health and Obesity
 Research and education Built Environment Edmonton Project Summary Report: Built Environment, Health and Obesity Introduction In 2007 the Canadian Institutes of Health Research and the Heart and Stroke
Walkable Communities and Adolescent Weight
 Walkable Communities and Adolescent Weight Sandy Slater, PhD Assistant Professor, University of Illinois at Chicago, School of Public Health Research Scientist, UIC Institute for Health Research and Policy
Blueprint for Active Living Communities: Innovative Solutions. James Sallis University of California, San Diego For IOM PA Workshop.
 Blueprint for Active Living Communities: Innovative Solutions James Sallis University of California, San Diego For IOM PA Workshop. April 15, 2015 Outline of Talk Do built environments matter? Progress
Sandra Nutter, MPH James Sallis, PhD Gregory J Norman, PhD Sherry Ryan, PhD Kevin Patrick, MD, MS
 Objectively Measured Environmental Correlates of Adolescent Physical Activity Sandra Nutter, MPH James Sallis, PhD Gregory J Norman, PhD Sherry Ryan, PhD Kevin Patrick, MD, MS San Diego State University
How Policy Drives Mode Choice in Children s Transportation to School
 How Policy Drives Mode Choice in Children s Transportation to School Physical Activity through Active Transportation Ruth L. Steiner 2011 Technical Conference and Exhibit Lake Buena Vista, FL April 3-6,
Kevin Manaugh Department of Geography McGill School of Environment
 Kevin Manaugh Department of Geography McGill School of Environment Outline Why do people use active modes? Physical (Built environment) Factors Psychological Factors Empirical Work Neighbourhood Walkability
CONCEPTUAL MODELS: THE RELATIONSHIP BETWEEN BUILT ENVIRONMENT AND HEALTH
 CONCEPTUAL MODELS: THE RELATIONSHIP BETWEEN BUILT ENVIRONMENT AND HEALTH TABLE OF CONTENTS Acknowledgements 3 Description of Process 4 Overview Model: From Built Environment to Public Health 8 Aggregate
The best indicator of an individual s and expanding access to parks and open space.
 Health & Wellness Create a Safe and Healthy Built Environment Artist s rendering, 2014 Health is important to Loveland residents, and stakeholders see the many strong connections between quality of life,
Neighborhood Environment Profiles Related to Physical Activity and Weight Status among Seniors: A Latent Profile Analysis
 Neighborhood Environment Profiles Related to Physical Activity and Weight Status among Seniors: A Latent Profile Analysis Marc A. Adams, Ph.D. University of California, San Diego & Adjunct Assistant Professor
GRAHAM PEDESTRIAN TRANSPORTATION PLAN
 GRAHAM PEDESTRIAN TRANSPORTATION PLAN Chapter 1 I 1.1 Scope and Purpose n March of 2005, the City of Graham contracted with Greenways Incorporated (GWI) to create a Pedestrian Transportation Plan. The
Focus on New Baseline Conditions, Indicators and Analytic Approaches
 Focus on New Baseline Conditions, Indicators and Analytic Approaches Lindsey Realmuto, MPH Health Program Planner San Francisco Department of Public Health Overview HIA Assessment Tools HDMT and Baseline
Active and Green: Healthy Communities Are Sustainable Communities
 Active and Green: Healthy Communities Are Sustainable Communities James Sallis, PhD San Diego State University www.drjamessallis.sdsu.edu For LISC Webinar May 4, 2011 Goals of talk Physical inactivity
2010 Pedestrian and Bicyclist Special Districts Study Update
 2010 Pedestrian and Bicyclist Special Districts Study Update Pedestrian and Bicyclist Special Districts Program Overview H-GAC s Special Districts Program aims to provide strategic investments in pedestrian
DO OUR NEIGHBORHOODS REALLY MATTER FOR CHILDREN S HEALTH AND PHYSICAL ACTIVITY?
 DO OUR NEIGHBORHOODS REALLY MATTER FOR CHILDREN S HEALTH AND PHYSICAL ACTIVITY? Brian E. Saelens, Ph.D. Seattle Children s Research Institute, University of Washington Childhood Obesity and Public Health
Perryville TOD and Greenway Plan
 Perryville TOD and Greenway Plan Greenway Glossary Pathway: A bicycle and pedestrian path separated from motorized vehicular traffic by an open space, barrier or curb. Multi-use paths may be within the
BUILT ENVIRONMENT AND HEALTH MODULE
 Interdisciplinary Program for the PhD in Urban Design and Planning BUILT ENVIRONMENT AND HEALTH MODULE 2011 Symposium April 29, 2011 1 CONTENTS Handouts Main research question Interactions between built
Traffic Safety Barriers to Walking and Bicycling Analysis of CA Add-On Responses to the 2009 NHTS
 Traffic Safety Barriers to Walking and Bicycling Analysis of CA Add-On Responses to the 2009 NHTS NHTS Users Conference June 2011 Robert Schneider, Swati Pande, & John Bigham, University of California
WALK Friendly Communities: Creating Vibrant, Inclusive Places for People
 WALK Friendly Communities: Creating Vibrant, Inclusive Places for People Walkers are the indicator species for vibrant communities ~ Dr. Rodney Tolley, Director, Walk21 Imagine yourself walking safely
Transportation and Health Tool
 Working together to evolve the Transportation and Health Tool APHA Webinar March 22, 2016 Ann Steedly, PE Overview THT Development Context Development of Indicators Strategies, Interventions & Policies
Catalyst for Change:
 Catalyst for Change: Toronto Examples Linking Health and Transportation Presented at Walk 21 Conference Vancouver 2011 Monica Campbell, Director Healthy Public Policy Toronto Public Health 1 About Toronto
 2 3 40 35 30 25 20 15 10 5 0 1986 1987 1988 1989 1990 1991 1992 1993 1994 1995 1996 1997 1998 1999 Recommended Activity Physical Inactivity 4 90 89 89.3 88 87 87.1 86 85 85 84 83.9 83 82 81 1977 1983 1990
TR NEWS. Public Health and Transportation. Innovation, Intervention, and Improvements NUMBER 299 SEPTEMBER OCTOBER 2015
 TR NEWS NUMBER 299 SEPTEMBER OCTOBER 2015 Public Health and Transportation Innovation, Intervention, and Improvements Public Health and Transportation Measuring the Health Benefits of Walking and Bicycling
Pathways to a Healthy Decatur
 CHAPTER 1 Pathways to a Healthy Decatur Health is a holistic sense of spiritual, mental, and physical well-being and the absence of illness and disease - a compilation of definitions of health by community
Neighborhood environments and physical activity in youth: from research to practice
 Neighborhood environments and physical activity in youth: from research to practice Jordan Carlson, PhD Center for Children s Healthy Lifestyles and Nutrition Children s Mercy Kansas City Contributors
Active Community Design: Why Here? Why Now?
 Active Community Design: Why Here? Why Now? Chris Holm Development Review Coordinator 20 April, 2015 Sacramento, California Our environment has changed North Natomas We ve rapidly urbanize our open space
The Impact of Policy and Environmental Outcomes on Youth Physical Activity
 The Impact of Policy and Environmental Outcomes on Youth Physical Activity Childhood Obesity Conference, San Diego, CA June 30, 2011 Sandy Slater, PhD Assistant Professor, University of Illinois at Chicago,
Incorporating Health in Regional Transportation Planning
 Mayor Karl Dean, Chairman Incorporating Health in Regional Transportation Planning Leslie A. Meehan, AICP Center TRT Intervention Webinar January 29, 2013 Objectives for Today Background About the Nashville
Health Impact Analysis for Integrated Regional Land Use and Transportation Plan
 Health Impact Analysis for Integrated Regional Land Use and Transportation Plan Hsi-Hwa Hu, Guoxiong Huang, Frank Wen, Simon Choi (Southern California Association of Governments) Margaret Shih (Los Angeles
Active Travel and Exposure to Air Pollution: Implications for Transportation and Land Use Planning
 Active Travel and Exposure to Air Pollution: Implications for Transportation and Land Use Planning Steve Hankey School of Public and International Affairs, Virginia Tech, 140 Otey Street, Blacksburg, VA
Health Beyond Healthcare The Chronic Disease Impacts of Neighborhood Design. Erik J. Aulestia, AICP Principal, Torti Gallas + Partners
 Health Beyond Healthcare The Chronic Disease Impacts of Neighborhood Design Erik J. Aulestia, AICP Principal, Torti Gallas + Partners Prior to 20th Century How should a city look and function? Architects
RESIDENTIAL PREFERENCES AND PUBLIC HEALTH IN METRO VANCOUVER. Promoting Health and Well Being by Meeting the Demand for Walkable Urban Environments
 RESIDENTIAL PREFERENCES AND PUBLIC HEALTH IN METRO VANCOUVER Promoting Health and Well Being by Meeting the Demand for Walkable Urban Environments A UBC Health & Community Design Lab Report September 2014
Safe Routes to School Program in California: An Update
 Safe Routes to School Program in California: An Update Claudia Chaufan, MD, PhD Jarmin Yeh, MSSW, MPH Leslie Ross, PhD Pat Fox, PhD, MSW Institute for Health & Aging, Department of Social and Behavioral
Perceptions of the Physical Environment Surrounding Schools & Physical Activity among Low-income, Urban, African American Adolescent Girls
 Perceptions of the Physical Environment Surrounding Schools & Physical Activity among Low-income, Urban, African American Adolescent Girls Erin Hager, PhD Candice Gormley, BS Laura Latta, MHS M. Reese
Design Principle Active Transport
 Active Transport Definition Active transport includes non-motorised forms of transport involving physical activity, such as walking and cycling. It also includes public transport to meet longer distance
City of Baton Rouge and Parish of East Baton Rouge
 City of Baton Rouge and Parish of East Baton Rouge An Analysis of Neighborhood Walkability Louisiana Remote Sensing and GIS Workshop April 22-25, 2013 Cajundome Convention Center Lafayette, Louisiana April
RESOLUTION NO ?? A RESOLUTION OF THE CITY OF NEPTUNE BEACH ADOPTING A COMPLETE STREETS POLICY
 RESOLUTION NO. 2018-?? A RESOLUTION OF THE CITY OF NEPTUNE BEACH ADOPTING A COMPLETE STREETS POLICY WHEREAS, safe, convenient, and accessible transportation for all users is a priority of the City of Neptune
Contributions of neighborhood street scale elements to physical activity in Mexican school children
 Contributions of neighborhood street scale elements to physical activity in Mexican school children Rebecca E. Lee, Erica G. Soltero, Alejandra Jauregui, Scherezade K. Mama, Simon Barquera, Edtna Jauregui,
Prioritizing Transportation Policy and Funding for Active Transportation, Safety, Equity and Health
 Mayor Karl Dean, Chairman Prioritizing Transportation Policy and Funding for Active Transportation, Safety, Equity and Health Leslie A. Meehan, AICP Planning and Implementing the Active Community Webinar
Frequently asked questions about how the Transport Walkability Index was calculated are answered below.
 Transport Walkability Index The Transport Walkability Index is a relative indicator of how well the built environment in different areas supports walking for transport. The index is frequently used in
Guidelines for Providing Access to Public Transportation Stations APPENDIX C TRANSIT STATION ACCESS PLANNING TOOL INSTRUCTIONS
 APPENDIX C TRANSIT STATION ACCESS PLANNING TOOL INSTRUCTIONS Transit Station Access Planning Tool Instructions Page C-1 Revised Final Report September 2011 TRANSIT STATION ACCESS PLANNING TOOL INSTRUCTIONS
Building Community Partnerships for Mobility:
 Building Community Partnerships for Mobility: San Francisco 2008 Presented by: Cynthia Hoyle, AICP Transportation Planning Consultant Champaign-Urbana Mass Transit District Background The Heartland Champaign-Urbana,
Healthy Toronto by Design
 Healthy Toronto by Design 50 th International Making Cities Livable Conference June 23-27, 2013 Dr. David McKeown Medical Officer of Health Toronto City of Toronto: 2.7 million population 50% immigrants
Pedestrian Demand Modeling: Evaluating Pedestrian Risk Exposures
 Pedestrian Demand Modeling: Evaluating Pedestrian Risk Exposures Kelly J. Clifton National Center for Smart Growth University of Maryland May 19, 2008 Study Team University of Maryland National Center
Building Health into Communities: A Smart Solution to Public Health Challenges Juan Pablo Reynoso
 1 Building Health into Communities: A Smart Solution to Public Health Challenges Juan Pablo Reynoso I. Introduction Over the past few decades, the United States has seen a dramatic rise in the prevalence
HIA Working Group Meeting #4 September 27, 2017
 HIA Working Group Meeting #4 September 27, 2017 Icebreaker Agenda US-1 Corridor Study Update Health Indicator Assessment Station Demonstration Area Assessment Preliminary Recommendations Discussion Next
City of Birmingham Draft Multi-modal Transportation Plan
 City of Birmingham Draft Multi-modal Transportation Plan City Commission Public Hearing Monday, November 25, 2013 7:30 pm Norman Cox, PLA, ASLA The Greenway Collaborative, Inc. Ann Arbor, Michigan The
Complete Streets 101: The Basics
 Complete Streets 101: The Basics Michigan Municipal League - Capital Conference March 21, 2017 Chip Smith, AICP - Senior Planner - Wade Trim Inc. and City Council member City of Ann Arbor 2017 MML Capital
Agenda. US-1 Corridor Study and HIA Update. Pathway Diagram / Primary Indicators. Research Questions. Linking Multimodal Improvements to Indicators
 Icebreaker Agenda US-1 Corridor Study and HIA Update Pathway Diagram / Primary Indicators Research Questions Linking Multimodal Improvements to Indicators Vulnerable Populations US-1 Corridor Study Vision
2015 Florida Main Street Annual Conference. Complete Streets Equal Stronger Main Streets
 WHAT ARE COMPLETE STREETS? CASE STUDIES COMPLETING YOUR MAIN STREET 2015 Florida Main Street Annual Conference St. Petersburg, Florida August 19, 2015 WHAT ARE COMPLETE STREETS? CASE STUDIES COMPLETING
Motorized Transportation Trips, Employer Sponsored Transit Program and Physical Activity
 Motorized Transportation Trips, Employer Sponsored Transit Program and Physical Activity Ugo Lachapelle Msc. Lawrence D. Frank, PhD Active Living Research Washington, DC April 12, 2008 Outline Background:
I-105 Corridor Sustainability Study (CSS)
") I-105 Corridor Sustainability Study (CSS) Metro Streets and Freeways Subcommittee March 21, 2019 Gary Hamrick Cambridge Systematics, Inc. I-105 CSS Project History & Background Funded by Caltrans Sustainable
I-105 Corridor Sustainability Study (CSS) Metro Streets and Freeways Subcommittee March 21, 2019 Gary Hamrick Cambridge Systematics, Inc. I-105 CSS Project History & Background Funded by Caltrans Sustainable
2014 peterborough city and county. active. transportation. & health. indicators primer
 2014 city and county active transportation & health indicators primer executive summary Walking, cycling and transit are good for our personal health, our local economies, and the environment. Understanding
Implementing Living Streets. Dena Belzer January 29, 2009
 Implementing Living Streets Dena Belzer January 29, 2009 February 22, 2004 Starting with Some Definitions 1.Living Streets/Complete Streets 2.Corridor Revitalization 3.Shopping Mall Reuse Living/Complete
Application of Demographic Analysis to Pedestrian Safety. Center for Urban Transportation Research University of South Florida
 Application of Demographic Analysis to Pedestrian Safety BDV25 TWO 977 30 Pei Sung Lin, Ph.D., P.E., PTOE, FITE Program Director Achilleas Kourtellis, Ph.D. Senior Research Associate CUTR, University of
Eastern PA Trail Summit October 1, 2018
 Eastern PA Trail Summit October 1, 2018 WHO WE ARE + WHY + WE RE * HERE * * * * * * Session Goals: Discuss how to coordinate planning and design in small, urbanized towns Consider how to develop alternative
TPO Chattanooga-Hamilton County/North Georgia. The Road Less Traveled. Non-traditional Health Impact Analyses in Transportation Planning
 TPO Chattanooga-Hamilton County/North Georgia The Road Less Traveled Non-traditional Health Impact Analyses in Transportation Planning Chattanooga TPO 443,000 people 2,110 lane miles 19 Jurisdictions $7.3M/year
Complete Streets Basics and Benefits
 Complete Streets Basics and Benefits November 14, 2017 Complete Streets Workshop Ann Ogoreuc, AICP, Allegheny County Economic Development Hannah E. Hardy, Allegheny County Health Department Benefits of
Promoting Health in Low-Wealth Communities: Physical Activity
 Promoting Health in Low-Wealth Communities: Physical Activity Deborah Cohen, MD, MPH Funded by NIEHS #P50ES012383; NHLBI # R01HL71244; HRSA-MCH # R40MC00303 Large Health Disparities Exist Among Low Income
The Impact of Placemaking Attributes on Home Prices in the Midwest United States
 The Impact of Placemaking Attributes on Home Prices in the Midwest United States 2 0 1 3 C O N S T R U C T E D E N V I R O N M E N T C O N F E R E N C E M A R Y B E T H G R A E B E R T M I C H I G A N
Incorporating Health in Regional Transportation Planning
 Mayor Karl Dean, Chairman Incorporating Health in Regional Transportation Planning Leslie A. Meehan, AICP Center TRT Intervention Webinar January 29, 2013 Objectives for Today Background About the Nashville
Progress Table GreenStep HIA Best Practices
 Executive Summary The HIA will guide the City of Marshall and the GreenStep Committee in prioritizing its involvement in the Minnesota GreenStep Cities Program to advance best practices that leverage improving
Health and Transportation: Integrated Transport and Health Impact Model in the Nashville Region. Leslie Meehan, AICP June 2015
 THE HONORABLE Mayor KEN WILBER, Karl Dean, CHAIRMAN Chairman Health and Transportation: Integrated Transport and Health Impact Model in the Nashville Region Leslie Meehan, AICP June 2015 Metropolitan Planning
1. Slide Summary: This course covers methods and best practices used by professional planners, engineers, and consultants/researchers This course
 1 1. Slide Summary: This course covers methods and best practices used by professional planners, engineers, and consultants/researchers This course does not focus on advocacy; rather, it introduces current
NASHUA REGIONAL PLANNING COMMISSION REGIONAL BICYCLE AND PEDESTRIAN PLAN
 NASHUA REGIONAL PLANNING COMMISSION REGIONAL BICYCLE AND PEDESTRIAN PLAN June, 2005 Prepared by the Nashua Regional Planning Commission 2005 NRPC Regional Bicycle and Pedestrian Plan- JUNE 2005 ACKNOWLEDGEMENTS
City of Novi Non-Motorized Master Plan 2011 Executive Summary
 City of Novi Non-Motorized Master Plan 2011 Executive Summary Prepared by: February 28, 2011 Why Plan? Encouraging healthy, active lifestyles through pathway and sidewalk connectivity has been a focus
WALKNBIKE DRAFT PLAN NASHVILLE, TENNESSEE EXECUTIVE SUMMARY NASHVILLE, TENNESSEE
 NASHVILLE, TENNESSEE EXECUTIVE SUMMARY Executive Summary A world-class multi-modal transportation system is essential to a vibrant city and better quality of life. -Mayor Barry The WalknBike plan aims
Childhood Obesity: A Policy Perspective
 Leadership for Healthy Communities Advancing Policies to Support Healthy Eating and Active Living Childhood Obesity: A Policy Perspective Elizabeth Hinman elizabeth@leadershipforhealthycommunities.org
Detroiters need to be able to conveniently and reliably get to work, school, church, stores, and parks.
 Environment & MOBILITY Detroiters need to be able to conveniently and reliably get to work, school, church, stores, and parks. Several surveyed challenges related to lack of mobility ranked in the top
Evaluation of San Diego's First CicloSDias Open Streets Event
 Evaluation of San Diego's First CicloSDias Open Streets Event Funded by a grant from The California Endowment San Diego State University School of Public Affair University of California San Diego Department
Presentation Summary Why Use GIS for Ped Planning? What Tools are Most Useful? How Can They be Applied? Pedestrian GIS Tools What are they good for?
 1 2 Pedestrian GIS Tools What are they good for? Pro Walk / Pro Bike 2006 Presentation Summary Why Use GIS for Ped Planning? What Tools are Most Useful? How Can They be Applied? Matt Haynes Fehr & Peers
Strategies to Promote the Availability of Affordable Healthy Food and Beverages
 Strategies to Promote the Availability of Affordable Healthy Food and Beverages CDC Recommended Strategies and Measurements Strategy #1: Communities Should Increase Availability of Healthier Food and Beverage
ADOT Statewide Bicycle and Pedestrian Program Summary of Phase IV Activities APPENDIX B PEDESTRIAN DEMAND INDEX
 ADOT Statewide Bicycle and Pedestrian Program Summary of Activities APPENDIX B PEDESTRIAN DEMAND INDEX May 24, 2009 Pedestrian Demand Index for State Highway Facilities Revised: May 29, 2007 Introduction
Characteristics from these programs were used to compare to and evaluate existing conditions in Howard County.
 EXECUTIVE SUMMARY Bike share is a mobility option that allows users to access a fleet of public bicycles throughout a community. Bike share systems have successfully been implemented in communities throughout
Lisa Quinn Executive Director
 Transforming Injury and Violence Prevention: Innovations in Policy, Practice, and Partnerships Advocating for Prevention: Enacting and Reacting to Legislation Lisa Quinn Executive Director Feet First works
Urban planners have invested a lot of energy in the idea of transit-oriented
 DOES TRANSIT-ORIENTED DEVELOPMENT NEED THE TRANSIT? D A N I E L G. C H AT M A N Urban planners have invested a lot of energy in the idea of transit-oriented developments (TODs). Developing dense housing
Non-motorized Transportation Planning Resource Book Mayor s Task Force on Walking and Bicycling City of Lansing, Michigan Spring 2007 pg.
 Non-motorized Transportation Planning Resource Book pg. 105 of 158 Non-motorized Transportation Planning Resource Book pg. 106 of 158 Non-motorized Transportation Planning Resource Book pg. 107 of 158
SUSTAINABILITY, TRANSPORT, & HEALTH. Ralph Buehler, Virginia Tech
 SUSTAINABILITY, TRANSPORT, & HEALTH Ralph Buehler, Virginia Tech Prepared for National Academies Roundtable on Science and Technology for Sustainability 6 December 2013 Overview Trends in Motorization
Creating walkable, bikeable and transit-supportive communities in Halton
 Creating walkable, bikeable and transit-supportive communities in Halton By presenting current research and best practices, the information in this paper is meant to support and broaden discussion on how
Existing Pedestrian Conditions. PSAC February 8, 2011
 Existing Pedestrian Conditions PSAC February 8, 2011 Contents 1. Project Background & Goals 2. Pedestrian Activity: Where people walk 3. Pedestrian Safety: The conditions people face Project Background
About the Active Transportation Alliance
 About the Active Transportation Alliance Chicagoland s voice for better biking, walking and transit Founded 1985 7,000 members, ~33 full time staff Serve Chicago metro region 1 More Cars, More Driving
Kevin Proft NRS 509 Final Project: Written Overview & Annotated Bibliography GIS Applications in Active Transportation Planning
 Kevin Proft NRS 509 Final Project: Written Overview & Annotated Bibliography 12.13.16 GIS Applications in Active Transportation Planning Geographic Information Systems (GIS) play an important role in developing
The Walkability Indicator. The Walkability Indicator: A Case Study of the City of Boulder, CO. College of Architecture and Planning
 1 : A Case Study of the City of Boulder, CO College of Architecture and Planning University of Colorado Author Note: Daryoosh Ardalan, Urban Regional Planning, College of Architecture and Planning, University
Healthy Built Environments
 Healthy Built Environments In the Region of Peel Town of Caledon Council Presentation February 14, 2012 David L. Mowat, MBChB, MPH, FRCPC, FFPH Medical Officer of Health, Region of Peel Regional Council
Assessment of socio economic benefits of non-motorized transport (NMT) integration with public transit (PT)
 integration with public transit (PT)") Assessment of socio economic benefits of non-motorized transport (NMT) integration with public transit (PT) Case study of Bike share (BS) system in Pune, India Parvesh Kumar Sharawat Department of Policy
Assessment of socio economic benefits of non-motorized transport (NMT) integration with public transit (PT) Case study of Bike share (BS) system in Pune, India Parvesh Kumar Sharawat Department of Policy
Bicycle and Pedestrian Connectivity Study. Old Colony Planning Council
 Bicycle and Pedestrian Connectivity Study Old Colony Planning Council Outline Why consider bike/peds in road designs? Why are measures needed? Connecting Land Use with Transportation Evaluation Tools:
Advancing Obesity Solutions through Investments in the Built Environment. Roundtable on Obesity Solutions September 12, 2017
 Advancing Obesity Solutions through Investments in the Built Environment Roundtable on Obesity Solutions September 12, 2017 James Sallis, PhD UCSD Dept of Family Medicine & Public Health Workshop Planning
Webinar: Development of a Pedestrian Demand Estimation Tool
 Portland State University PDXScholar TREC Webinar Series Transportation Research and Education Center (TREC) 2-18-2016 Webinar: Development of a Pedestrian Demand Estimation Tool Kelly Clifton Portland
FACTS AND FIGURES: MAKING THE CASE FOR COMPLETE STREETS IN LEE COUNTY
 FACTS AND FIGURES: MAKING THE CASE FOR COMPLETE STREETS IN LEE COUNTY Safety: Close to 5,000 pedestrians and bicyclists die each year on U.S. roads, and more than 70,000 are injured. [Mean Streets, Surface
Translating Research Into Public Policy:
 An Active Living Program supported by The Robert Wood Johnson Foundation and administered by San Diego State University. Translating Research Into Public Policy: The Case of Active Living NCSL. November
Pedestrian Activity Criteria. PSAC March 8, 2011
 Pedestrian Activity Criteria PSAC March 8, 2011 Contents 1. Project Overview a) Revised schedule of PSAC hearings 2. Pedestrian Activity: Where walking is important a) Existing conditions (revisions based
4. ENVIRONMENTAL IMPACT ANALYSIS 9. TRANSPORTATION AND TRAFFIC
 4. ENVIRONMENTAL IMPACT ANALYSIS 9. TRANSPORTATION AND TRAFFIC 4.9.1 INTRODUCTION The following section addresses the Proposed Project s impact on transportation and traffic based on the Traffic Study
Rerouting Mode Choice Models: How Including Realistic Route Options Can Help Us Understand Decisions to Walk or Bike
 Portland State University PDXScholar TREC Friday Seminar Series Transportation Research and Education Center (TREC) 4-1-2016 Rerouting Mode Choice Models: How Including Realistic Route Options Can Help
Increasing Exercise Adherence through Environmental Interventions. Chapter 8
 + Increasing Exercise Adherence through Environmental Interventions Chapter 8 + Environmental Influences on Eating & Physical Activity (French, Story, & Jeffrey, 2001) Consumption of daily fat doubled