SoundCast Design Intro
|
|
|
- Cody Poole
- 6 years ago
- Views:
Transcription

1 SoundCast Design Intro

2 Basic Design
3 SoundCast and Daysim 3 Land use attributes Households & Individuals SoundCast DaySim Travel demand simulator Trips and Households, Excel Summary Sheets, EMME network measures, Benefit Cost Outputs Trips Network assignment Traffic conditions Predictions


4 SoundCast creates a list of households and trips that looks like our household survey for the entire region! 4
5 Model Steps Population Synthesizer Who is traveling? Day Pattern How much do people travel? Destination Choice Where do people go? Mode Choice What mode do people use? Choice Models Time Choice What time do people travel at? 5 Route Assignment What paths do trips use?
6 Model Steps Compared to 4K About People Population Synthesizer Who is traveling? Day Pattern How much do people travel? Destination Choice Where do people go? Mode Choice What mode do people use? Time Choice What time do people travel at? Trip Generation How many trips are there? Trip Distribution Where do the trips go? Mode Choice What mode do the trips use? Time Choice What time do trips occur? 6 Route Assignment What paths do trips use? Route Assignment What paths do trips use?
7 How does it work? Population Synthesizer Who is traveling? Day Pattern How much do people travel? Destination Choice Where do people go? Mode Choice What mode do people use? Time Choice What time do people travel at? 7 Route Assignment What paths do trips use?

8 Geography: Parcels Activity Units: Sim People 8
9 Population Synthesizer: who is traveling? Example Household: Adult 29 years Full Time worker Male Child 3 years Pre-school student Male Household Income - $32,000 9

10 They live at one of these parcels. H 10
11 How does it work? Population Synthesizer Who is traveling? Day Pattern How much do people travel? Destination Choice Where do people go? Mode Choice What mode do people use? Time Choice What time do people travel at? 11 Route Assignment What paths do trips use?
12 How much do people travel?: Day Pattern Adult 1. Drops child off at school 2. Goes to work 3. Picks child up 4. Goes home 12 Child 1. Goes to school 2. Goes home
13 How does it work? work? Population Synthesizer Who is traveling? Day Pattern How much do people travel? Destination Choice Where do people go? Mode Choice What mode do people use? Time Choice What time do people travel at? 13 Route Assignment What paths do trips use?

14 Destination Choice at a parcel level W S H Adult 1. Drops child off at school parcel 2. Goes to work parcel 3. Picks Child up at school parcel 4. Goes to Parcel Home Child 1. Goes to school 2. Goes to home parcel Home 14
15 How does it work? Population Synthesizer Who is traveling? Day Pattern How much do people travel? Destination Choice Where do people go? Mode Choice What mode do people use? Time Choice What time do people travel at? 15 Route Assignment What paths do trips use?
16 16 What do mode do people use on their trips? Adult s Trips Drop off Child Go to Work Pick up Child Go home Most Likely Maybe? Probably Not!
17 How does it work? Population Synthesizer Who is traveling? Day Pattern How much do people travel? Destination Choice Where do people go? Mode Choice What mode do people use? Time Choice What time do people travel at? 17 Route Assignment What paths do trips use?
18 Time Choice: When do people travel? 3 AM 7 AM 12 PM 5 PM 10 PM 3 AM WORK SCHOOL Adult Child 18
19 How does it work? Population Synthesizer Who is traveling? Day Pattern How much do people travel? Destination Choice Where do people go? Mode Choice What mode do people use? Time Choice What time do people travel at? 19 Route Assignment What paths do trips use?


20 Route Assignment: What does it do? Places cars, trucks and buses on the network 20 AM Peak Period Auto Volumes AM Peak Period Transit Volumes

21 Sum of the Choices Makes a Picture of Travel 21

22 Where are people age at 1 pm?

23 University of They re Washington at school.

24 Sum of the Choices

25 Reminder: Levels of Transportation Modeling Time Daily Hour Minute Second Size Statewide Regional City Corridor / Neighborhood 25 Facility / Street


26 What is the model sensitive at this level? Number of Retail Jobs in a Parcel Cost of Parking in nearby parcels Amount of Congestion on I-5 Travel Time on Light Rail Lines Household Income Person Gender and Age Number of Students in a Household 26


27 What can t the model answer at this level? Traffic incidents and non-recurring delay Volumes on collectors How sidewalks make people walk more Car-sharing Person education level Person race 27
28 Average Commute Time (minutes) Average Commute Time by Mode SOV HOV Transit Walk
29 Percent of Trips When are people traveling? 10% 8% 6% 4% 2% 0% 11:00 PM 9:00 PM 7:00 PM 5:00 PM 3:00 PM 1:00 PM 11:00 AM 9:00 AM 7:00 AM 5:00 AM 3:00 AM 1:00 AM Trip Departure Time Hour 29
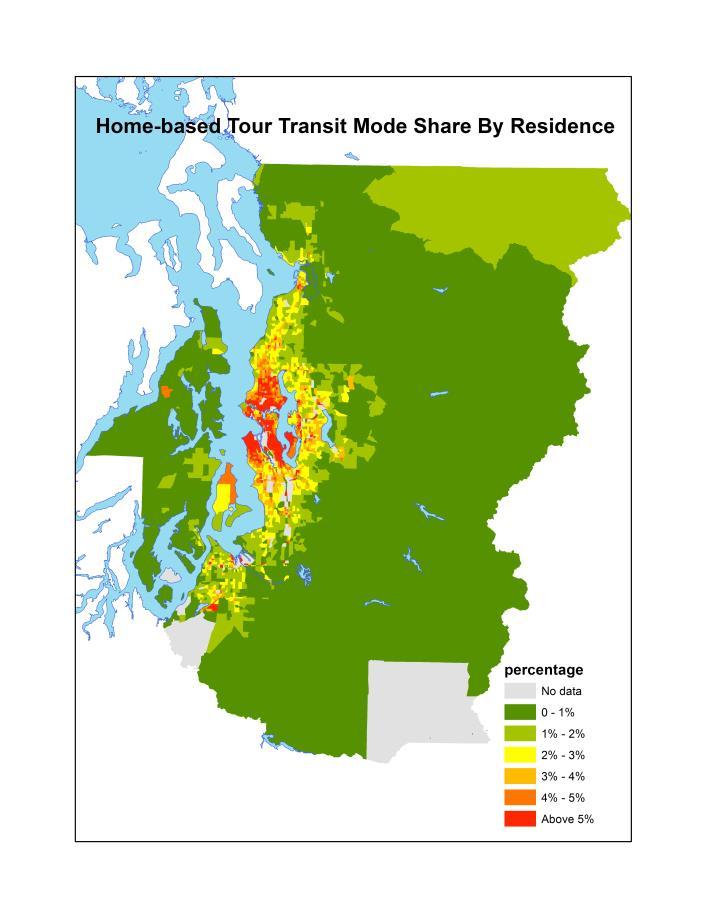
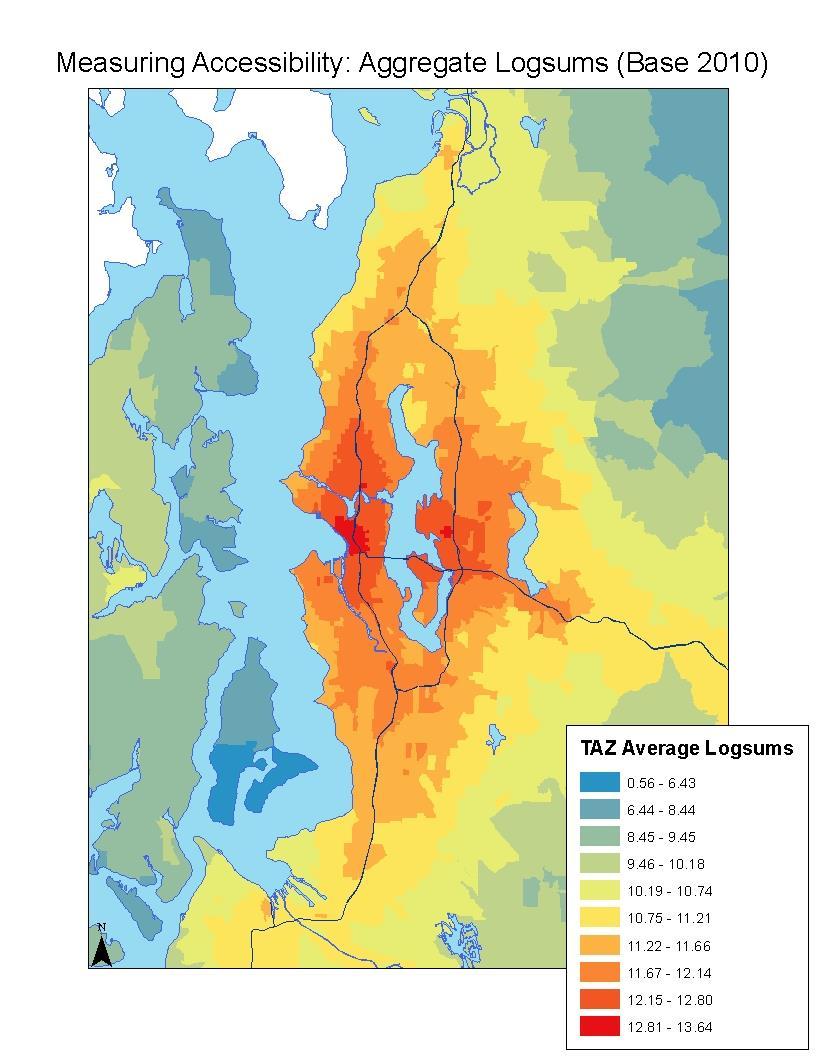
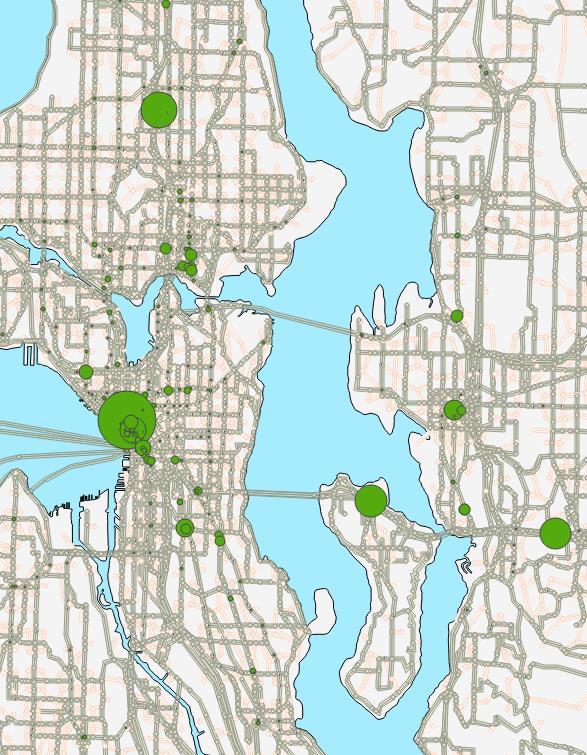
30 Geographically based outputs 30

31 Exploring Alternative Pictures of the Future What if autonomous vehicles increase roadway capacity, reduce travel times, and reduce parking costs?

32 Powerful for comparison Change in speed on the Tacoma Narrows if toll were removed Red means slower without toll, and green means faster without 32
33 Person Miles Walked 2,000,000 1,750,000 1,500,000 1,400,000 1,000, , With Tolls Without Tolls
34 More technical look at SoundCast
35 Python Controller Scripts Python scripts control the arrows in the model structure Set run iterations, convergence, process flow Initializes directories, projects, banks Controls demand models Transfers data from demand model to Emme for assignment and skimming Tests for convergence Summarizes model results


36 Input Configuration Runs are managed by an input configuration file Switch on/off model processes like: Basic directory setups Use seed trips, run assignment only Run specific sub-models like truck and external trips Holds variables and assumptions Values that might change across analyses and important to quickly validate later
37 PSRC Daysim Model Structure Purposes Work School/College Personal Business Shopping Meals Social/Rec Escort Home Modes SOV HOV2 HOV3+ Transit Walk Bike Time Resolution Choice Models 30 minutes Geographic Parcel Land Use 4000 zones for skimming and assignment 37
38 Daysim Model Structure 38 Long term Day Tour Trip/Stop Long Term Usual School and Work Locations Usual Travel Methods Auto Ownership Day Day Patterns and Tours Tour/Trip Destination Mode Schedule
39 Long-term choices 39 Long term Day Tour Trip/Stop Usual Work Location Usual School Location Auto Ownership Transit Pass Ownership Pay to Park at Workplace Usual Mode to Work
40 Daily choices 40 Long term Day Tour Trip/Stop Destination, Mode, Arrival and Departure Times (5-6 time periods in day) Intermediate Stop Generation Stop Location Trip Mode Trip Arrival or Departure Time (10-minute time periods)
41 Populating Trip Tables By Mode, Time ID Time Mode Origin Zone Destination Zone SOV Walk D D O
42 Overview Assignment/Skimming Process 12 Time Periods 21 User Classes Run Auto Assignment for each Time Period Transit (assigned) for 5 Time Periods, skimmed for 2 Skim for Time and Cost for all Time Periods Skim for Distance for Two Time Periods Run almost everything in Parallel
43 .

44 Value of time Daysim Continuous Assignment Discrete if vot < 15: vot_category=1 elif vot < 25: vot_category=2 else: vot_category=3
45 Overview Assignment/Skimming Process 12 Time Periods 21 User Classes Run Auto Assignment for each Time Period Transit for 5 Time Periods Skim for Time and Cost for all Time Periods Skim for Distance for Two Time Periods Run almost everything in Parallel
46 Assignment Details Emme Path-Traffic Assignment Closing Criteria.0001 relative gap Thinking about relaxing closing criteria in early iterations to speed up run time. Extended Transit Assignment Performs a frequency-based transit assignment using optimal strategies
47 Convergence Test Relative Trip-Weighted Average Absolute Skim Change By John Gibb, Of DKS: ij q t a t i ij qt a q = demand (trip table) t a = cumulative average skim travel time t i = this iteration travel time
48 STOP_THRESHOLD = When do we stop? Configurable parameters: A list of travel time skims sent in for comparison
49 Software Design
50 DaySim Software and Hardware Software Programmed in C#, Visual Studio, Microsoft.Net platform Two levels of distributed processing for faster runs Distribution of households across different processors on a single machine. Higher level distribution of households to different physical or virtual machines. Inputs and outputs are integrated with any travel modeling package Same code used for model estimation and application Hardware 50 Runs on 64-bit Windows systems Expected minimum configuration: Single box with 4+ processing cores (more cores will reduce run times) 8 GB RAM (16 GB if using more than 1,500 zones)

51 DaySim: Estimate Model Coefficients In addition to the usual application mode, which generates simulated travel, there is an estimation mode that produces new coefficients from survey data. Survey Data Simulated Data Forecasts Estimation Mode DaySim Application Mode Network Software Alogit Model Coefficients Synthetic Population PopGen
SOUNDCAST CALIBRATION AND SENSITIVITY TEST RESULTS (DRAFT) TABLE OF CONTENTS. Puget Sound Regional Council. Suzanne Childress.
 TABLE OF CONTENTS. Puget Sound Regional Council. Suzanne Childress.") SOUNDCAST CALIBRATION AND SENSITIVITY TEST RESULTS (DRAFT) Puget Sound Regional Council Suzanne Childress June 2015 This document describes the activity-based model calibration to the 2010 using the following
SOUNDCAST CALIBRATION AND SENSITIVITY TEST RESULTS (DRAFT) Puget Sound Regional Council Suzanne Childress June 2015 This document describes the activity-based model calibration to the 2010 using the following
DaySim Standard Technical Documentation
 DaySim Standard Technical Documentation Introduction DaySim Standard 1 is a travel demand microsimulation software package that works in conjunction with any of a number of traffic and transit assignment
Measuring the Distribution and Costs of Congestion. Tim Lomax Texas Transportation Institute
 Measuring the Distribution and Costs of Congestion Tim Lomax Texas Transportation Institute http://mobility.tamu.edu The Congestion Measurement Story Travel time, variations, compare to goals WHAT? WHY?
Transportation Trends, Conditions and Issues. Regional Transportation Plan 2030
 Transportation Trends, Conditions and Issues Regional Transportation Plan 2030 23 Regional Transportation Plan 2030 24 Travel Characteristics Why Do People Travel? Over one-half of trips taken in Dane
1999 On-Board Sacramento Regional Transit District Survey
 SACOG-00-009 1999 On-Board Sacramento Regional Transit District Survey June 2000 Sacramento Area Council of Governments 1999 On-Board Sacramento Regional Transit District Survey June 2000 Table of Contents
5858 N COLLEGE, LLC N College Avenue Traffic Impact Study
 5858 N COLLEGE, LLC nue Traffic Impact Study August 22, 2016 Contents Traffic Impact Study Page Preparer Qualifications... 1 Introduction... 2 Existing Roadway Conditions... 5 Existing Traffic Conditions...
Understanding Transit Demand. E. Beimborn, University of Wisconsin-Milwaukee
 Understanding Transit Demand E. Beimborn, University of Wisconsin-Milwaukee 1 Purpose To provide a basic understanding of transit ridership and some common misunderstandings. To explain concepts of choice
Online Open House Survey Report. December 2016
 December 216 I. OVERVIEW & OUTREACH SUMMARY Introduction Washington County evaluated long-term transportation investments and strategies as part of the Transportation Futures Study. The purpose of the
Highway 217 Corridor Study. Phase I Overview Report
 Highway 217 Corridor Study Phase I Overview Report November 3, 24 BACKGROUND AND OVERVIEW Study purpose The Highway 217 Corridor Study is developing multi-modal transportation solutions for traffic problems
Appendix B: Forecasting and Traffic Operations Analysis Framework Document
 Existing Conditions Report - Appendix Appendix B: Forecasting and Traffic Operations Analysis Framework Document This document defines the methodology and assumptions that will be used in the traffic forecasting
Sketch Level Assessment. of Traffic Issues. for the Fluor Daniel I-495 HOT Lane Proposal. Ronald F. Kirby
 Sketch Level Assessment of Traffic Issues for the Fluor Daniel I-495 HOT Lane Proposal Ronald F. Kirby Director of Transportation Planning National Capital Region Transportation Planning Board (TPB) Metropolitan
Understanding Rail and Bus Ridership
 Finance Committee Information Item III-A October 12, 2017 Understanding Rail and Bus Ridership Washington Metropolitan Area Transit Authority Board Action/Information Summary Action Information MEAD Number:
TRANSPORTATION TOMORROW SURVEY
 Clause No. 15 in Report No. 7 of was adopted, without amendment, by the Council of The Regional Municipality of York at its meeting held on April 17, 2014. 15 2011 TRANSPORTATION TOMORROW SURVEY recommends
EFFICIENCY OF TRIPLE LEFT-TURN LANES AT SIGNALIZED INTERSECTIONS
 EFFICIENCY OF TRIPLE LEFT-TURN LANES AT SIGNALIZED INTERSECTIONS Khaled Shaaban, Ph.D., P.E., PTOE (a) (a) Assistant Professor, Department of Civil Engineering, Qatar University (a) kshaaban@qu.edu.qa
Sixth Line Development - Transit Facilities Plan
 Memorandum Date: November 13, 2012 To: From: c.c. Subject: Rob Freeman (Freeman Planning) Kevin Phillips Sixth Line Development - Transit Facilities Plan 33016631 This memo was prepared to review the transit
El Paso County 2040 Major Transportation Corridors Plan
 El Paso County 2040 Major Transportation Corridors Plan Connect-our-County Online Transportation User Survey Preliminary Results June 24, 2010 Years of Residence 2. How many years have you LIVED HERE?
Preliminary Transportation Analysis
 Preliminary Transportation Analysis Goals of a Robust, Multimodal Transportation Network Safe Accessible/Connected Efficient Comfortable Context-Sensitive Motor Vehicle: Continue to analyze the data to
South Florida Commuter Travel Survey Summary and Preliminary Results. Southeast Florida FSUTMS User Group Meeting June 1, 2012
 South Florida Commuter Travel Survey Summary and Preliminary Results Southeast Florida FSUTMS User Group Meeting June 1, 2012 Agenda Introduction Survey Design Survey Implementation Preliminary Findings
ISSUE 1. Geography challenge. Geography funnels traffic from several key corridors onto I-5.
 ISSUE 1 Geography challenge Geography funnels traffic from several key corridors onto I-. ISSUE 2 Less redundancy Northern OC has a dense network of roadways for traffic to shift to during unexpected incidents.
Measuring Transportation: Traffic, Mobility and Accessibility
 Measuring Transportation: Traffic, Mobility and Accessibility THIS FEATURE COMPARES THREE APPROACHES TO MEASURING TRANSPORTATION SYSTEM PERFORMANCE. TRAFFIC-BASED MEASUREMENTS EVALUATE MOTOR VEHICLE MOVEMENT;
Appendices. Atkins SBL Forecasting Report 54
 Appendices Atkins 5103087 SBL 54 Atkins 5103087 SBL 55 Appendix A. Local Trip End Generation Rates A.1. A.1.1. Trip Rates The trip rates calculated from TRICS v6.8.1 are presented below for each of the
EXECUTIVE SUMMARY... vii 1 STUDY OVERVIEW Study Scope Study Area Study Objectives
 Contents EXECUTIVE SUMMARY... vii 1 STUDY OVERVIEW... 1-1 1.1 Study Scope... 1-1 1.2 Study Area... 1-1 1.3 Study Objectives... 1-3 2 EXISTING CONDITIONS... 2-1 2.1 Existing Freeway Conditions... 2-4 2.1.1
Typical Rush Hour Commute. PennyforTransportation.com
 Typical Rush Hour Commute In the News Overview of the Plan Collaborative plan with projects in every community Prioritizing connectivity and congestion relief Dedicated transportation-specific funding;
Arterial Transitway Corridors Study. Ave
 Arterial Transitway Corridors Study Ave January 2012 Arterial Transitway Corridors Study Overview Corridor Features and Demographics 11 study corridors, 95 route miles 86,000 daily rides and half of existing
Central Jersey Transportation Forum. March 2007
 Central Jersey Transportation Forum March 2007 Feasibility Analysis of BRT on Dinky Right of Way from Princeton Station to Alexander Rd. in West Windsor (west of Rt. 1) Study spurred by Princeton University's
Employment 8,881 17,975 9,094. Households 18,990 31,936 12,946
 This section describes the future transportation environment of the UW Tacoma campus and surrounding area. A description of the future conditions on campus in terms of the street system, traffic and intersection
Pedestrian Demand Modeling: Evaluating Pedestrian Risk Exposures
 Pedestrian Demand Modeling: Evaluating Pedestrian Risk Exposures Kelly J. Clifton National Center for Smart Growth University of Maryland May 19, 2008 Study Team University of Maryland National Center
Midtown Corridor Alternatives Analysis
 Midtown Corridor Alternatives Analysis Ridership Forecast Methodology and Results December 2013 Prepared by the SRF Consulting Group Team for Table of Contents Introduction... 1 Methodology... 1 Assumptions...
Corridor Advisory Group and Task Force Meeting #10. July 27, 2011
 Corridor Advisory Group and Task Force Meeting #10 July 27, 2011 1 Agenda Recap CAG/TF #9 Public Meeting #2 Summary Single Mode Alternatives Evaluation Results Next Steps 2 3 CAG/TF #9 Recap CAG /TF #9
Governor s Transportation Vision Panel
 Office of Governor Kate Brown Governor s Transportation Vision Panel JLA Public Involvement Project Overview The is a yearlong effort to develop a series of recommendations for the Governor that address
Capital Beltway HOT Lanes - Frequently Asked Questions
 Capital Beltway HOT Lanes - Frequently Asked Questions December 20, 2007 1. What is the cost of the project? The fixed-price design-build cost is approximately $1.4 billion. 2. Why have the project costs
2010 Pedestrian and Bicyclist Special Districts Study Update
 2010 Pedestrian and Bicyclist Special Districts Study Update Pedestrian and Bicyclist Special Districts Program Overview H-GAC s Special Districts Program aims to provide strategic investments in pedestrian
Statewide Ridership Analysis Report. Statewide Analysis Model Version 2.5 (SAM-V2.5)
") Statewide Ridership Analysis Report Statewide Analysis Model Version 2.5 (SAM-V2.5) December 2013 Contents Version History...i Executive Summary...i 1.0 Introduction and Purpose... 1 2.0 Overview of Model
Statewide Ridership Analysis Report Statewide Analysis Model Version 2.5 (SAM-V2.5) December 2013 Contents Version History...i Executive Summary...i 1.0 Introduction and Purpose... 1 2.0 Overview of Model
Transportation Modeling for the 2010 Winter Olympic Games
 Transportation Modeling for the 2010 Winter Olympic Games, PTV America, Inc. Christopher Darwent, City of Vancouver Karen Giese, PTV America, Inc. Paper prepared for presentation at the Best Practices
South King County High-Capacity Transit Corridor Study
 HIGH-CAPACITY TRANSIT CORRIDOR STUDY South King County Corridor South King County High-Capacity Transit Corridor Study Corridor Report August 2014 South King County High Capacity Transit Corridor Report
Pedestrian Activity Criteria. PSAC March 8, 2011
 Pedestrian Activity Criteria PSAC March 8, 2011 Contents 1. Project Overview a) Revised schedule of PSAC hearings 2. Pedestrian Activity: Where walking is important a) Existing conditions (revisions based
Tulsa Metropolitan Area LONG RANGE TRANSPORTATION PLAN
 Tulsa Metropolitan Area LONG RANGE TRANSPORTATION PLAN Indian Nations Council of Governments August 2005 CONTACTING INCOG In developing the Destination 2030 Long Range Transportation Plan, INCOG s Transportation
LOOP 360 IMPROVEMENT STUDY
 LOOP 360 IMPROVEMENT STUDY Overview and Preliminary Analysis August 2015 1 STUDY PROCESS 2 Study Background Loop 360 serves a wide range of users, including residents, businesses, bicyclists, and commuters
Tokyo: Simulating Hyperpath-Based Vehicle Navigations and its Impact on Travel Time Reliability
 CHAPTER 92 Tokyo: Simulating Hyperpath-Based Vehicle Navigations and its Impact on Travel Time Reliability Daisuke Fukuda, Jiangshan Ma, Kaoru Yamada and Norihito Shinkai 92.1 Introduction Most standard
REGIONAL HOUSEHOLD TRAVEL SURVEY:
 Defining the Vision. Shaping the Future. REGIONAL HOUSEHOLD TRAVEL SURVEY: Profile Why we travel How we travel Who we are and how often we travel When we travel Where we travel How far and how long we travel
Simulating Street-Running LRT Terminus Station Options in Dense Urban Environments Shaumik Pal, Rajat Parashar and Michael Meyer
 Simulating Street-Running LRT Terminus Station Options in Dense Urban Environments Shaumik Pal, Rajat Parashar and Michael Meyer Abstract The Exposition Corridor transit project is a light rail project
Determining bicycle infrastructure preferences A case study of Dublin
 *Manuscript Click here to view linked References 1 Determining bicycle infrastructure preferences A case study of Dublin Brian Caulfield 1, Elaine Brick 2, Orla Thérèse McCarthy 1 1 Department of Civil,
Goodlettsville Bicycle and Pedestrian Plan Executive Summary
 Goodlettsville Bicycle and Pedestrian Plan July 2010 In Cooperation with the Nashville Area Metropolitan Planning Executive Organization Summary Introduction Progressive and forward thinking communities
Connecting Sacramento: A Trip-Making and Accessibility Study
 Connecting Sacramento: A Trip-Making and Accessibility Study Study Overview and Highlights July 2017 Purpose of this study Local governments and transportation agencies often make challenging decisions
Travel Patterns and Characteristics
 DRAFT 2006 Transportation Fact Book SECTION 4 Travel Patterns and Characteristics 43 2006 Transportation Fact Book DRAFT 44 DRAFT 2006 Transportation Fact Book Why do we conduct travel surveys? The main
Appendix F: Detailed Modeling Results
 Appendix F: Detailed Modeling Results TransAction Technical Report (This page intentionally left blank) METHODOLOGY FOR CALCULATION OF PERFORMANCE MEASURES F-3 (This page intentionally left blank) Approved
ADOT Statewide Bicycle and Pedestrian Program Summary of Phase IV Activities APPENDIX B PEDESTRIAN DEMAND INDEX
 ADOT Statewide Bicycle and Pedestrian Program Summary of Activities APPENDIX B PEDESTRIAN DEMAND INDEX May 24, 2009 Pedestrian Demand Index for State Highway Facilities Revised: May 29, 2007 Introduction
WELCOME TO OPEN HOUSE # 1 June 14, 2017
 Langstaff Road Weston Road to Highway 7 Class Environmental Assessment Study WELCOME TO OPEN HOUSE # 1 June 14, 2017 Please sign in and join our mailing list Purpose of Open House #1 & Study Area York
Newberg-Dundee Transportation Improvement Project. Appendix D: Traffic and Revenue Forecasts SENSITIVE BUSINESS RECORD
 C/O Macquarie North America Ltd. Suite 2664, 1055 Dunsmuir Street Vancouver, BC, V7X 1K8 Phone: (604) 605-3944 Fax: (604) 605-1634 Newberg-Dundee Transportation Improvement Project Appendix D: Traffic
Performance Criteria for 2035 Long Range Transportation Plan
 Minimizing Impacts on Natural, Historic, Cultural or Archeological Resources 2035 LRTP Weighting Factor: 7% Objective 1.1: Use appropriate planning and design criteria to protect and enhance the built
STUDY ADVISORY COMMITTEE. October 8, 2015
 STUDY ADVISORY COMMITTEE October 8, 2015 Study Purpose evaluate the long-term transportation strategies and investments needed to sustain the county s economic health and quality of life in the coming
Eliminate on-street parking where it will allow for a dedicated bus only lane %
 Traffic Dashboard Priorities Survey Responses Introduction 1) Are you familiar with bus rapid transit (BRT)? a. No, BRT is new to me. 597 23.5% b. I ve heard of BRT, but I don t know much about it. 1,136
CITY OF ABBOTSFORD TRANSPORTATION AND TRANSIT MASTER PLAN
 CITY OF ABBOTSFORD TRANSPORTATION AND TRANSIT MASTER PLAN EXECUTIVE COMMITTEE MONDAY, OCTOBER 2, 2017 TRANSPORTATION & TRANSIT AGENDA 1. Plan Overview 2. Shaping Influences 3. Existing Conditions and What
Transportation, Parking & Roads
 Transportation, Parking & Roads Design Carolina North as a walkable community Design the transportation system and development patterns (i.e., urban design elements such as density, building design, mix
Figure 1: East West Connector Alignment Alternatives Concept Drawing
 Page 2 of 9 Figure 1: East West Connector Alignment Alternatives Concept Drawing The Montebello Drive extension will run north south and connect Wilsonville Road to the Boones Ferry Road to Brown Road
DON MILLS-EGLINTON Mobility Hub Profile
 Mobility Hub Profile Dundas Don Mills-Eglinton West-Bloor Anchor Hub Gateway Hub N MOBILITY HUBS: Places of connectivity between regional and rapid transit services, where different modes of transportation
Urban planners have invested a lot of energy in the idea of transit-oriented
 DOES TRANSIT-ORIENTED DEVELOPMENT NEED THE TRANSIT? D A N I E L G. C H AT M A N Urban planners have invested a lot of energy in the idea of transit-oriented developments (TODs). Developing dense housing
Arterial Transitway Corridors Study
 Arterial Transitway Corridors Study February 2012 Arterial Transitway Corridors Study Overview Corridor Features and Demographics 11 study corridors, 95 route miles Routes: 86,000 daily rides and half
Guidelines for Providing Access to Public Transportation Stations APPENDIX C TRANSIT STATION ACCESS PLANNING TOOL INSTRUCTIONS
 APPENDIX C TRANSIT STATION ACCESS PLANNING TOOL INSTRUCTIONS Transit Station Access Planning Tool Instructions Page C-1 Revised Final Report September 2011 TRANSIT STATION ACCESS PLANNING TOOL INSTRUCTIONS
Magnolia Place. Traffic Impact Analysis. Prepared for: City of San Mateo. Prepared by: Hexagon Transportation Consultants, Inc.
 Magnolia Place Traffic Impact Analysis Prepared for: City of San Mateo Prepared by: Hexagon Transportation Consultants, Inc. Updated January 4, 2010 Table of Contents 1. Introduction...1 2. Existing Conditions...6
Travel Characteristics on Weekends:
 Travel Characteristics on Weekends: Implications for Planning and Policy Making Ram M. Pendyala Department of Civil and Environmental Engineering University of South Florida, Tampa Ashish Agarwal Cambridge
NEWMARKET CENTRE Mobility Hub Profile
 Mobility Hub Profile Dundas Newmarket West-Bloor Centre Anchor Hub Gateway Hub N MOBILITY HUBS: Places of connectivity between regional and rapid transit services, where different modes of transportation
APPENDIX E BIKEWAY PRIORITIZATION METHODOLOGY
 APPENDIX E BIKEWAY PRIORITIZATION METHODOLOGY INTRODUCTION The network of bikeways recommended in the Bicycle Master Plan is extensive and is likely to be only partially completed during the 25-year life
TABLE OF CONTENTS. Executive Summary
 Executive Summary Background... ES-1 Pedestrian Network... ES-2 Bikeway Network... ES-2 Collision History... ES-2 Public Input... ES-4 Conclusions and Recommendations... ES-4 1. Introduction and Setting
Modal Shift in the Boulder Valley 1990 to 2009
 Modal Shift in the Boulder Valley 1990 to 2009 May 2010 Prepared for the City of Boulder by National Research Center, Inc. 3005 30th Street Boulder, CO 80301 (303) 444-7863 www.n-r-c.com Table of Contents
Chapter 14 PARLIER RELATIONSHIP TO CITY PLANS AND POLICIES. Recommendations to Improve Pedestrian Safety in the City of Parlier (2014)
") Chapter 14 PARLIER This chapter describes the current status and future plans for biking and walking in the City of Parlier. RELATIONSHIP TO CITY PLANS AND POLICIES The Parlier General Plan is the primary
Chapter 14 PARLIER This chapter describes the current status and future plans for biking and walking in the City of Parlier. RELATIONSHIP TO CITY PLANS AND POLICIES The Parlier General Plan is the primary
GEARY BRT SIMULATION VISSIM Calibration and Existing Conditions Results
 GEARY BRT SIMULATION VISSIM Calibration and Existing Conditions Results Geary BRT Citizens Advisory Committee February 17, 2011 www.gearybrt.org Presentation Objectives 1. Overview of modeling process
Briefing Paper #1. An Overview of Regional Demand and Mode Share
 2011 Metro Vancouver Regional Trip Diary Survey Briefing Paper #1 An Overview of Regional Demand and Mode Share Introduction The 2011 Metro Vancouver Regional Trip Diary Survey is the latest survey conducted
Measuring and Communicating Mobility:
 Measuring and Communicating Mobility: The District Mobility Project Stephanie Dock, District Department of Transportation TRB Transportation Issues in Major Cities Committee May 2, 2017 Deconstructing
Evaluating chaff fire pattern algorithms in a simulation environment. JP du Plessis Institute for Maritime Technology South Africa
 Evaluating chaff fire pattern algorithms in a simulation environment JP du Plessis (jdp@imt.co.za) Institute for Maritime Technology South Africa Overview What is seduction chaff? Chaff solution algorithm
BETHEL ROAD AND SEDGWICK ROAD CORRIDOR STUDY
 DRAFT PLAN City Council Meeting August 14, 2017 STUDY AREA Sedgwick Corridor State Route 160, principal arterial with Class 3 access management designation, commuter and freight route, connection to SR
Public Consultation Centre
 Region of Waterloo Transportation Master Plan Update Public Consultation Centre See the Information Package on how to contact the Project Team and complete the Comment Sheet www.regionofwaterloo.ca/en/exploring-the-region/transportation-master-plan.aspx
Building Community Partnerships for Mobility:
 Building Community Partnerships for Mobility: San Francisco 2008 Presented by: Cynthia Hoyle, AICP Transportation Planning Consultant Champaign-Urbana Mass Transit District Background The Heartland Champaign-Urbana,
Rail Station Fact Sheet CentrePort/DFW Airport Station
 Rail Station Fact Sheet CentrePort/DFW Airport Station Station Overview CentrePort/DFW Airport Station is located by Statler Boulevard at Breezewood Drive in Fort Worth. Free shuttles connect the station
CHAPTER 4 TRANSPORTATION IMPACT STUDY TABLE OF CONTENTS
 CHAPTER 4 TRANSPORTATION IMPACT STUDY TABLE OF CONTENTS Section Title Page 4.1 Introduction... 4-1 4.1.1 General... 4-1 4.1.2 Applicant Responsibility... 4-1 4.1.3 Capacity and Safety Issues... 4-1 A.
TRANSPORTATION & MOBILITY
 TRANSPORTATION & MOBILITY ROADWAY SYSTEM There are approximately 40 miles of roadways in Manitou Springs. For planning purposes, roadways are typically assigned a functional classification which defines
David DiPierro, John Amberson. Steering Committee Meeting #4 Overview
 IBI GROUP 18401 Von Karman Avenue Suite 110 Irvine CA 92612 USA tel 949 833 5588 fax 949 833 5511 ibigroup.com Memorandum To/Attention Steering Committee Members Date February 17, 2016 From IBI Group Project
Chapter 5 Future Transportation
 Chapter 5 Future Transportation The Future Land Use Plan identifies the desired land use designations. The land uses desired for Crozet depend, in large part, on the success of the transportation system,
Estimating a Toronto Pedestrian Route Choice Model using Smartphone GPS Data. Gregory Lue
 Estimating a Toronto Pedestrian Route Choice Model using Smartphone GPS Data Gregory Lue Presentation Outline Introduction Background Data Smartphone Data Alternative Route Generation Choice Model Toronto
SIDRA INTERSECTION 6.1 UPDATE HISTORY
 Akcelik & Associates Pty Ltd PO Box 1075G, Greythorn, Vic 3104 AUSTRALIA ABN 79 088 889 687 For all technical support, sales support and general enquiries: support.sidrasolutions.com SIDRA INTERSECTION
Memorandum. Drive alone
 Memorandum To: Cc: From: Kimberly Kerr, Assistant Chief Administrative Officer Natalie Porter, PE, TE Shawna Purvines Claudia Wade, PE Michael Schmitt, AICP CTP, PTP Re: Technical Memorandum #2: Model
Gdynia s bicycle model
 Gdynia s bicycle model Problems related to cycling network and demand modelling Michał Miszewski, city of Gdynia Development of tool for transport analysis - MST Statistical data (baseline and forecasts)
Highway 111 Corridor Study
 Highway 111 Corridor Study June, 2009 LINCOLN CO. HWY 111 CORRIDOR STUDY Draft Study Tea, South Dakota Prepared for City of Tea Sioux Falls Metropolitan Planning Organization Prepared by HDR Engineering,
Roundabouts along Rural Arterials in South Africa
 Krogscheepers & Watters 0 0 Word count: 00 text + figures = 0 equivalent words including Title and Abstract. Roundabouts along Rural Arterials in South Africa Prepared for: rd Annual Meeting of Transportation
Bike Share Social Equity and Inclusion Target Neighborhoods
 Bike Share Social Equity and Inclusion Target Neighborhoods Target Neighborhoods West End/Visitation Park/Academy/Hamilton Heights Wellsgoodfellow/Kingsway West The Ville/Greater Ville Kingsway East/Fountain
Operationalizing Accessibility
 Operationalizing Accessibility March 30, 2017 Chris McCahill State Smart Transportation Initiative Matt Pettit Citilabs State Smart Transportation Initiative A network of reform-oriented state DOTs, founded
Bike Planner Overview
 Bike Planner Overview A Web-based Sketch Planning Tool for Los Angeles County presented by William E. Walter, GISP April 12, 2017 GIS-T Transportation leadership you can trust. Bike Planner Overview Guiding
City of Novi Non-Motorized Master Plan 2011 Executive Summary
 City of Novi Non-Motorized Master Plan 2011 Executive Summary Prepared by: February 28, 2011 Why Plan? Encouraging healthy, active lifestyles through pathway and sidewalk connectivity has been a focus
Mobility and Congestion
 Technical Memorandum Mobility and Congestion Prepared for: Prepared by: September 25, 2013 1 Table of Contents 1. Introduction... 1 2. Congestion Forecasting Process... 1 2.1 Mobility and Congestion Terms...
Tampa Bay Regional Planning Model (TBRPM v7.x)
") Express Lane Model in Tampa Bay Area presented by Hoyt Davis, Kapil Arya, & Chunyu Lu March 26, 2014 Introduction Tampa Bay Regional Planning Model (TBRPM v7.x) 4 Step Model used for 2035 Long Range Transportation
Express Lane Model in Tampa Bay Area presented by Hoyt Davis, Kapil Arya, & Chunyu Lu March 26, 2014 Introduction Tampa Bay Regional Planning Model (TBRPM v7.x) 4 Step Model used for 2035 Long Range Transportation
Defining Purpose and Need
 Advanced Design Flexibility Pilot Workshop Session 4 Jack Broz, PE, HR Green May 5-6, 2010 Defining Purpose and Need In your agency s project development process, when do design engineers typically get
Maryland State Highway Mobility Report. Morteza Tadayon
 Maryland State Highway Mobility Report Morteza Tadayon Background Mobility is a Key Performance Area (KPA) in the SHA Business Plan SHA adopts a performance based approach Monitors Highway System to identify
Congestion Reducing Activities. Toby Carr GDOT Director of Planning April 10, 2014
 Congestion Reducing Activities Toby Carr GDOT Director of Planning April 10, 2014 GDOT Performance Dashboard Congestion Congestion Relief Strategies 511 HEROS RTOP Highway Emergency Response Operators
A CHOICE MODEL ON TRIP MODE CHAIN FOR INTER-ISLANDS COMMUTERS IN MOLUCCA-INDONESIA: A CASE STUDY OF THE TERNATE ISLAND HALMAHERA ISLAND TRIP
 International Journal of Civil Engineering and Technology (IJCIET) Volume 8, Issue 7, July 2017, pp. 1050 1057, Article ID: IJCIET_08_07_112 Available online at http://http://ww www.iaeme.com/ijciet/issues.asp?jtype=ijciet&v
Active Travel and Exposure to Air Pollution: Implications for Transportation and Land Use Planning
 Active Travel and Exposure to Air Pollution: Implications for Transportation and Land Use Planning Steve Hankey School of Public and International Affairs, Virginia Tech, 140 Otey Street, Blacksburg, VA
2014 Regional Bicycle and Pedestrian Study Evaluation Tools Leslie A. Meehan, AICP MPO Technical Coordinating Committee Meeting April 1, 2015
 Mayor Mayor Kenneth Karl Dean, Wilber, Chairman 2014 Regional Bicycle and Pedestrian Study Evaluation Tools Leslie A. Meehan, AICP MPO Technical Coordinating Committee Meeting April 1, 2015 Evaluation
DON MILLS-SHEPPARD Mobility Hub Profile
 DON MILLS-SHEPPARD Mobility Hub Profile Dundas Don Mills-Sheppard West-Bloor Anchor Hub Gateway Hub N MOBILITY HUBS: Places of connectivity between regional and rapid transit services, where different
City of Davenport CitiBus Public Transportation Study. April 2015
 City of Davenport CitiBus Public Transportation Study April 2015 Overview Project Background Key Findings CitiBus Service Allocation Policy Discussion 2 Project Background 3 About CitiBus Operates 17 routes
Investigating Commute Mode and Route Choice Variability in Jakarta using multi-day GPS Data
 Investigating Commute Mode and Route Choice Variability in Jakarta using multi-day GPS Data Zainal N. Arifin Kay W. Axhausen Conference paper STRC 2011 Investigating Commute Mode and Route Choice Variability
ENHANCED PARKWAY STUDY: PHASE 2 CONTINUOUS FLOW INTERSECTIONS. Final Report
 Preparedby: ENHANCED PARKWAY STUDY: PHASE 2 CONTINUOUS FLOW INTERSECTIONS Final Report Prepared for Maricopa County Department of Transportation Prepared by TABLE OF CONTENTS Page EXECUTIVE SUMMARY ES-1