Evaluation of the Wisconsin DOT Walking Profiler
|
|
|
- Percival Lambert
- 6 years ago
- Views:
Transcription
1 Final Report Evaluation of the Wisconsin DOT Walking Profiler March 2007 U.S. Department of Transportation Federal Highway Administration
2 Notice This document is disseminated under the sponsorship of the U.S. Department of Transportation in the interest of information exchange. The U.S. Government assumes no liability for the use of the information contained in this document. This report does not constitute a standard, specification, or regulation. The U.S. Government does not endorse products or manufacturers. Trademarks or manufacturers names appear in this report only because they are considered essential to the objective of the document. Quality Assurance Statement The Federal Highway Administration (FHWA) provides high-quality information to serve Government, industry, and the public in a manner that promotes public understanding. Standards and policies are used to ensure and maximize the quality, objectivity, utility, and integrity of the information. FHWA periodically reviews quality issues and adjusts its programs and processes to ensure continuous quality improvements.
3 Technical Report Documentation Page 1. Report No. 2. Government Accession No. 3. Recipient's Catalog No. 4. Title and Subtitle Evaluation of Wisconsin DOT Walking Profiler 5. Report Date March Performing Organization Code 7. Author(s) Rohan W. Perera and Starr D. Kohn 9. Performing Organization Name and Address Soil and Materials Engineers, Inc., Plymouth Oaks Blvd., Plymouth, MI Performing Organization Report No. 10. Work Unit No. (TRAIS) 11. Contract or Grant No. DTFH61-04-D Sponsoring Agency Name and Address Federal Highway Administration 400 Seventh Street, S.W., Room 3118 Washington, DC Type of Report and Period Covered Final Report October, 2006 March, Sponsoring Agency Code 15. Supplementary Notes Mr. Robert Orthmeyer of Federal Highway Administration served as the program manager for this project, while Mr. Mark Swanlund of Federal Highway Administration served as the Contracting Officer's Technical Representative. 16. Abstract The data collected by a reference profiling device is used as the standard for evaluating the data collected by inertial profilers. The Wisconsin Department of Transportation owns a Surpro Walking Profiler, which is a reference profiling device, manufactured by International Cybernetics Corporation. The ability of this device to obtain repeatable and reproducible IRI data was investigated by collecting data at two test sections located at the Mn/Road facility in Albertville, MN. One of the sections was surfaced with asphalt concrete, while the other was surfaced with portland cement concrete. The data collection was performed on October 17, Several other reference profiling devices (an Australian Road Research Board Walking Profiler, two International Cybernetics Corporation Surpro s (one with a wide tire), and a Surface Systems and Instruments Walking Profiler) and an Ames lightweight inertial profiler that was equipped with TriOD and RoLine sensors also collected data at the two sections on the same day. Each device collected repeat runs at the two sections. The data collected by the devices were used to compute the International Roughness Index (IRI). The repeatability of a device was evaluated by computing the average cross correlation (IRI filtered) for the repeat runs. Cross correlation (IRI filtered) among devices was used to evaluate the reproducibility of the devices. The Profile Viewing and Analysis software, ProVAL, developed by the Federal Highway Administration, was used to perform all computations. The Wisconsin DOT s Surpro Walking Profiler showed excellent repeatability. The data collected by this device showed excellent reproducibility with the data collected by the Australian Road Research Board Walking Profiler, the other two Surpro s, and the Ames Lightweight Profiler. 17. Key Words International Roughness Index, cross correlation, profile data, reference devices 19. Security Classif. (of this report) Unclassified 20. Security Classif. (of this page) Unclassified Form DOT F (8-72) Reproduction of completed page authorized 18. Distribution Statement No restrictions. 21. No. of Pages 22. Price
4 TABLE OF CONTENTS INTRODUCTION...1 REFERENCE DEVICES...1 TEST SECTIONS AND TESTING PROGRAM...2 PREPARATION OF DATA...2 DATA RECORDING INTERVAL...2 IRI VALUES...4 CROSS CORRELATION...6 REPETABILITY CROSS CORRELATION...6 REFERENCE DEVICES...7 LIGHTWEIGHT PROFILER...8 REPRODUCABILITY CROSS CORRELATION...9 AMONG REFERENCE DEVICES...9 LIGHTWEIGHT PROFILER AND REFERENCE DEVICES...11 PROFILE PLOTS...14 ADJUSTED ARRB WALKING PROFILER MEASUREMENTS...18 CONCLUSIONS...18 REFERENCES...21 APPENDIX A: PHOTOGRAPHS OF REFERENCE DEVICES...22 APPENDIX B: PHOTOGRAPHS OF THE PAVEMENT SURFACE...28 APPENDIX C: EFFECT OF OFFSET ON CROSS CORRELATION...30 APPENDIX D: REPRODUCABILITY CROSS CORRELATIONS ASPHALT SECTION...33 APPENDIX E: REPRODUCABILITY CROSS CORRELATIONS CONCRETE SECTION...38 APPENDIX F: PROFILE PLOTS...43
5 LIST OF FIGURES Figure 1. Correct and erroneous Dipstick profiles...18 LIST OF TABLES Table 1. Reference devices that participated in the comparison...1 Table 2. Data recording interval of devices...3 Table 3. Length profiled at the AC section...3 Table 4. Length profiled at the PCC section...4 Table 5. IRI values at the AC section....5 Table 6. IRI values at the PCC section....5 Table 7. Difference between maximum and minimum IRI from repeat runs....5 Table 8. Repeatability cross correlation values (IRI filtered) AC section....7 Table 9. Repeatability cross correlation values (IRI filtered) PCC section....7 Table 10. Repeatability cross-correlation values for the lightweight profiler...8 Table 11. Average reproducibility cross correlation values (IRI filtered) AC section Table 12. Average reproducibility cross correlation values (IRI filtered) PCC section Table 13. Reproducibility cross correlation (IRI filtered) for data collected by the TriOD and the RoLine sensor...12 Table 14.Cross correlation values (IRI filtered) between Ames lightweight profiler (TriOD sensor) and reference devices Table 15. Cross correlation values (IRI filtered) between Ames lightweight profiler (RoLine sensor) and reference devices Table 16. Repeatability cross correlation of elevation profiles for reference devices AC section...14 Table 17. Repeatability cross correlation of elevation profiles for reference devices PCC section...14 Table 18. Elevation at the end of the section for reference devices...15 Table 19. Difference in elevation at the end of the section between rod and level data and reference device data...16 Table 20. Dipstick readings Table 21. Dipstick readings with a constant error for each reading...17
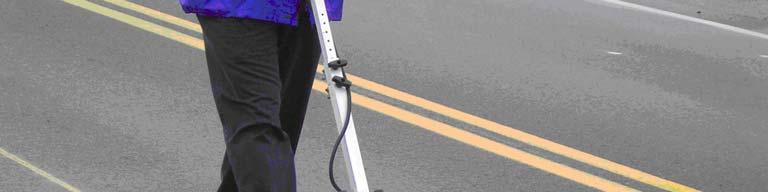
6 INTRODUCTION This study was performed to assist the Wisconsin Department of Transportation (DOT) in evaluating the ability of their Surpro Walking Profiler to be used as a reference profiling device. Currently, most State highway agencies require the verification of inertial profilers prior to performing measurements on construction projects to obtain smoothness measurements. The current methodology to accomplish this verification is to compare the International Roughness Index (IRI) and elevations obtained from an inertial profiler to those obtained from a reference device. Thus, a test plan was developed to evaluate the ability of the Surpro to obtain repeatable and accurate elevation data. The test program was performed at the Mn/Road facility in Albertville, MN. Two test sections, one asphalt concrete (AC) and one portaland cement concrete (PCC), that were located on the low-volume loop at the facility were used for the evaluation. The data collection was performed on October 17, In addition to the Wisconsin DOT Surpro Walking Profiler, other reference profilers and a lightweight inertial profiler collected data on the same day. This report documents the field procedures of the study and presents an assessment of the Wisconsin DOT s Supro Walking Profiler as a reference profiling device. REFERENCE DEVICES The reference devices that took part in the study are shown in table 1, which also shows the owner and the operator of each device. Photographs of these devices are included in appendix A. The wide tire Surpro has a tire width of 3 inches, while the other Surpro s have a tire width of 2.25 inches. Table 1. Reference devices that participated in the comparison. Device Device Owner Operated By Number 1 ARRB Walking Profiler Minnesota DOT Minnesota DOT 2 ICC Surpro Wide Tire ICC ICC 3 ICC Surpro - Normal Tire ICC ICC 4 ICC Surpro - Normal Tire Wisconsin DOT Wisconsin DOT 5 SSI - Walking Profiler SSI SSI Note: ARRB - Australian Road Research Board, ICC - International Cybernetics Corporation, SSI - Surface Systems and Instruments An Ames lightweight profiler also performed measurements. This profiler had two sensors that were mounted in-line with each other, so they collected data along the same path. One of the sensors was a TriOD sensor, while the other was a Selcom RoLine sensor. A photograph of this profiler is also included in appendix A. Device number 6 was assigned to this profiler. 1
7 TEST SECTIONS AND TESTING PROGRAM Testing was performed on two test sections located in the low-volume loop at the Mn/Road facility. One section was surfaced with dense graded AC, while the second section was a transversely tines PCC surface. These two sections are used by Minnesota DOT to certify inertial profilers. A solid yellow stripe was marked within each section, and data were collected along this line. Photographs of the two test sections are included in appendix B. Each reference device performed three repeat runs along the selected path at each test section. All three Surpro s collected data along this path, and then came back along the same path and terminated data collection at the start location. The Ames lightweight profiler collected five repeat runs at each test section. The lightweight profiler used a guidance system (see photograph included in appendix A) when performing measurements to track the path being profiled. Once data collection was completed, each profiler operator created data files in the ERD format, and handed over the data to a representative of the Federal Highway Administration (FHWA). There was no rain during testing, but there was a mist present throughout most of the testing, that varied from light to heavy. The pavement was damp, but no standing water was present. It was a windy day, with high humidity, and the temperature ranging from 40 to 45 F. PREPARATION OF DATA As all Surpro data files contained data for the forward as well as the return run, the data corresponding to the forward run was extracted for analysis. The ERD file header in these data files indicated the number of forward readings, and this information was used to extract the data corresponding to the forward run. In all Surpro data files the elevation of the first and the last data points was zero. It is extremely unlikely that the elevation of the last data point will be equal to zero when data collection is terminated at the end of the return run (which corresponds to the beginning of the test section). It appears that the closure error at the end of testing is being distributed over all the data points. This would result in the elevation of the last data point in the file being zero. In all reference device data files, except for the SSI files, the elevation of the first data point in the file was zero. This indicates the elevation at the start of the test section is zero, which is the reference for the elevation profile. The first data point in the files submitted by SSI was not zero, and it appears the first data point in the file is actually the elevation at the location where the first reading was obtained, as the first data point ranged from to inches for the various runs. DATA RECORDING INTERVAL Table 2 shows the data recording interval of the devices, as indicated in the ERD file. All data files presented the data recording interval in feet, and the values in parenthesis are the interval converted into inches. 2
8 Minnesota DOT reported that the length of the AC section was 500 ft. Table 3 shows the length of the section based on the profile data recorded in each data file at the AC section. Table 2. Data recording interval of devices. Device Device Data Recording No. Interval 1 ARRB Walking Profiler ft (9.5 in) 2 Surpro - Wide Tire ft (1 in) 3 Surpro - Normal Tire (ICC) ft (1 in) 4 Surpro - Normal Tire (WI) ft (1 in) 5 SSI - Walking Profiler ft (1 in) 6 Ames Lightweight Profiler ft (1.2 in) Table 3. Length profiled at the AC section. Device Device Distance (ft) No. Profiler Run ARRB Walking Profiler Surpro Wide Tire Surpro Normal Tire (ICC) Surpro Normal Tire (WI) SSI Walking Profiler Ames Lightweight Profiler As seen in table 3, all of the devices recorded different lengths. All repeat runs of the following devices had the same length, although there were differences in the lengths recorded among the devices: ARRB walking profiler, Surpro Normal Tire (ICC), and Ames lightweight profiler. For the wide tired Surpro, run 2 had three data points more than run 1, and run 3 had two data points more than run 1. For Surpro (WI), runs 2 and 3 had two data points more than run 1. Run 3 of the SSI profiler had two data points more than runs 1 and 2. As the data recording interval of the Surpro and SSI walking profiler is 1 inch, being off by two or three data points mean the distances are off by 2 and 3 inches respectively, which is a negligible error. The length of the section recorded by all three Surpro s was within 1 ft of the actual length of the section. All runs of the ARRB walking profiler recorded a distance that was 1.15 ft greater than the actual length. The Ames lightweight profiler had two sensors that were in line with each other, and it appears this profiler recorded data over a distance that was slightly longer than the test section in order for both sensors to collect data over the entire test section. The SSI walking profiler recorded the lowest distance of all devices, with the recorded lengths being 2.69 to 2.86 ft shorter than the actual length of the section. Comparison of data collected by this device with 3
9 other devices indicated the device appears to have collected data over the entire test section, but its actual data recording interval may have been slightly higher than the data recording interval of ft indicated in the ERD file. This may be the reason why the length based on information in the ERD file is close to 497 ft, although the device actually traversed the entire test section. Table 4 shows the length of the profile recorded in each data file for the PCC section. Minnesota DOT reported the length of the PCC section to be 531 ft. The values shown in table 4 again show each device recorded a different length. All repeat runs of the following devices had the same length although there were differences in the lengths recorded among the devices: ARRB walking profiler, Surpro Normal Tire (ICC), and Ames lightweight profiler. For the wide tired Surpro, run 2 had one reading more than runs 1 and 3. For Surpro (WI), run 2 had three readings more than run 1, while run 3 had four readings more than run 1. Run 2 of the SSI profiler had twelve data points more than run 1, while run 3 had eight data points more than run. All three Surpro s recorded lengths that were slightly greater than the actual length of the section, but the recorded lengths were all within 1.5 ft of the actual length of the section. All runs of the ARRB walking profiler recorded a distance that was 1.81 ft greater than the actual length. The SSI walking profiler recorded the lowest distance of all devices, with the recorded lengths being 3.10 to 3.78 ft shorter than the actual length of the section. The observations made for the PCC section regarding differences in lengths for the SSI walking profiler and the lightweight profiler appear to be consistent with those for the AC section. Table 4. Length profiled at the PCC section. Device Device Distance (ft) No. Profile Run ARRB Walking Profiler Surpro - Wide Tire Surpro - Normal Tire (ICC) Surpro - Normal Tire (WI) SSI - Walking Profiler Ames Lightweight Profiler IRI VALUES The IRI values were computed for all profile runs of all devices. The IRI values were computed using ProVAL (Version 2.7), (1) which is software developed by the FHWA for analyzing profile data. The 250 mm moving average option was checked in ProVAL when computing the IRI of all devices except for the three Supro s (Device Number 2, 3, and 4). The Power Spectral Density (PSD) plots of data collected by all three Supro s indicated that a moving average has been applied on the data. Therefore, the moving average was not applied during the IRI computations. The geometric configuration of Surpro results in the device collecting data which is equivalent to data that has a moving average applied to it. 4
10 The IRI values for the AC and the PCC sections are shown in tables 5 and 6, respectively. The difference between the maximum and minimum IRI of the repeat runs for each device at both test sections are shown in table 7. Table 5. IRI values at the AC section. Device Device IRI (in/mi) No Run 1 Run 2 Run 3 Run 4 Run 5 Average 1 ARRB Walking Profiler Surpro - Wide Tire Surpro - Normal Tire (ICC) Surpro - Normal Tire (WI) SSI - Walking Profiler Ames Lightweight (TriOD) Ames Lightweight (RoLine) Table 6. IRI values at the PCC section. Device Device IRI (in/mi) No Run 1 Run 2 Run 3 Run 4 Run 5 Average 1 ARRB Walking Profiler Surpro - Wide Tire Surpro - Normal Tire (ICC) Surpro - Normal Tire (WI) SSI - Walking Profiler Ames Lightweight (TriOD) Ames Lightweight (RoLine) Table 7. Difference between maximum and minimum IRI from repeat runs. Device Device Difference Between No. Maximum and Minimum IRI of Repeat Runs (in/mi) AC Section PCC Section 1 ARRB Walking Profiler Surpro - Wide Tire Surpro - Normal Tire (ICC) Surpro - Normal Tire (WI) SSI - Walking Profiler Ames Lightweight (TriOD) Ames Lightweight (RoLine)
11 As shown in table 7, the IRI values from the repeat runs are very lose to each other for all of the devices at both test sections. As shown in tables 5 and 6, the IRI values obtained by the different devices were very close to each other at both test sections. At the AC section, the SSI walking profiler had the lowest average IRI (87.6 in/mi), while the Surpro Normal Tire (WI) had the highest average IRI (90.6 in/mi). At the PCC section, the ARRB walking profiler had the lowest average IRI (75.7 in/mi), while the Surpro Normal Tire (WI) had the highest average IRI (78.1 in/mi). CROSS CORRELATION Direct profile comparison is necessary to study the performance of profilers, because index values may compare favorably for a device due to compensating error even when the profiles do not. (2) Cross correlation is an objective method of assessing profile agreement, which was originally applied by Karamihas. (3,4) In this study, cross correlation was performed on the output of the IRI filter which is applied to profile data for evaluating profiler repeatability and reproducibility, All cross correlations were performed using ProVAL (Version 2.70). (1) The maximum value that can be obtained for cross correlation is 100, which indicates perfect agreement for the two evaluated profiles. When performing cross correlation using ProVAL, one profile has to be selected as the Reference Profile and the other profile is treated as the Candidate Profile. Based on the maximum offset specified by the user, the Candidate Profile is shifted to the maximum lag and lead positions with respect to the Reference Profile to find out the minimum of the overlapped data points (common length) during the offset sweep. This length is used for cross correlation computations. The method of using cross correlation to evaluate profilers has been used in several recent studies for evaluating profiler performance. (2,5) The American Association of State Highway and Transportation Officials (AASHTO) provisional standard PP49-03 describes the procedure for certifying an inertial profiler. (6) This standard was revised in early 2006 by an Expert Task Group (ETG), and was passed in early 2007 by an AASHTO subcommittee. The revised standard specifies using the cross correlation method to evaluate profiler repeatability and for comparing the output from an inertial profiler with a reference device. REPETABILITY CROSS CORRELATION The repeatability of a profiler was evaluated using the data obtained for repeat runs at a section. Cross correlation was performed using ProVAL on the IRI filtered profiles. The following procedure was followed for computing the cross correlation values: 1. The pre-processor filter was selected as IRI in ProVAL. 2. The 250 mm moving average filter was applied in ProVAL, except for the three Surpro s. 3. For each device, cross correlation was performed for all combinations of repeat runs. 6
12 The 250 mm moving average was not applied to data collected by the three Surpro s because as described previously, the geometric configuration of the device results in data collected by this device being equivalent to data on which a moving average has been applied. As the repeat runs for a device should have started exactly at the start of the section, there should be no offset between the different runs. This means the offset value in ProVAL should be set to zero. However, the revised AASHTO PP 49 indicates the following procedure must be performed when assessing repeatability cross correlation: (1) shift one profile over every possible offset to the other profile up to 3 ft in either direction computing cross correlation at each position, and (2) obtain the maximum cross correlation over the 6 ft range as the cross correlation between the two runs. For all repeatability cross correlation computations the method specified in the revised AASHTO standard was used, which means specifying a value of 3 ft in ProVAL for the maximum offset. Reference Devices The cross correlation values (IRI filtered) for the five references devices at the AC and the PCC sections are shown in tables 8 and 9, respectively. Each table shows the cross correlation values for a device for various combinations of runs, as well as the average value. The offset value computed by ProVAL for a pair of runs was within ft (1 in) for the majority of cases. Table 8. Repeatability cross correlation values (IRI filtered) AC section. Device Device IRI Filtered Cross Correlation (%) No Run 1 & 2 Run 1 & 3 Run 2 & 3 Average 1 ARRB Walking Profiler Surpro - Wide Tire Surpro - Normal Tire (ICC) Surpro - Normal Tire (WI) SSI - Walking Profiler Table 9. Repeatability cross correlation values (IRI filtered) PCC section. Device Device IRI Filtered Cross Correlation (%) No Run 1 & 2 Run 1 & 3 Run 2 & 3 Average 1 ARRB Walking Profiler Surpro - Wide Tire Surpro - Normal Tire (ICC) Surpro - Normal Tire (WI) SSI - Walking Profiler The following observations on repeatability cross correlation were noted: The three ICC Surpro s had average cross correlation values ranging from 98.7 to 99.0% at the AC section, and 98.4 to 98.6% at the PCC section indicating excellent repeatability. 7
13 The ARRB walking profiler had cross correlation values of 93.4 and 97.3% at the AC and PCC sections, respectively. The SSI walking profiler had cross correlation values of 90.9 and 84.7% at the AC and PCC sections, respectively. The Critical Profiler Accuracy Requirement report prepared by Karamihas indicates the average repeatability cross correlation value (IRI filtered) for a reference profiler should be at least (4) All three Surpro s achieved this value for repeatability at the AC as well as the PCC section. Lightweight Profiler The repeatability cross correlation values (IRI filtered) for the Ames lightweight profiler at both test sections are shown in table 10. Table 10 shows values for the TriOD and the RoLine sensor. The offset value computed by ProVAL for a pair of profiles was within ft (2.4 in). The revised AASHTO PP 49 indicates the average repeatability cross correlation (based on ten repeat runs) for an inertial profiler should be at least 92%. The lightweight profiler only made five repeat runs at the test sections. Based on the data collected for these five runs, both the TriOD and the RoLine sensors in the Ames lightweight profiler exceeded the value specified in the AASHTO standard at both test sections. The average repeatability cross correlation of the TriOD sensor at the AC and PCC sections was 98.4 and 97.4%, respectively; while the RoLine sensor had an average cross correlation of 99.0 and 99.1% at the AC and PCC sections, respectively. Table 10. Repeatability cross-correlation values for the lightweight profiler. Compared IRI Filtered Cross Correlation (%) Runs Asphalt Section Concrete Section Sensor Sensor TriOD RoLine TriOD RoLine Runs 1 & Runs 1 & Runs 1 & Runs 1 & Runs 2 & Runs 2 & Runs 2 & Runs 3 & Runs 3 & Runs 4 & Average
14 REPRODUCABILITY CROSS CORRELATION Among Reference Devices The reproducibility of the reference devices was evaluated by computing the IRI filtered cross correlation among the devices. ProVAL was used to perform computations with the IRI selected as the pre-processor filter. All combinations of runs for two devices were used in the computations. When performing reproducibility cross-correlations involving a Surpro, the 250 mm moving average should not be applied on the Surpro data. However, when cross correlation is performed using ProVAL either the 250 mm moving average has to be applied to both profiles or omitted from both profiles. ProVAL currently does not have an option where the moving average can be applied to one profile, but omitted from the other. For all device combinations that did not involve a Surpro, the 250 mm moving average filter was applied when computing cross correlations. For cases where cross correlation values were computed between two Surpro s, the 250 mm moving average filter was omitted. When crosscorrelations were computed for a Surpro and ARRB, the 250 mm moving average was not applied. (Note: The IRI computer code applies a moving average on the data only if the sampling interval is less than about 6.6 inches. Therefore, for ARRB data, the IRI filter does not apply the 250 mm moving average even if it is specified in ProVAL.) For cases where cross correlations were computed between a Supro and the SSI Walking profiler or the lightweight profiler, the 250 mm moving average was applied. For this case, the 250 mm moving average should only be applied to the SSI data, but because of the current limitation in ProVAL the moving average was applied to both devices. However, the effect on the computed cross correlation values between these two devices because of the adopted procedure when compared to the correct procedure is expected to be extremely small. As all of the reference devices started data collection at the start of each section, the offset that should be used in ProVAL for computing cross correlation should be zero. However, a slight shift in the profiles for two devices is possible because of: (1) slight variations in the paths followed by the devices, and/or (2) the actual sampling interval of the device being slightly different from the value specified in the ERD header. The shift between two profiles because of such an occurrence will increase with increasing distance. An evaluation of the effect of the magnitude of the offset value that is specified during cross correlation was performed by comparing the data collected by the ARRB walking profiler with other reference devices at the AC section. Cross correlation values were computed for offset values of 0, 1, and 2 ft, which were specified in ProVAL. The ARRB walking profiler was set as the reference device for all computations. The results of these computations are shown in the tables included in appendix C. These results show that a slight change in the offset of two profiles can have a significant effect on cross correlation. For example, for the comparison between the ARRB walking profiler (Device 1) and Wisconsin Surpro (Device 4), the average cross correlation when an offset of zero was specified was 85.6%; 9
15 but when an offset of 1 ft was specified the value was 91.4%. For the comparison between the ARRB walking profiler (Device 1) and SSI walking profiler (Device 5), the average cross correlation when an offset of zero was specified was 65.4%; but when an offset of 1 ft was specified the value was 75.5%. Following the procedure recommended in the revised AASHTO standard, an offset value of 3 ft was used in ProVAL for all reproducibility cross correlation (IRI filtered) computations. When performing cross correlation in ProVAL, one device has to be set as the reference, and the other device is compared to the reference. When the sampling interval of two devices is the same, choosing either device as the reference does not have any effect on the result. When the sampling intervals are different, the candidate profile is interpolated to the recording interval of the profile that is chosen as the reference profile after the IRI filter is applied. For this situation, slight differences in cross correlation values for two devices can occur depending on what profile is chosen as the reference. Hence, for cross correlations involving the ARRB walking profiler, two sets of cross correlations were performed, the first with the ARRB walking profiler considered as the reference, and the second where the other device was considered as the reference. As the sampling interval of the Surpro s and the SSI Walking Profiler are the same, such a procedure is not needed for cross correlations involving these devices. Appendix D and E include tables that show the results of the computations performed among devices at the AC section and the PCC section, respectively. For cases involving the ARRB walking profiler, slight differences (typically 1 to 2%) were noted in the cross correlation values for some cases depending on which device was chosen as the reference (i.e., ARRB walking profiler or the other device). The average cross correlation matrices for the devices at the AC and the PCC section are shown in tables 11 and 12. For cases involving the ARRB walking profiler, the average of the two cases (i.e., walking profiler as the reference, and other device as the reference) are shown. A cross correlation value greater than 95% can be considered to be excellent, while a cross correlation value between 90 and 95% can be considered as good. In a recent profiler comparison, Karamihas used these same thresholds when evaluating profiler repeatability. (2) Cross correlation values that are 90% or higher are shown in bold in tables 11 and 12. Table 11. Average reproducibility cross correlation values (IRI filtered) AC section. ARRB Surpro Surpro Surpro Walking Wide ICC Wisconsin Profiler Tire (Device 1) (Device 2) (Device 3) (Device 4) ARRB Walking Profiler (Device 1) Surpro Wide Tire (Device 2) 92.5 Surpro ICC (Device 3) Surpro Wisconsin (Device 4) SSI Walking Profiler (Device 5)
16 Table 12. Average reproducibility cross correlation values (IRI filtered) PCC section. ARRB Walking Profiler (Device 1) Surpro Wide Tire (Device 2) 94.6 Surpro ICC (Device 3) ARRB Surpro Surpro Surpro Walking Wide ICC Wisconsin Profiler Tire (Device 1) (Device 2) (Device 3) (Device 4) Surpro Wisconsin (Device 4) SSI Walking Profiler (Device 5) The following observations were noted for reproducibility cross correlations: The reproducibility cross correlations among the three Surpro s ranged from 97.3 to 98.7% at the AC section, and from 98.2 to 98.5% at the PCC section. The cross correlations between the Surpro s and the ARRB walking profiler ranged from 90.8 to 92.9% at the AC section and from 93.6 to 95.1% at the PCC section. The SSI walking profiler and the ARRB walking profiler had a cross correlation of 77.4 and 78.5 % at the AC and the PCC sections, respectively. The SSI walking profiler and the three Surpro s had cross correlation values ranging from 88.6 to 89.2% at the AC section and 83.5 to 84.8% at the PCC section. The University of Michigan Transportation Research Institute has software that can compute cross correlations by applying the 250 mm moving average on one data set while omitting it from the other data set. This program was used to compute the average reproducibility cross correlation values (IRI filtered) between the SSI device and the three Surpro s at the AC section by applying the 250 mm moving average on the SSI data while omitting it from the Surpro data. The computed average cross correlation values between the SSI Walking Profiler and Surpro Wide Tire (Device 2), Surpro-ICC (Device 3), and Surpro - Wisconsin (Device 5) were 88.5, 88.9, and 89.2%, respectively. These values were similar to the values computed in this study where the 250 mm moving average was applied on both data sets. Lightweight Profiler and Reference Devices ProVAL was used to compute the reproducibility cross correlation values (IRI filtered) for: (1) data collected from the TriOD and RoLine sensors of the Ames profiler, and (2) data collected from the TriOD and RoLine sensors with each of the reference devices. In ProVAL the preprocessor filter was selected as IRI, and the 250 mm moving average filter was applied on the data. 11
17 The computed cross correlation values for the two sensors of the lightweight profiler for the various run combinations are shown in table 13. The overall average reproducibility cross correlation between the TriOD sensor data and RoLine sensor data was 97.3% for the AC section and 96.7% for the PCC section. Table 13. Reproducibility cross correlation (IRI filtered) for data collected by the TriOD and the RoLine sensor. Section RoLine Cross Correlation (IRI filtered) % Sensor TriOD Sensor Run Run Asphalt Concrete Both sensors of the lightweight profiler showed excellent repeatability at both test sections (see table 10). The average repeatability cross correlations at the AC section for the TriOD sensor and the RoLine sensor were 98.4 and 99.0% respectively, while at the PCC section the values were 97.4 and 99.1% respectively. Hence, one run from the Ames profiler was used to compute cross correlation values with the reference devices, as using all runs in the computations would not yield any additional information. Run 1 of the lightweight profiler was cross correlated with the repeat runs of each reference device at both test sections, with the reference device assigned to be the reference in ProVAL. The computed cross correlation values for the TriOD sensor and RoLine sensor are shown in table 14 and 15, respectively. Average cross correlation values of 90% or greater are shown in bold in both tables. Performing cross correlations for the same combinations with the lightweight profiler assigned as the reference in ProVAL instead of the reference device yielded the same cross correlation values except for some cases there was a difference of up to 1%. The following observations were noted for the average reproducibility cross correlation (IRI filtered) between data collected by the TriOD sensor of the lightweight profiler and reference devices: Cross correlation with the three Surpro s ranged from 94.7 to 96.7% at the AC section, while at the PCC section the cross correlations ranged from 97.4 to 97.8%. Cross correlation with the ARRB walking profiler was 89.9 and 93.5% at the AC and PCC sections, respectively. 12
18 Cross correlation with the SSI walking profiler was 85.8 and 83.2% at the AC and PCC sections, respectively. Table 14.Cross correlation values (IRI filtered) between Ames lightweight profiler (TriOD sensor) and reference devices. Surface Device Device Cross Correlation with TriOD (%) Type No Run 1 Run 2 Run 3 Average Asphalt 1 ARRB Walking Profiler Wide Tire Surpro Surpro - ICC Surpro - Wisconsin SSI Walking Profiler Concrete 1 ARRB Walking Profiler Wide Tire Surpro Surpro - ICC Surpro - Wisconsin SSI Walking Profiler Table 15. Cross correlation values (IRI filtered) between Ames lightweight profiler (RoLine sensor) and reference devices. Surface Device Device Cross Correlation with RoLine (%) Type No Run 1 Run 2 Run 3 Average Asphalt 1 ARRB Walking Profiler Wide Tire Surpro Surpro - ICC Surpro - Wisconsin SSI Walking Profiler Concrete 1 ARRB Walking Profiler Wide Tire Surpro Surpro - ICC Surpro - Wisconsin SSI Walking Profiler The following observations were noted for the average reproducibility cross correlation (IRI filtered) between the data collected by the RoLine sensor of the lightweight profiler and reference devices: Cross correlation for the Surpro s ranged from 97.1 to 98.4% at the AC section and 96.8 to 97.8% at the PCC section. Cross correlation with the ARRB walking profiler was 93.9 and 96.4% at the AC and PCC sections, respectively. 13
19 Cross correlation with the SSI walking profiler was 87.8 and 83.0% at the AC and PCC sections, respectively. PROFILE PLOTS The profile plots of data collected by all devices are included in appendix F. For each device, separate plots are presented for the AC and the PCC section. Each plot shows the data for all repeat runs of a device. Generally, the repeat runs collected by a device overlaid well with each other, except for the data collected by the SSI walking profiler. The ability of a reference device to collect repeatable profile data at a test section was evaluated by computing the cross correlation values for the elevation data that were collected for the repeat runs. The cross correlation computed using this procedure is a measure of the overall agreement between two profiles. For this computation the Pre-Processor filter in ProVAL set as "None". The computed cross correlation values are shown in tables 16 and 17 for the AC and the PCC sections, respectively. Cross correlation values over 95% are shown in bold. Table 16. Repeatability cross correlation of elevation profiles for reference devices AC section. Device Device Elevation Cross Correlation (%) No Run 1 & 2 Run 1 & 3 Run 2 & 3 Average 1 ARRB Walking Profiler Surpro - Wide Tire Surpro - Normal Tire (ICC) Surpro - Normal Tire (WI) SSI - Walking Profiler Table 17. Repeatability cross correlation of elevation profiles for reference devices PCC section. Device Device Elevation Cross-Correlation (%) No Run 1 & 2 Run 1 & 3 Run 2 & 3 Average 1 ARRB Walking Profiler Surpro - Wide Tire Surpro - Normal Tire (ICC) Surpro - Normal Tire (WI) SSI - Walking Profiler The average cross correlations were over 97% for all devices, except for the SSI walking profiler. For the SSI walking profiler, profile differences in run 3 when compared to runs 1 and 2 resulted in a low average cross correlation at the AC section. At the PCC section for this device profile differences in run 1 when compared to runs 2 and 3 resulted in a low cross correlation. The elevation at the end of the section should be the same for all of the reference devices if they were all collecting true profile data, as the elevation at the start of the section is zero for all devices. (Note: The slight differences in lengths profiled by the various devices should have a negligible effect on the elevation at the end of the section.) 14
20 Table 18 shows the elevation at the end of the section that was indicated in the data file for all repeat runs of the reference devices at both test sections. Generally, the elevations at the end of the section of the repeat runs were close to each other (within 0.5 inches), except for the SSI walking profiler runs at the PCC section. However, there were differences in elevations at the end of the section that were recorded by the different devices. Table 18. Elevation at the end of the section for reference devices. Surface Device Device Elevation at the End of the Section (in) Type No Run 1 Run 2 Run 3 AC 1 ARRB Walking Profiler Wide Tire Surpro Surpro ICC Surpro Wisconsin SSI Walking Profiler PCC 1 ARRB Walking Profiler Wide Tire Surpro Surpro ICC Surpro Wisconsin SSI Walking Profiler Minnesota DOT obtained rod and level measurements at the two test sections at 10 ft intervals on October 20 th, Assuming an elevation of 0 at the start of the section, the rod and level data indicated that the elevation at 500 ft at the AC section was inches, while the elevation at 530 ft at the PCC section was inches. The difference in elevation at the end of each section between the rod and level data and the reference device data are shown in table 19. The last reading obtained by a device at a section may not have coincided with the location where the rod and level elevation was obtained, but these locations should be very close to each other. Device 4 (Surpro-Wisconsin) and Device 3 (Surpro-ICC) had the closest match with the rod and level elevations at the end of the section for the AC and PCC section respectively. Significant elevation differences were seen at both test sections for the SSI walking profiler. Although there were differences in the reported elevation at the end of the section among the devices, in most cases the IRI values and cross correlation (IRI filtered) for two devices were very close to each other. Consider the data collected for run 1 at the PCC section by Device 2 (wide tired Surpro) and Device 4 (Wisconsin Surpro). The elevation at the end of the section for Devices 2 and 4 for this run are and inches, respectively. The IRI values for this run for Device 2 and 4 are 76.9 and 77.9 in/mi, respectively. The cross correlation (IRI filtered) for these two runs is 98.2%. For the considered runs, the IRI values and the cross correlation values (IRI filtered) are very close to each other, even though the difference in elevation at the end of the section for the two profiles is 1.8 inches. This happens because the IRI is influenced by slopes of adjacent points. 15
21 Table 19. Difference in elevation at the end of the section between rod and level data and reference device data. Surface Device Device Difference in Elevation at End of the Section (in) Note 1 Type No Run 1 Run 2 Run 3 Average AC 1 ARRB Walking Profiler Wide Tire Surpro Surpro ICC Surpro Wisconsin SSI Walking Profiler PCC 1 ARRB Walking Profiler Wide Tire Surpro Surpro ICC Surpro Wisconsin SSI Walking Profiler Note 1: Difference in Elevation = Elevation obtained by rod and level - Elevation obtained by reference device Differences in elevation profiles of two reference devices can occur if there is a constant error per reading for readings obtained by a reference device. This phenomenon is illustrated by using data obtained from a Dipstick, which is a reference profiling device that obtains data at 1 ft intervals. This data is from a previous study, and was not obtained at the test sections used in this study. Table 20 shows the following for data obtained from a Dipstick: column 1 reading number, column 2 distance from the start of the section, column 3 reading obtained by the Dipstick (which is the elevation difference between adjacent points), and column 4 elevation at that location (elevation at distance 0 is 0, at 1 ft elevation is 0 plus the first reading, elevation at 2 ft is the elevation at 1 ft plus the 2 nd reading etc). Only the data up to a distance of 15 ft are shown in this table. The elevation profile is hereafter referred to as the correct profile. Table 21 shows the same data that is shown in table 20, but with a constant error of 0.04 inches per reading. Table 21 shows the following items: column 1 reading number, column 2 distance from the start of the section, column 3 correct reading that should have been obtained (this is the reading shown in column 3 in table 20), column 4 the constant error in each reading, column 5 the recorded reading (correct reading shown in column 3 + constant error shown in column 4), column 6 the erroneous elevation (elevation at distance of 0 is 0, at 1 ft elevation is 0 plus the first recorded reading, elevation at 2 ft is the elevation at 1 ft plus the 2 nd recorded reading etc). Only the data up to a distance of 15 ft is shown in this table. The elevation profile obtained is referred to as the Erroneous Profile. 16
22 Table 20. Dipstick readings. Reading No. Distance Reading Elevation (in) (in) (1) (2) (3) (4) Table 21. Dipstick readings with a constant error for each reading. Reading No. Distance Correct Constant Recorded Elevation Reading Error Reading (in) (in) (in) (in) (1) (2) (3) (4) (5) (6)
23 The correct and the erroneous profiles are shown in figure 1. The IRI of the correct and the erroneous profiles are both 56 in/mi. The cross correlation value (IRI filtered) of these two profiles is 99.9%. The constant error per reading that is present in the erroneous profile superimposes a profile having a constant slope into the correct profile, which has no effect on the IRI. This is the reason why the IRI and the cross-correlation values (IRI filtered) were identical for the correct and the erroneous profiles. Figure 1. Correct and erroneous Dipstick profiles. This theoretical analysis indicated that a reference device may be able to collect data that are sufficient for computing the IRI accurately, but may not collect the actual elevation profile of the pavement. ADJUSTED ARRB WALKING PROFILER MEASUREMENTS After the rod and level measurements were obtained, Minnesota DOT adjusted the elevations of the ARRB Walking Profiler readings using the rod and level data. This adjustment was performed because the elevations obtained by the ARRB Walking Profiler tend to differ from the true elevation as the profiler traverses the test section. The elevation at the end of the section for the three repeat runs was the same in the adjusted data files at each test section. The average repeatability cross correlation values (IRI filtered) for the adjusted ARRB data at both sections were similar to those obtained for the unadjusted data. The average reproducibility cross correlation values (IRI filtered) of the adjusted ARRB data with the other reference devices were similar to the values obtained for the unadjusted data at both test sections. CONCLUSIONS The weather conditions during testing were less than ideal. There was no rain during testing, but there was a mist that was generally present throughout the testing, and varied from light to 18
24 heavy. The pavement was damp, but did not have any standing water. It was a windy day, with high humidity, and the temperature being about 40 to 45 F. The IRI values obtained by all devices were close to each other at both test sections. At the AC section, the SSI walking profiler had the lowest average IRI (87.6 in/mi), while the Surpro Normal Tire (WI) had the highest average IRI (90.6 in/mi). At the PCC section, the ARRB walking profiler had the lowest average IRI (75.7 in/mi), while the Surpro Normal Tire (WI) had the highest average IRI (78.1 in/mi). The Critical Profiler Accuracy Requirements report prepared by Karamihas indicated that the repeat runs of a reference profiler must have an average cross correlation (IRI filtered) of at least (4) All three Surpro s achieved this target at the AC as well as the PCC section. The ARRB walking profiler had average repeatability cross correlation values of 93.4 and 97.3% at the AC and PCC sections, respectively. The SSI walking profiler had average repeatability cross correlation values of 90.9 and 84.7% at the AC and PCC sections, respectively. Minnesota DOT indicated during their 2006 certification program the ARRB Walking Profiler obtained repeatability cross correlation values of 98.3% and 98.4% at the AC and PCC sections respectively. They indicated when operating the ARRB Walking Profiler on damp pavements there is a possibility of dirt adhering to the footpad, which can adversely affect the quality of the data. They feel that the damp pavement conditions during data collection probably was a contributing factor that resulted in the ARRB obtaining lower cross correlation values during this test when compared to their 2006 certification values. For the Ames lightweight profiler, the average repeatability cross correlation (IRI filtered) of the data collected by the TriOD sensor at the AC and the PCC sections was 98.4 and 97.4% respectively; while the data collected by the RoLine sensor had an average cross correlations of 99.0 and 99.1% at the AC and PCC sections respectively. The revised AASHTO PP 49 indicates the average repeatability cross correlation for an inertial profiler should be at least 92%. Data collected by both the TriOD and the RoLine sensors in the Ames lightweight profiler exceeded this specified value at both test sections. The reproducibility cross correlations (IRI filtered) among the three Surpro s exceeded 97% at both sections, indicating excellent reproducibility among the three devices. The reproducibility cross correlations (IRI filtered) between the Surpro s and the ARRB walking profiler ranged from 90.8 to 92.9% at the AC section and from 93.6 to 95.1% at the PCC section indicating good reproducibility. The SSI walking profiler and the ARRB walking profiler had reproducibility cross correlation (IRI filtered) values of 77.4 and 78.5 % at the AC and the PCC sections, respectively. The SSI walking profiler and the three Surpro s had reproducibility cross correlation (IRI filtered) values ranging from 88.6 to 89.2% at the AC section, and values ranging from 83.5 to 84.8% at the PCC section. The average reproducibility cross correlation (IRI filtered) for data collected by the TriOD and the RoLine sensors in the Ames lightweight profiler was 97.3% and 96.7% for the AC and the PCC section respectively. 19
25 The data from the TriOD sensor of the lightweight profiler exhibited the following reproducibility cross correlations (IRI filtered): (1) excellent reproducibility with all three Surpro s, with the average cross correlation ranging from 94.7 to 96.7% at the AC section, while at the PCC section the cross correlations ranged from 97.4 to 97.8%, (2) good cross correlation with the ARRB walking profiler with cross correlation values of 89.9 and 93.5% at the AC and PCC sections respectively, (3) inadequate cross correlation with the SSI walking profiler with cross correlation values of 85.8 and 83.2% at the AC and PCC sections respectively. The revised AASHTO PP 49 indicates the average reproducibility (IRI filtered) between a reference device and an inertial profiler should be 90% or greater. The data from the RoLine sensor of the lightweight profiler exhibited the following reproducibility cross correlation (IRI filtered): (1) excellent reproducibility with all three Surpro s with cross correlations ranging from 97.1 to 98.4% at the AC section and 96.8 to 97.8% at the PCC sections, (2) good reproducibility at the AC section and excellent reproducibility at the PCC section with the ARRB walking profiler with average cross correlation values of 93.9 and 96.4% at the AC and PCC sections respectively, and (3) inadequate cross correlation with the SSI walking profiler with cross correlation values of 87.8 and 83.0% at the AC and PCC sections, respectively. The elevations recorded by the various reference devices at the end of the section were different. A theoretical study showed that a reference device may be able to collect data needed for computing the IRI accurately, but yet may not collect the correct elevation profile of the section. Such a device will be valid for collecting data that are accurate enough for computing the IRI and performing IRI filtered cross correlations, but not for obtaining an accurate elevation profile of the pavement. The path to be measured in this study at each section was marked with a continuous paint line. The reference profilers may not achieve the obtained repeatability or reproducibility when testing is performed under different conditions, for example, staggered paint marks or no markings. The Ames lightweight profiler used a guidance system to maintain a consistent path. The lightweight profiler may not obtain similar repeatability and reproducibility values if testing is performed without the guidance system. The IRI values obtained by the Wisconsin DOT Surpro Walking profiler were within 3 in/mile of the IRI values obtained by the other reference devices at both test sections, and within 2 in/mile of the IRI values obtained by both sensors of the lightweight profiler at both test sections. The Wisconsin DOT walking profiler showed excellent repeatability with average cross correlation values (IRI filtered) of 97.8 and 98.4% at the AC and the PCC sections, respectively. The device showed excellent reproducibility with the other two Surpro devices (i.e., Surpro ICC and Wide Tired Surpro). The average reproducibility cross correlation values at the AC and PCC section with the Surpro-ICC were 98.1 and 98.5%, respectively, while the values with the with the wide tired Surpro at the AC and PCC sections were 97.3 and 98.2%, respectively. The device also exhibited good reproducibility with the ARRB Walking Profiler with average cross correlation values of 90.8 and 93.6% at the AC and PCC sections, respectively. The device also showed excellent reproducibility with the data collected by the TriOD and the RoLine sensors of the lightweight profiler. The average reproducibility cross correlation values with the TriOD 20
26 sensor data were 94.7 and 97.4% at the AC and PCC sections respectively, while the values for data collected with the RoLine sensor at the AC and PCC sections were 97.1 and 96.8%, respectively. REFERENCES 1. ProVAL, Profiler Viewing and Analysis Software, Version Karamihas, S.M., 2005 ACPA Profiler Repeatability Tests, University of Michigan Transportation Research Institute Report UMTRI , Karamihas, S.M., Development of Cross Correlation for Objective Comparison of Profiles, International Journal of Vehicle Design, Vol. 36, Nos. 2/3, Karamihas, S.M., Critical Profiler Accuracy Requirements, University of Michigan Transportation Research Institute Report UMTRI , Karamihas, S.M., Assessment of Profiler Performance for Construction Quality Control: Phase I, University of Michigan Transportation Research Institute Report UMTRI Revised Standard Practice for Certification of Inertial Profiling Systems, AASHTO Designation: PP
27 APPENDIX A: PHOTOGRAPHS OF REFERENCE DEVICES 22


28 ARRB walking profiler. ICC Surpro normal tire. 23


.")
29 ICC Surpro normal tire (close-up view). ICC Surpro wide tire. 24


30 ICC Surpro wide tire (close-up view). SSI walking profiler. 25


31 Ames lightweight profiler with guidance system. RoLine and TriOD sensors mounted on the Ames lightweight profiler. 26


32 Sensor footprint of the RoLine and TriOD sensors. 27
33 APPENDIX B: PHOTOGRAPHS OF THE PAVEMENT SURFACE 28


34 Concrete section. Asphalt section. 29
State of Nevada Department of Transportation Materials Division
 State of Nevada Department of Transportation Materials Division METHOD OF TEST FOR EVALUATION OF PAVEMENT RIDE QUALITY USING INERTIAL PROFILING SYSTEMS SCOPE This test method describes the procedure used
OPERATING INERTIAL PROFILERS AND EVALUATING PAVEMENT PROFILES
 Test Procedure for OPERATING INERTIAL PROFILERS AND EVALUATING PAVEMENT TxDOT Designation: Tex-1001-S Effective Date: January 2017 1. SCOPE 1.1 This test method: covers use of an inertial profiler for
Real-Time Smoothness Measurements on Concrete Pavements During Construction
 Recommended Practice for Real-Time Smoothness Measurements on Concrete Pavements During Construction XX-## (2017) 1. SCOPE 1.1. This document provides language that can be used by an Owner-Agency to develop
Assessment of Profiler Performance for Construction Quality Control: Phase I
 Assessment of Profiler Performance for Construction Quality Control: Phase I FINAL DRAFT Steven M. Karamihas and Thomas D. Gillespie, Ph.D. SPONSORED BY American Concrete Pavement Association Skokie, IL
Item 585 Ride Quality for Pavement Surfaces
 Item 585 Ride Quality for Pavement Surfaces 1. DESCRIPTION 2. EQUIPMENT Measure and evaluate the ride quality of pavement surfaces. 2.1. Surface Test Type A. Provide a 10-ft. straightedge or where allowed,
Tex-1001-S, Operating Inertial Profilers and Evaluating Pavement Profiles. Chapter 10 Special Procedures. Overview
 Overview Effective dates: August 2002 October 2004. Test Method Tex-1001-S covers use of an inertial profiler to implement Special Specifications 5440 and 5880 for ride quality measurements using Surface
Chapter 3 Tex-1001-S, Operating Inertial Profilers and Evaluating Pavement Profiles
 Chapter 3 Tex-1001-S, Operating Inertial Profilers and Evaluating Pavement Profiles Contents: Section 1 Overview... 3-3 Section 2 Apparatus... 3-4 Section 3 Repair and Adjustment of Inertial Profilers...
Evaluating the Design Safety of Highway Structural Supports
 Evaluating the Design Safety of Highway Structural Supports by Fouad H. Fouad and Elizabeth A. Calvert Department of Civil and Environmental Engineering The University of Alabama at Birmingham Birmingham,
MnROAD Mainline IRI Data and Lane Ride Quality MnROAD Lessons Learned December 2006
 MnROAD Mainline IRI Data and Lane Ride Quality December 2006 Derek Tompkins, John Tweet, Prof. Lev Khazanovich University of Minnesota MnDOT Contacts: Bernard Izevbekhai, Tim Clyne 1 Abstract Since 1994,
(PLANT MIXED ASPHALT PAVEMENT (MSCR)). REVISED 02/03/17 DO NOT REMOVE THIS. IT NEEDS TO STAY IN FOR THE CONTRACTORS.
). REVISED 02/03/17 DO NOT REMOVE THIS. IT NEEDS TO STAY IN FOR THE CONTRACTORS.") S-1 (2399) PAVEMENT SURFACE SMOOTHNESS Use this with SP2016-115 (CONCRETE PAVEMENT) (unless it s an alternate job) and SP2016-137.1 (PLANT MIXED ASPHALT PAVEMENT (MSCR)). REVISED 02/03/17 DO NOT REMOVE
S-1 (2399) PAVEMENT SURFACE SMOOTHNESS Use this with SP2016-115 (CONCRETE PAVEMENT) (unless it s an alternate job) and SP2016-137.1 (PLANT MIXED ASPHALT PAVEMENT (MSCR)). REVISED 02/03/17 DO NOT REMOVE
Dual Line Laser Benchmark Road Profiler
 Roadbot Dual Line Laser Benchmark Road Profiler Paul Toom P. Eng. MBA ICC, Cherry Systems Glenn Hennin LMI3D Presented at RPUG 2015 2-5 November 2015 Raleigh NC 1 Presentation Overview Introduction of
Using Real-Time Smoothness Measurements to Improve the Initial Smoothness of Portland Cement Concrete Pavement SHRP2 Solutions Webinar 13 November
 Using Real-Time Smoothness Measurements to Improve the Initial Smoothness of Portland Cement Concrete Pavement SHRP2 Solutions Webinar 13 November 2017 Webinar Agenda Introduction by FHWA Session 1: Fundamentals
A Traffic Operations Method for Assessing Automobile and Bicycle Shared Roadways
 A Traffic Operations Method for Assessing Automobile and Bicycle Shared Roadways A Thesis Proposal By James A. Robertson Submitted to the Office of Graduate Studies Texas A&M University in partial fulfillment
Investigating the effects of interchanging components used to perform ripple assessments on calibrated vector network analysers
 Abstract Investigating the effects of interchanging components used to perform ripple assessments on calibrated vector network analysers Andrew G Morgan and Nick M Ridler Centre for Electromagnetic and
Kentucky Transportation Center
 Kentucky Transportation Center TECHNICAL ASSISTANCE REPORT Forensic Pavement Evaluation for US 31 W, Jefferson County, Kentucky KTC TA-15 02/KH91 14 1F DOI: http://dx.doi.org/10.13023/ktc.ta.2015.02 Author(s):
Study of the Effects of Buried Pipe Integrity on Roadway Subsidence
 Pipe-RU6558 Study of the Effects of Buried Pipe Integrity on Roadway Subsidence FINAL REPORT October 2005 Submitted by Dr. Husam Najm * Professor Dr. Ali Maher * Professor/Director Dr. Nenad Gucunski *
Safety Assessment of Installing Traffic Signals at High-Speed Expressway Intersections
 Safety Assessment of Installing Traffic Signals at High-Speed Expressway Intersections Todd Knox Center for Transportation Research and Education Iowa State University 2901 South Loop Drive, Suite 3100
POWER Quantifying Correction Curve Uncertainty Through Empirical Methods
 Proceedings of the ASME 2014 Power Conference POWER2014 July 28-31, 2014, Baltimore, Maryland, USA POWER2014-32187 Quantifying Correction Curve Uncertainty Through Empirical Methods ABSTRACT Christopher
Wade Reynolds 1 Frank Young 1,2 Peter Gibbings 1,2. University of Southern Queensland Toowoomba 4350 AUSTRALIA
 A Comparison of Methods for Mapping Golf Greens Wade Reynolds 1 Frank Young 1,2 Peter Gibbings 1,2 1 Faculty of Engineering and Surveying 2 Australian Centre for Sustainable Catchments University of Southern
Saturated-Unsaturated Consolidation
 Introduction Saturated-Unsaturated Consolidation This example looks at the volume change behavior of a saturated-unsaturated column under loading, wetting and drying conditions. Feature Highlights GeoStudio
Desktop Reference for Crash Reduction Factors
 Page 68 Desktop Reference for Crash Reduction Factors Report No. FHWA-SA-07-015 U.S. Department of Transportation Federal Highway Administration September 2007 Page 69 THIS PAGE LEFT INTENTIONALLY BLANK
An Overview of Mn/DOT s Pavement Condition Rating Procedures and Indices (September 2015)
") An Overview of Mn/DOT s Pavement Condition Rating Procedures and Indices (September 2015) Equipment Mn/DOT currently collects pavement condition data using a Pathway Services, Inc. Digital Inspection Vehicle
An Overview of Mn/DOT s Pavement Condition Rating Procedures and Indices (September 2015) Equipment Mn/DOT currently collects pavement condition data using a Pathway Services, Inc. Digital Inspection Vehicle
Examples of Carter Corrected DBDB-V Applied to Acoustic Propagation Modeling
 Naval Research Laboratory Stennis Space Center, MS 39529-5004 NRL/MR/7182--08-9100 Examples of Carter Corrected DBDB-V Applied to Acoustic Propagation Modeling J. Paquin Fabre Acoustic Simulation, Measurements,
An Overview of Mn/DOT s Pavement Condition Rating Procedures and Indices (March 27, 2003)
") An Overview of Mn/DOT s Pavement Condition Rating Procedures and Indices (March 27, 2003) Equipment Mn/DOT currently collects pavement condition data using a Pathway Services, Inc. Video Inspection Vehicle
An Overview of Mn/DOT s Pavement Condition Rating Procedures and Indices (March 27, 2003) Equipment Mn/DOT currently collects pavement condition data using a Pathway Services, Inc. Video Inspection Vehicle
Driveway Design Criteria
 Design Manual Chapter 5 - Roadway Design 5L - Access Management 5L-4 Driveway Design Criteria A. General For efficient and safe operations, access drives and minor public street intersections can be improved
Roadway Design Manual
 Roadway Design Manual Manual Notice Archive by Texas Department of Transportation (512) 302-2453 all rights reserved Manual Notice 2009-1 From: Manual: Mark A. Marek, P.E Roadway Design Manual Effective
Texas Transportation Institute The Texas A&M University System College Station, Texas
 1. Report No. FHWA/TX-05/0-4084-P1 4. Title and Subtitle GUIDELINES FOR THE USE OF COUNTERMEASURES TO REDUCE CRASHES ON APPROACHES TO SIGNALIZED INTERSECTIONS NEAR VERTICAL CURVES 2. Government Accession
Paper 2.2. Operation of Ultrasonic Flow Meters at Conditions Different Than Their Calibration
 Paper 2.2 Operation of Ultrasonic Flow Meters at Conditions Different Than Their Calibration Mr William Freund, Daniel Measurement and Control Mr Klaus Zanker, Daniel Measurement and Control Mr Dale Goodson,
Analysis of Shear Lag in Steel Angle Connectors
 University of New Hampshire University of New Hampshire Scholars' Repository Honors Theses and Capstones Student Scholarship Spring 2013 Analysis of Shear Lag in Steel Angle Connectors Benjamin Sawyer
Crash Analysis of I-64 Closure in St. Louis County
 Report # MATC-MST: 341 Final Report 25-1121-0001-341 Crash Analysis of I-64 Closure in St. Louis County Ghulam H. Bham, Ph.D. Professor Department of Civil, Architectural, and Environmental Engineering
Correcting the Ice Draft Data from the SCICEX '98 Cruise
 Approved for public release; distribution is unlimited. Correcting the Ice Draft Data from the SCICEX '98 Cruise by S. Dickinson, M. Wensnahan, G. Maykut, and D. Rothrock Technical Memorandum APL-UW TM
Spatial Methods for Road Course Measurement
 Page 1 of 10 CurtinSearch Curtin Site Index Contact Details Links LASCAN Spatial Sciences WA Centre for Geodesy COURSE MEASUREMENT This page is a summary of results of some of the research we have recently
Overview. 2 Module 13: Advanced Data Processing
 2 Module 13: Advanced Data Processing Overview This section of the course covers advanced data processing when profiling. We will discuss the removal of the fairly gross effects of ship heave and talk
FLORIDA DEPARTMENT OF TRANSPORTATION
 FLORIDA DEPARTMENT OF TRANSPORTATION FLEXIBLE PAVEMENT CONDITION SURVEY HANDBOOK March 2012 STATE MATERIALS OFFICE Table of Contents Title Page List of Tables... i List of Figures... ii Executive Summary...
KENTUCKY TRANSPORTATION CENTER
 Research Report KTC-08-28/FR165-07-1F KENTUCKY TRANSPORTATION CENTER MONITORING CULVERT LOAD WITH SHALLOW FILLING UNDER GEOFOAM AREAS OUR MISSION We provide services to the transportation community through
GUIDELINES FOR USING DECISION SIGHT DISTANCE AT IGNALIZED INTERSECTIONS NEAR VERTICAL CURVES
 1. Report No. FHWA/TX-05/0-4084-P2 4. Title and Subtitle 2. Government Accession No. 3. Recipient's Catalog No. GUIDELINES FOR USING DECISION SIGHT DISTANCE AT IGNALIZED INTERSECTIONS NEAR VERTICAL CURVES
29th Monitoring Research Review: Ground-Based Nuclear Explosion Monitoring Technologies
 IMPROVED CALIBRATION AND OPERATION OF A STABLE-GAS QUANTIFICATION MANIFOLD AS PART OF A RADIOXENON COLLECTION SYSTEM ABSTRACT Richard M. Williams, James C. Hayes, and Randy R. Kirkham Pacific Northwest
Evaluation of Construction-Zone Pavement Marking Materials
 Transportation Kentucky Transportation Center Research Report University of Kentucky Year 1987 Evaluation of Construction-Zone Pavement Marking Materials Kenneth R. Agent Jerry G. Pigman University of
Recommendations for the Risk Assessment of Buffer Stops and End Impact Walls
 Recommendations for the Risk Assessment of Buffer Stops and End Synopsis This document gives details of a recommended method which, if followed, would meet the requirements of section 11, Buffer Stops
RSKtools for Matlab processing RBR data
 Table of Contents Introduction... 1 RSKtools help... 1 Getting set up... 1 Remove atmospheric pressure from measured total pressure... 2 Correct for A2D zero-order hold... 2 Low-pass filtering... 3 Alignment
Safety Impacts: Presentation Overview
 Safety Impacts: Presentation Overview The #1 Theme How Access Management Improves Safety Conflict Points The Science of Access Management By Treatment Studies Themes for Texas Access Management Improve
Evaluation of a Combined Bicycle Lane/Right Turn Lane in Eugene, Oregon
 Evaluation of a Combined Bicycle Lane/Right Turn Lane in Eugene, Oregon PUBLICATION NO. FHWA-RD-00-151 August 2000 U.S. Department of Transportation Federal Highway Administration Research and Development
CORESTA RECOMMENDED METHOD N 6
 CORESTA RECOMMENDED METHOD N 6 DETERMINATION OF VENTILATION DEFINITIONS AND MEASUREMENT PRINCIPLES (2015 Revision September 2016) 1. SCOPE This CORESTA Recommended Method specifies a method for the determination
DISTRIBUTION: Electronic Recipients List TRANSMITTAL LETTER NO. (13-01) MINNESOTA DEPARTMENT OF TRANSPORTATION. MANUAL: Road Design English Manual
 MINNESOTA DEPARTMENT OF TRANSPORTATION. MANUAL: Road Design English Manual") DISTRIBUTION: Electronic Recipients List MINNESOTA DEPARTMENT OF TRANSPORTATION DEVELOPED BY: Design Standards Unit ISSUED BY: Office of Project Management and Technical Support TRANSMITTAL LETTER NO.
DISTRIBUTION: Electronic Recipients List MINNESOTA DEPARTMENT OF TRANSPORTATION DEVELOPED BY: Design Standards Unit ISSUED BY: Office of Project Management and Technical Support TRANSMITTAL LETTER NO.
September Reporting on Work Plan 95-R-15 Final Report. Prepared by: Reviewed by:
 Recessed Thermoplastic Pavement Markings Montpelier, Vermont September 2002 Reporting on Work Plan 95-R-15 Final Report State of Vermont Agency oftransportation Materials and Research Prepared by: Theresa
ASPHALT PAVING LEVEL 1
 ASPHALT PAVING LEVEL 1 Module 3: Yield Calculations: Tack Coat and Mix Spread Rate FDOT Course Module 3 1 Welcome the students to the third module in this course that covers tack coat and mix spread rates,
Geometric Design Tables
 Design Manual Chapter 5 - Roadway Design 5C - Geometric Design Criteria 5C-1 Geometric Design Tables A. General The following sections present two sets of design criteria tables - Preferred Roadway Elements
Viva TPS. TS11/15 Total Stations Check and Adjust Procedure. October Summary
 Viva TPS October 2010 TS11/15 Total Stations Summary Leica builds total stations to the highest quality and calibrates each instrument before it leaves the Factory. After the instrument is shipped or used
SPECIFIC FACTORS THAT MAY AFFECT PROFILES
 58 CHAPTER 4 SPECIFIC FACTORS THAT MAY AFFECT PROFILES 4.1 INTRODUCTION In reviewing the Phase I study results, the panel members raised various concerns, such as the accuracy needed for the transverse
Analysis of the Article Entitled: Improved Cube Handling in Races: Insights with Isight
 Analysis of the Article Entitled: Improved Cube Handling in Races: Insights with Isight Michelin Chabot (michelinchabot@gmail.com) February 2015 Abstract The article entitled Improved Cube Handling in
Continuous Gas Analysis In situ laser gas analyzers TÜV and MCERTS add-on for LDS 6 operating instructions Compact Operating Instructions
 Continuous Gas Analysis In situ laser gas analyzers Compact Operating Instructions 1 LDS 6 TÜV/MCERTS certified analyzers for NH3/H2O, NH3 and H2O 1.1 Operation requirements Please observe the following:
Strategic Research PROGRAM FOLLOW-UP ASSESSMENT OF THE MOBILEYE SHIELD+ COLLISION AVOIDANCE SYSTEM
 165610-1 Strategic Research PROGRAM FOLLOW-UP ASSESSMENT OF THE MOBILEYE SHIELD+ COLLISION AVOIDANCE SYSTEM March 2017 1. Report No. TTI/SRP/17/165610-1 2. Government Accession No. 3. Recipient's Catalog
DOT HS September Crash Factors in Intersection-Related Crashes: An On-Scene Perspective
 DOT HS 811 366 September 2010 Crash Factors in Intersection-Related Crashes: An On-Scene Perspective DISCLAIMER This publication is distributed by the U.S. Department of Transportation, National Highway
EVALUATION OF VIDEO DETECTION SYSTEMS VOLUME 4 - EFFECTS OF ADVERSE WEATHER CONDITIONS IN THE PERFORMANCE OF VIDEO DETECTION SYSTEMS
 CIVIL ENGINEERING STUDIES Illinois Center for Transportation Series No. 09-039 UILU-ENG-2009-2010 ISSN: 0197-9191 EVALUATION OF VIDEO DETECTION SYSTEMS VOLUME 4 - EFFECTS OF ADVERSE WEATHER CONDITIONS
PM2 Pavement SOP Overview. RPUG 2017 Denver, CO November 15, 2017
 PM2 Pavement SOP Overview RPUG 2017 Denver, CO November 15, 2017 1 Introduction/Overview SOP Background Metrics, Thresholds, and Measures Targets and Measures Required HPMS Data Elements Bridge Exclusion
City of Roseville Section 13 Design Standards. _Bikeways January 2016 SECTION 13 BIKEWAYS
 SECTION 13 BIKEWAYS 13-1 GENERAL The City of Roseville bikeway standards are designed to insure that transportation and recreational bikeways are constructed in a manner that would provide a safe and comfortable
ENHANCED PARKWAY STUDY: PHASE 2 CONTINUOUS FLOW INTERSECTIONS. Final Report
 Preparedby: ENHANCED PARKWAY STUDY: PHASE 2 CONTINUOUS FLOW INTERSECTIONS Final Report Prepared for Maricopa County Department of Transportation Prepared by TABLE OF CONTENTS Page EXECUTIVE SUMMARY ES-1
Figure 1: Graphical definitions of superelevation in terms for a two lane roadway.
 Iowa Department of Transportation Office of Design Superelevation 2A-2 Design Manual Chapter 2 Alignments Originally Issued: 12-31-97 Revised: 12-10-10 Superelevation is the banking of the roadway along
Student Manual. Lesson 4- Nuclear Density Testing. Version 1.0-3/09 4-1
 Version 1.0-3/09 4-1 Version 1.0-3/09 4-2 Version 1.0-3/09 4-3 What is the Density we are measuring? Can the Density be more than 100% of Maximum Dry Density reported in the Proctor test? Version 1.0-3/09
Verification and Validation Pathfinder
 403 Poyntz Avenue, Suite B Manhattan, KS 66502 USA +1.785.770.8511 www.thunderheadeng.com Verification and Validation Pathfinder 2015.1 Release 0504 x64 Disclaimer Thunderhead Engineering makes no warranty,
AVA Purpose AVA Background spacing factor specific surface AVA Principle AVA AVA
 Purpose The AVA (Air Void Analyzer) is used to measure the air-void parameters (spacing factor and specific surface) of samples of fresh air-entrained concrete. Samples are taken after concrete has been
Management of Multi-Lane Highways in Jordan (Case Study)
") Management of Multi-Lane Highways in Jordan (Case Study) Basim Jrew 1), Nidal Hussein 2) and Rami Al-Kouz 3) 1) Isra University, Jordan. E-Mail: basim.jrew@iu.edu.jo 2) Isra University, Jordan. E-Mail:
Management of Multi-Lane Highways in Jordan (Case Study) Basim Jrew 1), Nidal Hussein 2) and Rami Al-Kouz 3) 1) Isra University, Jordan. E-Mail: basim.jrew@iu.edu.jo 2) Isra University, Jordan. E-Mail:
Analysis of the Interrelationship Among Traffic Flow Conditions, Driving Behavior, and Degree of Driver s Satisfaction on Rural Motorways
 Analysis of the Interrelationship Among Traffic Flow Conditions, Driving Behavior, and Degree of Driver s Satisfaction on Rural Motorways HIDEKI NAKAMURA Associate Professor, Nagoya University, Department
PRECISION ESTIMATES OF AASHTO T324, HAMBURG WHEEL-TRACK TESTING OFCOMPACTED HOT MIX ASPHALT (HMA) APPENDICES FOR FINAL REPORT
 APPENDICES FOR FINAL REPORT") Project No. 10-87-2B DRAFT 6/06/14 PRECISION ESTIMATES OF AASHTO T324, HAMBURG WHEEL-TRACK TESTING OFCOMPACTED HOT MIX ASPHALT (HMA) APPENDICES FOR FINAL REPORT Prepared for National Cooperative Highway
Project No. 10-87-2B DRAFT 6/06/14 PRECISION ESTIMATES OF AASHTO T324, HAMBURG WHEEL-TRACK TESTING OFCOMPACTED HOT MIX ASPHALT (HMA) APPENDICES FOR FINAL REPORT Prepared for National Cooperative Highway
Kennedy Bridge - Summary of Pier 6 Movement Records
 KENNEDY BRIDGE - SUMMARY OF PIER 6 MOVEMENT RECORDS TECHNICAL MEMORANDUM Kennedy Bridge - Summary of Pier 6 Movement Records PREPARED FOR: COPY TO: MnDOT Dale Thomas / CH2M HILL File PREPARED BY: DATE:
Evaluation of June 9, 2014 Federal Emergency Management Agency Flood Insurance Study for Town of Weymouth, Norfolk, Co, MA
 Evaluation of June 9, 2014 Federal Emergency Management Agency Flood Insurance Study for Town of Weymouth, Norfolk, Co, MA Prepared For: Woodard & Curran 95 Cedar Street, Suite 100 Providence, RI 02903
General Accreditation Guidance. User checks and maintenance of laboratory balances
 General Accreditation Guidance User checks and maintenance of laboratory balances January 2018 Copyright National Association of Testing Authorities, Australia 2010 All intellectual property rights in
Stadium Project - DP-70 Atlanta, GA, 9/30/2014
 Page 1 of 13 The enclosed report contains the data and analysis summary for the SoniCaliper shaft caliper, performed at Stadium Project (DP-70), Atlanta, GA on Tuesday, September 30, 2014 by Chris Kohlhof.
MIL-STD-883G METHOD
 STEADY-STATE LIFE 1. PURPOSE. The steady-state life test is performed for the purpose of demonstrating the quality or reliability of devices subjected to the specified conditions over an extended time
1811G/H PITOT-STATIC TEST SET
 1811G/H PITOT-STATIC TEST SET USER INSTRUCTION MANUAL M/N: 1811G/H, P/Ns: 101-00165 101-00168 101-00169 Doc. P/N: 56-101-00165_00168_00169 Revision C December 9, 2014 BARFIELD, INC. Corporate Headquarters
MEMORANDUM. Investigation of Variability of Bourdon Gauge Sets in the Chemical Engineering Transport Laboratory
 1 MEMORANDUM TO: FROM: Prof. Davis Hubbard Prof. Faith A. Morrison DATE: 22 April 2014 RE: Investigation of Variability of Bourdon Gauge Sets in the Chemical Engineering Transport Laboratory Introduction
3-13 UFC - GENERAL PROVISIONS AND GEOMETRIC DESIGN FOR ROADS, STREETS, WALKS, AND OPEN
 maintenance, and erosion. Stability is required to maintain the integrity of the pavement structure, and a slope stability analysis should be conducted for cuts and fills greater than 15 feet. For lower
Tight Diamond Interchange versus Single Point Urban Interchange: Pedestrians Prospective
 Tight Diamond Interchange versus Single Point Urban Interchange: Pedestrians Prospective Ahmed Amer, M.S. Ph.D. Candidate Graduate Research/Teaching Assistant Department of Civil & Environmental Engineering
Sontek RiverSurveyor Test Plan Prepared by David S. Mueller, OSW February 20, 2004
 Sontek RiverSurveyor Test Plan Prepared by David S. Mueller, OSW February 20, 2004 INTRODUCTION Sontek/YSI has introduced new firmware and software for their RiverSurveyor product line. Firmware changes
Learning Locomotion Test 3.2 Results
 Learning Locomotion Test 3.2 Results TABLE OF CONTENTS 1 INTRODUCTION... 2 2 TEST METHODS... 2 2.1 TEST COURSES... 2 2.2 COMMUNICATIONS... 3 2.3 APPLICABLE DOCUMENTS... 3 3 RESULTS: TYPE A TESTS... 4 3.1
SUPPORTING NOTES FOR THE EVALUATION OF UNBOUND ROAD BASE AND SUB-BASE AGGREGATES
 SUPPORTING NOTES FOR THE EVALUATION OF UNBOUND ROAD BASE AND SUB-BASE AGGREGATES (These notes are guidelines only and must not be included in the Contract Documents). 1. SCOPE These Notes are guidelines
CHAPTER 1 STANDARD PRACTICES
 CHAPTER 1 STANDARD PRACTICES OBJECTIVES 1) Functions and Limitations 2) Standardization of Application 3) Materials 4) Colors 5) Widths and Patterns of Longitudinal Pavement Marking Lines 6) General Principles
Australian Standard. Manual of uniform traffic control devices. Part 3: Traffic control for works on roads AS AS 1742.
 AS 1742.3 2009 AS 1742.3 2009 Australian Standard Manual of uniform traffic control devices Part 3: Traffic control for works on roads This Australian Standard was prepared by Committee MS-012, Road Signs
Verification and Validation Pathfinder Release 0730 x64
 403 Poyntz Avenue, Suite B Manhattan, KS 66502 USA +1.785.770.8511 www.thunderheadeng.com Verification and Validation Pathfinder 2014.2 Release 0730 x64 Disclaimer Thunderhead Engineering makes no warranty,
Seismic Survey Designs for Converted Waves
 Seismic Survey Designs for Converted Waves James A. Musser* GMG/AXIS Inc., Denver, CO 1720 Red Cloud Road, Longmont, CO, 80501, USA jmusser@gmg.com ABSTRACT Designing converted wave 3D surveys is considerably
Roundabouts along Rural Arterials in South Africa
 Krogscheepers & Watters 0 0 Word count: 00 text + figures = 0 equivalent words including Title and Abstract. Roundabouts along Rural Arterials in South Africa Prepared for: rd Annual Meeting of Transportation
Air-Sea Interaction Spar Buoy Systems
 DISTRIBUTION STATEMENT A: Distribution approved for public release; distribution is unlimited Air-Sea Interaction Spar Buoy Systems Hans C. Graber CSTARS - University of Miami 11811 SW 168 th Street, Miami,
HAP e-help. Obtaining Consistent Results Using HAP and the ASHRAE 62MZ Ventilation Rate Procedure Spreadsheet. Introduction
 Introduction A key task in commercial building HVAC design is determining outdoor ventilation airflow rates. In most jurisdictions in the United States, ventilation airflow rates must comply with local
SURFACE CASING SELECTION FOR COLLAPSE, BURST AND AXIAL DESIGN FACTOR LOADS EXERCISE
 SURFACE CASING SELECTION FOR COLLAPSE, BURST AND AXIAL DESIGN FACTOR LOADS EXERCISE Instructions Use the example well data from this document or the powerpoint notes handout to complete the following graphs.
Memorandum INTRODUCTION METHODOLOGY. Smart Growth. Bruce Robinson, Transport Advisor, Infrastructure Planning
 Memorandum To: Smart Growth From: Bruce Robinson, Transport Advisor, Infrastructure Planning Subject: Te Tumu Transportation Assessment: Stage 1 Sensitivity Analysis Date: 1 June 2016 INTRODUCTION This
Bureau of Planning and Research. Project No.: (C14) Phase II Final Report March 2, 2007 CMA
 Phase II Final Report March 2, 2007 CMA") Bureau of Planning and Research Safer Driver Actions at Stop Signs Project No.: 04-01 (C14) Phase II Final Report March 2, 2007 CMA Technical Report Documentation Page 1. Report No. 2. Government Accession
Bureau of Planning and Research Safer Driver Actions at Stop Signs Project No.: 04-01 (C14) Phase II Final Report March 2, 2007 CMA Technical Report Documentation Page 1. Report No. 2. Government Accession
European Road Profile Users Group Copenhagen September2013. Harmonization in pavement smoothness rating of new and old pavements
 European Road Profile Users Group Copenhagen 10 12 September2013 Harmonization in pavement smoothness rating of new and old pavements PRESENTATION OUTLINE Definition and Standards Harmonization Roughness
TXDOT DESIGNATION: TEX-922-K
 Test Procedure for CALIBRATING ASPHALT DISTRIBUTION EQUIPMENT Texas Department of Transportation TxDOT Designation: Tex-922-K Effective Date: May 2009 1. SCOPE 1.1 This three-part procedure is a method
INTEGRITY MANAGEMENT OF STRESS CORROSION CRACKING IN GAS PIPELINE HIGH CONSEQUENCE AREAS
 Designator: Meta Bold 24/26 Revision Note: Meta Black 14/16 INTEGRITY MANAGEMENT OF STRESS CORROSION CRACKING IN GAS PIPELINE HIGH CONSEQUENCE AREAS Date of Issuance: October 31, 2008 This report was prepared
SPEED PROFILES APPROACHING A TRAFFIC SIGNAL
 SPEED PROFILES APPROACHING A TRAFFIC SIGNAL Robert L. Bleyl*, The University of New Mexico The objective of this study was to examine and compare the speed profiles of traffic approaching a traffic signal
VDOT s Pavement Management Program. Presented by: Tanveer Chowdhury Maintenance Division, VDOT March 05, 2010
 VDOT s Pavement Management Program Presented by: Tanveer Chowdhury Maintenance Division, VDOT March 05, 2010 Outline Pavement Management network and project level Pavement Data Collection and QA/QC Data
Multi-Function Vehicle
 Automated Cracking Survey and Multi-Function Vehicle Kelvin CP Wang University of Arkansas & WayLink kcw@uark.edu RPUG 2008 Austin, Texas October 28 2008 1 Four Parts of Presentation Part One: History
Turn Lane Warrants: Concepts, Standards, Application in Review
 Turn Lane Warrants: Concepts, Standards, Application in Review David J. DeBaie P.E., P.T.O.E. 2004 ITE, District 1 Annual Meeting Burlington, Vermont Introduction Turning lanes at intersections reduce
Modeling of Hydraulic Hose Paths
 Mechanical Engineering Conference Presentations, Papers, and Proceedings Mechanical Engineering 9-2002 Modeling of Hydraulic Hose Paths Kurt A. Chipperfield Iowa State University Judy M. Vance Iowa State
Subject: Use of Pull-off Areas in Work Zones Page: 1 of 13. Brief Description: Guidance for the use and placement of pull-off area in work zones.
 6 - G2 Subject: Use of Pull-off Areas in Work Zones Page: 1 of 13 MdMUTCD REF. NO. None Date Issued: 09/09 Effective Date: 09/09 Brief Description: Guidance for the use and placement of pull-off area in
Influence of wind direction on noise emission and propagation from wind turbines
 Influence of wind direction on noise emission and propagation from wind turbines Tom Evans and Jonathan Cooper Resonate Acoustics, 97 Carrington Street, Adelaide, South Australia 5000 ABSTRACT Noise predictions
Truck Climbing Lane Traffic Justification Report
 ROUTE 7 (HARRY BYRD HIGHWAY) WESTBOUND FROM WEST MARKET STREET TO ROUTE 9 (CHARLES TOWN PIKE) Truck Climbing Lane Traffic Justification Report Project No. 6007-053-133, P 101 Ι UPC No. 58599 Prepared by:
Learning Locomotion Test 3.1 Results
 Learning Locomotion Test 3.1 Results TABLE OF CONTENTS 1 INTRODUCTION... 2 2 TEST METHODS... 2 2.1 TEST COURSES... 2 2.2 COMMUNICATIONS... 3 2.3 APPLICABLE DOCUMENTS... 3 3 RESULTS: TYPE A TESTS... 3 3.1
ITTC Recommended Procedures and Guidelines
 Page 1 of 6 Table of Contents 1. PURPOSE...2 2. PARAMETERS...2 2.1 General Considerations...2 3 DESCRIPTION OF PROCEDURE...2 3.1 Model Design and Construction...2 3.2 Measurements...3 3.5 Execution of
ISO INTERNATIONAL STANDARD
 INTERNATIONAL STANDARD ISO 6974-4 First edition 2000-04-01 Natural gas Determination of composition with defined uncertainty by gas chromatography Part 4: Determination of nitrogen, carbon dioxide and