Arterial Management and Interstate Access Plan for US Route 250 and State Route 623
|
|
|
- Loraine Jennings
- 6 years ago
- Views:
Transcription


1 Arterial Management and Interstate Access Plan for US Route 250 and State Route 623 Prepared for: Prepared by: October 2015
2 Table of Contents 1.0 Introduction Background Purpose of Study Study Scope Steering Committee Study Area Study Intersections Study Corridors Study Interchanges Literature Review Vermont Corridor Management Handbook (Vermont) Development of an Arterial Corridor Management Transportation Strategy for the Capital District Region (New York) Managing Corridor Development: A Municipal Handbook (Florida) Conclusions Public Involvement Process Board of Supervisor Presentations Public Outreach Stakeholder Interviews Public Meetings Existing (2014) Traffic Conditions Existing Plans and Studies Major Thoroughfare Plan Goochland County, VA (Adopted August 2, 2005) The Comprehensive Plan for Goochland County, Virginia (Adopted February 3, 2009) Chapter 17 Financially Constrained Plan Atack Property, Henrico County, Virginia (July 19, 2012) Bacova Development, Henrico County, Virginia (March 16, 2011) Turn Lane and Signal Warrant Studies Existing Land Use Existing Traffic Volumes Peak Hour Determination Traffic Volume Balancing Speed Data Crash Analysis Safety Field Review Review of Existing Access Management Operational Field Observations AM Peak Hour PM Peak Hour Other Considerations Existing (2014) Operational Analysis Bicycle and Pedestrian Environment Future Traffic Volume Projections No-Build (2035) Traffic Volumes Background Growth Rates Growth Rates and No-Build (2035) Traffic Volume Projections Build (2035) Traffic Volumes Land Use and Future Development and Trip Generation Trip Distribution Build (2035) Traffic Volumes Minimally Managed Access Scenario (MMAS) Build (2035) Traffic Volumes Ultimately Managed Access Scenario (UMAS) Future (2035) Traffic Conditions No-Build (2035) Operational Analysis Build (2035) Operational Analysis Minimally Managed Access Scenario (MMAS) Ultimately Managed Access Scenario (UMAS) Comparison of Access Management Scenarios Operational Comparison Safety Comparison Arterial Management Strategies Recommendations Major Roadway Recommendations Ashland Road Widening Three Chopt Road Widening Connectivity Recommendations Access Management Recommendations General Access Management Recommendations Broad Street Ashland Road Interchange Recommendations Short-Term Route 288 at Broad Street Interchange I-64 at Ashland Road Interchange Interchange Recommendations Long-Term Route 288 at Broad Street Interchange I-64 at Ashland Road Interchange Other Alternatives Bike and Pedestrian Intersection Recommendations Auxiliary Turn Lanes Page i October 2015
3 9.7.2 Traffic Signals Roundabouts Travel Demand Management Park & Ride Facilities Transit Implementation Plan Federal Funding Source Alternatives Congestion Mitigation and Air Quality (CMAQ) Highway Safety Improvement Program (HSIP) Surface Transportation Program (STP) Transportation Alternatives Program (TAP) State Funding Source Alternatives House Bill Revenue Sharing Recreational Access Program Economic Development Access Program Local Funding Source Alternatives Funding Summary Key Steps Prioritization List of Figures Figure 1: Study Area... 3 Figure 2: Existing (2014) Lane Assignments... 7 Figure 3: Goochland County Major Thoroughfare Plan (Adopted August 2, 2005)... 8 Figure 4: Existing Land Use Map Figure 5: Existing Average Daily Traffic (ADT) Figure 6: Existing (2014) AM and PM Turning Movement Volumes Figure 7: Existing (2014) 85th Percentile Speed (by Lane) Figure 8: Crash Type Summary Broad Street Figure 9: Crash Type Summary Ashland Road Figure 10: Collision Diagram Ashland Road at Plaza Drive Figure 11: Collision Diagram Broad Street at Hockett Road and Ashland Road Figure 12: Collision Diagram Broad Street at SB Route 288 Ramp Terminal (2009 to 2013) Figure 13: Collision Diagram Broad Street at Route 288 Ramp Terminals Figure 14: Collision Diagram Broad Street at Wilkes Ridge Parkway/Little Tuckahoe Court Figure 15: Collision Diagram Ashland Road at I-64 Ramp Terminals Figure 16: Existing (2014) Level of Service Figure 17: Traffic Analysis Zone Map Figure 18: Proposed Annual Future Growth Rates Figure 19: No-Build (2035) Annual Daily Traffic (ADT) Volumes Figure 20: No-Build (2035) AM and PM Peak Hour Traffic Volumes Figure 21: Land Use by Zone - Scenario 2 Higher Intensity Figure 22: Trip Assignment Zones Figure 23: Existing and Proposed Trip Distribution Figure 24: Build (2035) AM and PM Total Volume Ashland Road Minimally Managed Access Scenario Figure 25: Build (2035) AM and PM Total Volume Broad Street Minimally Managed Access Scenario Figure 26: Build (2035) AM and PM Total Volume Ashland Road Ultimately Managed Access Scenario Figure 27: Build (2035) AM and PM Total Volume Broad Street Ultimately Managed Access Scenario Figure 28: No-Build (2035) Peak Hour Level of Service (LOS) Figure 29: Build (2035) Minimally Managed Access Scenario (MMAS) Peak Hour Level of Service (LOS) Ashland Road.. 40 Figure 30: Build (2035) Minimally Managed Access Scenario (MMAS) Peak Hour Level of Service (LOS) Broad Street Figure 31: Build (2035) Ultimately Managed Access Scenario (MMAS) Peak Hour Level of Service (LOS) Ashland Road. 42 Figure 32: Build (2035) Ultimately Managed Access Scenario (MMAS) Peak Hour Level of Service (LOS) Broad Street Figure 33: Typical Four-Lane Cross Section Ashland Road Figure 34: Typical Four-Lane Cross Section Three Chopt Road Figure 35: Proposed Master Thoroughfare Map Figure 36: I-64 at Ashland Road Planned Improvements Figure 37: Proposed Broad Street Directional Ramps Figure 38: I-64 at Ashland Road Interchange Long-Term Potential Interchange Configuration Figure 39: Typical Cross-Section - Broad Street Figure 40: Potential Roundabout Locations along Ashland Road List of Tables Table 1: Arterial Management Plan Methodology... 1 Table 2: Project Steering Committee Members... 2 Table 3: Corridor Heavy Vehicle Percentages... 9 Table 4: Peak Hour Determination Table... 9 Table 5: Corridor Crash Summary by Year Table 6: Corridor Crash Summary by Severity Table 7: Corridor Crash Rates Table 8: Minimum Spacing Standards for Commercial Entrances, Intersections, and Median Crossovers Table 9: Signalized and Unsignalized Intersection LOS Criteria Table 10: Vehicle Historical Annual Average Growth Rate ( ) Table 11: Travel Demand Model Traffic Projections Table 12: Goochland County Traffic Analysis Zone Socioeconomic Data (Population and Households) Table 13: Approved Developments Table 14: Build-Out (2035) Land Use Scenarios and Resulting Trip Generation Table 15: Trip Generation - Land Use Scenario 2 Higher Intensity Table 16: VDOT Access Management Spacing MMAS Page ii October 2015
4 Table 17: Example Trip Assignment by Zone Table 18: MMAS Compared to Existing Access Table 19: VDOT Access Management Spacing Principal Arterial Table 20: Access Scenarios MMAS vs. UMAS Table 21: Effect of Access Point Table 22: Effect of Signal Density Table 23: Operational Comparison of Access Management Scenarios Signalized Intersection Level of Service Table 24: Multi-Modal Improvements Table 25: Geometric/Capacity/Operational Improvements Table 26: Access Management Table 27: Safety Improvements Table 28: Policy Recommendations Table 29: Travel Demand Management Table 30: Other Improvements Table 31: Planning Level Cost Estimates Roadway Widening Table 32: Planning Level Cost Estimates Roadway Connections Table 33: Broad Street Summary of Access Points Table 34: Planning Level Cost Estimates Access Management Table 35: Planning Level Cost Estimates Route 288 at Broad Street Interchange Short-Term Improvements Table 36: Planning Level Cost Estimates I-64 at Ashland Road Interchange Shorter-Term Improvements Table 37: Planning Level Cost Estimates Route 288 Interchange at Broad Street Longer-Term Improvements Table 38: Planning Level Cost Estimates I-64 at Ashland Road Longer-Term Improvements Table 39: Planning Level Cost Estimates Bike Lane and Multi-Use Paths Table 40: Planning Level Cost Estimates Auxiliary Lanes Table 41: Proposed Signal Spacing Table 42: Planning Level Cost Estimates Traffic Signals Table 43: Evaluation of Potential Roundabout Locations Table 44: Planning Level Cost Estimates - Roundabouts Table 45: Planning Level Cost Estimates Park and Ride Facilities Table 46: Implementation Plan Photograph 9: Vehicle Queue on SB Approach to EB I Photograph 10: Pedestrians Along North Broad Street Near Wilkes Ridge Parkway Photograph 11: Existing Ashland Road Two-Lane Cross Section Photograph 12: Existing Ashland Road Two-Lane Cross Section Plan Sheets Plan Sheet 1: AMP Recommendations Broad Street at Hockett Road Plan Sheet 2: AMP Recommendations Broad Street at Ashland Road Plan Sheet 3: AMP Recommendations Broad Street at Whipporwill Road Plan Sheet 4: AMP Recommendations Broad Street at Crossover # Plan Sheet 5: AMP Recommendations Broad Street at Crossover # Plan Sheet 6: AMP Recommendations Broad Street at Mills Road Plan Sheet 7: AMP Recommendations Broad Street at SB Route 288 Ramps Plan Sheet 8: AMP Recommendations Broad Street at NB Route 288 Ramps Plan Sheet 9: AMP Recommendations Broad Street at Wilkes Ridge Parkway Plan Sheet 10: AMP Recommendations Ashland Road at WB I-64 Ramps Plan Sheet 11: AMP Recommendations Ashland Road at EB I-64 Ramps Plan Sheet 12: AMP Recommendations Ashland Road at Plaza Road Plan Sheet 13: AMP Recommendations Ashland Road at Crossover # Plan Sheet 14: AMP Recommendations Ashland Road Potential Roundabout Locations Appendix Appendix A: Stakeholder Interviews Appendix B: Data Collection Appendix C: Operational Analysis Results Appendix D: Growth Rate Development Appendix E: Minimally and Ultimately Managed Access Scenarios Appendix F: Planning Level Cost Estimates Appendix G: Roundabout Screening Results List of Photographs Photograph 1: Looking South on Ashland Road from the Gas Station Driveway Photograph 2: Traveling South on Ashland Road toward Plaza Drive Photograph 3: Sight Distance Looking West from Northbound Approach Photograph 4: Looking at Eastbound Photograph 5: Eastbound Approach on Ashland Road Photograph 6: Westbound Left-Turn Queue AM Peak Period Photograph 7: Looking West from the Westbound Left-Turn Photograph 8: Looking West at Broad Street and Wilkes Ridge Parkway (per Traffic Signal Installation) Page iii October 2015
5 1.0 Introduction 1.1 Background The Commonwealth Transportation Board (CTB) approved a process for developing Corridor Master Plans on the Corridors of Statewide Significance (CoSS). The CTB resolution stated that Corridor Master Plans are critical to preserving the capacity and safety and controlling congestion on the CoSS. Additionally, these plans help ensure the ability of the CoSS to function into the future, as facilities for long distance travel, movement of goods and economic development. In light of the CTB s responsibilities under (f) and , it was essential that similar plans be developed to preserve the capacity and safety on the regional network. Since most of the regional networks are functionally classified as arterials, the focus of Arterial Management Plans (AMP) is on the regional arterial network. Recognizing that the arterial highways are an integral part of the Commonwealth s Transportation network, they are intended to provide service for long distance travel and goods movement. While through and local traffic must be accommodated by the arterial highways, balancing the transportation network to serve well managed access points for local businesses or commercial sites is equally important. The arterial network is a vital resource of the Commonwealth and such must be preserved through implementation of the best management practices. 1.2 Purpose of Study Using this project as a pilot, the intent was to develop a process for managing the Commonwealth s arterial highway system as a resource. The process documented an Arterial Management Plan that considers the current and future travel needs, as well as potential access for future development along the corridor. The AMP serves as a guide for providing future access to economic development sites that ensures the safety of through travel movements as well as local traffic. The Commonwealth s arterial network is the result of major investments in public funds and, given the unclear outlook for financing new transportation improvements, it was critical to develop plans and procedures to better preserve the Commonwealth s existing transportation investments. Therefore, the purpose of an Arterial Management Plan was to identify ways to ensure the safety and preserve the capacity of the Commonwealth s arterial highway network without wide scale roadway widening. In the future, there will continue to be a need to accommodate new land development along the arterial network, but the access to new sites must be planned in order to minimize the congestion and safety impacts that frequently accompany strip development. The Arterial Management Plan will help guide localities and the development community in maximizing capacity, minimizing congestion, as well as planning and designing the appropriate access for the future development. Overall this project accomplished two key items. One was to develop a process/methodology for conducting an Arterial Management Plan. Research was conducted to identify best access management practices and techniques and create a toolbox matrix of access management techniques, strategies and policies to be used by planners statewide. The second item was to conduct a pilot Arterial Management and Interstate Access Plan for US Route 250 and Route 623 in Goochland County. For this corridor, an optimal Arterial Management and Interstate Access Plan was developed using the toolbox matrix to detail future access for the corridor. The plan identified the following recommendations for the corridor: roadway, connectivity, access management, interchange (short- and long-term), intersection, travel demand management, and other alternatives. 1.3 Study Scope A comprehensive arterial management plan requires a well-defined structure and process. The Arterial Management and Interstate Plan for the Broad Street and Ashland Road corridors is comprised of the following eight distinct phases of work and corridor development/planning. Detailed discussion is provided in subsequent sections of key findings regarding each phase. Table 1: Arterial Management Plan Methodology Project Kick-Off Establish project steering committee Establish AMP goals for corridor Data Collection Literature review of best practices Compilation and review of available data and plans Preparation of base mapping Obtain existing traffic signal timing Traffic data collection Crash data Field Review Inventory of existing access management Conduct stakeholder interviews Existing Conditions Analyze existing traffic conditions Future Traffic Conditions Land use and future development Develop traffic volume forecasts Define Future Traffic Minimally Managed Conditions Define Future Traffic Optimally Managed Conditions Analyze future traffic conditions Identify Recommendations Identified recommendations from toolbox of corridor management strategies to mitigate future traffic issues Public Involvement Project steering committee meetings Public meetings Local government official briefings Arterial Management Plan Report Summary of recommendations Planning level cost estimates Prioritization of recommendations Page 1 October 2015
6 1.4 Steering Committee A Steering Committee was formed for the study which played an important role in project decision-making by providing input and guidance throughout the process. Committee members consisted of representatives from Goochland County, Richmond Regional Planning District Commission (PDC), and VDOT and met five times throughout the project process. Table 2 lists the members of the steering committee. 1.5 Study Area Name Rebecca Dickson Dan Schardein Tom Coleman Todd Kilduff Manual Alvarez, Jr. Robert Minnick Barbara Nelson Sulabh Aryal Chad Tucker Brad Shelton Charles Rasnick Jeff Kuttesch Rob Svejkovsky Robert Butler Table 2: Project Steering Committee Members Organization Goochland County County Administrator Goochland County Deputy County Administrator Goochland County Principal Planner Goochland County Director of Public Utilities Goochland County Board of Supervisors Goochland County Board of Supervisors Richmond Regional Planning District Commission Richmond Regional Planning District Commission VDOT Transportation Mobility and Planning Division VDOT Transportation Mobility and Planning Division VDOT Transportation Mobility and Planning Division VDOT Richmond District VDOT Richmond District VDOT Richmond District The study area of the Arterial Management and Interstate Access Plan consists of an approximate 2.0 mile section of Broad Street from Hockett Road to Wilkes Ridge Parkway just west of the Goochland and Henrico County lines and an approximate 1.0 mile section of Ashland Road from Broad Street to Forest Road as illustrated in Figure 1. The study area is bound by Interstate 64 to the north, the Goochland and Henrico County lines to the east, Broad Street to the south, and Ashland Road to the west. Two major interchanges are located within the study area: Interstate 64 at Ashland Road and Route 288 at Broad Street. These interchanges provide access to regional connections to the east and west as well as the south. The study area for this includes intersections and roadways of varying types, ranging from freeways to local facilities. The following section provides information on the study intersections, corridors, and interchanges within the vicinity of the study area. The functional classifications for each roadway were based on VDOT s Richmond District 2015 Functional Classification map for Goochland County. Ashland Road at I-64 Westbound On- and Off-Ramps (Signalized) Ashland Road at I-64 Eastbound On- and Off-Ramps (Unsignalized) Ashland Road at Rockville Road (Unsignalized) Ashland Road at Plaza Drive (Unsignalized) Broad Street at Ashland Road (Signalized) Broad Street at Hockett Road (Unsignalized; Signalization installed Summer 2014) Broad Street at Route 288 Southbound On- and Off-Ramps (Unsignalized) Broad Street at Route 288 Northbound On- and Off-Ramps (Unsignalized) Broad Street at Wilkes Ridge Parkway (Unsignalized; Signalization installed Spring 2014) Study Corridors US 250 (Broad Street) is predominately a six-lane median divided facility classified as a principal arterial from the Goochland County line and transitions to a four-lane divided minor arterial just west of the Route 288 interchange. Broad Street, within the study area, contains one signalized intersection at Ashland Road and several median crossovers including the Route 288 interchange terminal intersections. The corridor travels from east to west with a posted speed limit on the corridor is 45 miles per hour (mph). Turn lanes are strategically placed along Broad Street at the major intersections and median openings. Pedestrian and bicycle facilities are not provided along the Broad Street corridor within the study area. Ashland Road (Route 623) is a two-lane north to south, undivided facility classified as a minor arterial with a posted speed limit of 45 mph. Two signalized intersections are located along Ashland Road within the study area limits: Broad Street and I-64 Westbound On- and Off-Ramps. Several unsignalized intersections and driveways are located along the corridor from Broad Street to I-64. Similar to Broad Street, pedestrian and bicycle facilities are not provided along this corridor within the study area. Additionally, transit and bus services are not provided throughout the study area Study Interchanges Ashland Road at Interstate 64 Interchange is a traditional diamond configuration consisting of two on-ramps and two off-ramps servicing Ashland Roads and Interstate 64. The interchange is bound by high-tension power lines to the north and undeveloped property on the east, south, and west. Ashland Road crosses Interstate 64 via a two-lane undivided bridge overpass. Broad Street at Route 288 Interchange is a partial cloverleaf configuration with two quadrants adjacent on the south side of Broad Street. The interchange is bound by Broad Street to the north, a residential development to the east, West Creek development to the west, and undeveloped land to the south. This interchange serves as a connection to Interstate 64 to the north Study Intersections The study area includes the following intersections: Ashland Road at Forest Road (Unsignalized) Page 2 October 2015


7 Figure 1: Study Area *The intersections of Broad Street at Hockett Road and Wilkes Ridge Parkway were signalized during the development of the study. Page 3 October 2015
8 2.0 Literature Review In order to develop a framework for an Arterial Management and Interstate Access Plan, a literature review was conducted of existing arterial and corridor management programs of other agencies. The following sections highlight the key components of these plans that should be considered as the Department looks to develop an Arterial Management Plan for application to current roadways around the state. The literature review yielded three (3) pertinent plans: 1. Vermont Corridor Management Handbook (Vermont, July 2005) 2. Development of an Arterial Corridor Management Transportation Strategy for the Capital District Region (New York, December 1995) 3. Managing Corridor Development: A Municipal Handbook (Florida, October 1996) In addition to these three (3) state plans, the background literature review research yielded additional documents that provided relevant information to some degree with respect to arterial street networks, but the primary focus of the document was not geared specifically toward a management plan; rather, land use planning, limited provisions for access management, Intelligent Transportation Systems (ITS), or other practices. Such documents included the Bluegrass Corridor Management Planning Handbook (KY), Traffic Signal Integration Arterial Management System (RAMS) Evaluation Report (CA), as well as several NCHRP reports. 2.1 Vermont Corridor Management Handbook (Vermont) Vermont has developed a Corridor Management Handbook to serve as a guide for developing transportation corridor management plans. The handbook evolved from the recognition that many of the state s transportation needs can be most effectively addressed at the corridor level. The benefits of corridor management planning are laid out succinctly at the beginning of the document, and include the following: To identify and address transportation deficiencies before they become critical problems. To allow for development of coordinated transportation and land use solutions along a corridor. To bring diverse stakeholders together and agree on mutually beneficial strategies as well as ongoing mechanisms for cooperatively pursuing these strategies. To save money by implementing lower cost strategies as an alternative to expensive transportation capital improvements. To ensure transportation needs are addressed in a manner that preserves and enhances the natural environment and the character of the communities. The handbook outlines a six-step process for a corridor management study that yields a management plan, which includes: Project Organization forming an advisory committee, work planning, and defining the corridor limits and study goals. Analyze Existing and Future Conditions Develop Vision and Strategies Develop Implementation Plan Finalize Document Monitor Progress In addition to the process, the handbook contains resources for analysis methods, funding sources, planning tools, and references to other state programs. The six-step process is laid out to sequentially guide stakeholders through the evaluation of a corridor to identify measures for corridor management. Identifying the appropriate range of stakeholders up front allows for more valuable and meaningful input with better results; for example, considering the needs of the local government as well as affected businesses and residents for a major arterial evaluation. By gathering input from relevant users, effective goals can be established for the corridor. Overall, the handbook places a strong emphasis on establishing criteria with tangible metrics for evaluation to drive decision making. The handbook also provides support for all travel modes vehicular, transit, pedestrian, and rail. As part of the implementation plan, the handbook recommends establishing thresholds to trigger the deployment of recommended improvements in a proactive manner, rather than being reactive to poor corridor operations. In addition, the handbook identifies the need to seek funding for implementation of recommended improvements once a plan has been established to be able to put in place the necessary improvements to maintain acceptable corridor operations. 2.2 Development of an Arterial Corridor Management Transportation Strategy for the Capital District Region (New York) The New York Capital District Transportation Committee (CDTC) developed guidelines for arterial corridor management for the four counties surrounding the state capital, Albany. In the document are six transportation actions and strategies aimed at mitigating arterial congestion and improving operations, including: 1. Endorse an access management policy for a priority network of arterial streets and highways a. Reinforce street hierarchy b. Driveway spacing guidelines for commercial corridors c. Signal spacing guidelines d. Adopt a residential street standard 2. Strengthen land use planning and coordination 3. Promote alternatives to automobile travel a. Improve pedestrian and bicycling environment b. Consider transit as an integral part of site development review and corridor reconstruction 4. Explore traffic calming actions to improve the livability of residential arterial corridors 5. Support investment in access management improvements and other actions that promote overall objectives of arterial corridor management 6. Promote the development of access management plans for priority network arterials The intent of these actions and strategies is to better apply design standards and coordinate land uses with transportation needs. As outlined in the document, the principal concern of arterial management is to minimize conflicts between traffic flow, pedestrians, and access to abutting property. The task force team responsible for developing the arterial corridor management strategy formed the actions above from a review of current practices, which included the following: Most public agencies apply some form of access control to their streets and highways. Emphasis on design standards rather than operational techniques limits the opportunities for and effectiveness of many arterial management treatments. Transit, pedestrian, and bicycle actions are often overlooked when considering arterial management planning. Page 4 October 2015
9 Limited national data is available regarding the safety benefits of properly spaced driveways. There are no clear correlations regarding the vehicle capacity of a roadway and the number of curb-cuts (i.e. driveways). A few states have developed access management standards based on classification categories that relate function to facility type. Another key component of the strategy is a land use conflict index that was developed to measure performance of a roadway. The index considers traffic and land uses and is reported as a level-of-compatibility (LOC), similar to level-ofservice (LOS), ranging from A, the most desirable, to F, the least acceptable. The indices were used to evaluate roadway segments under future year conditions to project when deficient roadway operating conditions could be expected. Ultimately, the document provided for specific, targeted means for arterial corridor management to address the principal concern mentioned above. In addition to the six transportation actions and strategies, the task force identified the need for outreach programs to promote access management aimed at neighborhood and community groups, planning boards, public works and safety officials, as well as development and business communities. Lastly, a list of planning guidelines was presented that local communities should consider in the site plan review process. 2.3 Managing Corridor Development: A Municipal Handbook (Florida) The handbook was developed out of the Center for Urban Transportation Research at the University of South Florida to guide corridor management and reinforce the need for the practice. The handbook defines corridor management as inclusive of right-of-way preservation, advance acquisition, and access management, along with coordination of the planning of designated future transportation corridors with land-use planning within and adjacent to the corridor. The benefits of corridor management are identified as follows: Reducing property damage and displacement of homes and businesses; Minimizing environmental, social, and economic impacts of the corridor; Preventing foreclosure of desirable locations; Permitting orderly project development; and Reducing the costs of transportation facilities. With the benefits of corridor management come several barriers, which are outlined in the handbook as funding constraints, political conflicts, legal uncertainty, rising right-of-way costs, uncertain future alignments, and development requests. To achieve the benefits of corridor management and overcome the barriers, the handbook provides a comprehensive overview of the practice, from planning, to right-of-way preservation and acquisition, access management, funding, and legal considerations. With respect to planning, one of the primary recommendations is to establish priorities. Factors identified to determine corridor priority include: How important is the corridor to the local and regional transportation system? What is the immediacy of development in the corridor? Are there opportunities to prevent development in the future right-of-way? What is the risk of foreclosing location options entirely? In addition to establishing priorities, the handbook recommends the completion of corridor studies and plans, thoroughfare plans, and access management plans to guide development along a given corridor. Complementary to planning, review and updating of regulations is a step outlined in the handbook aimed at preserving right-of-way for existing and future corridors. Examples of this practice include updating zoning and subdivision regulations, determining adequate setbacks and lot dimensions, and adopting traffic impact analysis requirements. Guidance is provided in the handbook related to right-ofway preservation and acquisition, but a key component to corridor management that has been an underlying aspect of each document reviewed is access management. The benefits of access management are well documented by a wide range of resources, and specifically within the handbook are mentioned improved safety of vehicular and pedestrian travel, preservation of roadway LOS, and enhanced community character. Driveway location and design, driveway spacing, corner clearance, and joint and cross access are all mentioned as effective measures for improving access management, as well as frontage roads and median access. With respect to legal considerations, the document advises on what degree of legal actions should be considered for a corridor. In an effort to retain adequate right-of-way, preservation policies can be enacted to ensure adequate provision of land needed for future transportation facilities. One step outlined in the handbook is the development of a formal comprehensive corridor plan; regulatory programs are more likely to be found reasonable if a plan exists. Also, the provision of mitigation measures to offset hardships and the application of reasonable right-of-way reservation periods is encouraged. The concluding remark in the document is that all approaches to corridor management need to adhere to legal guidelines, coordinate with other transportation agencies, and provide opportunities for early and continuing public involvement. 2.4 Conclusions Although each of the aforementioned materials has unique components related to arterial corridor management practices, several common themes can be derived. Aspects that the Department should consider as the development of an Arterial Management and Interstate Access Plan moves forward include: Identify appropriate stakeholders for each corridor Consider all modes of transportation in the development of a plan Involve the affected public early on in the plan development Document access management regulations and ways to mitigate existing deficiencies Identify funding of recommended improvements Other considerations, although not prevalent in all plans reviewed, are legal guidelines, measuring the effectiveness of improvements, monitoring progress, and establishing thresholds for taking action. Consideration of these components as part of a comprehensive plan will help guide arterial corridor management in the future and provide for consistent management of the plans across the state. 3.0 Public Involvement Process In order to develop recommendations and conceptual plans for improvements within the study area, several corridor characteristics required identification and review in conjunction with extensive stakeholder outreach. Land use, corridor demographics, transit, pedestrian and bicycle facilities, access, traffic, and safety were reviewed to understand the existing conditions and evaluate options for improvement along the corridor roadways. Public and elected officials, project committees, other stakeholders, and citizens within the study area were engaged throughout the entire project process in order to help document existing conditions and develop preferable recommendations. Page 5 October 2015
10 3.1 Board of Supervisor Presentations Briefings on the study were presented to the Goochland County Boards of Supervisors at key milestones throughout the project process. The purpose of these briefings was to familiarize the members with the study and answer any project related questions. Presentation topics included project history, schedule, study area, existing conditions, public involvement, and recommendations. In addition to these briefings, an Educational Workshop was conducted on April 7, 2014 for the public to attend. The purpose of this workshop was to inform the public on the project and purpose as well as educate them on the technical aspects, analysis, and potential arterial management techniques, strategies, policies and benefits. 3.2 Public Outreach As previously mentioned, the AMP included an extensive stakeholder and public outreach program in order to be rooted in a public involvement platform that gathered, processed, and applied a diversity of opinions from the corridors residents, business owners, and civic groups. The intended outcome of the public outreach effort was for stakeholders to feel satisfied with their participation in the effort to have assisted the County in creating a project that meets the overall community purpose. It was important that the public feel positive about their contribution and feel ownership in the project that will last through development. This was accomplished through stakeholder interviews and public meetings Stakeholder Interviews Early in the public outreach process, Goochland County and VDOT identified several key stakeholders to conduct interviews with to gather information relative to their relationship to the corridors, typical travel patterns along the corridor, and opinions of current and future corridor operations as well as areas of concern. The stakeholders included regional and local property owners, a Goochland County Planning Commissioner, and several residents. The questionnaire and results of the stakeholder interviews are included in Appendix A Public Meetings In addition to the stakeholder interviews, two public meetings were conducted on November 11, 2014 and March 11, 2015 at the fire station along Broad Street within the study area. The first public meeting focused on the goals and objectives of the study along with providing a summary of the existing conditions to gain public consensus. Citizens and business owners were given a 30-minute presentation about the study, informed of the intent of the public meeting, and participated in a questions and answers session as well as provide input on the comment sheet. The second public meeting focused on presenting the recommended AMP for the study area. Following a similar format as the first public meeting, citizens and business owners were given a 30-minute presentation about the future conditions and analyses as well as the draft recommended improvements for the AMP. The public was given time to ask questions about the draft recommendations. 4.0 Existing (2014) Traffic Conditions A field review of the study corridor was conducted on Wednesday, March 12, 2014 to verify existing conditions and traffic control devices; and observe peak hour traffic conditions and driver behavior. The existing geometry of the study intersections along the corridors is displayed in Figure 2. In addition to the field review, zoning, future land use, and other relevant studies to the study area were obtained; traffic data was acquired from turning movement counts, tube counts, speed data, and crash data provided by VDOT. The following subsections of the report summarize collected data and field review observations. 4.1 Existing Plans and Studies Conclusions for the existing plans and studies relating to the study area are provided below and were considered in the development of the AMP for the Broad Street and Ashland Road corridors Major Thoroughfare Plan Goochland County, VA (Adopted August 2, 2005) The purposes of the plan is to, serve as a tool to guide the Board of Supervisors, the Planning Commission and administrative staff as they consider transportation projects and planned road improvements to support the growth and development of Goochland County. Under Section 4.0 Roadway Classifications, Broad Street (Broad Street) is classified as a major arterial from the Henrico County Line to the Louisa County Line. In addition, Route 623 (Hockett Road) is classified as major arterial south of Broad Street. By definition, major arterial highways should consist of 12 foot travel lanes, 8 foot shoulders, and a minimum right-of-way of 50 to 90 feet. Provided for under the Major Thoroughfare Plan Proposed Improvements (within the vicinity of the pilot study area) are the following: Improve Broad Street from a 4-lane divided to a 6-lane divided facility with a 16 foot median between Tuckahoe Creek to Route 623 (Ashland Road), identified as a 5-10 year project Improve Broad Street from a 3-lane roadway to a 4-lane divided facility with a 16 foot median between Route 623 (Ashland Road) and Route 621 (Hockett Road), identified as a 5-10 year project Complete. Improve Route 623 (Ashland Road) from a 2-lane roadway to a 4-lane divided facility between Broad Street and Hanover County Line, identified as a 5-10 year project. Additionally, the existing thoroughfare map (Figure 3) identifies a future interchange improvement at I-64 and Ashland Road and additional connections and parallel routes to/from Ashland Road and Broad Street The Comprehensive Plan for Goochland County, Virginia (Adopted February 3, 2009) The previous comprehensive plan was approved in The 2009 update was generated through cooperative efforts of county staff and solicited public participation at public meetings, open houses, and presentations. The document is separated into several chapters, with the primary information provided in 12 sections under Goochland 2028: Goals, Objectives, and Strategies. Section 4.0 of the plan provides relevant information related to transportation. In Section 4.2, Major Transportation Projects identified that affect the pilot study area are as follows: Centerville Village Designated Growth Area From the Amended Land Use Plan of Designated Growth Areas, Centerville Village is one of three focused areas for development. The area designated as Centerville Village encompasses Broad Street (bisects the area), stretching west from the Henrico County Line just west of Sycamore Creek Golf Course (Manakin Road). Page 6 October 2015
11 Figure 2: Existing (2014) Lane Assignments Page 7 October 2015
12 Figure 3: Goochland County Major Thoroughfare Plan (Adopted August 2, 2005) Given approval by the Goochland County planning department and engineering department, reduced connection spacing may be permitted, but not less than 90% of the applicable standard. If the required connection spacing cannot be achieved, a system of joint use driveways and cross access easements is required. Driveway spacing is measured from the closest edge of pavement to the next closest edge of pavement. Major traffic generators shall provide cross access for vehicles and pedestrians. In addition, joint use driveways and cross access corridors should be used wherever feasible to meet driveway spacing standards. Additional standards are provided for minimum driveway width, maximum number of driveways per parcel (or group of parcels/businesses), and emergency access. These access management standards outlined above are more restrictive than VDOT s access management guidelines and as per VDOT s policy can supersede the state access management standards if the County is inclined to implement a more restrictive standard Chapter 17 Financially Constrained Plan Within the document, the 2035 LRTP Estimated Funds (in $1,000s) for the Richmond Area Transportation Projects are as follows: Maintenance - $5,271,022 Interstate - $677,590 Secondary System - $71,783 Statewide - $797,347 Transit Capital - $314,585 Total - $7,132,327 The limits of the area also extend approximately 1 mile north and south of Broad Street. Specific transportation goals defined within Centerville Village include: Realign Route 623 to connect Hockett Road and Ashland Road Widen Broad Street to six lanes up to Route 623 (Ashland Road) Mostly Complete, remaining section between Tuckahoe Creek and Route 623 (Ashland Road) Pursue signalization of Hockett Road at Broad Street Completed Fall of 2014 Provide service roads along Broad Street to facilitate business development and divert traffic to maintain the efficiency of Broad Street Undertake a detailed corridor planning process with property owners along Broad Street One of the implementation priorities is to update the Major Thoroughfare Plan (last updated in 2005) Article 10. Access Management Article 10. Access Management of Goochland County s Zoning and Subdivision Ordinances outlines access management standards for driveway spacing, corner clearance, cross-over spacing, signal spacing, and turn lanes based on the classification of the roadway. According to the document, Broad Street is classified as Access Class #2, as is Route 623. Based on these classifications, the roadways should be designed to the following standards: Driveway Spacing 660 feet (1/8 mile) Corner Clearance 660 feet (1/8 mile) Crossover Spacing 2,640 feet (1/2 mile) Signal Spacing 2,640 feet (1/2 mile) Turn Lanes 200 taper, 200 storage The total funding estimates are matched with estimated project costs, leaving only $87,493,000 for statewide projects. That being said, the 2035 LRTP Constrained Project List does not include any Goochland County projects impacting the pilot study area. Improvements to I-64 are identified, but do not reflect significant impacts to Route 623 (Ashland Road). However, the widening of Route 623 (Ashland Road) between Broad Street and I-64 is identified as a candidate project as is the interchange modification report to reconstruct the interchange with I-64 as a cloverleaf (currently a diamond interchange). In addition, an interchange modification report for the Broad Street and Route 288 interchange is also identified as a candidate project. Lastly, a private/local project is identified to construct a new 4-lane divided facility into the West Creek Business Park, which today is Wilkes Ridge Parkway (recently completed) Atack Property, Henrico County, Virginia (July 19, 2012) The proposed mix-use development abuts Goochland County at the eastern CL and is located on Broad Street. The development will consist of 546 residential units (apartments, townhomes, and condos), 200,000 square feet of medical office space, and 32,000 square feet of retail space, generating 14,329 trips per day (12,297 trips after adjustments for passby and internal capture). The anticipated build year is Impacts to Broad Street in Goochland County are expected in the form of 7,378 new daily trips along the corridor just east of the Route 288 interchange. To the west of the interchange, 1,230 new daily trips along the corridor are expected. Not considering the impacts of the proposed development, the background traffic volumes in 2018 and 2024 will warrant improvements to the Route 288 interchange (installation of traffic signals, increased turn lane storage). The development will proffer the installation of a traffic signal at the western access point and stop controlled access at the eastern access point. Page 8 October 2015
13 4.1.5 Bacova Development, Henrico County, Virginia (March 16, 2011) The proposed mix-use development is located on the northern side of I-64 and will provide access to Broad Street via a new connection along N. Gayton Road, which intersects with the corridor just east of the Goochland County Line. The development will consist of 615 residential units (single family homes, apartments, townhomes), 50,000 square feet of general office space, a convenience market with 10 fueling positions, and 3,500 square feet of fast food restaurant with a drive through, generating 11,498 trips per day (8,336 trips after adjustments for pass-by and internal capture). The anticipated build year is Impacts to Broad Street in Goochland County are expected in the form of 834 new daily trips along the corridor just east of the Route 288 interchange. Proffered improvements by the development will not impact Broad Street Turn Lane and Signal Warrant Studies Broad Street/Route 623 (Hockett Road)/Route 708 (St. Matthew Lane) Signal Warrant Study (updated February 2014) indicated that a traffic signal was likely to be warranted based on planned development near the intersection. This traffic signal was installed during the course of this study in the Fall of The Broadview Shopping Center Turn Lane Warrant Analysis (August 2011) indicated that turn lane improvements are not warranted along Briggs Lane or St. Matthews Lane, which intersect with Broad Street at the western limits of the pilot study area. The West Creek Signal Warrant Study (August 2012) indicated that a traffic signal is warranted at the intersection of Broad Street and the proposed West Creek Boulevard (across from Wawa), now designated as Wilkes Ridge Parkway. 4.2 Existing Land Use A review of existing zoning and land use was conducted for the areas adjacent to the Broad Street and Route 288 study corridors. Per Goochland County s Draft 2035 Comprehensive Plan and geographic information system (GIS) data, land use within the study area currently consists of the following zoning categories: Agriculture Limited (A2) Business General (B1) Residential Limited (R1) Residential General (R3) Residential Planned Unit Development (RPUD) Industrial Limited (M1) Industrial General (M2) As displayed in Figure 4, a majority of the existing land use is zoned as agricultural and is currently undeveloped. There is a concentrated area of business near the Broad Street and Ashland Road intersection as well as near the Route 288 intersection. Additionally, residential developments are generally situated along the Broad Street and Hockett Road corridors. The major retail and commercial development of Short Pump is located immediately east of the study area in Henrico County. Traffic associated with this large development currently utilizes Broad Street to access the Route 288 and I-64 interchanges within the study area. 4.3 Existing Traffic Volumes Existing traffic volumes along a corridor are determined by stationing people and/or automated counting equipment at selected points along the corridor and counting the number of vehicles that pass through that point during a given timeframe. Both automated and human counters can collect data on vehicle classification to distinguish passengers, small trucks, and SUVs from heavy vehicles while counting volumes. Each data collection method was used in order to capture turning movement counts (TMCs) and average daily traffic (ADT) volumes within the study area. Weekday TMCs were collected at the 10 study intersections during the AM (6:00 to 9:00) and PM (4:00 to 6:00) peak periods on Wednesday, November 20, Average weekday daily traffic (ADT) counts were conducted from Wednesday, November 20, to Saturday, November 23, 2013 along segments of Broad Street and Ashland Road. These counts included volumes, classification, and speed. Figure 5 displays the existing ADT volumes for the following locations, refer to Appendix B for detailed traffic count data. The existing geometry of the study intersections along the corridors is displayed in Figure 2. Table 3: Corridor Heavy Vehicle Percentages Heavy vehicle percentages by peak hour, data sources from which vehicle classification was obtained, and general assumptions applied are summarized in Table 3. No seasonal adjustment factor was applied to the traffic counts used for this study. Side Streets 2% 2% Peak Hour Determination The traffic peak hours were reviewed to determine the common AM and PM peak hours of the study corridors. As shown in Table 4, Column A indicates the observed peak hours for study intersections, while Column B shows the corresponding volume for that hour. It was determined that 5 of the 10 intersections shared a common AM peak hour from 7:45 to 8:45 AM. The remaining 5 locations with differing peak hours had at least 91% of the peak volume occurring between 7:45 and 8:45 AM. Nine of the 10 intersections share a common PM peak hour from 4:45 to 5:45 PM. The remaining location with a differing peak hour had at least 96% of the peak volume occurring within the 4:45 to 5:45 PM. Peak hour factors (PHFs) were calculated by movement at the study intersections during the overall study area AM and PM peak hours; if 15-minute counts are not included a PHF of 0.92 was assumed. Study Intersection Table 4: Peak Hour Determination Table AM Peak Hour PM Peak Hour Column A Column B Column C Column D Column E Column F Column G Column H Observed Peak Hour Volume Observed in Column A Volume from 7:45 8:45 AM % of Column C to Column B Observed Peak Hour Volume Observed in Column E Heavy Vehicle % Study Roadway AM PM Eastbound Broad Street 2% 2% Westbound Broad Street 2% 2% Northbound Ashland Road 2% 2% Southbound Ashland Road 2% 2% Volume from 4:45 5:45 PM % of Column G to Column F Broad Street at NB Route 288 Ramps 7:45-8:45 2,628 2, % 4:45-5:45 3,586 3, % Broad Street at SB Route 288 Ramps 7:45-8:45 1,979 1, % 4:45-5:45 1,949 1, % Broad Street at Wilkes Ridge Parkway 7:45-8:45 2,416 2, % 4:45-5:45 3,441 3, % Broad Street at Ashland Road 7:30-8:30 1,270 1,262 99% 4:45-5:45 1,520 1, % Broad Street at Hockett Road 7:45-8:45 1,201 1, % 4:45-5:45 1,512 1, % Ashland Road at WB I-64 Ramps 7:15-8:15 1,259 1,206 96% 4:45-5:45 1,523 1, % Ashland Road at EB I-64 Ramps 7:30-8:30 1,281 1,268 99% 4:45-5:45 1,405 1, % Ashland Road at Forest Road 7:00-8: % 4:00-5: % Ashland Road at Plaza Drive 8:00-9: % 4:45-5: % Ashland Road at Rockville Road 7:45-8: % 4:45-5:45 1,032 1, % Page 9 October 2015


14 Figure 4: Existing Land Use Map Page 10 October 2015
15 Figure 5: Existing Average Daily Traffic (ADT) Figure 6: Existing (2014) AM and PM Turning Movement Volumes Figure 7: Existing (2014) 85th Percentile Speed (by Lane) Page 11 October 2015


16 4.4 Traffic Volume Balancing Using the available turning movement count data and tube count traffic data, traffic volumes were balanced throughout the network in preparation for the existing conditions operational analyses. Traffic volume balancing was required due to the volume variations observed throughout the corridor. Peak hour traffic volumes were balanced using an iterative process of adjusting traffic volumes along Broad Street to the east and west from the Route 288 interchange and along Ashland Road north and south from the I-64 interchange until they were within a reasonable tolerance. The resulting peak hour traffic volumes are summarized in Figure Speed Data As previously mentioned, speed data was collected in conjunction with the ADT volumes for a continuous 96 hours from Wednesday to Saturday. From the collected speed data, the 85th percentile speed was determined per lane and displayed in Figure 7. The 85th percentile speed represents the speed at which 85 percent of drivers are traveling on the corridors. The posted speed limits for Broad Street and Ashland Road are 45 mph. However, a majority of the drivers are traveling between mph on Broad Street west of Ashland Road and between mph on Broad Street east of Ashland Road. Drivers are typically traveling 50 mph or greater on Ashland Road. In addition to the speed data along the study area corridors, the 85th percentile speed was determined for the interchange ramps within the study area. All of the drivers utilizing the interchange ramps at Route 288 and I-64 are traveling at speeds higher than the posted advisory speed limits. A summary of crash types on Broad Street and Ashland Road are provided in Figures 8 and 9. The majority of crashes on Broad Street were angle (41%), rear end (23%), and fixed object off road (13%) crashes. An overrepresentation of rear-end and angle crashes centered at intersections is typical of congested corridors and accounts for the large percentage of injury crashes along the corridor. The majority of crashes on Ashland Road were angle crashes (41%), rear end crashes (23%), and fixed object off road (13%). An overrepresentation of rear-end and angle crashes centered at intersections is typical of congested corridors and accounts for the large percentage of injury crashes along the corridor. Figure 8: Crash Type Summary Broad Street Figure 9: Crash Type Summary Ashland Road 4.6 Crash Analysis An evaluation of corridor safety was conducted based on an analysis of crash summary information and field reconnaissance. Crash data analysis for the study corridors within the study area was conducted using the latest three years of available crash data (January 1, 2010, to December 31, 2012) obtained from VDOT s Roadway Network System. During the three-year period, a total of 70 crashes occurred on the Broad Street and Ashland Road corridors within the study area. A summary of crashes by corridor and year is provided in Table 5. Table 6 summarizes a breakdown of crash severity (i.e., proportion of the crashes involving an injury, fatality, or property damage only). The majority of crashes on Ashland Road, 58% of crashes, resulted in property damage only (PDO) while the majority of crashes on Broad Street, 54% of crashes, resulted in injury. There were no fatal crashes in the study corridors during the three-year period. Table 5: Corridor Crash Summary by Year Study Corridor Broad Street from Wilkes Ridge Parkway to Hockett Road Ashland Road from Broad Street to Forest Road Number of Crashes Total Total Table 6: Corridor Crash Summary by Severity Study Corridor Broad Street from Wilkes Ridge Parkway to Hockett Road Ashland Road from Broad Street to Forest Road PDO = Property Damage Only Total Number of Crashes (%) PDO Injury Fatal 18 (46%) 18 (58%) 36 (51%) 21 (54%) 13 (42%) 34 (49%) 0 (0%) 0 (0%) 0 (0%) Total Crash rates were computed for the study corridors for the three-year study period as shown in Table 7. Crash rates are based on the number of crashes on the specified section, the AADT on the roadway, the time period of analysis, and the length of the section. Table 7 compares the overall crash rate, injury crash rate, and fatal crash rate for each study corridor to the latest available (2012) average statewide crash rates for four- and six-lane, divided roadways with partial control of access (Broad Street) and two-lane undivided roadways (Ashland Road) provided by VDOT. All crash rates are expressed in terms of crashes per 100 million vehicle-miles traveled. All crash rates for both corridors are lower than the 2012 statewide average. Table 7: Corridor Crash Rates Crash Rate^ Crash Number Study Corridor Statewide Average Severity of Crashes ( ) (2012) Broad Street from Hockett Rd to Tuckahoe Creek Bridge Injury Fatal Total Broad Street from Tuckahoe Creek Bridge to Henrico County Line Injury Fatal Total Ashland Road from Broad Street to I-64 Injury Fatal Total ^Crash Rates = Crashes per 100 Million Vehicle-Miles Traveled Page 12 October 2015
17 Page 13 October 2015
18 Page 14 October 2015


19 4.6.1 Safety Field Review An evaluation of field conditions at locations with notable crash patterns between 2010 and 2012 was performed. Most patterns of crashes were located within the influence area of study intersections, defined generally as crashes occurring within 500 feet of the intersection, and were summarized in collision diagrams (Figures 10 through 15). Below are brief summaries of those locations, along with an assessment of the crash data and potential causes for the crashes. Figure 10: Collision Diagram Ashland Road at Plaza Drive Ashland Road and Plaza Drive/Gas Station Driveway (Figure 10) The crash data indicates that four angle collisions have occurred within the past 3 years at this location, associated with the southbound through and eastbound left-turn movements. From observations made in the field, the stop bar on the approach from Plaza Drive is set back from Ashland Road, limiting sight distance to the north. However, no other discernable issues were identified. The movement requires motorists to confirm right-of-way to the south (limited sight distance from Plaza Drive) and the north. The combination of high mainline travel speeds and select visibility may be a factor in the number of crashes that have occurred at this location. Photographs 1 and 2 depict the approach conditions and sight distance for the movement. Photograph 1: Looking South on Ashland Road from the Gas Station Driveway Photograph 2: Traveling South on Ashland Road toward Plaza Drive Page 15 October 2015

. The stop bar on the northbound approach from Hockett Road appears to be placed appropriately, maximizing sight distance (Photograph 4).")
20 Broad Street and Hockett Road (Figure 11) The crash data indicates a pattern of three angle collisions occurring within the 3 year crash analysis period at this location. All angle crashes were associated with the vehicles traveling to and from Hockett Road. From observations made in the field, sight distance from the northbound approach is impacted by the existing development located on the southwest quadrant of the intersection and may have contributed to the pattern of angle crashes at this location (Photograph 3). The stop bar on the northbound approach from Hockett Road appears to be placed appropriately, maximizing sight distance (Photograph 4). A traffic signal was installed at this location Fall of 2014 and should mitigate angle crashes to and from the side street. Photograph 3: Sight Distance Looking West from Northbound Approach Figure 11: Collision Diagram Broad Street at Hockett Road and Ashland Road Photograph 4: Looking at Eastbound Approach Stop Bar Placement Broad Street and Ashland Road (Figure 11) The crash data indicates that four angle collisions associated with the eastbound left turn movement have occurred within the 3 year analysis period at this location. Red light running was not noted in the crash reports as a possible cause for these crashes. VDOT confirmed the eastbound left turn has operated as a protected only phase since 2001 and should not be a contributing factor to this issue. There was no discernable contributing issue identified from the field review. Photograph 5 depicts the eastbound approach conditions. Photograph 5: Eastbound Approach on Ashland Road Page 16 October 2015


21 Broad Street and SB Route 288 Ramps (Figure 12 and Figure 13) Figure 12 summarizes crash patterns for the three year study period from 2010 to A crash pattern of five angle crashes occurred at this intersection. During the course of the study VDOT provided a collision diagram (Figure 13) of crashes from 2009 to 2013, expanding to a five-year period, to better confirm the pattern of angle crashes at this location. This resulted in a total of 19 angle crashes in a five-year period. Most of these crashes are associated with the eastbound through and westbound left-turn movements as well as the westbound through and northbound left-turn movements. From observations made in the field, the queue for the westbound left-turn movement during the AM peak hour reaches the available capacity of the existing storage lane. During observations, several vehicles were observed to execute risky turn maneuvers to access the Route 288 SB On-Ramp when opposed by eastbound through movements. Similarly, the lengthy queues and limited gaps in traffic required the northbound left-turn movement at the intersection to yield right-of-way to others in the intersection for extended periods of time. One such instance was observed where a single vehicle executed the northbound left-turn movement after a westbound left-turn movement yielded the right-ofway. It is likely that this situation occurs on a regular basis, and similar to the westbound leftturn movement, vehicles may execute similar risky maneuvers and be struck by oncoming westbound through vehicles. Photograph 6 illustrates the length of the queues noted in the field. While the queues extended the full length of the storage lane, often times the queue was slowly moving to the point that vehicles were never fully stopped the entire length of the storage lane. Figure 12: Collision Diagram Broad Street at SB Route 288 Ramp Terminal (2009 to 2013) Figure 13: Collision Diagram Broad Street at Route 288 Ramp Terminals Photograph 6: Westbound Left-Turn Queue AM Peak Period Page 17 October 2015
 The crash data indicates that three angle collisions have occurred within the past 3 years at this intersection, associated with the eastbound")


22 Broad Street and NB Route 288 Ramps (Figure 12) The crash data indicates that three angle collisions have occurred within the past 3 years at this intersection, associated with the eastbound through and westbound left-turn movements. From observations made in the field, the westbound approach provides limited sight distance of eastbound vehicles given the crest in Broad Street to the west of this intersection. Sight distance looking west for northbound left-turning vehicles is also impacted by the crest and vegetation overgrowth on the southwest quadrant. The slow turning movement, limited sight distance, and high travel speeds of the eastbound through movement are potential contributing factors in the number of crashes that have occurred at this location. Photograph 7 shows looking west from the westbound left-turn movement at the vertical grade on Broad Street west of the intersection. Figure 14: Collision Diagram Broad Street at Wilkes Ridge Parkway/Little Tuckahoe Court Photograph 7: Looking West from the Westbound Left-Turn Broad Street and Wilkes Ridge Parkway (Figure 14) The crash data indicated a pattern of three angle collisions occurring within the 3 year crash analysis period at this location. All angle crashes were associated with westbound through vehicles on Broad Street and the southbound left-turn movement from Little Tuckahoe Court. A traffic signal was installed at this location Spring of 2014 and should mitigate angle crashes to and from the side street. Photograph 8 shows the wide undefined median before installation of the traffic signal. The medians on Broad Street were extended in conjunction with the traffic signal installation to better define the intersection area. Photograph 8: Looking West at Broad Street and Wilkes Ridge Parkway (per Traffic Signal Installation) Page 18 October 2015
 The crash data indicates that five rear end collisions and one angle collision have occurred within the past 3 years at this location, associated with the")

23 Ashland Road at I-64 Ramps (Figure 15) The crash data indicates that five rear end collisions and one angle collision have occurred within the past 3 years at this location, associated with the southbound through/left-turn movements and the opposing northbound through movement. From observations made in the field, the queue for the southbound left-turn movement extends north beyond the overpass to I-64. The lack of an exclusive turning lane to allow storage of turning vehicles outside the through travel lane is likely the cause for the rear end collisions. With respect to angle collisions, the intersection control requires the southbound left-turn movement to yield to the northbound right-turn movement, potentially trapping vehicles in the intersection, which may be the cause for this type of collision. Photograph 9 provides an example of the queues observed during field observations. Figure 15: Collision Diagram Ashland Road at I-64 Ramp Terminals Photograph 9: Vehicle Queue on SB Approach to EB I-64 Page 19 October 2015
24 4.7 Review of Existing Access Management An evaluation of the existing driveways and access points along the project study area corridors was completed to assess compliance with VDOT minimum spacing standards for commercial entrances, intersections, and median crossovers. According to VDOT, Broad Street and Ashland Road are classified as Urban Minor Arterial roadways 1. From the VDOT Roadway Design Manual, Appendix F, Table 8 provides a summary of the minimum spacing requirements for a posted speed limit of 45 mph along various classifications of roadways. Table 8: Minimum Spacing Standards for Commercial Entrances, Intersections, and Median Crossovers Highway Functional Classification Spacing between Signalized Intersections Minimum Centerline to Centerline Spacing (Feet) Spacing between Unsignalized Intersections and Full/Directional Median Crossovers and Other Intersections or Median Crossovers Spacing between Full Access Entrances and Other Full Access Entrances, Intersections, or Median Crossovers Spacing between Partial Access Entrances (One or Two-Way) and Other Entrances, Intersections, or Median Crossovers Principal Arterial 1,320 1, Minor Arterial 1, Collector Source: VDOT Roadway Design Manual, Appendix F (Table 2-2) Figures included in Appendix B provide an overview of the existing spacing between driveways, entrances, median crossovers, and intersections. The measurements are depicted to represent compliance (green), non-compliance (red), or not applicable (orange). A measurement was considered not applicable when measuring the spacing relative to a private residential driveway. Since the location of such driveways is dictated by parcel boundaries, these were not considered when assessing compliance with VDOT minimum spacing standards. Along Broad Street, spacing standards are largely satisfied based on the existing roadway classification as an Urban Minor Arterial. Overall, nine (9) locations were identified as not meeting the required spacing between driveways, entrances, median crossovers, and intersections. Anticipating that future growth and development as well as the 2014 reclassification of the roadway from Short Pump to Route 288 as an Urban Principal Arterial, a secondary assessment of spacing standards was performed the entire length of the study based on the Principal Arterial requirements listed in Table 8. Assuming the reclassification, two additional locations are considered substandard by VDOT regulations. This assessment assumes no roadway improvements or modified intersection control. The evaluation of the roadway would yield different results in the event that traffic signals are added or additional site driveways constructed. Most notably, the existing spacing between the Route 288 NB Ramps and Wilkes Ridge Parkway of 1,132 will not meet the spacing requirement between signalized intersections. 1 Broad Street and Ashland Road were classified as Urban Minor Arterial roadways at the beginning of this study. Broad Street was re-classified as a Principal Arterial from the east to the Route 288 interchange in 2014 as part of the statewide Functional Class update. Along Ashland Road, four locations were identified as not meeting the required spacing. Access management is more difficult to enforce along Ashland Road given the two-lane, undivided nature of the roadway, which is classified as an Urban Minor Arterial. Based on an assessment of the roadway as an Urban Principle Arterial, the majority of spacing under existing geometry and operations do not meet VDOT regulations, with seven additional locations considered substandard. Of particular concern, is the spacing between the I-64 off-ramps at Ashland Road which does not meet the spacing requirement between an unsignalized intersection and a signalized intersection. Should the EB I-64 off-ramps intersection be converted to a signalized intersection, it will fall well below the minimum spacing between signalized intersections (1,320 feet) at the current spacing of 933 feet. Application of access management practices would benefit corridor operations and potentially alleviate some of the current crash patterns identified in the crash data. The attached figures in Appendix B graphically depict access management compliance under the classifications of Urban Minor Arterial and Urban Principle Arterial. 4.8 Operational Field Observations The following is a summary AM and PM peak hour observations collected during the field review conducted Wednesday, March 12, AM Peak Hour During the AM peak hour, the primary directions of travel are eastbound along Broad Street, originating primarily from the west, and south to Route 288 by way of the southbound on-ramp as evidenced by the heavy westbound left-turn volume at the unsignalized intersection. Broad Street volumes are relatively balanced east of the Route 288 southbound ramps. The Wawa convenience store was the largest traffic generator within the project study area, but minimal delay was observed for vehicles exiting the site. The greatest delay noted during the AM peak was the westbound left-turn onto Route 288. The queue extended the full length of the storage lane, at times creating delay for the inside westbound through lane as vehicles began to decelerate upon entering the storage lane. The longest queues for this movement were observed between 8:00 AM and 8:20 AM. Due to the lengthy queues, the northbound left-turn onto westbound Broad Street at the Route 288 off-ramp experienced significant delays. Required to yield to the westbound left-turn and eastbound through movements, very few opportunities were available for vehicles to execute this maneuver. One vehicle was noted to wait in excess of 2 minutes, only able to access Broad Street as a result of a turning vehicle that yielded the right-of-way. At the intersection of Broad Street and Route 623 (Ashland Road), vehicles queues for the eastbound left-turn lane were observed to peak for less than three cycles just before 8:00 AM. The remainder of the peak, existing signal operations accommodated demand and vehicle queues were minimal. Travel along Ashland Road is moderately balanced between the AM and PM peak hours The southbound left-turn movement to eastbound I-64 queued north past the westbound I-64 off-ramp. Only a few instances of this were observed during the AM peak hour around 8:30 AM. The southbound left-turn into the gas station just south of I-64 experienced some delay caused by northbound vehicles on Ashland Road. The gas station was noted to attract a fair amount of heavy truck traffic, with as many as seven heavy vehicles observed on site at one time. Page 20 October 2015
25 4.8.2 PM Peak Hour Travel along Broad Street during the PM peak hour is moderately balanced, with slightly higher volumes traveling in the westbound direction. The Route 288 northbound off-ramp to eastbound Broad Street carries a significant volume of traffic, just over 1,400 vehicles in a single lane. Since the move is unopposed by the eastbound through volume, which predominantly travels along the innermost two lanes. Instances of off-ramp traffic crossing all eastbound lanes of Broad Street to access the gas station were noted throughout the peak hour, although vehicle conflicts were not observed during this maneuver. Operations at the intersections west of Route 288 were uneventful. Along Ashland Road, minimal vehicle queues were observed. The delay experienced by the southbound left-turn movement onto I-64 eastbound was not nearly as significant during the PM peak hour, and although the westbound left-turn volume at the I-64 westbound off-ramp is much greater, the existing signal operations accommodated the demand well. Queues of vehicles were noted on the southbound approach to the signalized off-ramp intersection, as a result of longer side street split times, but the queues were cleared during the subsequent mainline green phase. No other significant queuing or delay was noted along Ashland Road. 4.9 Other Considerations Based on the field review, the following minor improvements and/or modifications are recommended to improve operations and safety on the study corridors. VDOT operates and maintains the Broad Street and Ashland Road corridors, as such these recommendations are documented for VDOT to prioritize and address as the Department deems necessary. Extend the median noses on Broad Street at the intersection with Wilkes Ridge Parkway to reduce the travel distance for the left-turn movements and better define the limits of the intersection. Install Right Lane Must Turn Right signs (MUTCD sign R3-7) on the eastbound approach to the intersection of Broad Street and Wilkes Ridge Parkway. Replace existing red ball indications for the protected left-turn movements at the intersection of Broad Street and Ashland Road with arrow indications to be compliant with the MUTCD. Install No Left Turn graphical sign (MUTCD sign R3-2) at the unsignalized northbound approach to the intersection of Broad Street and Ashland Road for vehicles that inadvertently enter the stub approach to the intersection. Conversely, consider installing barriers to prohibit access. In addition, replace the Left Turn Only sign (MUTCD sign R3-5) for the westbound approach with a similar U-Turn Only sign (MUTCD sign R3-5). Evaluate the need for Signal Ahead signs (MUTCD sign W3-3) at the intersection of Broad Street and Ashland Road. Signal visibility is not restricted along any approach to the intersection. Restripe the stop bar for the northbound approach to Broad Street on Hockett Road to be continuous (currently a broken stop bar). Remove the existing non-standard turndown guardrail end treatments along Ashland Road, northbound and southbound directions, in the vicinity of Plaza Drive. Remove the Yield sign (MUTCD sign R1-2) controlling the merge for the southbound left-turn and northbound rightturn movement at the intersection of Ashland Road and the eastbound I-64 ramps. Install the sign to control the northbound right-turn movement to allow free-flow access for the southbound left-turn movement. Verify proper operation of vehicle detection for the northbound left-turn movement at the intersection of Ashland Road and the westbound I-64 ramps. Intermittent operations were noted in the field. Possible cause may be that the detector is programmed with a delay (unable to verify without access to the signal cabinet). Replace the red ball indication for the rightmost signal on the northbound approach to the intersection of Ashland Road and the westbound I-64 ramps Existing (2014) Operational Analysis Through methodology outlined by the Transportation Research Board s (TRB) Highway Capacity Manual (HCS), turning movement counts were used in conjunction with Synchro Professional 8.0 to determine existing levels of service at all the study area signalized and unsignalized intersections. Level of Service (LOS) describes the quality of the driving experience using six levels designated A through F. Each LOS is defined by a range of quantitative measurements appropriate to the described facility, such as density and speed of traffic for a highway LOS or the number of vehicles stopped and average stop duration for a traffic signal LOS. Table 9: Signalized and Unsignalized Intersection LOS Criteria Intersection Delay per Vehicles (s) LOS Signalized Unsignalized A B >10 20 >10 15 C >20 35 >15 25 D >35 55 >25 35 E >55 80 >35 50 F >80 >50 Source: Transportation Research Board, Highway Capacity Model 2000 A Synchro model for the AM and PM peak hours was developed to analyze the 10 study area intersections located on the arterials within the study area. HCM 2000 methodology was used for all analyses using Synchro. The ranges of delay for each intersection LOS are shown in Table 9. Existing signal timing parameters were provided by VDOT and are included in Appendix B or reference. The Synchro model was calibrated to reflect the existing traffic conditions observed during the field review. For this operational analysis, the following assumptions were used:» 12-foot lane widths» Heavy vehicle percentages by approach from turning movement count data» Peak hour factors (PHFs) by approach from turning movement count data» Existing lane geometry (shown in Figure 2)» Existing traffic signal timings and phasing for all signalized intersections» Balanced existing peak hour traffic volume data (shown in Figure 6) Page 21 October 2015
26 » Field review observations of existing queue lengths and corridor operation Tables summarizing the average vehicle delay and HCM LOS by movement, approach, and intersection (measured in seconds per vehicle) for the unsignalized and signalized study intersections are included in Appendix C. Figure 16 shows a graphical representation of the LOS results in the study area. The following key delay and level of service conclusions were determined from the AM and PM peak hour analysis results: Page 22 October 2015
27 Figure 16: Existing (2014) Level of Service Page 23 October 2015


28 AM Peak Hour All of the study area intersections operate at LOS B or better with the exception of the Ashland Road and I-64 WB Onand Off-Ramps intersection Side-street approaches generally operate at LOS C or better with the exception of the following approaches: o WB I-64 Off-Ramp o EB I-64 Off-Ramp o SB Hockett Road/St. Matthews Lane o SB Ashland Road at Broad Street o NB Route 288 Off-Ramp PM Peak Hour All of the study area intersections operate at LOS B or better with the exception of the following intersections: o Ashland Road and WB I-64 On- and Off-Ramps o Broad Street and Wilkes Ridge Parkway/Little Tuckahoe Court Side-street approaches generally operate at LOS C or better with the exception of the following approaches: o I-64 WB Off-Ramp o I-64 EB Off-Ramp o SB Hockett Road/St. Matthews Lane o NB Hockett Road 4.11 Bicycle and Pedestrian Environment o SB Ashland Road at Broad Street o Route 288 NB Off-Ramp o SB Wilkes Ridge Parkway/Little Tuckahoe Court The presence of sidewalks, crosswalks, and multi-use paths or trails is an indication of how accommodating an area is to non-vehicular movements. Based on general observations conducted during the field visit continuous accommodations for pedestrians is not provided, this is primarily due to much of the corridors being undeveloped with a lack of facilities. The following pedestrian and bicycle facilities were noted from the field review: Limited sidewalk is provided on the north side of Broad Street in the vicinity of the Wilkes Ridge Parkway intersection, which provides connectivity to existing sidewalk to the east of the project study area. Pedestrians were observed using this section during the field review (Photograph 10). Sidewalk is provided on the south side of Broad Street east of Wilkes Ridge Parkway. With the exception of a limited segment of sidewalk constructed on the northwest quadrant of the intersection of Broad Street and Hockett Road, no other pedestrian accommodations are provided west of Wilkes Ridge Parkway within the study area. A limited number of curb ramps have been constructed along Broad Street, but no sidewalk is provided to connect the sidewalk ramps. No bicycle lanes are provided within the corridor limits. However, based on input from stakeholders and the Steering Committee there is a strong bicyclist community in Goochland County due to the rural setting and cyclists have been observed on Hockett Road south of Broad Street. Photograph 10: Pedestrians Along North Broad Street Near Wilkes Ridge Parkway 5.0 Future Traffic Volume Projections In order to understand future traffic conditions on the study corridors, traffic volumes were forecasted for the future year analysis. The following sections describe the methodology for developing growth rates and projecting future traffic volumes for the study corridors. 5.1 No-Build (2035) Traffic Volumes Background Growth Rates No-Build (2035) traffic volumes represent an estimate of background traffic through the study area without future development. To establish no-build traffic volumes annualized background growth rates were established for the study corridors. The following resources were used in the development of these growth rates: Historical VDOT Annual Average Daily Traffic (AADT) volume estimates Data obtained from the 2008 Base Year and 2035 Horizon Year Richmond/Tri-Cities Regional Travel Demand Model Transportation analysis zone (TAZ) socioeconomic data from the Richmond/Tri-Cities Regional Travel Demand Model Growth rates used in approved developments within the study area Historical VDOT Annual Average Daily Traffic (AADT) volume estimates Based on historical data from VDOT s daily traffic volume estimates, annual growth rates were calculated for the study corridors. Annual average daily (AADT) traffic volumes were compiled from 2001 to 2012 to identify historical traffic volume trends for major roadways within the study area. Route 288 was constructed through the study area in 2004; therefore, years 2001 through 2003 were excluded from the comparison to decrease the likelihood of outliers or atypical growth patterns with in the data prior to Route 288 being constructed. Table 10 shows the calculated annual growth rates for roadways within the study area based on the VDOT historical traffic data. Table 10: Vehicle Historical Annual Average Growth Rate ( ) Roadway From To Annual Growth Rate Average Growth Rate Cardwell Rd Manakin Rd +0.23% Broad St Manakin Rd Ashland Rd +1.09% Ashland Rd Route % +1.93% Route 288 Henrico CL +5.20% Ashland Rd Broad St I % I-64 Hanover CL +0.00% -0.45% Hockett Rd Snead Road Broad St -4.30% -4.30% West Creek Pky Tuckahoe Creek Pky +12.9% Route 288 Tuckahoe Creek Pky Broad St +16.0% % Broad Street I % Oilville Rd Ashland Rd -1.73% EB I-64 Ashland Rd Route % +0.48% Route 288 Henrico CL +2.63% Oilville Rd Ashland Road +1.33% WB I-64 Ashland Rd Route % 1.66% Route 288 Henrico CL +3.13% I-64 Bi-Directional Oilville Rd Ashland Rd -0.31% Ashland Rd Route % 1.03% Route 288 Henrico CL +2.88% Page 24 October 2015
29 Richmond/Tri-Cities Regional Travel Demand Model Projected daily volumes from the 2008 base year and 2035 horizon year of the Richmond Regional Transportation Planning Organization (RRTPO) travel demand model (TDM) were reviewed. The future volumes were taken from multiple model links that comprise the roadways within the study area. Table 11 shows the compared model links as well as the 2008 and 2035 daily traffic volume assignment, the percent change between model assignment years, and the average percentage change along select corridor segments. Table 11: Travel Demand Model Traffic Projections Roadway From To I-64 Ashland Rd Route % Route 288 I % Manakin Rd Ashland Rd +3.0% Broad St Ashland Rd Route % Route 288 N. Gayton Rd +3.8% Tuckahoe Creek Broad St +2.0% Route 288 Broad Street I % Broad St Rockville Rd +3.7% Ashland Rd Rockville Rd I % I-64 Pouncy Tract Rd +1.5% Socioeconomic Data In addition to the historical volume data and future projection model volumes, socioeconomic data (population, households, and employment) for the study area transportation analysis zones was obtained from the Richmond/Tri-Cities TDM. Data was provided for the 2008 base year and the 2035 horizon year). The study area is currently located within the boundaries of the following Goochland County TAZ s: 1007, 1008, 1009, 1010, 1013, and 1014 as shown in Figure 17 From these TAZ s, the raw change and annual growth rates between 2008 and 2035 were calculated for each type of socioeconomic data (population, households, employment) to determine the projected future traffic volumes as shown in Table 12. Table 12: Goochland County Traffic Analysis Zone Socioeconomic Data (Population and Households) Population Residential Households Total Employment County TAZ Data (2008 & 2035) Raw Change Annual Growth Rate Raw Change Annual Growth Rate Raw Change Annual Growth Rate TAZ % % % TAZ % % % Goochland TAZ % % % TAZ % % % TAZ % % % TAZ % % 5, % Subtotal 2, % 1, % 7, % Henrico TAZ % % % TAZ 778 2, % 1, % 2, % TAZ % % % TAZ % % % Subtotal 3, % 2, % 2, % Total 6, % 3, % 9, % Planned or Approved Development Table 13 summarizes the major approved developments, identified during discussions with the Goochland County and VDOT staff, within the general study area. All four developments are located just east of the study area in Henrico County. Annual growth rates from the traffic impact analyses conducted in support of these developments ranged from 2% to 3% and were referenced as part of this analysis for consistency. Build-out of these developments are anticipated within in the next three years and are projected to generate the new daily trips 48,610 vehicles per day on Broad Street east of Route 288. This information served as an additional data point to validate future 2035 traffic volumes developed as part of this study. Development Table 13: Approved Developments Annual Growth Rate from TIA Use Proposed Land Use and Units Residential 486 Dwelling Units Office 200,000 Square Feet Projected New Daily Trips on Broad Street East of Route 288 (vehicles/day) Atack Property 2% Mixed-Use 14,330 Retail 32,000 Square feet West Broad Market 2% Retail Retail 460,000 Square feet 18,310 GreenGate Development Bacova Development 2% Mixed-Use 3% Mixed-Use Residential 300 Dwelling Units Office 148,000 Square Feet Retail 76,000 Square feet Residential 615 Dwelling Units Office 50,000 Square Feet Retail 3,500 Square feet Growth Rates and No-Build (2035) Traffic Volume Projections In review of the historical traffic volumes, projected growth estimated from the regional TDM, projected changes in socioeconomic data, and approved growth rates used in adjacent traffic impact studies, the growth rates in Figure 18 were recommended for use in developing future traffic volume projections for the study corridors. No-Build (2035) traffic volumes were developed by applying the growth rates to existing volumes, projected in a linear manner, from the existing base year of 2015 to the future year of This approach is based on the assumption that the rates developed as part of the study take into account not only the growth captured and reflected in the TDM but also the daily trips associated with the identified approved developments. This same methodology also was used to obtain 2035 peak hour traffic volumes. For reference, existing 2013 average weekday daily traffic volumes and AM and PM peak hour intersection turning movement volumes are shown in Figure 5 and Figure 6. No-Build 2035 traffic volume projections for average weekday daily traffic volumes and AM and PM peak hour intersection turning movements are shown in Figure 19 and Figure 20. 7,570 8,400 Page 25 October 2015
30 Figure 17: Traffic Analysis Zone Map Page 26 October 2015
31 Figure 18: Proposed Annual Future Growth Rates Page 27 October 2015
32 Figure 19: No-Build (2035) Annual Daily Traffic (ADT) Volumes Page 28 October 2015
33 Figure 20: No-Build (2035) AM and PM Peak Hour Traffic Volumes Page 29 October 2015
34 5.2 Build (2035) Traffic Volumes The following sections document the development of Build (2035) traffic volumes which consist of background traffic growth plus build-out of future development within the study area Land Use and Future Development and Trip Generation Two future land use scenarios were considered and vetted with the Steering Committee for input on the type and amount of future development anticipated by the horizon year The study area was segmented into development zones based on land use and assumptions regarding the following factors that were determined for each scenario in coordination with the Steering Committee: Land use referenced existing Centerville land use plan and input gained from the stakeholder interviews to make assumptions as to type of land use per zone Mixed-Use for zones assumed to develop as mixed-use the percent of residential, commercial, and retail components were assumed Percent of developable land percent of land that could be developed, discounting the anticipated area of open space and unusable land due to topographic features or for environmental reasons Floor-to-area ratio defined as the ratio of a building's total floor area (gross floor area) to the size of the piece of land upon which it is built Percent of pass by trips defined as an intermediate stop, upon exit, trips will continue to travel in the same direction they were traveling before stopping, not a new trip on the roadway network Percent of internal capture defined as trips made within mixed-use developments, these trips are on internal roadways only and do not use adjacent main roadways, results in trip reductions for mixed-use developments Table 14 summarizes the total amount of residential, office, and commercial development assumed and the estimated trip generation for both scenarios. Trip generation potential for build-out of the study area was determined using the traffic generation data published in the Institute of Transportation Engineers Trip Generation, 9th Edition. Scenario 2, the more aggressive scenario, assumes less residential and more office and commercial developments (higher generator of trips). The Steering Committee decided to proceed with the Scenario 2 trip generation in order to illustrate a conservative development scenario. A detailed summary of land use assumptions and trip generation for Scenario 2 is provided in Table 15 and Figure 21, information for Scenario 1 is provided in Appendix E for comparison. Land Use Scenario Table 14: Build-Out (2035) Land Use Scenarios and Resulting Trip Generation Major Trip Generating Land Uses Trip Generation Table 15: Residential Trip Generation Office - Land Use Scenario Commercial 2 Higher Daily Intensity Trips AM (Units) (Square Feet) (Square Feet) (veh/day) (veh/hr) PM (veh/hr) Scenario 1 Lower Intensity 1,711 1,403,992 1,494,981 83,458 5,724 9,000 Scenario 2 Higher Intensity 1,569 1,559,141 2,460, ,309 6,055 11,123 Difference , , , ,123 Percent Difference -8% +11% +65% +32% +6% +24% Trip Distribution The directional distribution of trips generated by the development zones is based on a review of the existing traffic volumes and an understanding of travel patterns within the study area. From this review, the following traffic distributions were derived and approved by the Steering Committee to be applied to the analysis of the study area. Figure 19 illustrates the existing and the future trip distribution percentages for the study area. 5% to/from the north on Ashland Road 8% to/from the west on I-64 17% to/from the east of I-64 10% to/from the west on Broad Street 25% to/from the east on Broad Street 5% to/from the north on Hockett Road 15% to/from the north on Route % to/from the south on Route Build (2035) Traffic Volumes Minimally Managed Access Scenario (MMAS) Based on the trip generation and the directional distribution, the build-out development traffic was assigned to the adjacent street network assuming two access scenarios: Minimally Managed and Ultimately Managed. The purpose of developing and analyzing two access management scenarios was to provide a comparison of access management solutions. Projected 2035 Build traffic volumes were determined by adding the anticipated development traffic volumes to the projected 2035 No-Build volumes. The VDOT Access Management Guidelines was utilized to determine the maximum amount of access allowed under those guidelines and determine the most likely access locations based on existing crossovers and corridor constraints. For the Minimally Managed Access Scenario (MMAS), the VDOT minor arterial functional classification was used to determine the maximum amount of access locations along Broad Street and Ashland Road which is consistent with the existing functional classification. Table 16 displays the minimum centerline to centerline spacing outlined in the VDOT Access Management Guidelines. Table 16: VDOT Access Management Spacing MMAS Highway Functional Classification Spacing between Signalized Intersections Minimum Centerline to Centerline Spacing (Feet) Spacing between Unsignalized Intersections and Full/Directional Median Crossovers and Other Intersections or Median Crossovers Spacing between Full Access Entrances and Other Full Access Entrances, Intersections, or Median Crossovers Spacing between Partial Access Entrances (One or Two-Way) and Other Entrances, Intersections, or Median Crossovers Principal Arterial 1,320 1, Minor Arterial 1, Collector Source: VDOT Roadway Design Manual, Appendix F (Table 2-2) Once the proposed MMAS was determined, trips were assigned to each of the intersections and their corresponding driveways. Due to the large amount of development zones previously discussed in Section 5.2.1, trip generation from the various development zones were aggregated into six assignment zones. Figure 22 illustrates the aggregation of the development zones into the six assignment zones. The assignment zones were aggregated based on geographic location and similar land use characteristics. Page 30 October 2015


35 Table 15: Trip Generation - Land Use Scenario 2 Higher Intensity Figure 21: Land Use by Zone - Scenario 2 Higher Intensity Page 31 October 2015
 Quadrant 6 Total *Assumes 30% of Zone 7 is included in")
36 Figure 22: Trip Assignment Zones Table 17: Example Trip Assignment by Zone Quadrant #6 - Southwest Zone Land Use AM PM Enter Exit Total Enter Exit Total 7 Commercial* Residential** Residential Residential Quadrant 6 Subtotal Internal Capture (15%) Quadrant 6 Total *Assumes 30% of Zone 7 is included in Quadrant #6 **Assumes 45% of Zone 10 is included in Quadrant # Trips were assigned to the roadway network to/from each aggregate zone, as shown in Table 17, based on the trip distribution percentages shown in Figure 23. The existing distribution, calculated from the turning movement counts, were manually adjusted to reflect estimated changes due to build-out of the study area. Figures showing trip assignment to/from each zone is provided in Appendix E. Figures 24 and 25 illustrate the build (2035) MMAS traffic volumes (including background growth and build-out site trips) for Ashland Road and Broad Street, respectively based on the VDOT guidelines. Detailed MMAS figures with approximate locations and spacing are provided in Appendix E. Table 18: MMAS Compared to Existing Access Broad Street Allowed Access Based on VDOT Minimum Spacing Guidance (MMAS) Number of Access Points Ashland Road Allowed Access Based on VDOT Minimum Spacing Guidance (MMAS) Existing Existing Type of Access Access Access Signalized Unsignalized - Full Movement Unsignalized - Directional Crossover Unsignalized - Right-In/Right-Out Total Number of Access Points = Number of Access Points per Mile = If access is managed to the minimum spacing guidelines the total number of access points, between the two study corridors, would more than double, from the existing total of 36 to 73. Assuming the MMAS, the number of signalized intersections would increase by seven, the number of full movement unsignalized access points would decrease for each corridor, and the number of allowable right-in/right-out driveways would triple Build (2035) Traffic Volumes Ultimately Managed Access Scenario (UMAS) An iterative approach was used to determine access based on a more conservative spacing guidelines. Table 19 displays the minimum centerline to centerline spacing outlined in the VDOT Access Management Guidelines assuming more conservative spacing of a principal arterial. Goochland County s existing access management spacing guidelines included in the Subdivision Ordinance (Article 10. Access Management) and shown below, were also referenced in this analysis. Driveway Spacing 660 feet (1/8 mile) Corner Clearance 660 feet (1/8 mile) Cross-over Spacing 2,640 feet (1/2 mile) Highway Functional Classification Signal Spacing 2,640 feet (1/2 mile) Turn Lanes 200 taper, 200 storage Table 19: VDOT Access Management Spacing Principal Arterial Spacing between Signalized Intersections Minimum Centerline to Centerline Spacing (Feet) Spacing between Unsignalized Intersections and Full/Directional Median Crossovers and Other Intersections or Median Crossovers Spacing between Full Access Entrances and Other Full Access Entrances, Intersections, or Median Crossovers Spacing between Partial Access Entrances (One or Two-Way) and Other Entrances, Intersections, or Median Crossovers Principal Arterial 1,320 1, Minor Arterial 1, Collector Source: VDOT Roadway Design Manual, Appendix F (Table 2-2) Multiple iterations were considered with each scenario assuming more conservative access spacing. Build-out (2035) traffic volumes were rerouted with each revised iteration of access. The most conservative assumption, the ultimately managed access scenario (UMAS), is summarized in Table 20 and was used to inform the access management recommendations detailed in Section 9.3. Figures 26 and 27 illustrate the proposed UMAS for Ashland Road and Broad Street, respectively. Detailed UMAS figures with approximate locations and spacing are provided in Appendix E. Table 20 displays the difference between the minimally managed and ultimately managed access scenarios. The UMAS introduces an additional traffic signal on Broad Street, eliminates all full movement unsignalized access points on Broad Street, reduces the number of right-in/right-out access points by more than 50%, and reduces the total number of access points by 26%. An operational comparison between the MMAS and UMAS is discussion in Section 7.1. Table 20: Access Scenarios MMAS vs. UMAS Broad Street Number of Access Points Ashland Road Allowed Access Proposed Access Allowed Access Proposed Access Based on VDOT Minimum Based on Based on VDOT Minimum Based on Spacing Guidance Ultimate Spacing Spacing Guidance Ultimate Spacing Type of Access (MMAS) (UMAS) (MMAS) (UMAS) Signalized Unsignalized - Full Movement Unsignalized - Directional Crossover Unsignalized - Right-In/Right-Out Total Number of Access Points = Number of Access Points per Mile = Page 32 October 2015
37 Figure 23: Existing and Proposed Trip Distribution Page 33 October 2015
38 Figure 24: Build (2035) AM and PM Total Volume Ashland Road Minimally Managed Access Scenario Page 34 October 2015
39 Figure 25: Build (2035) AM and PM Total Volume Broad Street Minimally Managed Access Scenario Page 35 October 2015
40 Figure 26: Build (2035) AM and PM Total Volume Ashland Road Ultimately Managed Access Scenario Page 36 October 2015
41 Figure 27: Build (2035) AM and PM Total Volume Broad Street Ultimately Managed Access Scenario Page 37 October 2015
42 6.0 Future (2035) Traffic Conditions 6.1 No-Build (2035) Operational Analysis Future no-build (2035) traffic operational analyses were conducted to evaluate the results of future traffic demand, build-out of the study area, on the existing roadway network. Existing roadway geometry plus the planned improvements at I-64 and Ashland Road were used in this analysis with optimized signal timings and projected 2035 peak hour volumes. No-Build lane assignments were assumed to equal the existing lane assignments summarized previously in Figure 2. Similar to the existing conditions operational analysis, the no-build analyses were performed using Synchro Professional 8.0 to determine no-build intersection delay, LOS, and maximum queue lengths. The intent of the no-build conditions analysis was to provide a general understanding of the baseline future traffic conditions to be used to evaluate the effectiveness of future proposed roadway recommendations. Tables summarizing the delay, HCM LOS, and queuing results for the study area intersections are included in Appendix C. Figure 28 shows a graphical representation of the intersection and approach LOS results for the study intersections. The results indicate that a majority of the signalized intersections operate at LOS B or better during the AM and PM peak hours. The following key findings for the study intersections were determined from the AM and PM peak hour analysis results: AM Peak Hour All of the study area intersections operate at LOS B or better with the exception of the Ashland Road at WB I-64 On/Off-Ramps intersection Approaches generally operate at LOS C or better with the exception of the following approaches: o WB I-64 Off-Ramp o EB I-64 Off-Ramp o EB Rockville Road PM Peak Hour o NB/SB Hockett Road/St. Matthews Lane o NB Route 288 On/Off-Ramps All of the study area intersections operate at LOS B or better with the exception of the following two intersections: o Ashland Road and WB I-64 On- and Off-Ramps o Broad Street and Wilkes Ridge Parkway/Little Tuckahoe Court Approaches generally operate at LOS C or better with the exception of the following approaches: o I-64 WB Off-Ramp o I-64 EB Off-Ramp o EB Rockville Road o NB/SB Hockett Road/St. Matthews Lane 6.2 Build (2035) Operational Analysis o SB Ashland Road at Broad Street o NB Route 288 On/Off-Ramps o SB Wilkes Ridge Parkway/Little Tuckahoe Court Future build (2035) traffic operational analyses were conducted to evaluate the results of future traffic demand on the proposed roadway network. Proposed roadway geometry was used in this analysis with optimized signal timings and projected peak hour volumes. Similar to the existing and no-build conditions operational analysis, the build analyses were performed using Synchro Professional 8.0 to determine build intersection delay, LOS, and maximum queue lengths. The intent of the build analysis was to determine capacity and traffic control improvements that are needed to accommodate future 2035 traffic demand. Build traffic conditions analyses were performed for both the minimally managed and ultimately managed access scenarios. Tables summarizing the delay, HCM LOS, and queuing results for the study area intersections are included in Figures 29 through 32 show a graphical representation of the intersection and approach LOS results for the study intersections assuming the minimally and ultimately managed access scenarios. Based on the results of the MMAS and UMAS operational analyses, roadway improvements are required to mitigate anticipated congestion which will occur with build-out of the study corridors. The following analysis results reflect the necessary lane configurations for the corridor to maximize peak hour operations under future conditions. Figures reflecting the laneage needed to achieve the LOS results described are provided in Appendix E. The type of operational and capacity improvements recommended include the installation and modifications of traffic signals, optimization of traffic signal operations, changes in lane stripping, additional turn lanes, etc. Detailed descriptions of these improvements are provided in Section Minimally Managed Access Scenario (MMAS) The following key findings for the study intersections were determined from the peak hour MMAS analysis results: MMAS AM Peak Hour All of the study area intersections operate at LOS B or better with the exception of six signalized intersections and two unsignalized intersections which operate at LOS C or worse. Approaches generally operate at LOS C or better. There are nine approaches that operate at LOS E or worse, these are generally located at the major signalized intersections or the unsignalized full crossovers. MMAS PM Peak Hour All of the study area intersections operate at LOS D or better with the exception of six signalized intersections and three unsignalized intersections which operate at LOS E or worse. A number of approaches, 39, are projected to operate at LOS E or worse and are located at signalized intersections, unsignalized full crossovers, and right-in/right-out driveways Ultimately Managed Access Scenario (UMAS) The following key findings for the study intersections were determined from the peak hour UMAS analysis results: UMAS AM Peak Hour All of the study area intersections operate at LOS B or better with the exception of nine signalized intersections and one unsignalized intersection which operate at LOS C or worse. Approaches generally operate at LOS C or better. There are eight approaches that operate at LOS E or worse, these approaches are located at the signalized intersections, this is one less than the number of MMAS approaches. UMAS PM Peak Hour All of the study area intersections operate at LOS D or better with the exception of five signalized intersections which operate at LOS E or worse, this is 3 less signalized intersections when compared to the MMAS. A number of approaches, 33, are projected to operate at LOS E or worse and are located primarily at signalized intersections, and right-in/right-out driveways, this is 6 less than the number of MMAS approaches. Page 38 October 2015
43 Figure 28: No-Build (2035) Peak Hour Level of Service (LOS) Page 39 October 2015
44 Figure 29: Build (2035) Minimally Managed Access Scenario (MMAS) Peak Hour Level of Service (LOS) Ashland Road Page 40 October 2015
45 Figure 30: Build (2035) Minimally Managed Access Scenario (MMAS) Peak Hour Level of Service (LOS) Broad Street Page 41 October 2015
46 Figure 31: Build (2035) Ultimately Managed Access Scenario (MMAS) Peak Hour Level of Service (LOS) Ashland Road Page 42 October 2015
47 Figure 32: Build (2035) Ultimately Managed Access Scenario (MMAS) Peak Hour Level of Service (LOS) Broad Street Page 43 October 2015
48 7.0 Comparison of Access Management Scenarios Access management is a set of proven techniques that can help reduce traffic congestion, preserve the flow of traffic, improve traffic safety, minimize crash frequencies, preserve existing roadway capacity and preserve investment in roads by managing the location, design and type of access to property. To promote safe and efficient travel on the roadway, only the minimum number of connections to the study corridors are necessary to provide reasonable access. The following discussion summarizes the operational and safety differences between the minimally managed (MMAS) and ultimately managed (UMAS) access scenarios. 7.1 Operational Comparison A large number of access points and traffic signals per mile can have a negative impact on operations of a corridor. Through traffic is slowed due to vehicles entering and exiting access points, traffic speeds are reduced, decreasing the capacity of the roadway. Table 21 lists suggested access density adjustment factors for level-of-service determinations as provided by the Highway Capacity Manual 2010 and Table 22 shows the estimated impacts of signal density on travel time along a corridor. As an example, under the MMAS the number access points on Ashland Road per mile is 28 with a posted speed of 45 mph. Based on the impacts shown in Tables 21, this corridor would be expected to have an average travel speed of approximately 38 mph. By implementing more conservative access management techniques assumed in the UMAS, such as consolidating access points and moving traffic along parallel roadways, the number of access points are reduced to a density of 15 per mile and could achieve a travel speed closer to the 45 mph speed limit. There was no change in signal density between the MMAS and UMAS for each corridor; however, the relationship between the number of signals per mile and the percent increase in travel time shown in Table 22 should be considered when implementing future signals. Once additional traffic signals are implemented, coordinated signal timing will be required to progress traffic along study corridors which is easier to accomplish with less access points. Table 21: Effect of Access Point Density on Travel Speed 2 Access Points per Mile Table 23 summarizes the signalized intersection level of service and delay (seconds/vehicle) assuming minimal and ultimately managed access scenarios. The intersection level of service under the MMAS is better when compared to the UMAS because vehicle delay is distributed across a total of 73 access points. The future traffic volumes are the same for each scenario, just rerouted and aggregated at half the number of access points, 39, under the UMAS. Because the same amount of traffic is aggregated at less access points there is increased delay per vehicle at some locations. However, the intersection level of service degrades no more than one letter grade between access scenarios within a given peak hour, some locations improve in level of service. Access management is an approach to balance the needs of motorists using a roadway with the needs of adjacent property owners who depend on access to the roadway. The following section discusses 2 Transportation Research Board, Access Management Manual, 2nd Edition. National Academy of Sciences, Washington DC, 2014 Reduction in Free-Flow Speed (mph) Table 22: Effect of Signal Density on Travel Time 2 Signals per Mile Percent Increase in Travel Time ^Compared with 2 signals per mile the impacts to safety, in an effort to encourage a balance between providing access to land development while preserving capacity and safety of the study corridors. Table 23: Operational Comparison of Access Management Scenarios Signalized Intersection Level of Service Study Intersection Level of Service (Delay, seconds/vehicle) Future 2035 MMAS Future 2035 UMAS AM PM AM PM Ashland Road and WB I-64 Ramps D (38.9) F (88.3) D (43.9) F (83.7) Ashland Road and EB I-64 Ramps B (13.2) F (80.2) C (26.1) C (33.9) Ashland Road and Three Chopt Road A (3.4) A (4.8) A (5.2) A (4.1) Ashland Road and Plaza Drive B (12.1) D (35.6) C (25.2) D (50.2) Broad Street and Hockett Road/St. Matthews Lane C (25.8) D (40.7) C (30.9) D (52.4) Broad Street and Ashland Road D (46.0) F (82.3) C (29.4) F (96.3) Broad Street and Whippoorwill Road B (16.1) C (27.2) B (10.2) D (46.7) Broad Street and Future Driveway C (22.7) D (49.4) Broad Street and Route 288 SB Ramps C (32.7) F (106.9) D (50.1) F (127.3) Broad Street and Route 288 NB Ramps E (76.7) F (>500) D (40.9) F (180.7) Broad Street and Wilkes Ridge Parkway C (34.6) F (86.4) C (25.3) F (165.0) 7.2 Safety Comparison Research has documented the varied safety benefits associated with access management. These safety benefits are attributable to improved access design, fewer traffic conflict locations, and higher driver response time to potential conflicts. The following provides a brief overview of the impacts of arterial access management on safety and a comparison of the safety differences between the MMAS and the UMAS. Reducing the number of conflict points reduces the number of crashes. The following exhibit, based on historical crash analysis and review of related literature, correlates crash rates with access density. This research suggests that reducing the crash density on Broad Street from 20 driveways per mile under the MMAS to 11 per mile under the UMAS would result in a 30% decrease in the crash rate. A similar relationship would be expected for Ashland Road which decreases the access density from 28 driveways per mile under the MMAS to 15 access point per mile under the UMAS. Composite Crash Rate Indexes 2 Crash modification factors (CMF) represent the quantitative results from research studies, indicating the percent reduction in crashes that can be expected after implementation of a treatment. Per the Highway Safety Manual, the Page 44 October 2015


49 CMF for reducing the number of access points is 0.70 or a reduction of 30% in the total number of crashes. As an example of the potential impact, if access management strategies were applied to the existing corridors the projected number of crashes in the three-year crash period analyzed as part of this study would reduce from 70 to 49 between both corridors. Source: Highway Safety Manual Corridor Before After Broad Street Ashland Road Total = Year Crash Period: 1/1/2010 to 12/31/2012 Reducing number of conflict points reduces the number and severity of crashes. The figures below illustrate the number of vehicle-to-vehicle conflicts associated with the various types of access, ranging from a full unsignalized median opening to the most restrictive right-in/right-out driveway. Crossing conflict points indicated in red are more severe with the yellow merge/diverge conflict points resulting in less severe conflict points. There are no proposed full unsignalized crossovers, the access with the most severe conflict points, on Broad Street under the UMAS and only one proposed on Ashland Road. Total Number of Conflict Points MMAS UMAS % Reduction % Reduction in the number of left-turn movements. As illustrated in the figure below, research suggests that approximately 72 percent of crashes at a driveway involve a left-turning vehicle 3. This suggests that reducing or eliminating left turns to or from driveways, combined with efforts to reduce conflict points (described above), enhances safety. The UMAS reduces the number of left-turn movement from 57 under the MMAS to 49 left-turn movements under the UMAS. The result is a reduction in the number of left-turn movements by 14%. When left-turn movements are restricted at driveways tradeoffs are required to shift the turning movement to another location. This was considered in development of the UMAS and accounts for the shift in left-turns at signalized intersections with additional capacity and turn lanes. It should be noted that shifting left-turn movements to a signal is expected to reduce the number of angle crashes and potentially increase the number of rear-end crashes. However, rear- end crashes are typically less severe in nature than angle collisions. 8.0 Arterial Management Strategies Crash Percentages for Left-Turning Motorists to and from a Driveway 3 A comprehensive arterial management program supports the efficient and safe use of the corridors for all transportation modes. The purpose of the toolbox is to provide an overview of a wide range of strategies, many of which could be applied to the Broad Street and Ashland Road corridors. Using the results of the literature review and the existing and future conditions the following series of matrices (Tables 24 through 30) summarizes potential arterial management strategies. The following section documents specific recommendations using various strategies shown here. The UMAS reduces the number of full movement unsignalized crossovers from five to one. Additionally, the number of right-in/right-out driveways is dramatically reduced from 55 to 24. Based on the number of conflict points shown above, the MMAS would reduce the number of conflict points by 30%. A reduction in the number of conflict points results in less potential for crashes along the study corridors. 3 Technical Summary, Access Management in the Vicinity of Intersections, Federal Highway Administration, FHWA-SA , 2010 Page 45 October 2015
50 Table 24: Multi-Modal Improvements Type of Recommendation Examples Benefits Considerations Transit Bicycle and Pedestrian (Context Sensitive Solutions) Carpool/Vanpool Program Incentives Bus Trolley Light Rail Transit (LRT) Bus Rapid Transit (BRT) Commuter Rail Ferry Paratransit Striped/Exclusive Bike Lane Shared Bike and Travel Lane Multi-Use Paths Sidewalk Unpaved Trail Wide Shoulders Exclusive Carpool/Vanpool travel lanes (HOV/HOT Lanes) Tax Breaks Free Parking Reserved Parking Reduced Price Parking Rewards Programs Table 25: Geometric/Capacity/Operational Improvements Increases capacity Provides alternative modes of travel Additional travel options Reduces congestion Provides safer accommodations for pedestrians and bicyclists Separation from vehicular traffic Cost sharing Less wear and tear on vehicles Time savings when dedicated lanes are used Construction, Operation, and Maintenance costs Ridership Potential Ridership Cost Revenue Potential Location of transit stops, shelters, and routes Shelter Conditions Connectivity of route and transit modes Lighting of Pathways Facility Design Standards Maintenance of Facility Connectivity of bicycle and pedestrian facilities Construction, Operation, and Maintenance costs Setup and coordination of incentive programs Type of Recommendation Examples Benefits Considerations Traffic Signalization Traffic Signal Timing and Phasing Additional Lanes (Through or Turn Lanes) Modify/Add Interchanges Installation of a traffic signal Increases intersection capacity Improves safety Improves efficiency Revised signal timing plans Interconnected signals Coordination of signals Install exclusive turn lanes Add through lanes Remove signals at ramps Create free flowing ramps/loops Interchange concepts Flashing Yellow Arrow Modify clearance intervals Modify phasing (i.e. protected) Improves efficiency Decreases delay Removes yellow trap Decreases delay Reduces angle collisions Controls pedestrian activity Roadway speeds Construction, Operation, and Maintenance costs Increase in rear-end collisions Closely spaced signals Increases capacity Right-of-Way impacts Signal impacts Increases capacity Construction and Maintenance costs Diverging Diamond Interchange (DDI) Construct New Highways/Arterials Increases capacity Construction and Maintenance costs Frontage Roads Increases capacity Construction and Maintenance costs New Roadway Connections Internal Development Roads Additional routes New way finding signage Adjust storage and/or taper lengths Increases capacity Right-of-Way impacts Turn Lane Increases queuing area Signal impacts Requirements/Modifications Adjacent intersection impacts Alternative Intersection Design Roundabout Continuous Flow Intersection (CFI) Displaced Left-Turn Intersection Median U-Turn Intersection Restricted Crossing U-Turn Intersection Grade Separation Offset T-Intersection Improves safety Reduces travel time Reduces construction costs Reduces impacts on the environment Construction, Operation, and Maintenance costs Education of public regarding operations Right-of-Way Acquisition Page 46 October 2015
51 Table 26: Access Management Type of Recommendation Examples Benefits Considerations Medians Spacing Offset Left-Turn Lanes Consolidation of Access Points Frontage Roads Alternative Median Opening Configurations Driveway Location and Design Joint and Cross Access (Access Easements) Non-Traversable U-Turn Treatment Median without turn lanes Median with turn lanes Traffic Signal Spacing Commercial Driveway Spacing Corner Clearance Regular Frontage Roads Reverse Frontage Roads Full median crossover Directional crossover Right-In/Right-Out Helps delineate travel lanes, separating leftturns from through traffic Improves pedestrian safety Improves vehicle safety Increases efficiency Improves aesthetics Controls the number of access points along a corridor Wider spacing allows for drivers to better respond to changing conditions Improves sight distance for opposing left-turning vehicles Reduces the potential for dangerous right angle crashes Reduces conflict points Enhances safety Lessens severity of crashes Improves mobility Increases connectivity Develops aesthetics Improves the functionality of a major roadway Roadway operates more efficiently, channeling the turns into more predictable locations. Minimizes the number of trips on the major arterial Type of median Understanding median opening placement Sight distance Median width U-turn considerations Maintenance of medians The greater the frequency of access points, the greater the number of accidents. Drivers initially may be confused by the change in traffic patterns Install advance guide signing and pavement markings Increases the overall width of the intersection, may cause potential problems for pedestrians crossing Provide a refuge island in the median for pedestrians Scale and intensity of developments Potential for increased delay at consolidated intersections Impact to property owners (especially commercial developments) Proper use of frontage roads can help eliminate conflict points on major route Inadequately designed frontage roads can create additional conflict points and driver confusion regarding yielding the right-of-way Directional median openings are appropriate for limiting cross traffic and exiting turns Scale and intensity of developments The more movements allowed, the more conflict points Provides geometry and a safe environment that accommodates the characteristics of various users Provides areas of smooth transitional flow Corner Clearance - reduction of interferences from side-street activity Improves the operation and safety of the main highways Reduces the number of trips on primary roadway; thereby, preserving capacity Reduces number of driveways on major streets Encourages pedestrian trips Encourages shorter trips in autos Provides good access to all properties through the use of easements As property develops, local government can require owners provide for space for future public roads/accesses Helps local governments achieve level of service goals Connection radius and flare Corner Clearance - Retrofitting corner clearances is both difficult and expensive Vehicle ground clearance Clearance from fixed objects Driveway width Driveway grade Driveway channelization Driveway length/circulation Auxiliary right-turn lanes Communication and consensus from multiple developers Throat Transition Sight distance/intersection angle Driveway location/shared driveways Advanced warning Driveways and the pedestrian environment, ADA considerations Avoid driveways skewed from median openings, creates potential for weaving issues Functional/Influence area of adjacent intersections Transit stop locations Page 47 October 2015
52 Table 27: Safety Improvements Type of Recommendation Examples Benefits Considerations Signing Pavement Markings Geometry Chevrons Curve Warning Lane Utilization Arrow Rumble Strips Edge Markings Recessed Pavement Markers Add turn lanes Flatten curves Minimize intersection conflict points Improve shoulder Install median Regulatory signs Speed feedback signage Intersection Ahead Advanced warning Clear way finding Clear delineation at intersections Reduces roadway departures Night-time delineation Reduces crash frequency Improves vehicle throughput Over signing Non-conventional applications Minimal benefits Costs may vary Reduces crash severity Can reduce vehicle throughput Speed Limit Often difficult to change Sight Distance Reduce sight obstructions objects, vegetation, etc. Minor costs May not control right-of-way Street Lighting Guardrail/Median Barrier Clear Zone Traffic Calming Pavement Surface Regulatory Signal Operations High mast lighting Street lighting Cable Concrete 5-foot buffer space 10-foot buffer space Vertical Deflections Speed Hump/Table Raised Intersection Textured Pavement Horizontal Shifts Traffic Circle Roadway Narrowing Central Island Narrowing Condition Asphalt Permeable Pavement Textured Pavement Americans with Disabilities Act (ADA) Highway Safety Improvement Program (HSIP) Transportation Safety Improvement Program (TSIP) Roadway Safety Audit (RSA) Revised signal timing plans Flashing Yellow Arrow Modify clearance intervals Modify phasing (i.e. protected) Significantly increase night-time visibility Costs may vary Maintain consistent lighting levels Metal Beam Costs may vary Creates a barrier between travel lanes and potential hazards Better sight distance and visibility No significant relationship between the fixed object density and the Reduces potential for crashes frequency of fixed object crashes More effective when clear zone remains consistent Reduces speed Volume control Costs may vary Maintenance Spacing Better driving conditions Maintenance Costs may vary Provides funding for safety improvements Provides strict requirements Reduces crashes Enforcement of standards Improves efficiency Decreases delay Removes yellow trap Maintenance Costs may vary Page 48 October 2015
53 Table 28: Policy Recommendations Type of Recommendation Examples Benefits Considerations Planned Review and Update Standards/Regulations Zoning and Subdivision Regulations Annual update Five year update Residential Commercial Office Relevant and up-to-date standards Type and frequency of standard revisions Identify committees/groups or individuals to determine/implement revisions Protects property values Limit development potential of existing land uses that don t conform with new standards Implements community goals Discourage development in some areas Preserves historic and/or environmentally sensitive areas Long-term commitment and collaboration between municipality and proper owners Standardize setbacks requirements Zoning District; Overlay District Consistency and uniformity Pedestrian versus Auto-Oriented Developments Standard TIA Requirements Any development generating over 100 peak hour trips is required to complete a TIA Consistency and uniformity Equity in mitigation measures Leads decision makers Consensus of TIA standards/thresholds Transportation Entity Coordination Monthly meetings with stakeholders from various entities Communication Goals and objective of each entity Transportation Technical Advisory Committee Consensus on important transportation topics Turnover of personnel Street Hierarchy Specific design standards by street classification Improves capacity Comprehend the characteristics of the surrounding area Rural vs. Urban Roads Improves functionality Conservative spacing guidelines Safer development access Preserves infrastructure Construction and maintenance costs Access Management Guidelines Improves safety Promotes economic Corridor characteristics Improves operations growth along a corridor Manages conflict areas Cost savings Residential Street Standards Table 29: Travel Demand Management Narrower street design Improves safety Minimizes high volumes of traffic Discourages high speeds Functionality of the street Volume of traffic Type of Recommendation Examples Benefits Considerations Parking Management Ramp Metering ITS Technology Alternative Work Schedules Telecommute Parking garage Shared parking Unbundled parking Price parking Regulate/enforce parking On-Ramp Metering Off-Ramp Metering Dynamic Message Signs Closed-Circuit Television Advanced Traffic Management System Traffic Management Centers Flextime Compressed Workweek Remote parking/shuttle service Parking regulations Time limits Restrictions Traffic Incident Management Electronic Toll Collection Red Light Camera Facility cost savings Improves quality of service Revenue generation Reduces parking demand Manages freeway traffic Decreases travel time Increases travel speed Increases capacity Decreases emissions Reduces crashes Reduces delay Fuel savings Increases safety Staggered shifts Reduce delay Increase capacity Working from home Reduce delay Increase capacity Improves travel time Decreases emissions Centralized operations and control Decrease emissions Fuel economy Construction, Operation, and Maintenance costs Enforcement of regulations Connectivity with other modes of transportation Determination of parking supply and demand Construction, Operation, and Maintenance costs Increased ramp delay and spill back Enforcement Public acceptance and compliance Construction, Operation, and Maintenance costs Location of technology Communications and integration Standards of practice Interoperability with existing technologies Dependent on businesses Large scale shift to make an impact Equipment/technology requirements for telecommuting Dependent on businesses Increase ramp emissions and fuel consumption Potential to discourage other modes of transportation Ramp improvements Potential impacts to the local street network Page 49 October 2015
54 Table 30: Other Improvements Type of Recommendation Examples Benefits Considerations Corridor Studies and Plans Thoroughfare Plans Access Management Plans Bicycle and Pedestrian Plans Comprehensive Plans Public Involvement and Education Design Standards Land Use Conflict Index Outreach Strategies Arterial Management Plan Sets goals and objectives for the corridor Identifies problem areas Identifies land use changes Identifies future traffic operations Protection of transportation investments Identifies potential funding sources Master Plan of entire City/County/Town Outlines the goals and strategies Determines functionality of existing and future roadways Provides decision makers knowledge of future improvements Permits developers to design subdivisions in a nonconflicting manner Minimizes damage to property values Promotes community appearance Anticipates when funding strategies need to be programmed for improvements Statewide Citywide Roadway Design Transit Design Bicycle and Pedestrian Facility Design Public meetings Project Committees Cost of improvements Phased implementation of improvements May require collaboration between public and private agencies Adoption/Approval by public agencies Requires collaboration between public and private agencies May need to have schedule revision/update periods Adoption/Approval by public agencies Preserves the functionality of roadway systems Balance state and local desires for corridor (land use versus transportation) Connectivity of different modes of transportation Based on roadway classification/functionality Transit locations Neighboring Land Uses Identifies current conditions Identifies the strengths, weaknesses, and opportunities of existing and future conditions Encompasses several key community components: Environment, Transportation, Agriculture, etc. Provides a framework for officials and the community Helps guide growth within the community Establishes priorities and implementation strategies Informs the public Gains consensus on standards and/or improvements Consistency and uniformity of design Promotes safe and efficient design elements Identifies complimentary land uses to support economic development Diversifies land use types Informs stakeholders Gains consensus on standards and/or improvements Requires collaboration between public and private agencies May need to have schedule revision/update periods Adoption/Approval by public agencies Difficult to reach out to everyone Design exceptions Various elements of design Value versus Development Preferences Targets audience Page 50 October 2015


55 9.0 Recommendations Plan Sheets 1 through 14 and accompanying text illustrate and discuss the recommended access modifications and guidelines for the length of the study corridors. For reference, Plan Sheets 1-9 start at the west end of the Broad Street corridor at Hockett Road/St. Matthews Lane and progresses east to Wilkes Ridge Parkway. Plan Sheets start at the south end of the Ashland Road corridor at Broad Street and progresses north to Forest Road. These recommended improvements and guidelines will be implemented over time, as development and redevelopment occurs along the study corridors and will gradually lead to greater safety and traffic flow while preserving capacity. The character of the primary alternatives and supporting recommendations are a reflection of the feedback received during the Steering Committee meetings and public involvement as well as the results from on the completed analyses. The alternatives and recommendations are divided into various subcategories listed below: Major Roadway Improvements Connectivity Recommendations Access Management Recommendations Interchange Recommendations Other Alternatives» Bike and Pedestrian» Intersection Recommendations» Travel Demand Management Based on the following projected 2035 build-out traffic volumes Ashland Road is estimated to have approximately 42,000 vehicles per day (vpd). Existing ADT = 11,000 vpd Background growth to 2035 = 12,000 vpd (Section 5.1.2) Future 2035 site trips per day = 30,000 vpd (Section 5.2.1) Total Future 2035 ADT ~ 42,000 vpd Typically an ADT greater than 30,000 vpd warrants the need for a four-lane divided roadway. The projected background traffic volume of 42,000 vpd approaches the need for a sixlane divided roadway. However, due to the conservative nature of the trip generation potential, it is recommended to widen to a four-lane divided facility with the possibility for Photograph 11: Existing Ashland Road Two-Lane Cross Section additional widening in the future, if necessary. Based on traffic projections it is estimated that the four-lane divided roadway may be needed within the next 5 to 10 years. The County should consider the trip generation potential when reevaluating future land use along Ashland Road to determine the need for additional widening. Figure 33: Typical Four-Lane Cross Section Ashland Road In addition to the listed alternatives and recommendations, planning-level cost estimates, expressed in year 2015 dollars, are included for all recommendations. These planning-level cost estimates are based on the VDOT Transportation and Mobility Planning Division s Statewide Planning Level Cost Estimates worksheet developed in 2009 and familiarity with similar improvements throughout Virginia. Due to the fluctuations in the costs of labor, materials, and equipment, fluctuations in the market, and the outcome of competitive bidding as well as the general planning-level nature of the recommendations, these estimated costs are neither exact nor guaranteed. 9.1 Major Roadway Recommendations Ashland Road Widening One of the major roadway recommendations is to widen the existing Ashland Road from a two-lane undivided typical section to a four-lane divided typical section (as shown in Figure 33) with turn-lanes provided at appropriate intersections and driveways. Multi-use paths running parallel on the east and west sides of Ashland Road are also displayed in Figure 33; however, please refer to Section for additional details of bicycle pedestrian accommodations. Existing Ashland Road conditions include an ADT of approximately 11,000 vehicles per day and a right-of-way fluctuating between 90 and 150 feet. The proposed right-of-way is approximately 120 feet which has the potential to fit within the existing limits in various locations along the corridor. This recommendation is in compliance with Goochland County s current Major Thoroughfare Plan. Page 51 October 2015
56 Plan Sheet 1: AMP Recommendations Broad Street at Hockett Road Page 52 October 2015
57 Plan Sheet 2: AMP Recommendations Broad Street at Ashland Road Page 53 October 2015

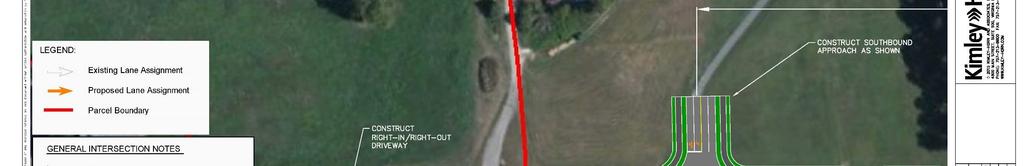
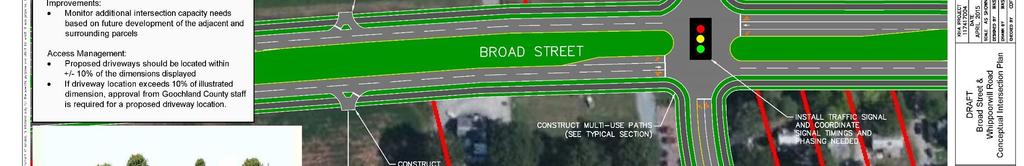
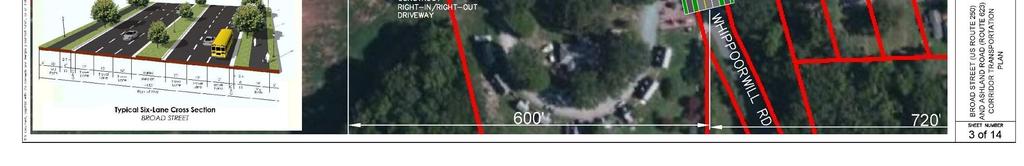
58 Plan Sheet 3: AMP Recommendations Broad Street at Whipporwill Road Page 54 October 2015
59 Plan Sheet 4: AMP Recommendations Broad Street at Crossover #1 Page 55 October 2015


60 Plan Sheet 5: AMP Recommendations Broad Street at Crossover #2 Page 56 October 2015


61 Plan Sheet 6: AMP Recommendations Broad Street at Mills Road Page 57 October 2015

62 Plan Sheet 7: AMP Recommendations Broad Street at SB Route 288 Ramps Page 58 October 2015
63 Plan Sheet 8: AMP Recommendations Broad Street at NB Route 288 Ramps Page 59 October 2015
64 Plan Sheet 9: AMP Recommendations Broad Street at Wilkes Ridge Parkway Page 60 October 2015


65 Plan Sheet 10: AMP Recommendations Ashland Road at WB I-64 Ramps Page 61 October 2015


66 Plan Sheet 11: AMP Recommendations Ashland Road at EB I-64 Ramps Page 62 October 2015


67 Plan Sheet 12: AMP Recommendations Ashland Road at Plaza Road Page 63 October 2015

68 Plan Sheet 13: AMP Recommendations Ashland Road at Crossover #3 Page 64 October 2015


69 Plan Sheet 14: AMP Recommendations Ashland Road Potential Roundabout Locations Page 65 October 2015


 to be designed and constructed on an as needed basis.")

70 9.1.2 Three Chopt Road Widening In addition to widening Ashland Road, widening Three Chopt Road from a two-lane undivided to a four-lane divided typical section displayed in Figure 34 is recommended. The four-lane divided typical section would begin at Ashland Road, follow the existing roadway cross section, extend across Route 288, and tie into Little Tuckahoe Court as shown in Figure 35. Figure 35: Proposed Master Thoroughfare Map The current right-of-way is approximately 40 feet, as shown in Photograph 12, with a proposed right-ofway of 95 feet. Figure 34 represents the ultimate cross section if all of the anticipated development occurs. Based on the future development build-out and the associated trip generation, there is flexibility in the components of the cross section (location of widening, median width, type of pedestrian facility, location of pedestrian facilities, etc.) to be designed and constructed on an as needed basis. As development occurs along Three Chopt Road, a feasibility study should be conducted in order to determine the scope of improvements. This extension is currently represented in Goochland County s Major Thoroughfare Plan as a long term improvement. Photograph 12: Existing Ashland Road Two-Lane Cross Section Figure 34: Typical Four-Lane Cross Section Three Chopt Road Table 31 summarizes the planning level cost estimates for the proposed widening of Ashland Road and Three Chopt Road. It should be noted that Broad Street is not recommended for widening within the study area corridor. Table 31: Planning Level Cost Estimates Roadway Widening Improvement Low Estimate 2015 Dollars ($1,000,000s) High Estimate CN RW PE Total CN RW PE Total 1 Widen Ashland Road from 2 lanes to 4 lanes $4.30 $2.15 $0.61 $7.1 $6.45 $4.20 $0.91 $ Widen Three Chopt Road from 2 lanes to 4 lanes (without Extension) $5.46 $2.74 $0.77 $9.0 $8.19 $5.33 $1.15 $ Widen Three Chopt Road from 2 lanes to 4 lanes (with Extension) $7.53 $3.77 $1.06 $12.4 $11.30 $7.34 $1.59 $20.3 Notes: - Total Costs rounded to the nearest $100,000 - PE = Preliminary Engineering, RW = Right of Way and Utility Relocation, CN = Construction $17.29 $8.66 $2.44 $28.5 $25.94 $16.87 $3.65 $46.6 Page 66 October 2015
71 9.2 Connectivity Recommendations Transportation connectivity is a vital component of providing access and improving mobility to key locations throughout a corridor. Connectivity can be applied internally (within a particular development area) or externally (along study area corridors and interstate). For this study, external connectivity throughout the study area was considered based on potential future land uses, natural and physical barriers (rivers, streams, highways, etc.), and the surrounding area characteristics. Additionally, the current version of the County s Major Thoroughfare Plan was consulted for future roadway connections along Broad Street and Ashland Road. Figure 35 displays the approximate locations of major roadway connections recommended for connections to/from Broad Sheet and Ashland Load. The exact locations and cross sections of the connections are to be determined as part of future traffic analysis studies once development occurs. As illustrated in Figure 35, the major connectivity recommendations include extensions of Three Chopt Road across Route 288, Hockett Road realignment to Ashland Road, and Rockville Road east across Ashland Road to Three Chopt Road. Extension of Three Chopt Road from Ashland Road across Route 288 would provide an additional connection parallel to Broad Street as well as provide access to large parcels of land located between I-64, Route 288, and Broad Street. The Hockett Road extension to Ashland Road at the intersection of Broad Street will create a regional north-south connection to/from I-64 to the north and Tuckahoe Creek Parkway to the south. This connection will better accommodate the major turning movements from Ashland Road to Hockett Road by reconfiguring them to through movements. With the extension, additional lane assignments (turn and through lanes) will need to be added to the Broad Street and Ashland Road intersection. However, the extension of Hockett Road could negatively impact the current development along the existing Hockett Road alignment. Lastly, Rockville Road is recommended to extend to the northwest to I-64 to provide an additional connection west of Ashland Road. Due to the proposed external roadway connections, a revision to the County s Major Thoroughfare Plan is recommended to include five additional proposed connections which will utilize existing and proposed full movement access points along Broad Street and Ashland Road as well as the removal of one connection from Three Chopt Road to the existing Wawa driveway. A cost estimate, shown in Table 32, was developed to quantify the level of invest that will be required to implement the various connections proposed in the Major Thoroughfare Plan. Detailed cost estimates are provided in Appendix F for reference. Table 32: Planning Level Cost Estimates Roadway Connections Improvement Low Estimate 2015 Dollars ($1,000,000s) High Estimate CN RW PE Total CN RW PE Total 1 Connectivity Improvements from MTP Two-Lane Roads $30.1 $15.1 $4.22 $49.4 $45.2 $29.4 $6.33 $ Connectivity Improvements from MTP Four-Lane Roads $34.7 $17.4 $4.87 $57.0 $51.9 $33.8 $7.28 $93.0 Notes: - Total Costs rounded to the nearest $100,000 - PE = Preliminary Engineering, RW = Right of Way and Utility Relocation, CN = Construction $64.8 $32.5 $9.09 $106.4 $97.1 $63.2 $13.61 $ Access Management Recommendations The type of access and location of proposed access points are shown in Plan Sheets Each type of access (signalized and unsignalized) has been identified along the length of the corridor. Refer to Section for a detailed discussion on the proposed signalized locations. Table 33 illustrates the progression to the recommended optimize access spacing along the corridor beyond the minimum spacing resulting on overall reduction of 47% less access points on Broad Street and 46% on Ashland Road. Table 33: Broad Street Summary of Access Points Broad Street Allowed Access Based On VDOT Minimum Spacing Guidance Number of Access Points Proposed Access Based on Optimal Spacing Ashland Road Allowed Access Based On VDOT Minimum Spacing Guidance Proposed Access Based on Optimal Spacing Existing Existing Type of Access Access Access Signalized Unsignalized - Full Movement Unsignalized - Directional Crossover Unsignalized - Right-In/Right-Out General Access Management Recommendations The following general access recommendations are provided: Implement corridor access as shown in the plan. Proposed access should be located within ±10% of the dimensions displayed on Plan Sheets If a proposed development is unable to meet the access management spacing recommended in the plan access can be modified on a case-by-case basis. Should a proposed access location exceed 10% of the illustrated spacing in the plan, approval from Goochland County staff is required. The planning commission has the authority to approve revised spacing during site plan review, provided the intent of recommended access is being met to the maximum extent practical on the site, and provided input is obtained from VDOT. Additionally, larger developments are required to complete a traffic impact study for sites that have the potential to generate significant volumes of traffic. These studies would evaluate the impact that a proposed development will have on the road system and identify mitigation to offset the impact. Existing development with substandard or undesirable access conditions (i.e., individual single family access along Broad Street, closely spaced retail access within the influence area of the Route 288 and Broad Street interchange). Goochland County should look for opportunities to retrofit access, such as when properties are developed, redeveloped, or sold when the roadway is improved. Cooperation and partnership between various stakeholders (Goochland County, VDOT, and the Richmond Regional TPO) will be required to implement the various plan recommendations. Section 10.0 provides additional guidance to implementing recommendations provided in the AMP. Page 67 October 2015
72 9.3.2 Broad Street As shown, four major intersections (Whippoorwill Road, Crossover #1, Crossover #2, and Mills Road) are planned/suggested along Broad Street between Ashland Road and Route 288, this section has the most opportunity for changes in access due to the adjacent land being largely undeveloped to the north and south. Whippoorwill Road and Mills Road are proposed future signal locations and Crossovers #1 and #2 are proposed directional crossovers (allowing only left-turns from Broad Street and restricting left-turns from the side street). The remaining three access points in this section are right-in/right-out. There are no full movement unsignalized intersections on Broad Street due to the large projected traffic volumes. There are two existing closely-spaced crossovers, 340 feet apart, on Broad Street at the intersection of Whipoorwill Road and the adjacent crossover to the west. Whipoorwill Road is a recommended future signal location and would be negatively impacted by a full crossover location being located too close; therefore, the crossover to the west should be removed. Northbound left-turn vehicles from the existing development south of Broad Street will be required to make a u-turn at Whipoorwill Road Ashland Road As shown, three major intersections (Three Chopt Road, Rockville Road, Plaza Road, and Crossover #3) exist/planned along Ashland Road between Broad Street and I-64, this section has the most opportunity for changes in access due to the adjacent land being largely undeveloped to the east and west. Three Chopt Road and Plaza Road are proposed future signal locations and Rockville Road and Crossover #3 are proposed directional crossovers. The remaining eight access points in this section are right-in/right-out. There are no full movement unsignalized intersections on Ashland Road in this section due to the large projected traffic volumes. Minimal access to Ashland Road between Three Chopt Road and I-64 is recommended in order to maximum the spacing from the interchange. Planning level unit costs applicable to implementing the various types of access recommendations are provided in Table 34. These planning level unit costs can be used as tools to aid the development planning process. Traffic signal cost estimates are provided in Section Table 34: Planning Level Cost Estimates Access Management Construction Unit Cost 2015 Dollars ($1,000,000s) Improvement Unit Low High 1 Traffic Signal Each $0.14 $ Directional Median Each $0.24 $ Roadway Widening 2 lane (26' - 30' pavement) Mile $ 4.30 $ Roadway Widening 4 lane divided (48' pavement w/28' raised median) Mile $11.58 $ Add 1 lane (12 of pavement) Mile $0.47 $ Construct Left-Turn Lane (200' storage/200' taper) Each $0.25 $ Construct Right-Turn Lane (100' storage/100' taper) Each $0.21 $ Provide 10 Multi-Use Path Mile $0.86 $ Provide 5 Sidewalk Mile $0.29 $ Bike Lane (4 of pavement on both sides of roadway) Mile $0.53 $0.79 Notes: - To estimate Preliminary Engineering (PE) assume 14% (Low) and 14% (High) of Construction Cost - To estimate Right-of-Way (RW) assume 50% (Low) and 65% (High) of Construction Cost 9.4 Interchange Recommendations Short-Term The following interchange improvements were determined based on the operational analysis of the projected build-out traffic conditions. These improvements generally require detailed preliminary design and may require right-of-way acquisition depending on the location of the project. For the purpose of this study, short-term recommendations are deemed those most critical to improving operations and safety within the study area and should be implemented first, refer to Section 10.3 for the recommended prioritization of improvements. Short-term improvements are assumed to be those that can typically be completed in less than five years and may be programmed in the SYIP. Short-term improvements can include projects such as the installation of traffic signals, construction of turn lanes, and interchange modifications. Refer to Section 6.2 to review how these improvements are projected to operate under future build-out (2035) traffic conditions Route 288 at Broad Street Interchange The following shorter-term capacity and traffic signal improvements are recommended at the Route 288 at Broad Street Interchange. These improvements maximize capacity at the ramp intersections to the extent possible short of major interchange modifications. Intersection of the northbound Route 288 On- and Off-Ramps with Broad Street (Plan Sheet 8) 1. Install traffic signal 2. Add a second lane on the northbound Route 288 to eastbound Broad Street Off-Ramp. This movement should be controlled by the proposed traffic signal. 3. Construct a second westbound left-turn lane on Broad Street 4. Widen south leg of intersection on ramp a. Widen ramp to include a second receiving lane from westbound Broad Street dual left-turn movement b. Widen northbound approach on ramp to include a 2-lane approach to accommodate an exclusive left-turn and a shared left-through movement. 5. Construct westbound right-turn lane on Broad Street (implement in conjunction with development) Intersection of the southbound Route 288 On- and Off-Ramps with Broad Street (Plan Sheet 7) 1. Install traffic signal 2. Construct a second westbound left-turn lane on Broad Street 3. Widen south leg of intersection on ramp a. Widen ramp to include a second receiving lane from westbound Broad Street dual left-turn movement b. Widen northbound approach on ramp to include a 2-lane approach to accommodate an exclusive left-turn and a shared left-through movement. 4. Construct westbound right-turn lane on Broad Street (implement in conjunction with development) A summary of the planning level cost estimates for the various interchange improvements are provided in Table 35. Shorter-term improvements at the Route 288 at Broad Street interchange range from $2.8 million to $4.3 million. Detailed cost estimates are provided in Appendix F for reference. Page 68 October 2015

73 Table 35: Planning Level Cost Estimates Route 288 at Broad Street Interchange Short-Term Improvements Low Estimate 2015 Dollars ($1,000,000s) High Estimate Improvement CN RW PE Total CN RW PE Total NB Route 288 On- and Off-Ramps at Broad Street $0.69 $0.37 $0.11 $1.40 $1.05 $0.71 $0.19 $ Install traffic signal $0.14 $0.07 $0.02 $0.30 $0.24 $0.16 $0.04 $ Add 2nd lane on NB Route 288 to EB Broad Street Off-Ramp $0.04 $0.03 $0.01 $0.10 $0.07 $0.05 $0.01 $ Construct 2nd westbound left-turn lane on Broad Street $0.25 $0.13 $0.04 $0.50 $0.37 $0.25 $0.06 $ Widen south leg of intersection on ramp $0.05 $0.03 $0.01 $0.10 $0.07 $0.05 $0.02 $ SB to include 2nd receiving lane from WB Broad Street dual left-turn - NB approach on ramp to include a 2-lane approach 5 Construct WB right-turn lane on Broad Street $0.21 $0.11 $0.03 $0.40 $0.30 $0.20 $0.05 $0.60 SB Route 288 On- and Off-Ramps at Broad Street $0.68 $0.35 $0.11 $1.40 $1.03 $0.69 $0.17 $ Install traffic signal $0.14 $0.07 $0.02 $0.30 $0.24 $0.16 $0.04 $ Construct 2nd westbound left-turn lane on Broad Street $0.25 $0.13 $0.04 $0.50 $0.37 $0.25 $0.06 $ Widen south leg of intersection on ramp $0.08 $0.04 $0.02 $0.20 $0.12 $0.08 $0.02 $ SB to include 2nd receiving lane from WB Broad Street dual left-turn - NB approach on ramp to include a 2-lane approach 4 Construct WB right-turn lane on Broad Street $0.21 $0.11 $0.03 $0.40 $0.30 $0.20 $0.05 $0.60 $1.37 $0.72 $0.22 $2.80 $2.08 $1.40 $0.36 $4.30 Notes: - Total Costs rounded to the nearest $100,000 - PE = Preliminary Engineering, RW = Right of Way and Utility Relocation, CN = Construction I-64 at Ashland Road Interchange The following capacity and geometric improvements shown in Figure 36 are currently under construction at the I-64 at Ashland Road interchange (VDOT UPC 70542). The only proposed shorter-term improvement recommended in addition to the on-going improvements is the installation of a traffic signal at the Eastbound I-64 On- and Off-Ramps. Installation of the traffic signal is estimated between $300,000 and $500,000. Preliminary engineering, right-of-way, and construction costs are estimated in Table 36. Table 36: Planning Level Cost Estimates I-64 at Ashland Road Interchange Shorter-Term Improvements Improvement Low Estimate 2015 Dollars ($1,000,000s) High Estimate CN RW PE Total CN RW PE Total 1 Install traffic signal at EB I-64 On- and Off-Ramps $0.14 $0.07 $0.02 $0.30 $0.24 $0.16 $0.04 $0.50 Notes: - Total Costs rounded to the nearest $100,000 - PE = Preliminary Engineering, RW = Right of Way and Utility Relocation, CN = Construction $0.14 $0.07 $0.02 $0.30 $0.24 $0.16 $0.04 $0.50 Figure 36: I-64 at Ashland Road Planned Improvements 9.5 Interchange Recommendations Long-Term It was determined based on the operational analysis of build-out traffic conditions that additional interchange improvements, beyond the shorter-term improvements described in the previous section, will be necessary to accommodate the level of development assumed within the study area. Refer to Section 6.2 review how these improvements are projected to operate under build-out traffic conditions. These improvements are the most expensive concepts, requiring extensive design, right-of-way acquisition, utility relocation, and construction. Longer-term concepts often require further study and typically fall outside of the SYIP timeframe. Possible long-term improvements include bridge improvements and major modifications to an existing interchange such as. For the purpose of this study, longer-term improvements were assumed to be those that take at longer than 15 years to complete years Route 288 at Broad Street Interchange A long-range planning study should be conducted at the Route 288 at Broad Street interchange to identify what improvements or configuration would be required to accommodate build-out traffic conditions. An interchange study must be completed prior to a change in access and is required to go through a transportation planning process that involves stakeholders to ensure the resulting project(s) are in the appropriate transportation plan, and the project is in an approved transportation improvement program. Work from this transportation planning process can then be rolled into the other Page 69 October 2015
 would be required for the preferred improvement and approved by VDOT/Federal Highway Administration.")
74 phases of developing the interchange improvements into implementable projects. A detailed Interchange Modification Report (IMR) would be required for the preferred improvement and approved by VDOT/Federal Highway Administration. The concept shown Figure 37 was developed at a high level and discussed with the study work group to inform stakeholders on the type and scale of improvements that will be necessary to mitigate long-term traffic volumes through the interchange. This concept consists of constructing two directional on-ramps from Westbound Broad Street to Northbound and Southbound Route 288. Two of the major constraints to implementing large scale interchange improvements at this location is the proximity to the I-64/Route 288 interchange (less than half a mile) and the existing and planned development located within then the influence area of the interchange. This concept was considered a good candidate to be vetted in a subsequent planning study because it does not prohibit development within the interchange, provides capacity to two critical turning movements, and would be less fiscally impactful than more large scale improvements such as a complete interchange reconfiguration. Figure 37: Proposed Broad Street Directional Ramps Table 37: Planning Level Cost Estimates Route 288 Interchange at Broad Street Longer-Term Improvements Improvement Low Estimate 2015 Dollars ($1,000,000s) High Estimate CN RW PE Total CN RW PE Total 1 WB Broad Street to NB Route 288 Directional On-Ramp (1-Lane) $9.70 $4.86 $1.36 $16.0 $14.44 $9.40 $2.03 $ WB Broad Street to SB Route 288 Directional On-Ramp (1-Lane) $9.12 $4.60 $1.30 $15.1 $13.66 $8.89 $1.93 $24.6 $18.82 $9.46 $2.66 $31.1 $28.10 $18.29 $3.96 $ Improve grade-separated interchange $29.85 $14.93 $4.18 $49.0 $47.76 $31.05 $6.69 $85.5 Notes: - Total Costs rounded to the nearest $100,000 - PE = Preliminary Engineering, RW = Right of Way and Utility Relocation, CN = Construction I-64 at Ashland Road Interchange A long-range planning study should be conducted at the I-64 at Ashland Road interchange to identify what improvements or configuration would be required to accommodate build-out traffic conditions. An interchange study must be completed prior to a change in access and is required to go through a transportation planning process that involves stakeholders to ensure the resulting project(s) are in the appropriate transportation plan, and the project is in an approved transportation improvement program. Work from this transportation planning process can then be rolled into the other phases of developing the interchange improvements into implementable projects. A detailed Interchange Modification Report (IMR) would be required for the preferred improvement and approved by VDOT/Federal Highway Administration. Potential interchange improvements discussed with the study work group included upgrading the existing diamond interchange by adding the following improvements. Refer to Section 6.2 to review how these improvements are projected to operate under build-out traffic conditions. Upgrade existing diamond interchange configuration to provide additional capacity (Plan Sheet 10 and 11) 1. Widen Ashland Road between the I-64 ramps from 2 lanes to 5 lanes to accommodate northbound and southbound dual left-turn movements (this includes bridge widening and roadway widening). 2. Widen the I-64 on-ramps to provide two receiving lanes for the dual left-turns from Ashland Road. Additional candidate interchange concepts discussed for consideration in a subsequent planning study include: Identifying alternate access to Route 288 that would reroute traffic away from the Broad Street Interchange Larger scale interchange configurations that would mitigate other large turning movements to/from the interchange A summary of the planning level cost estimates for the two directional on-ramps is provided in Table 37. General planning level unit costs to upgrade an interchange (between $49 million and $85.5 million) is also provided for additional reference. Detailed cost estimates are provided in Appendix F for reference. Two additional potential interchange configurations that should be considered is a Diverging Diamond Interchange (DDI configuration and a cloverleaf configuration with collector-distributor roads. A cloverleaf configuration is currently reflected in the Goochland County Major Thoroughfare Plan as a placeholder until the long-term preferred concept is determined. This interchange area is largely undeveloped and not constrained by existing development. As shown in Figure 38 both of these concepts mostly fit within the existing right-of-way. The County should work to preserve right-of-way within the general footprint of the interchange as development occurs so not to preclude future potential interchange configurations. A Diverging Diamond Interchange (DDI) configuration A cloverleaf configuration with collector-distributor (CD) roads. This configuration is currently reflected in the Goochland County Major Thoroughfare Plan. Page 70 October 2015

75 Figure 38: I-64 at Ashland Road Interchange Long-Term Potential Interchange Configuration The estimated cost to add capacity to the existing diamond interchange ranges from $10.85 million to $17.50 million as shown in Table 38. The VDOT TMPD Statewide Planning Level Cost Estimates do no provide unit costs specifically for a DDI or cloverleaf configuration. The only applicable costs would be the general planning level unit costs to upgrade an interchange (between $49 million and $85.5 million). However, this description is very general and could include a variety of improvements. Based on a national search of previously constructed DDIs a range of $22 million to $4 million was observed. For a more comparable example located in Virginia, the DDI at I-64 and Route 15 in Zion Crossroads was constructed for $6.9 million dollars. Cloverleaf interchanges have not been constructed in Virginia in recent years and therefore resulted in no comparable Virginia cost. This is primarily, due to the amount of right-of-way they require and the use of loop ramps generates a weaving movement within a short distance which triggers the need for CD roads, driving up the cost for this configuration. Figure 38 illustrates the larger footprint of the cloverleaf configuration when compared to the DDI. For these reasons, it is logical to assume the upper range of the general improve grade-separated interchange cost of $85.5 million when comparing interchange configurations at a high level. Detailed cost estimates are provided in Appendix F for reference. Table 38: Planning Level Cost Estimates I-64 at Ashland Road Longer-Term Improvements Improvement 2015 Dollars ($1,000,000s) Low Estimate High Estimate CN RW PE Total CN RW PE Total 1 Widen Ashland Road between the I-64 ramps from 2 lanes to 5 lanes $6.36 $3.18 $0.90 $10.50 $9.42 $6.13 $1.33 $ Widen the I-64 on-ramps to provide two receiving lanes $0.21 $0.11 $0.03 $0.35 $0.32 $0.21 $0.50 $0.60 $6.57 $3.29 $0.93 $10.85 $9.74 $6.34 $1.83 $ Improve grade-separated interchange $29.85 $14.93 $4.18 $49.0 $47.76 $31.05 $6.69 $ DDI at I-64 and Route 15, Zion Crossroads, Virginia Constructed in 2014 for $6.9 Notes: - Total Costs rounded to the nearest $100,000 - PE = Preliminary Engineering, RW = Right of Way and Utility Relocation, CN = Construction 9.6 Other Alternatives Bike and Pedestrian Pedestrian and bicycle accommodations should be considered (e.g., sidewalks, multi-use paths, etc.) in conjunction with any arterial improvements, as feasible. The typical cross-sections for Ashland Road (Figure 33) and Broad Street (Figure 39) assume multi-use paths along both sides of the roadway. The multi-use paths are 10 feet wide and setback from the roadway with an 8 foot green space. The setback provides separation between the multi-use path user and the major travel way. This is important based on the anticipated corridor traffic volumes and speeds. For these same reasons, bike lanes are not recommended along the study corridors. The Ashland Road and Broad Street typical cross-sections represent an ideal condition which provides for a variety of users. These typical cross-sections may change to meet the bike and pedestrian needs of the area based on the type and density of future development. Bike and pedestrian accommodations should have logical connections and facilities within this study area should be a component of a larger bike and pedestrian plan. An additional option is to provide a four foot paved shoulder adjacent to the outside travel lane to support bicycle traffic. At a minimum, sidewalk should be provided along Broad Street and Ashland Road in areas where none currently exists. Sidewalk and trail improvements should also be considered in conjunction with minor arterial widening projects as shown in the Three Chopt Road typical cross-section (Figure 34). Page 71 October 2015

76 Figure 39: Typical Cross-Section - Broad Street 9.7 Intersection Recommendations Auxiliary Turn Lanes All of the tune lanes shown in Plan Sheets 1-13 were based on the capacity analysis assuming build-out of the study area. The proposed turn lanes on Ashland Road will most likely be implemented in conjunction with future widening of the road and should be accounted for in the design. Additional turn lanes on the segment of Broad Street in between Route 288 and Ashland Road will most likely be warranted and built based on adjacent development. The estimate provided in Table 40 reflects between $6.5 million and $7.0 million in standalone turn lane improvements (eight left-turn lanes and nine rightturn lanes), outside of the projected Ashland Road widening. The estimated cost to construct a multi-use path as a standalone project for the three major study roadways ranges between $1.3 million and $4.2 million (Table 39). However, it is anticipated that these projects will be implemented in conjunction with roadway widening projects or adjacent development. Similarly, a unit cost to construct a bike lane and sidewalk is provided for reference. Detailed cost estimates are provided in Appendix F reference. Table 39: Planning Level Cost Estimates Bike Lane and Multi-Use Paths 2015 Dollars ($1,000,000s) Low Estimate High Estimate Improvement CN RW PE Total CN RW PE Total 1 Multi-Use Path - Ashland Road (Both Sides) $1.29 $0.65 $0.19 $2.20 $1.29 $0.84 $2.32 $ Multi-Use Path Broad Street Road (Both Sides) $2.32 $1.17 $0.33 $3.90 $2.32 $1.51 $4.16 $ Multi-Use Path Three Chopt Road (Both Sides) $0.74 $0.37 $0.11 $1.30 $0.74 $0.48 $1.33 $1.40 $4.35 $2.19 $0.63 $7.40 $4.35 $2.83 $7.81 $8.00 Construction Unit Cost 2015 Dollars ($1,000,000s) Improvement Unit Low High 4 Bike Lane 4 feet of pavement on both sides of roadway Mile $0.53 $ Provide 5 sidewalk Mile $0.29 $0.29 Notes: - Total Costs rounded to the nearest $100,000 - PE = Preliminary Engineering, RW = Right of Way and Utility Relocation, CN = Construction - To estimate PE assume 14% (Low) and 14% (High) of Construction Cost - To estimate RW assume 50% (Low) and 65% (High) of Construction Cost Table 40: Planning Level Cost Estimates Auxiliary Lanes Improvement Low Estimate 2015 Dollars ($1,000,000s) High Estimate CN RW PE Total CN RW PE Total 1 Left-Turn Lane Improvements - Standalone $2.00 $1.00 $0.28 $3.30 $2.00 $1.30 $0.28 $ Right-Turn Lane Improvements - Standalone $1.89 $0.95 $0.27 $3.20 $1.89 $1.23 $0.27 $3.40 Notes: - Total Costs rounded to the nearest $100,000 - Source: VDOT TMPD Planning Level Cost Estimates - PE = Preliminary Engineering, RW = Right of Way and Utility Relocation, CN = Construction $3.89 $1.95 $0.55 $6.50 $3.89 $2.53 $0.55 $ Traffic Signals As shown in Plan Sheets 1-13, there are seven new traffic signals proposed as part of the plan, four on Broad Street and three on Ashland Road. Traffic signal locations were strategically located at major intersections and future development access points to optimize traffic signal operations. The County should assume all full median crossovers may be upgraded to signal control as development and background traffic growth warrants. As shown in the plan, all unsignalized crossovers on are either upgraded to signal control or converted to a directional crossover in order to efficiently and safely progress future traffic volumes. Table 41 depicts the spacing of anticipated major intersections along the study corridors. Broad Street Table 41: Proposed Signal Spacing Ashland Road Cross Street Spacing (Feet) Cross Street Spacing (Feet) Hockett Road/St. Matthews Lane 1,085 WB I-64 On- and Off-Ramps 752 Ashland Road 1,085 EB I-64 On- and Off-Ramps 752 Whippoorwill Road 1,213 Three Chopt Road 1,573 Crossover #2 1,329 Plaza Road 1,957 SB Route 288 On- and Off-Ramps 1,974 Broad Street 1,819 NB Route 288 On- and Off-Ramps 2,075 Wilkes Ridge Parkway 1,129 Page 72 October 2015
77 Initially, traffic signals will operate in isolation, as development occurs and additional traffic signals are installed, signal timing should be optimized and coordinated to maximize progression through the corridors. The signal locations shown in Plan Sheets 1-13 were determined to maximize signal spacing along the corridors. Major internal roads to future development should make use of these locations to the extent possible. Implementation of traffic signal control should only be considered after a detail study has been completed which identifies that a traffic signal is warranted. The total estimate, shown in Table 42, to install the proposed traffic signals is between $2.1 million and $3.5 million, costing between $300,000 and $500,000 each. Most of these signals will be installed in conjunction with adjacent development, the three exceptions being the traffic signals associated with the study interchanges. Improving signal timing operations is estimated to be between $400,000 and $600,000 and will be the responsibility of VDOT as they operate and maintain the study corridors. Table 42: Planning Level Cost Estimates Traffic Signals Improvement Low Estimate 2015 Dollars ($1,000,000s) High Estimate CN RW PE Total CN RW PE Total 1 Traffic Signal - Ashland Road at Plaza Drive $0.14 $0.07 $0.02 $0.30 $0.24 $0.16 $0.04 $ Traffic Signal - Ashland Road at Three Chopt Road $0.14 $0.07 $0.02 $0.30 $0.24 $0.16 $0.04 $ Traffic Signal - Broad Street Road at Whippoorwill Road $0.14 $0.07 $0.02 $0.30 $0.24 $0.16 $0.04 $ Traffic Signal - Broad Street Road at Crossover #2 $0.14 $0.07 $0.02 $0.30 $0.24 $0.16 $0.04 $ Traffic Signal - Broad Street Road at NB Route 288 On- and Off-Ramps $0.14 $0.07 $0.02 $0.30 $0.24 $0.16 $0.04 $ Traffic Signal - Broad Street Road at SB Route 288 On- and Off-Ramps $0.14 $0.07 $0.02 $0.30 $0.24 $0.16 $0.04 $ Traffic Signal - Ashland Road at I-64 On- and Off-Ramps $0.14 $0.07 $0.02 $0.30 $0.24 $0.16 $0.04 $0.50 $0.98 $0.49 $0.14 $2.10 $1.68 $1.12 $0.28 $ Improve signal operations - Ashland Road Corridor $0.10 $0.05 $0.02 $0.20 $0.15 $0.10 $0.03 $ Improve signal operations - Broad Street Road Corridor $0.10 $0.05 $0.02 $0.20 $0.15 $0.10 $0.03 $0.30 Notes: - Total Costs rounded to the nearest $100,000 - PE = Preliminary Engineering, RW = Right of Way and Utility Relocation, CN = Construction $0.20 $0.10 $0.04 $0.40 $0.30 $0.20 $0.06 $ Roundabouts The existing Major Thoroughfare Plan encourages use of roundabouts due to the reduction in vehicle conflicts, travel speeds, and delay and the opportunity they provide to help create a village identity. Additionally, VDOT s policy (per the Road Design Manual, Appendix F, Section 2) states that a roundabout must be considered for all projects that include reconstructing or constructing new intersections. Therefore, potential roundabout locations were considered along Ashland Road. Broad Street locations were not considered due to the projected traffic volumes and number of travel lanes. The FHWA alternative intersection selection tool was utilized to evaluate if a roundabout configuration would provide enough capacity to accommodate projected 2035 peak hour traffic volumes. Based on this screening analysis, summarized in Table 43, the intersections of Ashland Road at Three Chopt Road, Rockville Road and Plaza Drive, solely based on projected traffic volumes may be good candidate locations for a multi-lane roundabout. The intersection Broad Street at Ashland Road would not be an appropriate location for a roundabout based on the large projected turning movement volumes. One lane roundabouts will not work due to the lack of capacity. Detailed analysis output sheets are provided in Appendix G. Table 43: Evaluation of Potential Roundabout Locations Low Based on Projected (2035) Peak Hour Traffic Volumes Study Intersection Ashland Road at Three Chopt Road Adequate Adequate Ashland Road at Rockville Road Adequate Adequate AM Ashland Road at Plaza Road Adequate Adequate Ashland Road at Broad Street Adequate Inadequate At the time a traffic signal is warranted at these intersections additional analysis will be required to evaluate other factors (site constraints, including right-of-way impacts, environmental factors, and other design constraints). Particular consideration should be given to the impacts of traffic on the design given the amount of traffic on Ashland Road. A conceptual layout of each potential roundabout, assuming an inscribed diameter of 102 feet and outside diameter of 150 feet, is provided in Figure 40 illustrates the potential impact to right-of-way associated with each roundabout. Each roundabout was estimated to cost between $3.5 million and $5.4 million as summarized in Table 44. When comparing the planning level cost estimate of a traffic signal to a roundabout take note that actual costs are dependent on site specific conditions and initial construction cost versus a life-cycle cost differ between the two options. These differences can be further vetted at the time a traffic signal is warranted. Detailed cost estimates are provided in Table 44. Improvement Table 44: Planning Level Cost Estimates - Roundabouts Low Estimate PM 2015 Dollars ($1,000,000s) High Estimate CN RW PE Total CN RW PE Total 1 Roundabout (2 lanes) - Ashland Road at Plaza Road $2.09 $1.05 $0.30 $3.50 $2.99 $1.95 $0.42 $ Roundabout (2 lanes) - Ashland Road at Rockville Road $2.09 $1.05 $0.30 $3.50 $2.99 $1.95 $0.42 $ Roundabout (2 lanes) - Ashland Road at Three Chopt Road $2.09 $1.05 $0.30 $3.50 $2.99 $1.95 $0.42 $5.36 Notes: - Total Costs rounded to the nearest $100,000 - Source: VDOT TMPD Planning Level Cost Estimates - PE = Preliminary Engineering, RW = Right of Way and Utility Relocation, CN = Construction $6.27 $3.15 $0.90 $10.50 $8.97 $5.85 $1.26 $16.08 Page 73 October 2015

78 Figure 40: Potential Roundabout Locations along Ashland Road 9.8 Travel Demand Management Park & Ride Facilities As the study area continues to develop Goochland County should plan for Park & Ride facilities in conjunction with other transportation improvement projects such as interchange modifications, road widening, and multimodal facilities. Park & ride facilities are suggested to be considered when parcels of land are available in close proximity to limited-access facilities. Opportunities to expand the existing Park & Ride facility on Ashland Road north of I-64, if necessary, could be planned in conjunction with future interchange improvements. Park & Ride facility located near limited-access facilities are attractive for ridesharing and/or express bus service to employment centers. Future opportunities to provide a park & ride lot in the vicinity of the Route 288 and Broad Street interchange should be explored. It is anticipated that the need for park & ride facilities could increase in the future as congestion and fuel costs increase. Planning level cost estimates to expand the existing Park & Ride lot by 100 parking spaces and providing a new Park & Ride facility is summarized in Table 45. Detailed cost estimates are provided in Table 45. Table 45: Planning Level Cost Estimates Park and Ride Facilities Improvement Expand Existing Park and Ride Lot on Ashland Road at I-64 1 (add 100 parking spaces) Construct Park and Ride Lot near Route 288/Broad Street interchange 2 (100 parking space) Notes: - Total Costs rounded to the nearest $100,000 - PE = Preliminary Engineering, RW = Right of Way and Utility Relocation, CN = Construction Low Estimate 2015 Dollars ($1,000,000s) High Estimate CN RW PE Total CN RW PE Total $1.00 $0.50 $0.14 $1.70 $1.00 $0.65 $0.14 $1.80 $1.00 $0.50 $0.14 $1.70 $1.00 $0.65 $0.14 $1.80 $2.00 $1.00 $0.28 $3.40 $2.00 $1.30 $0.28 $ Transit Potential transit recommendations (local transit service, express bus service, bus rapid transit, etc.) within the study area is dependent on the type and density of future development within study area and surrounding region. Transit services could be in demand as development along the study corridors gains momentum and congestion increases along I-64, Route 288, Broad Street, and other major travel routes in the Richmond metropolitan area. The County should partner with the Greater Richmond Transit Company (GRTC) to look for opportunities to incorporate transit services as needed. Possible services could include ridesharing and express bus destinations. Transit services in conjunction with other components of the plan help to manage and preserve capacity and safety on the study corridors. Page 74 October 2015
79 10.0 Implementation Plan The next key step in the planning process is to determine how the recommended improvements will be implemented. Both Goochland County and VDOT officials will need to determine implementation strategies as well as establish project priorities. Implementation strategies to consider include seeking and identifying funding streams, both public and private, to construct improvements. There are several potential public programs that may assist with funding projects. At the federal level there are earmarks, National Highway System funds, Congestion Mitigation Air Quality (CMAQ) funds, bridge funds, Regional Surface Transportation Program (RSTP) funds, Highway Safety Improvement Program (HSIP) funds, and Transportation Alternatives Program (TAP) funds, to name a few. At the state level there is the VDOT six-year improvement program (SYIP) can help define what alternative funding sources the project may qualify for such as; the Recreational Access Program, the Economic Development Access Program, or the Revenue Sharing Program. It is recommended that proposed improvements be prioritized into projects with both County and VDOT input. Each project should be thoroughly evaluated then identified for priority order, time frame from implementation, and potential funding sources Federal Funding Source Alternatives To assist Goochland County, a review of available federal funding sources is provided with a summary of federal roadway/transportation alternative improvement funding programs Congestion Mitigation and Air Quality (CMAQ) The CMAQ program, as continued under the Moving Ahead for Progress in the 21st Century Act (MAP-21), provides a flexible funding source to state and local governments for transportation projects and programs to help meet the requirements of the Clean Air Act. MAP-21, signed into law in July 2012, provided the first long-term surface transportation funding since Funding is available to reduce congestion and improve air quality for areas that do not meet the National Ambient Air Quality Standards for ozone, carbon monoxide, or particulate matter (nonattainment areas) and for former nonattainment areas that are now in compliance (maintenance areas). The CMAQ program supports two important goals of the Department of Transportation: improving air quality and relieving congestion. The typical split for CMAQ projects between federal funding and the project sponsor is 80% federal and 20% state and/or local match. By policy the CTB has delegated the authority to allocate CMAQ funds to the Metropolitan Planning Organization's (MPO) in nonattainment and maintenance areas. The Richmond area was designated by the Environmental Protection Agency (EPA) in 2007 as a maintenance area. Goochland County is on the border of this maintenance area and therefore, not eligible for CMAQ funding. ( Highway Safety Improvement Program (HSIP) Safety throughout all transportation programs remains VDOT s number one priority. The Federal MAP-21 continues the successful HSIP, with average annual funding of $2.4 billion, including $220 million per year for the Rail-Highway Crossings program. The next round of HSIP funding will become available for use in FY17. The HSIP emphasizes a data-driven, strategic approach to improving highway safety on all public roads that focuses on performance. The foundation for this approach is a safety data system, which each state is required to have to identify key safety problems, establish their relative severity, and then adopt strategic and performance-based goals to maximize safety. Every state is required to develop a Strategic Highway Safety Plan (SHSP) that lays out strategies to address these key safety problems. Every State now has an SHSP in place, and MAP-21 ensures ongoing progress toward achieving safety targets by requiring regular plan updates and defining a clear linkage between behavioral (NHTSA funded) State safety programs and the SHSP. Virginia s SHSP identified seven emphasis areas for the updated plan including speeding, young drivers, occupant protection, impaired driving, roadway departures, intersections and data collection / management / analysis. The updated SHSP also initiates a comprehensive evaluation plan to track progress and effectiveness towards the plan s goal of reducing deaths and severe injuries by half by The current VDOT Six Year Improvement Plan (SYIP) does not provide HSIP funding on the non-interstate system beyond FY The federal share for HSIP projects is 90%, with the remaining 10% typically being covered by VDOT. Where VDOT funding is limited, however, the locality could be required to cover this 10%. FY HSIP applications are accepted for approval through November 1st. ( Surface Transportation Program (STP) The Surface Transportation Program (STP) provides flexible funding that may be used by States and localities for projects to preserve and improve the conditions and performance on any Federal-aid highway (e.g., I-64, Route 288), bridge and tunnel projects on any public road, pedestrian and bicycle infrastructure, and transit capital projects, including intercity bus terminals. Federal-aid highways are defined as those highways on the Federal-aid highway systems and all other public roads not classified as local roads or rural minor collectors. The Federal-aid highway systems consist of the National Highway System and the Dwight D. Eisenhower National System of Interstate and Defense Highways (the "Interstate System"). Construction and operational improvements for a minor collector in the same corridor and in proximity to a National Highway System (NHS) route if the improvement is more cost-effective (as determined by a benefit-cost analysis) than an NHS improvement and will enhance NHS level of service and regional traffic flow. This link provides NHS routes near the project locations. The typical split for STP projects between federal funding and the project sponsor is 80% federal and 20% state and/or local match. Additional STP facts: Transportation Alternatives Program (TAP) The Transportation Alternatives Program redefines the former Transportation Enhancement (TE) Program and consolidates these eligibilities with the Safe Routes to School and Recreational Trails program eligibilities. The program is intended to help local sponsors fund community based projects that expand travel choices and enhance the transportation experience by improving the cultural, historical and environmental aspects of the transportation infrastructure. The program does not fund traditional roadway projects or provide maintenance for these facilities. Instead it focuses on providing for pedestrian and bicycle facilities, community improvements and mitigating the negative impacts of the highway system. The application cycle for FY 2016 TAP funding begins in early July, followed by applicant workshops in late Page 75 October 2015
80 July/August. The typical split for TAP projects between federal funding and the project sponsor is 80% federal and 20% state and/or local match. am_guide.pdf 10.2 State Funding Source Alternatives To assist Goochland County, a review of available funding sources is provided with a summary of state roadway/transportation alternative improvement funding programs House Bill 2 4 Governor Terry McAuliffe signed HB2 into law in 2014, which directs the Commonwealth Transportation Board (CTB) to develop and use a scoring process for project selection by July The intent of HB2 is to invest limited tax dollars in the right projects that meet the most critical transportation needs in Virginia. At the heart of the new law is scoring projects based on an objective process that involves public engagement and input. Once projects are scored, the CTB will have the best information possible to select the right projects for funding. There are two main pathways to funding within the HB2 process the Construction District Grant Program (CDGP) and the High-Priority Projects Program (HPPP). These two grant programs were established this year under House Bill The CDGP is open only to localities and replaces the old construction fund allocation model. A project applying for funds from the CDGP is prioritized with projects from the same construction district. A project applying for funds from the HPPP is prioritized with projects statewide. The Commonwealth Transportation Board (CTB) then makes a final decision on which projects to fund. Projects are considered eligible and qualify to be scored if they comply with the following project types: 4. Safety Need In general, submitted projects must meet a need for network on which the project is proposed. Projects will be scored based on specific scoring factors for safety, congestion mitigation, accessibility, environmental quality, economic development, and land use. The most critical information that will be needed for each application is a well-defined scope and project description and a reasonable cost estimate. A well-defined scope is needed to calculate many of the measure that will be used to evaluate the project benefit. A detailed scope is critical to having a reasonable cost estimate. If a project is selected for funding and the cost increases significantly ($5,000,000 or less >20 percent increase, $5,000,000 or more >10 percent increase), the project will have to be rescored through the process. Though the State will be using many different data sources to compile the data and calculate the measures needed to score the projects, there will be some measure-related data that must be provided by the applicant. A link to the HB2 website is referenced below where an overview of what measures will be the responsibility of the state versus the applicant. All projects must be submitted by September 30th. Prior to submittal, all entities are encouraged to coordinate with their local Virginia Department of Transportation and Virginia Department of Rail and Public Transportation representatives. Projects may be submitted via the online web application any time from August 1st September 30th. Once all projects have been submitted, evaluation teams will work through December to screen and score all projects and provide project rankings to the CTB in January Revenue Sharing The Revenue Sharing Program provides additional funding for use by a county, city, or town to construct, reconstruct, or improve the highway systems within such county, city, or town. Locality funds are matched on a dollar-for-dollar basis with state funds, with statutory limitations on the amount of state funds authorized per locality. A locality may apply for up to a maximum of $10 million in matching allocations per fiscal year, with up to $5 million of these requested funds being utilized for maintenance projects. There is no limit to the amount of additional funds the locality may contribute. Priority will be given first to allocations that accelerate construction projects in the Commonwealth Six-Year Improvement Program or the locality s capital plan. Locality requests up to a total of $1 million will be evaluated first and funded first. A technical evaluation team will ensure that the project meets the capacity and operations needs of VTrans2040. VTrans 2040 divides the Commonwealth s needs into three types; each receives their own set of principles: 1. Corridors of Statewide Significance (CoSS) Interregional travel market 2. Regional Networks Intraregional travel market 3. Urban Development Areas (UDA) Local activity center market 4 The Revenue Sharing Program is administered by the Virginia Department of Transportation, in cooperation with the participating localities, under the authority of Section of the Code of Virginia and the Commonwealth Transportation Board s (CTB) Revenue Sharing Program Policy. Application for program funding must be made by resolution of the governing body of the jurisdiction requesting the funds. Applications for program funding are typically due by November for funding under the next fiscal year. Localities are typically notified by June prior to the effective fiscal year of application approvals. The Revenue Sharing Program may be used to finance eligible work on highway systems within a locality. The Revenue Sharing Program is intended to provide funding for immediately needed improvements or to supplement funding for Page 76 October 2015
81 existing projects. Larger new projects may also be considered, provided the locality identifies any additional funding needed to implement the project. Revenue Sharing Program funds are generally expected to be used to finance project costs in the same fiscal year and projects should be in active development that is leading to their completion within the near term. The total funds available each fiscal year will be determined by the Commonwealth Transportation Board. The maximum allocation the CTB may make to the Revenue Sharing Program is $200 million annually. The minimum allocation the CTB may make to the Revenue Sharing Program is $15 million annually Recreational Access Program The Recreational Access Program is a state-funded program intended to assist in providing adequate access to or within public recreational areas and historic sites operated by the Commonwealth of Virginia, or by a local government or authority. Federal sites are not eligible. Recreational Access funds, with the appropriate designation and concurrence of the Director of Conservation and Recreation or the Director of Historic Resources, are allocated by the Commonwealth Transportation Board (CTB) in accordance with its policy revised February 20, While projects may qualify under either recreational or historic categories, the area may have both recreational and historic qualities. It is recommended that localities consult with both DCR and DHR to ensure the access project design takes all values into account when requesting funding under this program. These funds may be used for financing the construction or improvement of secondary or local system roads within all counties and cities and certain towns that are part of the Urban System, hereinafter referred to as eligible localities. The Recreational Access Program is funding through an annual appropriation, with up to $3 million available for the program. Applications are considered on a first come, first served basis. Limitations to this funding specify that not more than $400,000 may be allocated for an access road or $75,000 for a bikeway project for any facility operated by a state agency. Additionally, not more than $250,000 may be allocated for an access road or $60,000 for a bikeway project to any facility operated by a locality, with an additional $100,000 available for the access road or $15,000 for the bikeway if matched dollar-for-dollar by the locality. ( Economic Development Access Program The Economic Development Access Program is a state-funded incentive designed to assist Virginia localities in attracting sustainable businesses that create jobs and generate tax revenues within the locality. The program makes funds available to localities for road improvements needed to provide adequate access for new or substantially expanding qualifying establishments. These qualifying investments represent the cost of land, building and any manufacturing/processing equipment by an incoming establishment, including manufacturing, processing, research and development, distribution centers, regional service centers and corporate headquarters. Economic Development Access funds are allocated by the Commonwealth Transportation Board (CTB) in accordance with its policy revised on June 20, These funds may be used for financing the construction or improvement of secondary or local system roads within all counties and cities, and certain towns that are part of the Urban System, hereinafter referred to as eligible localities. Ancillary improvements, such as turn lanes or intersection modifications may also be warranted as part of the access project, but are not to be considered as the primary objective of the project. The program is administered by the Virginia Department of Transportation (VDOT), Local Assistance Division. Subject to available funding, the maximum unmatched allocation to a locality within any one fiscal year is $500,000, which may be used for one or more projects. The maximum allocation to any one project is limited to the lesser of either the access road construction cost or 20% of the qualifying investment made. This guide describes the requirements, limitations and procedures of obtaining and utilizing Economic Development Access funds Local Funding Source Alternatives At the local level, Goochland County is a member of the Richmond Regional Transportation Planning Organization (RRTPO) which can assist local planning efforts by providing services and guidance on funding strategies/coordination with VDOT. Private funds may be realized through rezoning action and proffer contributions, as well as dedication of right-of-way. All the referenced funding programs and strategies require some portion of commitment and/or match at the local level but serve as a means for communities to increase the effectiveness of their budgetary dollars toward priority projects. One source of local match funding could be the inclusion of specific transportation-match funds in the County s Capital Improvement Program (CIP), or another dedicated local fund. Local fund matches or the use of additional local funds for some components may be necessary if it is determined their inclusion in the roadway project is cost prohibitive, a significant addition to anticipated costs, or inconsistent with the intent of the project. The vision for the corridor is to provide an efficient transportation system that is multi-modal in nature, safe for all users, and aesthetically acceptable to the community. To achieve some of these objectives and based on the proposed typical section of the roadway it is anticipated that additional improvement and roadway attribute costs may include; the relocation of overhead utilities to underground, a multi-use path and the associated bicycle and pedestrian safety features (e.g., signage, pavement markings, pedestrian push buttons/pedestrian displays at signalized intersections, pedestrian scale lighting, and flashing beacons), and landscaping (raised grass medians, trees, and/or shrubs). These features may require the County to identify and dedicate additional local funds to supplement traditional and alternative funding sources Funding Summary Each of the funding alternatives and funding sources described above present their own unique sets of challenges when it comes to their availability, application process and any strings that may be attached. Generally speaking, the pot of federal funding is much larger and requires a smaller state/local match (10-20% match typical) when compared to the alternative state funding sources (50% or more). The challenge with utilizing federal funding is the required compliance with the National Environmental Policy Act (NEPA) through the completion of an Environmental Impact Statement (EIS) and the required use of Davis-Bacon Act wage rates for construction. These can lead to impacts to project schedules and construction budgets. State funded projects over $500,000 are only required to complete the State Environmental Review Process (SERP), which typically has a much shorter and less exhaustive schedule, and does not require the use of Davis-Bacon wage rates. Both federal and state alternative funding sources typically have expiration dates based on when funds are first allocated, which is typically three years. Projects not being delivered in a timely manner risk losing funding and negatively impacting the state s ability to receive additional federal discretionary funds. All federal-aid or federal-aid eligible projects are required to be in the State Transportation Improvement Program (STIP). Goochland County should work with the Richmond Regional TPO to ensure that all projects under consideration are included in the STIP and SSYP. Regardless of the challenges, Goochland County should diligently Page 77 October 2015
82 pursue and consider all of these programs when strategizing on ways to fund each of the recommended improvement outlined in the AMP Key Steps The following key steps are required to success deliver the recommendations in the AMP: 1. Adopt the AMP: Official adoption of the AMP by Goochland County will be the first step of implementing the plan. This can be accomplished by formal resolution of the entire report, or can involve a limited adoption of only Section 9.0, which in itself is the Access Management Plan for the project. Adoption of the plan will demonstrate support of the strategies and goals outlined in the report. With local agency adoption of the AMP, Goochland County can better partner with partner agencies (VDOT, Richmond Regional Planning District Commission, and the Federal Highway Administration) to ensure future developments are consistent with this plan. Early collaboration regarding future developments will ensure that all provisions in the plan are being met. 2. Incorporate AMP into Decision Making Process: Following adoption of the plan, Goochland County staff should be familiar with the AMP and planning and engineering strategies required to achieve the plan. Additionally, Goochland County s Planning Commission and Board of Supervisors members should be aware of the benefits associated with implementing the plan and their role in its implementation. The County will need to ensure land use and development approvals do not allow access to Broad Street and Ashland Road that are inconsistent with the AMP. The plan should be referenced and used to guide their decision making on a range of land use issues pertaining to access location and design. improvements while larger developments may achieve more towards the longer-term, ultimate build-out phase. A series of phased improvements, shown in Table 46, will be required to achieve the ultimate build-out design for the Broad Street and Ashland Road corridors and supporting parallel roadway network. 5. Regular Review and Update of the Plan: To continue the implementation of the AMP, Goochland County should continue to meet on a regular basis to review and revise the plan as necessary. Once adopted, the AMP will be updated as the Comprehensive Plan is required by law to be updated every 5 to 10 years. Additional opportunities to revisit the plan include: through coordination of major development proposals, traffic impact studies, access issues, right-of-way preservation and roadway cross-section designs, rezoning proposals, ordinance text amendments, local master plan updates, roadway improvements, non-motorized transportation, streetscape enhancement and other common issues along the corridor Prioritization The following prioritization matrix (Table 46) provides a timeframe, planning level cost estimate, and party responsible for implementing the AMP to assist the County in implementation of the AMP. Recommendations for specific improvements to the study corridors have been split into short-term (less than 15 years) and long-term (greater than 15 years) categories based primarily on their scale as well as the time frame in which they will be needed. This approach allows Goochland County to prioritize larger scale projects over time while also being able to implement quick hitter projects that mitigate immediate needs. 3. Coordinate between Agencies: Without the coordination and cooperation of all involved agencies, the AMP cannot be implemented successfully. Development decisions along Broad Street and Ashland Road are under the control of several agencies. Goochland County has jurisdiction over land use planning, zoning, site plan and subdivision review outside VDOT right-of-way. VDOT has control over improvements within state right-of-way. Successful implementation of the recommendations in the AMP requires a partnership between Goochland County and VDOT. Prior to the issuance of any VDOT action on applications or permits, VDOT should confer with Goochland County. This joint effort by VDOT and Goochland County should preclude developers from applying to VDOT for access permits in advance of or inconsistent with local approvals. Additional agencies that will require close coordination to deliver the plan include the Richmond Regional Transportation Planning Organization, through which access to funding is coordinated, and Federal Highway Administration, who govern access to the interstate system. 4. Phasing from Current Conditions to Build-Out: Several steps are needed for the study corridors to grow from their current cross-sections into improved roadways with additional traffic signals, turn lanes, supporting parallel street systems, and high volume intersection improvements. Development growth will drive an increasing need for improvements to the corridors. To mitigate growth impacts on road capacity and safety, Goochland County, through their land zoning and development authority, will need to require private development to mitigate their impacts by improving local streets. The AMP serves as a tool to provide guidance to make those improvements most effective at achieving the long term goals of the plan. Smaller developments may only have the opportunity to make initial Page 78 October 2015
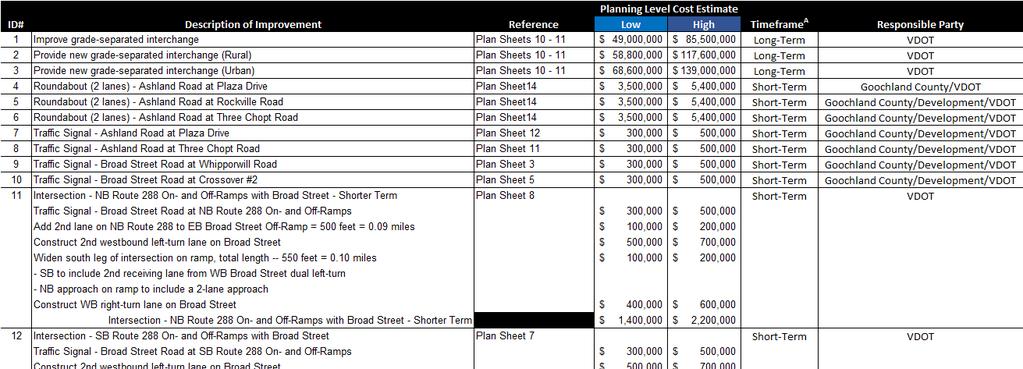
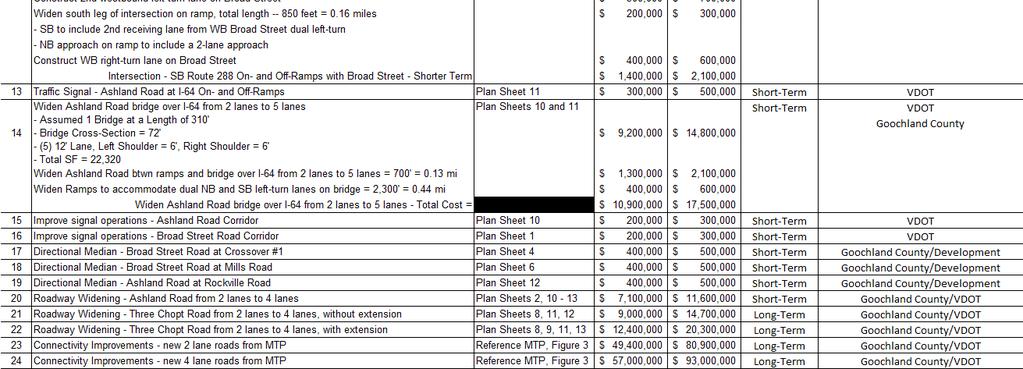
83 Table 46: Implementation Plan Page 79 October 2015

84 Page 80 October 2015
85 Appendix A: Stakeholder Interviews October 2015
86 Appendix B: Data Collection October 2015
87 Appendix C: Operational Analysis Results Appendix C-1: Existing (2014) Appendix C-2: Future No-Build (2035) Appendix C-3: Build (2035) Minimally Managed Access Scenario (MMAS) Appendix C-4: Build (2035) Ultimately Managed Access Scenario (UMAS) October 2015
88 Appendix D: Growth Rate Development October 2015
89 Appendix E: Minimally and Ultimately Managed Access Scenarios October 2015
90 Appendix F: Planning Level Cost Estimates October 2015
91 Appendix G: Roundabout Screening Results October 2015
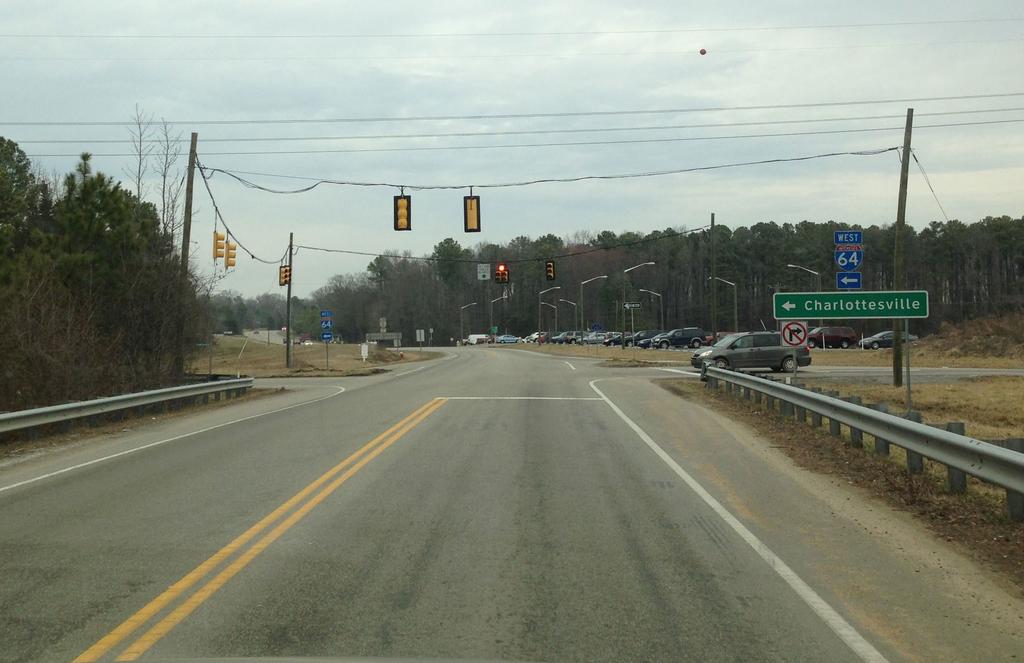
92
Arterial Management Plan for US Route 250 and State Route 623
 Arterial Management Plan for US Route 250 and State Route 623 June 25, 2014 Brad Shelton, AICP Access Management and Traffic Impact Analysis Programs Manager Transportation and Mobility Planning Division
Chapter 4 Traffic Analysis
 Chapter 4 Traffic Analysis PURPOSE The traffic analysis component of the K-68 Corridor Management Plan incorporates information on the existing transportation network, such as traffic volumes and intersection
City of Wayzata Comprehensive Plan 2030 Transportation Chapter: Appendix A
 A1. Functional Classification Table A-1 illustrates the Metropolitan Council s detailed criteria established for the functional classification of roadways within the Twin Cities Metropolitan Area. Table
City of Homewood Transportation Plan
 City of Homewood Transportation Plan Prepared for: City of Homewood, Alabama Prepared by: Skipper Consulting, Inc. May 2007 TABLE OF CONTENTS INTRODUCTION... 1 BACKGROUND INFORMATION... 1 EXISTING TRANSPORTATION
CHAPTER 5 TRANSPORTATION GOAL
 CHAPTER 5 TRANSPORTATION GOAL Create and sustain a transportation system that meets the demands for existing and future traffic; skillfully integrates existing and planned development; and provides a safe
Access Management Regulations and Standards
 Access Management Regulations and Standards Efficient highway operation Reasonable property access Concept of Access Management The way to manage access to land development while simultaneously preserving
Shockoe Bottom Preliminary Traffic and Parking Analysis
 Shockoe Bottom Preliminary Traffic and Parking Analysis Richmond, Virginia August 14, 2013 Prepared For City of Richmond Department of Public Works Prepared By 1001 Boulders Pkwy Suite 300, Richmond, VA
APPENDIX G: INTERSECTION NEEDS AT OKEECHOBEE BOULEVARD
 APPENDIX G: INTERSECTION NEEDS AT OKEECHOBEE BOULEVARD INTERSECTION NEEDS AT SR 7 and OKEECHOBEE BOULEVARD SR 7 Extension Project Development and Environment (PD&E) Study From Okeechobee Boulevard (SR
Access Management Regulations and Standards for Minor Arterials, Collectors, Local Streets
 Access Management Regulations and Standards for Minor Arterials, Collectors, Local Streets September 2009 Paul Grasewicz Access Management Administrator Concept of Access Management The way to manage access
Recommended Roadway Plan Section 2 - Land Development and Roadway Access
 Recommended Roadway Plan Section 2 - Land Development and Roadway Access SECTION 2 Land Development and Roadway Access 2.1 Land Use and Access Management The Federal Highway Administration (FHWA) defines
Highway 111 Corridor Study
 Highway 111 Corridor Study June, 2009 LINCOLN CO. HWY 111 CORRIDOR STUDY Draft Study Tea, South Dakota Prepared for City of Tea Sioux Falls Metropolitan Planning Organization Prepared by HDR Engineering,
4. ENVIRONMENTAL IMPACT ANALYSIS 9. TRANSPORTATION AND TRAFFIC
 4. ENVIRONMENTAL IMPACT ANALYSIS 9. TRANSPORTATION AND TRAFFIC 4.9.1 INTRODUCTION The following section addresses the Proposed Project s impact on transportation and traffic based on the Traffic Study
Clackamas County Comprehensive Plan
 ROADWAYS The County s road system permits the movement of goods and people between communities and regions, using any of a variety of modes of travel. Roads provide access to virtually all property. They
ARTINSVILLE ENRY OUNTY REA RANSPORTATION TUDY
 ARTINSVILLE ENRY OUNTY REA RANSPORTATION TUDY DEVELOPED BY THE TRANSPORTATION AND MOBILITY PLANNING DIVISION OF THE VIRGINIA DEPARTMENT OF TRANSPORTATION IN COOPERATION WITH THE U.S. DEPARTMENT OF TRANSPORTATION,
Route 7 Corridor Study
 Route 7 Corridor Study Executive Summary Study Area The following report analyzes a segment of the Virginia State Route 7 corridor. The corridor study area, spanning over 5 miles in length, is a multi
M-58 HIGHWAY ACCESS MANAGEMENT STUDY Mullen Road to Bel-Ray Boulevard. Prepared for CITY OF BELTON. May 2016
 M-58 HIGHWAY ACCESS MANAGEMENT STUDY Prepared for CITY OF BELTON By May 2016 Introduction Missouri State Highway 58 (M-58 Highway) is a major commercial corridor in the City of Belton. As development has
Technical Memorandum TRAFFIC IMPACT STUDY. RIDLEY ROAD CONVENIENCE STORE Southampton County, VA. Prepared for: Mr. David Williams.
 Technical Memorandum TRFFIC IMPCT STUDY RIDLEY ROD CONVENIENCE STORE Southampton County, V Prepared for: Mr. David Williams By: Charles Smith, P.E., PTOE EPR Charlottesville, V July 2014 1 TBLE OF CONTENTS
Traffic Impact Analysis Walton Acres at Riverwood Athletic Club Clayton, NC
 Traffic Impact Analysis Walton Acres at Riverwood Athletic Club Clayton, NC 1. TABLE OF CONTENTS INTRODUCTION...1 1.1. Site Location and Study Area...1 1.2. Proposed Land Use and Site Access...2 1.3.
5.0 Roadway System Plan
 Southwest Boise Transportation Study Page 16 5.0 Roadway System Plan The Roadway System Plan outlines roadway improvements in the Initial Study Area. It forecasts future deficiencies on the arterial system,
Albany Shaker Road Corridor Study Public Meeting # 2
 Albany Shaker Road Corridor Study Public Meeting # 2 Scope / Meeting Purpose This project is a CDTC Linkage Study. The Linkage Program is designed to implement the adopted planning and investment principles
Project Description Form 8EE
 Project Description Form 8EE Basic Project Information Submitting Jurisdiction/Agency: Town of Dumfries Project Title: Route 1 (Fraley Blvd) Widening: Brady's Hill Road to Dumfries Road Project Location:
Highway 49, Highway 351 and Highway 91 Improvements Feasibility Study Craighead County
 Highway 49, Highway 351 and Highway 91 Improvements Feasibility Study Craighead County Executive Summary March 2015 Highway 49, Highway 351 and Highway 91 Improvements Feasibility Study Craighead County
TRASBURG RANSPORTATION
 TRASBURG RANSPORTATION LAN DEVELOPED BY THE TRANSPORTATION PLANNING DIVISION OF THE VIRGINIA DEPARTMENT OF TRANSPORTATION IN COOPERATION WITH THE U.S. DEPARTMENT OF TRANSPORTATION, FEDERAL HIGHWAY ADMINISTRATION
WYDOT DESIGN GUIDES. Guide for. NHS Arterial (Non-Interstate)
") WYDOT DESIGN GUIDES Guide for NHS Arterial (Non-Interstate) 2014 GUIDE FOR NATIONAL HIGHWAY SYSTEM (NHS) HIGHWAYS (NHS ARTERIALS, Non-Interstate) PRESERVATION REHABILITATION RECONSTRUCTION INTRODUCTION
WYDOT DESIGN GUIDES Guide for NHS Arterial (Non-Interstate) 2014 GUIDE FOR NATIONAL HIGHWAY SYSTEM (NHS) HIGHWAYS (NHS ARTERIALS, Non-Interstate) PRESERVATION REHABILITATION RECONSTRUCTION INTRODUCTION
Access Management Regulations and Standards
 Access Management Regulations and Standards January 2014 Efficient highway operation Reasonable property access Concept of Access Management The way to manage access to land development while preserving
WYDOT DESIGN GUIDES. Guide for. Non-NHS State Highways
 WYDOT DESIGN GUIDES Guide for Non-NHS State Highways 2014 GUIDE FOR Non-NATIONAL HIGHWAY SYSTEM (Non-NHS) STATE HIGHWAYS PRESERVATION REHABILITATION RECONSTRUCTION INTRODUCTION This Guide is directed to
Traffic Impact Analysis Chatham County Grocery Chatham County, NC
 Chatham County Grocery Chatham County, NC TABLE OF CONTENTS 1. INTRODUCTION... 1 1.1. Location and Study Area... 1 1.2. Proposed Land Use and Access... 2 1.3. Adjacent Land Uses... 2 1.4. Existing ways...
5858 N COLLEGE, LLC N College Avenue Traffic Impact Study
 5858 N COLLEGE, LLC nue Traffic Impact Study August 22, 2016 Contents Traffic Impact Study Page Preparer Qualifications... 1 Introduction... 2 Existing Roadway Conditions... 5 Existing Traffic Conditions...
TRAFFIC STUDY GUIDELINES Clarksville Street Department
 TRAFFIC STUDY GUIDELINES Clarksville Street Department 9/1/2009 Introduction Traffic studies are used to help the city determine potential impacts to the operation of the surrounding roadway network. Two
TRAFFIC IMPACT STUDY And A TRAFFIC SIGNAL WARRANT ANALYSIS FOR A SENIOR LIVING AND APARTMENT DEVELOPMENT
 TRAFFIC IMPACT STUDY And A TRAFFIC SIGNAL WARRANT ANALYSIS FOR A SENIOR LIVING AND APARTMENT DEVELOPMENT DEERFIELD TOWNSHIP, WARREN COUNTY, OHIO Nantucket Circle and Montgomery Road () Prepared for: ODLE
DRAFT BUENA VISTA 2020 TRANSPORTATION PLAN
 DRAFT BUENA VISTA 2020 TRANSPORTATION PLAN DEVELOPED BY THE TRANSPORTATION PLANNING DIVISION OF THE VIRGINIA DEPARTMENT OF TRANSPORTATION IN COOPERATION WITH THE U.S. DEPARTMENT OF TRANSPORTATION, FEDERAL
Gwinnett County Department of Transportation SR 324 / Gravel Springs Road at I-85 / SR 403 Interchange Project Number F , PI No.
 June 4, 2015 Dear Resident: Thank you for attending this public information meeting for the proposed SR 324 / Gravel Springs Road at I-85 Interchange. The purpose of this meeting is two-fold: to provide
INTRODUCTION THOROUGHFARE SYSTEM CLASSIFICATIONS
 INTRODUCTION The thoroughfare plan will assist public officials in the development of a specialized system for efficient and safe movement of vehicular traffic while minimizing potential conflicts with
METHODOLOGY. Signalized Intersection Average Control Delay (sec/veh)
") Chapter 5 Traffic Analysis 5.1 SUMMARY US /West 6 th Street assumes a unique role in the Lawrence Douglas County transportation system. This principal arterial street currently conveys commuter traffic
Chapter 5 Traffic Analysis 5.1 SUMMARY US /West 6 th Street assumes a unique role in the Lawrence Douglas County transportation system. This principal arterial street currently conveys commuter traffic
TRANSPORTATION ANALYSIS REPORT US Route 6 Huron, Erie County, Ohio
 TRANSPORTATION ANALYSIS REPORT US Route 6 Huron, Erie County, Ohio December 12, 2012 Prepared for: The City of Huron 417 Main Huron, OH 44839 Providing Practical Experience Technical Excellence and Client
Basalt Creek Transportation Refinement Plan Recommendations
 Basalt Creek Transportation Refinement Plan Recommendations Introduction The Basalt Creek transportation planning effort analyzed future transportation conditions and evaluated alternative strategies for
#!! "$% ##! &! # '#! % $ #!
 Executive Summary US Highway 16 (US 16) is the primary corridor connecting Rapid City to the Black Hills region. It serves a growing population of commercial and residential traffic, as well as seasonal
TRAFFIC IMPACT STUDY COMPREHENSIVE UPDATE TOWN OF THOMPSON S STATION, TENNESSEE PREPARED FOR: THE TOWN OF THOMPSON S STATION
 TRAFFIC IMPACT STUDY COMPREHENSIVE UPDATE TOWN OF THOMPSON S STATION, TENNESSEE PREPARED FOR: THE TOWN OF THOMPSON S STATION Transportation Consultants, LLC 1101 17 TH AVENUE SOUTH NASHVILLE, TN 37212
University of Victoria Campus Cycling Plan Terms of Reference. 1.0 Project Description
 University of Victoria Campus Cycling Plan Terms of Reference 1.0 Project Description The Campus Cycling Plan, a first for the University, will provide a comprehensive and coordinated approach to support
Public Involvement Meeting Tuesday, June 13, Albany Shaker Road Corridor Study
 Public Involvement Meeting Tuesday, June 13, 2017 Albany Shaker Road Corridor Study Agenda / Meeting Outline 1. Introduce the project 2. Complete Streets 3. Share/confirm our findings 4. Your Opinion 5.
Lee s Summit Road Improvement Study Public Open House June 7, 2007 Summary of Comment Card Responses
 Lee s Summit Road Improvement Study Public Open House June 7, 2007 Summary of Comment Card Responses Introduction At the Lee s Summit Road Improvement Study Public Open House held Thursday, June 7, 2007
Multimodal Through Corridors and Placemaking Corridors
 68 Multimodal Through Corridors and Placemaking Corridors Corridors have different functions in a region. Some corridors are used to get smoothly and rapidly through a region or to get quickly to major
Walmart (Store # ) 60 th Street North and Marion Road Sioux Falls, South Dakota
 60 th Street North and Marion Road Sioux Falls, South Dakota") Walmart (Store #4865-00) 60 th Street North and Marion Road Sioux Falls, South Dakota Prepared for: Wal-Mart Stores, Inc. Bentonville, Arkansas Prepared by: Kimley-Horn and Associates, Inc. ã2013 Kimley-Horn
Walmart (Store #4865-00) 60 th Street North and Marion Road Sioux Falls, South Dakota Prepared for: Wal-Mart Stores, Inc. Bentonville, Arkansas Prepared by: Kimley-Horn and Associates, Inc. ã2013 Kimley-Horn
Donahue Drive Corridor Traffic Operational Evaluation
 Donahue Drive Corridor Traffic Operational Evaluation PREPARED FOR: THE CITY OF AUBURN PREPARED BY: JANUARY 2007 Donahue Drive Corridor Study--Auburn, Alabama TABLE OF CONTENTS Introduction... 1 Background
Traffic Impact Study. Roderick Place Columbia Pike Thompson s Station, TN. Transportation Group, LLC Traffic Engineering and Planning
 F i s c h b a c h Transportation Group, LLC Traffic Engineering and Planning Traffic Impact Study Roderick Place Columbia Pike Thompson s Station, TN Prepared March 2016 Ms. Gillian L. Fischbach, P.E.,
Transportation Impact Study for Abington Terrace
 Transportation Impact Study for Abington Terrace Abington Township, Montgomery County, PA Sandy A. Koza, P.E., PTOE PA PE License Number PE059911 Prepared by McMahon Associates, Inc. 425 Commerce Drive,
TRAFFIC ASSESSMENT River Edge Colorado
 TRAFFIC ASSESSMENT River Edge Colorado Submitted by: Fehr & Peers 621 17th Street, Ste. 231 Denver, CO 8293 (33) 296-43 December, 21 App. M-2 Traffic Assessment River Edge Colorado December 21 TABLE OF
CITY OF COCOA BEACH 2025 COMPREHENSIVE PLAN. Section VIII Mobility Element Goals, Objectives, and Policies
 CITY OF COCOA BEACH 2025 COMPREHENSIVE PLAN Section VIII Mobility Element Goals, Objectives, and Policies Adopted August 6, 2015 by Ordinance No. 1591 VIII MOBILITY ELEMENT Table of Contents Page Number
Solana Beach Comprehensive Active Transportation Strategy (CATS)
") Solana Beach Comprehensive Active Transportation Strategy (CATS) 3.0 Goals & Policies The Solana Beach CATS goals and objectives outlined below were largely drawn from the Solana Beach Circulation Element
Solana Beach Comprehensive Active Transportation Strategy (CATS) 3.0 Goals & Policies The Solana Beach CATS goals and objectives outlined below were largely drawn from the Solana Beach Circulation Element
1 VicRoads Access Management Policies May 2006 Ver VicRoads Access Management Policies May 2006 Version 1.02
 1 VicRoads Access Management Policies May 2006 Ver 1.02 VicRoads Access Management Policies May 2006 Version 1.02 2 VicRoads Access Management Policies May 2006 Ver 1.02 FOREWORD FOR ACCESS MANAGEMENT
Route 29 Corridor Assessment Update. Development of Possible Solutions
 Route 29 Corridor Assessment Update Development of Possible Solutions Public Workshop #3 October 27, 2016 Purpose of Developing Possible Solutions Recap of where we ve been and timeline for moving forward
ACTIVE TRANSPORTATION
 ACTIVE TRANSPORTATION Mobility 2040 Supported Goals Improve the availability of transportation options for people and goods. Support travel efficiency measures and system enhancements targeted at congestion
Washington DC Section of ITE Project Briefing
 Washington DC Section of ITE Project Briefing November 5, 2015 Renée Hamilton, VDOT, Deputy District Administrator I-66 Outside the Beltway Improvement Area Project Location Virginia 2 Purpose and Need
Staunton. Transportation Plan. Transportation Planning Division. Virginia Department of Transportation
 2020 Transportation Plan Developed for the Transportation Planning Division of the Virginia Department of Transportation in cooperation with the U.S. Department of Transportation, Federal Highway Administration
SECTION 1 - TRAFFIC PLANNING
 SECTION 1 - TRAFFIC PLANNING 1.1 TRAFFIC OPERATIONS 1.1.1 Roadway Functional Classification The Multnomah County Comprehensive Framework Plan s Policy 34: Trafficways and the Functional Classification
Town of Bethlehem. Planning Assessment. Bethlehem Town Board
 Town of Bethlehem US 9W Corridor Transportation Planning Assessment Presented e to: Bethlehem Town Board June 2009 Overview Study Background Route 9W Corridor Conditions and Improvements Selkirk Bypass
Intersection Traffic Control Feasibility Study
 Intersection Traffic Control Feasibility Study CSAH 9 at CSAH 60 (185th Avenue) Prepared For: Dakota County Transportation Department Western Service Center 14955 Galaxie Avenue, 3rd Floor Apple Valley,
Traffic Impact Study. Westlake Elementary School Westlake, Ohio. TMS Engineers, Inc. June 5, 2017
 TMS Engineers, Inc. Traffic Impact Study Westlake Elementary School Westlake, Ohio June 5, 2017 Prepared for: Westlake City Schools - Board of Education 27200 Hilliard Boulevard Westlake, OH 44145 TRAFFIC
VDOT BICYCLE & PEDESTRIAN IMPLEMENTATION GUIDE FOR LOCALITY INVOLVEMENT April 2017
 VDOT BICYCLE & PEDESTRIAN IMPLEMENTATION GUIDE FOR LOCALITY INVOLVEMENT April 2017 1 TABLE OF CONTENTS Topic Page(s) About this Guide 3 Encouraging development of bicycle and pedestrian plans by localities
DUNBOW ROAD FUNCTIONAL PLANNING
 DUNBOW ROAD FUNCTIONAL PLANNING Final Report August 3, 216 #31, 316 5th Avenue NE Calgary, AB T2A 6K4 Phone: 43.273.91 Fax: 43.273.344 wattconsultinggroup.com Dunbow Road Functional Planning Final Report
Chapter 5 Future Transportation
 Chapter 5 Future Transportation The Future Land Use Plan identifies the desired land use designations. The land uses desired for Crozet depend, in large part, on the success of the transportation system,
Traffic Impact Study WestBranch Residential Development Davidson, NC March 2016
 Traffic Impact Study WestBranch Residential Development Davidson, NC March 216 TRAFFIC IMPACT STUDY FOR THE WestBranch Residential Development LOCATED IN DAVIDSON, NC Prepared For: Lennar Carolinas, LLC
Appendix B: Forecasting and Traffic Operations Analysis Framework Document
 Existing Conditions Report - Appendix Appendix B: Forecasting and Traffic Operations Analysis Framework Document This document defines the methodology and assumptions that will be used in the traffic forecasting
City of Memphis On-Street Parking Modification Guidelines
 City of Memphis Effective Date: December 1, 2013 Bicycle/Pedestrian Program 125 N. Main Street Memphis, TN 38103 (901) 576-6710 www.bikepedmemphis.com City of Memphis Executive Summary It is current practice
Truck Climbing Lane Traffic Justification Report
 ROUTE 7 (HARRY BYRD HIGHWAY) WESTBOUND FROM WEST MARKET STREET TO ROUTE 9 (CHARLES TOWN PIKE) Truck Climbing Lane Traffic Justification Report Project No. 6007-053-133, P 101 Ι UPC No. 58599 Prepared by:
Exhibit 1 PLANNING COMMISSION AGENDA ITEM
 Exhibit 1 PLANNING COMMISSION AGENDA ITEM Project Name: Grand Junction Circulation Plan Grand Junction Complete Streets Policy Applicant: City of Grand Junction Representative: David Thornton Address:
THIS PAGE LEFT BLANK INTENTIONALLY
 GA SR 25 Spur at Canal Road Transportation Impact Analysis PREPARED FOR GLYNN COUNTY, GEORGIA 1725 Reynolds Street, Suite 300 Brunswick, Georgia 31520 PREPARED BY 217 Arrowhead Boulevard Suite 26 Jonesboro,
MnDOT Implementation of Complete Streets Policy. January 2014
 MnDOT Implementation of Complete Streets Policy January 2014 1 Prepared by Minnesota Department of Transportation 395 John Ireland Boulevard Saint Paul, Minnesota 55155-1899 Phone: 651-296-3000 Toll-Free:
Corpus Christi Metropolitan Transportation Plan Fiscal Year Introduction:
 Introduction: The Safe, Accountable, Flexible, Efficient Transportation Equity Act: A Legacy for Users (SAFETEA-LU) has continued the efforts started through the Intermodal Surface Transportation Efficiency
I-105 Corridor Sustainability Study (CSS)
") I-105 Corridor Sustainability Study (CSS) Metro Streets and Freeways Subcommittee March 21, 2019 Gary Hamrick Cambridge Systematics, Inc. I-105 CSS Project History & Background Funded by Caltrans Sustainable
I-105 Corridor Sustainability Study (CSS) Metro Streets and Freeways Subcommittee March 21, 2019 Gary Hamrick Cambridge Systematics, Inc. I-105 CSS Project History & Background Funded by Caltrans Sustainable
Circulation in Elk Grove includes: Motor vehicles, including cars and trucks
 Circulation, as it is used in this General Plan, refers to the many ways people and goods move from place to place in Elk Grove and the region. Circulation in Elk Grove includes: Motor vehicles, including
Chapter 7. Transportation. Transportation Road Network Plan Transit Cyclists Pedestrians Multi-Use and Equestrian Trails
 Chapter 7 Transportation Transportation Road Network Plan Transit Cyclists Pedestrians Multi-Use and Equestrian Trails 7.1 TRANSPORTATION BACKGROUND The District of Maple Ridge faces a number of unique
Roads that are intended to be included in the VDOT system of maintained roadways must meet the standards and specifications prescribed by the VDOT.
 SECTION 1 - GENERAL 1-1 Purpose This Manual has been prepared to promote uniform design procedures for designers and technicians in the development of property and roads in the County of Henrico, Virginia.
PennDOT Access Management Model Ordinances Training
 PennDOT Access s Training Trainers: Chad Dixson, AICP, TPD Angela Watson, PB Objective of Today Assist Pennsylvania s municipalities and transportation professionals in better understanding the benefits
BIKE & PEDESTRIAN IMPLEMENTATION GUIDE FOR LOCALITY INVOLVEMENT. November 2006
 BIKE & PEDESTRIAN IMPLEMENTATION GUIDE FOR LOCALITY INVOLVEMENT November 2006 1 of 9 TABLE OF CONTENTS Topic Page(s) Encouraging development of Bike and pedestrian plans by localities 3 5 Involving localities
Route 28 (South Orleans Road)/Route 39 (Harwich Road)/Quanset Road Intersection
/Route 39 (Harwich Road)/Quanset Road Intersection") TRAFFIC FEASIBILITY STUDY Route 28 (South Orleans Road)/Route 39 (Harwich Road)/Quanset Road Intersection Orleans, Massachusetts Prepared for: Town of Orleans Prepared by: Fay, Spofford & Thorndike, LLC
TRAFFIC FEASIBILITY STUDY Route 28 (South Orleans Road)/Route 39 (Harwich Road)/Quanset Road Intersection Orleans, Massachusetts Prepared for: Town of Orleans Prepared by: Fay, Spofford & Thorndike, LLC
5. RUNNINGWAY GUIDELINES
 5. RUNNINGWAY GUIDELINES These guidelines should be considered collectively when making runningway decisions. A runningway is the linear component of the transit system that forms the right-of-way reserved
ADA Transition Plan. City of Gainesville FY19-FY28. Date: November 5, Prepared by: City Of Gainesville Department of Mobility
 ADA Transition Plan FY19-FY28 Date: November 5, 2018 Prepared by: City Of Gainesville Department of Mobility 1.0 INTRODUCTION 1.1 BACKGROUND The federal statute known as the Americans with Disabilities
NEIGHBORHOOD TRAFFIC CALMING POLICY
 NEIGHBORHOOD TRAFFIC CALMING POLICY I. PURPOSE The City of Kent continually strives to strengthen and protect its neighborhoods by improving the quality of life in residential areas. Traffic conditions
TOWN OF CHAPEL HILL POLICY AND PROCEDURES FOR TRAFFIC CALMING MEASURES
 TOWN OF CHAPEL HILL POLICY AND PROCEDURES FOR TRAFFIC CALMING MEASURES (Adopted by the Town Council on June 30, 2004) (Revised December 6, 2010) (Revised February 8, 2016) POLICY AND PROCEDURES FOR TRAFFIC
TRAFFIC IMPACT STUDY CRITERIA
 Chapter 6 - TRAFFIC IMPACT STUDY CRITERIA 6.1 GENERAL PROVISIONS 6.1.1. Purpose: The purpose of this document is to outline a standard format for preparing a traffic impact study in the City of Steamboat
Transportation Master Plan Advisory Task Force
 Transportation Master Plan Advisory Task Force Network Alternatives & Phasing Strategy February 2016 BACKGROUND Table of Contents BACKGROUND Purpose & Introduction 2 Linking the TMP to Key Council Approved
City of Elizabeth City Neighborhood Traffic Calming Policy and Guidelines
 City of Elizabeth City Neighborhood Traffic Calming Policy and Guidelines I. Purpose: The City of Elizabeth City is committed to ensure the overall safety and livability of residential neighborhoods. One
Tonight is an opportunity to learn about the Study and ask questions of the Study Team members.
 Exhibit 1 Welcome Second Open House Tonight is an opportunity to learn about the Study and ask questions of the Study Team members. A first Public Open House was held on September 18th, 2013 which presented
Classification Criteria
 SCHEDULE D TO RECOMMENDED OFFICIAL PLAN AMENDMENT NO. 40 SCHEDULE C-4 Road Criteria Criteria Traffic Service Objective Land Service/Access Typical Daily Traffic Volume Flow characteristics Travel Speed
Waterford Lakes Small Area Study
 Waterford Lakes Small Area Study Existing Traffic Conditions PREPARED FOR: ORANGE COUNTY PUBLIC WORKS DEPARTMENT TRAFFIC ENGINEERING DIVISION ORLANDO, FLORIDA PREPARED WITH: INWOOD CONSULTING ENGINEERS
REVIEW OF LOCAL TRAFFIC FLOW / LONG RANGE PLANNING SOLUTIONS STUDY
 ITEM Town of Atherton TRANSPORTATION COMMITTEE STAFF REPORT TO: FROM: MEMBERS OF THE COMMITTEE ROBERT OVADIA, PUBLIC WORKS DIRECTOR DATE: FEBRUARY 12, 2019 SUBJECT: REVIEW OF LOCAL TRAFFIC FLOW / LONG
Bicycle Master Plan Goals, Strategies, and Policies
 Bicycle Master Plan Goals, Strategies, and Policies Mobilizing 5 This chapter outlines the overarching goals, action statements, and action items Long Beach will take in order to achieve its vision of
ADOT Statewide Bicycle and Pedestrian Program Summary of Phase IV Activities APPENDIX B PEDESTRIAN DEMAND INDEX
 ADOT Statewide Bicycle and Pedestrian Program Summary of Activities APPENDIX B PEDESTRIAN DEMAND INDEX May 24, 2009 Pedestrian Demand Index for State Highway Facilities Revised: May 29, 2007 Introduction
Glenn Avenue Corridor Traffic Operational Evaluation
 Glenn Avenue Corridor Traffic Operational Evaluation PREPARED FOR: THE CITY OF AUBURN PREPARED BY: DECEMBER 2007 Glenn Avenue Corridor Study--Auburn, Alabama TABLE OF CONTENTS Introduction... 1 Background
Appendix D: Concept Screening
 Concept Description Concept #1 Route 288 Roadway Widening This concept consists of constructing a third lane on northbound and southbound Route 288 between Powhite Parkway and US 360. This improvement
DEPARTMENT OF ENVIRONMENTAL SERVICES. North Harrison Street (Lee Highway to Little Falls Road) Comparative Analysis. Prepared for:
 Comparative Analysis. Prepared for:") DEPARTMENT OF ENVIRONMENTAL SERVICES North Harrison Street (Lee Highway to Little Falls Road) Comparative Analysis Prepared for: Arlington County Department of Environmental Services 2100 Clarendon Boulevard,
DEPARTMENT OF ENVIRONMENTAL SERVICES North Harrison Street (Lee Highway to Little Falls Road) Comparative Analysis Prepared for: Arlington County Department of Environmental Services 2100 Clarendon Boulevard,
Chapter 6: Transportation
 Chapter 6: Transportation I. INTRODUCTION The purpose of the Transportation Plan element of the Comprehensive Plan is to provide guidance to the City of North Mankato, as well as existing and future landowners
TRAFFIC IMPACT ANALYSIS
 TRAFFIC IMPACT ANALYSIS FOR THE CHAMPAIGN UNIT#4 SCHOOL DISTRICT PROPOSED HIGH SCHOOL (SPALDING PARK SITE) IN THE CITY OF CHAMPAIGN Final Report Champaign Urbana Urbanized Area Transportation Study 6/24/2014
Closing Plenary Session
 TRAFFIC SAFETY CONFERENCE Closing Plenary Session June 9, 2017 Las Colinas, TX Order of Report Out June 9, 2017 Las Colinas, TX Distracted Driving Prioritized Countermeasures Countermeasure 4a Systemically
Borough of Danville, PA Traffic Calming Program Guidelines
 Borough of Danville, PA Traffic Calming Program Guidelines Adopted by Borough Council on 1 INTRODUCTION Speeding Traffic is a major concern in the Borough of Danville because of its detrimental impacts
Summary: Mercer County Princeton Avenue & Spruce Street Study January 2009
 Summary: Several recent studies have assessed potential development and redevelopment opportunities in the Mercer Crossing area of Trenton, Ewing, and Lawrence. This Princeton Avenue and Spruce Street
Complete Street Analysis of a Road Diet: Orange Grove Boulevard, Pasadena, CA
 Complete Street Analysis of a Road Diet: Orange Grove Boulevard, Pasadena, CA Aaron Elias, Bill Cisco Abstract As part of evaluating the feasibility of a road diet on Orange Grove Boulevard in Pasadena,
Executive Summary Route 30 Corridor Master Plan
 Route Corridor Master Plan Project Overview The Route Corridor Master Plan is a coordinated multimodal transportation and land use plan for the entire stretch of Route through East Whiteland Township,
4.0 TRAFFIC IMPACT STUDIES
 SECTION 4 4.0 TRAFFIC IMPACT STUDIES 4.1 TRAFFIC IMPACT STUDY REQUIREMENTS The City has established Traffic Impact Study (TIS) requirements for the purpose of ensuring that both the quantitative and qualitative