Occ c u c pa p n a t pro r t O ec e t c i t O i n
|
|
|
- Dorthy Rodgers
- 5 years ago
- Views:
Transcription
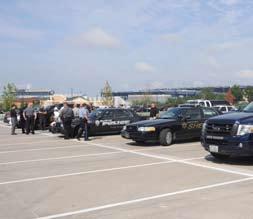


1 Occupant Protection
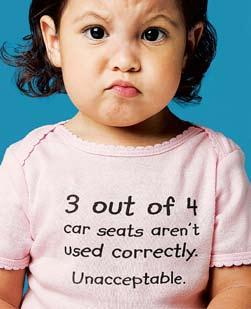
2 Occupant Protection Introduction Buckling up or being buckled in is the most effective protection during a car crash. The simple truth is that the great majority of people ejected from a motor vehicle die. The U.S. Department of Transportation s National Highway Traffic Safety Administration, or NHTSA, estimates that lap/shoulder seat belts, used correctly, reduce fatal injuries to front-seat passenger car occupants by 45 percent and moderate-to-critical injuries by 50 percent. See 2006 Motor Vehicle Protection--Facts for details. For light-truck occupants, the protection s better: Seat belts reduce the risk of fatal injury by 60 percent and moderate-to-critical injury by 65 percent. The greatest benefit, though, is for infants under age 1. Child safety seats reduce their fatalities by 71 percent. For toddlers ages 1 to 4 in passenger cars, the reduction is 54 percent. For infants and toddlers in light trucks, the reductions are 58 percent and 59 percent, respectively. Kansas law requires children under age 4 to ride in these seats. When children reach the weight or height limits of their infant-only seat, they should be changed to a convertible seat and remain rear-facing until they reach the weight or height limits of that seat. At that point, they should be placed in a forwardfacing seat and secured by a full harness until they reach the weight or height limits of that seat. Children ages 4 to 8 must be in a child safety seat or booster seat until they weigh more than 80 pounds or are taller than 4 9 ; at that point a seat belt is mandatory. Children ages 8 to 13 must wear a seat belt. All passengers and drivers 14 or older are required to use seat belts. Data released by KDOT in 2010 showed that four in five front seat occupants were using seat belts, an increase of about 5 percent from the year before. We remain concerned, however, about the vulnerability of the one in five who still don t buckle up. The good news in child passenger safety is that a majority of parents buckle up their children in car seats, booster seats, or seat belts. However, according to NHTSA, approximately 3 out of 4 car seats are not used properly, which is a tremendous risk when traveling. The purpose of the occupant protection emphasis area team is to develop data-driven action plans that encourage drivers and passengers to wear seat belts at all times. Data in this chapter apply only to vehicles covered under Kansas seat belt laws; this would exclude, for example, data related to bicycles and motorcycles. The occupant protection team is developing performance measures, setting objectives, selecting strategies and identifying resources needed, including funding, legislation, staff and lead agencies. Implementing the strategies will require various combinations of the 4E s: engineering, education, enforcement and emergency management. The outcome sought by the occupant protection emphasis area team is the implementation of the SHSP through safety-related programs and projects. Implementation may depend on policy changes, media attention, education and awareness campaigns, enforcement mobilization and programs aimed at low seat-belt-use groups. Some efforts will be statewide; others will target geographic areas with low rates of seat belt use. Strategic Highway Safety Plan July 1,


 Kansas Highway")
 AAA of")
 Safe Kids Kansas Kansas Traffic")


3 Members of the emphasis area team, representing the following groups, first met on September 18, 2009: Kansas Department of Transportation (KDOT) National Highway Traffic Safety Administration (NHTSA) Kansas Highway Patrol (KHP) Kansas Department of Health and Environment (KDHE) AAA of Kansas Mid-America Regional Council (MARC) Safe Kids Kansas Kansas Traffic Safety Resource Office (KTSRO) Parsons Brinckerhoff Department of Transportation N HTSA NATIONAL HIGHWAY TRAFFIC SAFETY ADMINISTRATION July 1, Strategic Highway Safety Plan
 weren t wearing seatbelts. 1.9 1.8 1.7 1.6 1.5 1.4 1.3 1.2 1.")
4 Data Points 1. Buckle them in, then buckle up. Save lives. In crashes, fatalities fall when drivers and riders buckle up. Of every 10 adults who died in Kansas crashes from 2004 to 2009, 60 to 70 percent (depending on the year) weren t wearing seatbelts Kansas Fatality Rate and Seat Belt Use % 77% 77% % % 69% % % 61% 64% % 80% 70% 60% 50% 40% 30% Fatality Rate Seat Belt Rate In the latest reporting year, there were 1.31 fatalities for every 100 million vehicle miles traveled. As the rate of seat belt use increases, fatalities fall. Strategic Highway Safety Plan July 1,


5 2. At highest risk: the young. Not wearing seat belts is especially hazardous for riders and drivers under age Unbelted Fatalities vs. Total Fatalities by Age Group ( ) Unbelted Fatalities Total Fatalities Those ages 16 to 20 are at highest risk of death or serious injury from failing to buckle up. People 25 to 34 are the second most vulnerable group. July 1, Strategic Highway Safety Plan


6 3. More Kansans are keeping themselves and their kids safe. Kansas still falls below the national average in terms of adult use of seat belts, but the state gained ground between 2000 and And Kansans are increasingly buckling their children into safety seats or getting them to buckle up. 100% 90% 80% 70% 60% 50% 40% 71% 73% 75% 61% 60% 61% Adult Seat Belt Rate 79% 80% 82% 81% 82% 83% 84% 75% 77% 77% 72% 68% 69% 64% 30% National Kansas In 2009, Kansas ranked 43rd in the nation in terms of seat belt use -- but was closing the gap relative to the national average. 100% 90% 80% 70% 60% 50% 40% 30% 20% Child vs. Adult Seat Belt Use 85% 81% 73% 75% 75% 77% 77% 66% 68% 69% 68% 65% 62% 64% Child Restraint Use (average across 3 age groups) Adult Seat Belt Use The first year that child restraint use equaled adult seat belt use was Now child restraint use surpasses adult seat belt use. Strategic Highway Safety Plan July 1,


7 4. Yet as children become teenagers, their seat belt use drops. 100% 90% 80% 70% 60% 50% 40% 30% 20% 10% 0% Child Restraint Use by Year and Age Group 93% 96% 88% 79% 81% 81% 83% 62% 53% 55% 50% 50% 49% 45% 47% 48% 44% 69% 73% 63% 61% Age 0-4 Age 5-9 Age From 2004 to 2009, the percentage gains in seat belt use among children were greatest among children under 10. But use of restraints falls off sharply between the toddler and teenage years: from 96 percent to 61 percent in It should be noted that the child observational survey only measures whether the children were restrained. It does not show whether the restraints are correctly installed, or whether the type of restraint is appropriate for the age and size of the child. Kansas Department of Transportation July 1, Strategic Highway Safety Plan

8 5. Still, on every type of road, more people are using seat belts. Seat Belt Survey Seat Belt Rate 68% 69% 72% 75% 77% 77% Seat Belt Use by Road Type Rural Interstate 80% 76% 83% 83% 89% 89% Rural State Roads 69% 68% 71% 72% 76% 75% Rural County Roads 59% 56% 57% 63% 66% 66% Urban Interstate 74% 75% 84% 86% 84% 82% Urban State Roads 65% 64% 69% 68% 76% 76% Urban City Streets 60% 58% 57% 59% 70% 69% Child Restraint Use % 81% 83% 88% 93% 96% % 49% 53% 62% 69% 73% % 47% 48% 55% 63% 61% Seat Belt Use by Fatality Victims 34% 30% 40% 39% 30% 30% Seat belt surveys are conducted by trained observers. They occur in a representative sample of Kansas counties, based on population. Among the findings: People are most likely to buckle up on interstates, least likely on rural county roads or urban city streets. Yet between 2004 and 2009, seat belt use increased on each of the six classes of roads in Kansas. See for more details. Strategic Highway Safety Plan July 1,

9 Performance Measures The goal of the occupant protection emphasis area team is to halve motor vehicle fatalities and serious injuries within 20 years by increasing the use of safety restraints. Interim goals will help us measure our progress along the way. By doing so, we can adjust our strategies if they re not having the desired effect. An annual survey in Kansas is conducted by trained observers to monitor vehicles and record seat belt use. Between 2005 and 2009, the average annual observed seat belt use was 75 percent. Our goal is to increase the five-year average to 80 percent by 2012 and to 86 percent by Statistics support that success in increasing proper seat belt use would naturally decrease the number of fatalities. July 1, Strategic Highway Safety Plan
10 Goals and Strategies The occupant protection team has chosen six goals as the focus of its efforts. It seeks to 1. Influence policymakers to pass laws that increase seat belt use 2. Create data-driven safety programs that promote, through media, education and law enforcement, the use of restraints by everyone 3. Collaborate with state and local partners to promote a consistent message regarding restraint use 4. Develop tactics to get all law enforcement officers to buckle up 5. Provide resources and support for efforts to enforce occupant protection laws 6. Use data to target areas of Kansas where restraint use is low The challenge is to identify the strategies, or combination of strategies, with the greatest impact on the behavior of drivers and passengers. Goal 1: Influence policymakers to pass laws that increase seat belt use in Kansas Current Strategy: Utilize KDOT staff and its safety partners to garner grassroots support, testify before the Kansas Legislature and provide information to the media on the benefits of strong safety restraint laws New Strategies: Focus policy efforts on passing a seat belt law that requires primary enforcement in all seating positions Background: Data from other states and the National Highway Traffic Safety Administration show that requiring seat belt use by everyone has a stronger effect on changing seat-belt-related behavior than requiring restraints only for minors and frontseat occupants. Method: legislation Costs: minimal Lead agency and contact: KDOT, Traffic Safety Section Challenges: generating legislative support for expanding required seat belt use Target date: by the end of the 2013 legislative session Focus policy efforts on increasing the fine for a seat belt violation to $60 Background: Data from other states and NHTSA show that a substantial fine for seat belt violations has more effect than a small fine. Method: legislation Costs: minimal Lead agency and contact: KDOT, Traffic Safety Section Challenges: legislative support Target date: by the end of the 2013 legislative session Strategic Highway Safety Plan July 1,

11 Conduct study to determine comparative post-crash costs of hospitalization for belted and unbelted occupants Background: Studies in other states show much higher medical costs for individuals in crashes who are not wearing seat belts, compared with those who are. The findings of a Kansas study could be presented to the Legislature. Method: research Costs: $250,000 (estimated) Lead agency and contact: KDHE, Kansas Trauma Program Challenges: data access Target date: December 2013 July 1, Strategic Highway Safety Plan


12 Goal 2: Create data-driven safety programs that promote, through media, education and law enforcement, the use of restraints by everyone Current Strategies: Continue Click It or Ticket (CIOT) media/enforcement campaign Research methods for retaining and recertifying law enforcement personnel trained in child passenger safety Support continuing education opportunities for such personnel and their instructors New Strategies: Expand Seatbelts Are For Everyone, or SAFE, program Background: The SAFE program, launched in 2008 in Crawford County in six schools, led to impressive increases in seat belt usage. It was successfully expanded to Cowley, Wyandotte, Montgomery and Neosho Counties in As of June 2011, it has expanded to 29 counties and 95 schools while another eight counties have expressed interest in the program. Groups such as AAA, State Farm, KDHE Regional Trauma Programs and local communities have all supported the program. To date, at all participating schools there has been a combined increase of 14 percent in seatbelt usage. An annual 20-county seatbelt survey also indicates that there has been a large jump in most of the counties where SAFE has been implemented. Method: program Costs: $85,000 to date (estimate) Performance measures: Maintain the SAFE program in schools now using it In the short run, establish SAFE in every county within the jurisdiction of KHP Troop B (NE Kansas) and Troop H (SE Kansas) In the long run, establish SAFE in every Kansas County Lead agency and contact: Kansas Traffic Safety Resource Office Strategic Highway Safety Plan July 1,


13 Challenges: Curricular requirements leave schools little time to sponsor new programs. It is difficult to start the program in large school districts. Where there is limited involvement from law enforcement the program is not as effective. Target date: June 2012 (short term) Expand use of non-traditional media (social networking sites, internet, games) to promote CIOT message Background: KDOT uses Twitter, Facebook and YouTube to reach target audiences. It s also studying the possibility of using on-line gaming sites to promote CIOT. Method: program Costs: $35,000 (estimated) Performance measure: number of impressions (views) by target audience Lead agency and contact: KDOT, Traffic Safety Section Challenges: finding cost-effective ways to use nontraditional media to reach the target audience in their particular internet community Target date: ongoing July 1, Strategic Highway Safety Plan

14 Future Strategies: Provide model transportation policies to groups like churches, day-care agencies and schools that regularly transport children Promote employer buckle-up programs Promote teen-driven community surveys and presentations in coordination with local events Strategic Highway Safety Plan July 1,


 Performance measure: percentage of respondents aware of seat belt laws and programs before and")
 Reach out to school resource officers and school nurses in order to provide seat belt")

15 Goal 3: Collaborate with state and local partners to promote a consistent message regarding restraint use Current Strategies: Continue funding support for a Kansas representative on the National Child Passenger Safety Board Promote such curricula as Boosters to Belts and Safety Breaks New Strategies: Survey attitudes about and knowledge of seat belt laws annually and use the results in public education efforts Background: NHTSA and the Governors Highway Safety Association agree that a survey of this type would be a cost-effective, informative way of targeting our safety messages. Method: research Costs: $22,000/year (estimated) Performance measure: percentage of respondents aware of seat belt laws and programs before and after the education programs Lead agency and contact: KDOT, Traffic Safety Section Challenges: designing a scientific survey that produces accurate and credible results Target date: September (annually) Reach out to school resource officers and school nurses in order to provide seat belt education and information to students Background: The earlier a child wears a seat belt, the more likely he or she is to continue and influence others to do so. Method: program Costs: minimal Performance measure: number of students reached Lead agencies: Kansas Traffic Safety Resource Office Challenges: existing curricular requirements leave little time for new programs Target date: Academic year 2011/2012 July 1, Strategic Highway Safety Plan


16 Develop partnerships with the medical and faith communities to promote occupant protection strategies to senior citizens and minority group members Background: Research indicates that when communicating messages to some demographic groups with the goal of changing behavior, it helps to team with organizations or leaders trusted by the groups. Method: project Costs: minimal Performance measure: the number of group members reached Lead agency and contact: Kansas Traffic Safety Resource Office Challenges: Identifying leaders within these communities to promote partnering Target date: 2012 Strategic Highway Safety Plan July 1,

17 Goal 4: Develop tactics to get all law enforcement officers to use seat belts Current Strategy: Continue presentations on occupant protection at the KDOT Traffic Safety Conference and Special Traffic Enforcement Program luncheon New Strategy: Require all agencies that receive KDOT grants to have an enforceable seat belt usage policy Background: Those who receive KDOT grants are more likely to promote seat belt use, and officers who obey the law are more likely to enforce it than those who don t. Method: policy Costs: none Lead agency and contact: KDOT, Traffic Safety Section Challenges: law enforcement agency resistance to the seat belt law in some regions of Kansas Target date: December 2011 July 1, Strategic Highway Safety Plan


18 Goal 5: Provide funding and other forms of support for law enforcement efforts to uphold occupant protection laws. Current Strategies: Support child passenger safety training and certification for law enforcement agencies Provide grants to pay for equipment and overtime related to the conduct of seat belt enforcement activities New Strategies: Support Traffic Occupant Protection Strategies training Background: Law enforcement officers are more likely to enforce occupant protection laws if they are trained in the importance of using safety restraints at every stage of life. Method: program Costs: $10,000 (estimate) Lead agency and contact: KDOT, Traffic Safety Section, Law Enforcement Liaisons Challenges: scheduling time for officers to attend training Target date: 2012 Establish Chief s Challenge awards for enforcement of occupant protection laws Background: Recognizing officers efforts energizes them and reinforces the importance of occupant protection. Method: program Costs: $10,000 (estimate) Performance measure: the number of agencies that participate Lead agency and contact: AAA Kansas Challenges: creating and organizing the program Target date: 2012 Pilot a program to enforce nighttime seat belt use Background: Data show that seat belt use decreases at night, a time when more impaired drivers are also on the road. Method: program Costs: $10,000 (estimate) Performance measure: percent increase in seatbelt usage at night Lead agency and contact: KDOT, Traffic Safety Section, Law Enforcement Liaisons Challenges: spotting unbelted drivers and passengers at night Target date: 2012 Strategic Highway Safety Plan July 1,


19 Goal 6: Use data to target areas in Kansas where restraint use is low Current Strategies: Continue support for local child passenger safety inspection stations and provision of safety seats for low-income families Continue observational surveys conforming to NHTSTA standards New Strategies: Increase enforcement efforts in traffic corridors with low rates of seat belt use Background: Extra enforcement efforts often increase seat belt use. Method: project Costs: minimal Performance measure: increased use of seat belts in target areas Lead agency and contact: KDOT, Traffic Safety Section, Law Enforcement Liaisons Challenges: lack of law enforcement officers to staff the effort Target date: 2011 Use billboards to communicate messages in parts of Kansas with low rates of seat belt use Background: Some regions of the state are served by few media. Method: policy Costs: $100,000 (estimate) Lead agency and contact: KDOT, Traffic Safety Section Challenges: lack of billboard space in some regions Target date: 2012 Target members of some minority groups for occupant protection education Background: Members of some minority groups use seat belts less frequently than members of other groups. Method: project (community needs assessment) Costs: minimal Performance measure: increased seat belt use Lead agency and contact: Kansas Traffic Safety Resource Office Challenges: determining the best message and media to reach these groups Target date: 2011 Future Strategies: Evaluate effectiveness of changes to the graduated driver s license law Evaluate effectiveness of primary seat belt law July 1, Strategic Highway Safety Plan
A Strategic Highway Safety Plan. a coordinated and informed approach to reducing highway fatalities and serious injuries on all public roads.
 Introduction A Strategic Highway Safety Plan is a coordinated and informed approach to reducing highway fatalities and serious injuries on all public roads. A Strategic Highway Safety Plan is Based on
Canadian Association of Chiefs of Police Association canadienne des chefs de police
 WHAT S IN THE KIT? Media Advisory Template To be used to invite the media to an event during Operation Impact. We suggest you reproduce this on your own police agency letterhead. News Release Template
Toward Zero Deaths: Proactive Steps for Your Community
 Est. Dec. 2014 Toward Zero Deaths: Proactive Steps for Your Community Presented by: Brian Roberts, P.E., National Association of County Engineers Marie Walsh, Ph.D., Louisiana Local Technical Assistance
CDRT. Child Death Review Team Dallas County. Brief Report Traffic-related Child Deaths OVERVIEW
 Dallas County CDRT Child Death Review Team 2013 Brief Report Traffic-related Child Deaths 2006-2011 OVERVIEW In Dallas County, traffic-related injury death rates among children are typically less than
POLICY AGENDA For Elder Pedestrian Safety
 POLICY AGENDA For Elder Pedestrian Safety Older adults and people with disabilities often have mobility, cognitive, and sensory limitations that affect their behavior as pedestrians and place them at risk
NEW JERSEY LAW ENFORCEMENT LIAISON NEWSLETTER
 NEW JERSEY LAW ENFORCEMENT LIAISON NEWSLETTER SEPTEMBER 2017/12 WWW.NJSACOP.ORG DRIVE SOBER OR GET PULLED OVER NJ DIVISION OF HIGHWAY TRAFFIC SAFETY The mission of the Division of Highway Traffic Safety
November 2, Government takes on the challenge of improving traffic safety
 November 2, 2006 Government takes on the challenge of improving traffic safety Edmonton... The Alberta government has taken on the challenge of improving traffic safety by moving ahead with a comprehensive,
Mission: The mission of FARS is to make vehicle crash information accessible and useful so that traffic safety can be improved
 Mission: The mission of FARS is to make vehicle crash information accessible and useful so that traffic safety can be improved NHTSA created FARS in 1975 National Center for Statistics and Analysis (NCSA)
TEXAS TRAFFIC SAFETY TASK FORCE. Jeff Moseley Texas Transportation Commission
 TEXAS TRAFFIC SAFETY TASK FORCE Jeff Moseley Texas Transportation Commission June 7, 2016 Fatalities and fatal crashes 2010 2015 4,000 3,500 3,417 3,407 3,536 3,533 3,000 3,061 3,067 2,782 2,803 3,037
ROAD SAFETY IN RUSSIA
 ROAD SAFETY IN RUSSIA United Nations Road Safety Collaboration First Deputy Minister of Internal Affairs of the Russian Federation A.V. Gorovoy New York, 12 April 2018 Russia supports the global road safety
INFORMATION TOOL KIT
 CANADA ROAD SAFETY WEEK 2017 INFORMATION TOOL KIT Thank you for being involved in Canada Road Safety Week. With your participation, we can spread the word about this special week and why it is an important
Street Smart - Regional Pedestrian Safety Campaign. Hopkins Grand Rounds July 16, 2014
 Street Smart - Regional Pedestrian Safety Campaign Hopkins Grand Rounds July 16, 2014 Baltimore Metropolitan Council (BMC) Who We Are The organization of the Baltimore region s elected executives, representing
Alberta. Traffic Collision Statistics. Office of Traffic Safety Transportation Services Division May 2017
 Traffic Collision Statistics Office of Traffic Safety Transportation Services Division May 217 This page was intentionally left blank. 2 Table of Contents Traffic Collisions... 4 Traffic Collision Rates...
Background: Introduction:
 Background: Iowa s 2014 Child Passenger Safety Survey Project Conducted by the University of Iowa Injury Prevention Research Center Under contract to Iowa Governor s Traffic Safety Bureau Since 1985, Iowa
Protecting our Children and Youth. The Life Saving Benefits of Child Safety Seats, Boosters, and Seat Belts
 Protecting our Children and Youth The Life Saving Benefits of Child Safety Seats, Boosters, and Seat Belts The Problem Motor vehicle crashes are the leading cause of death among children ages 3 and over.
Iowa Child Passenger Safety Survey 2016
 Iowa Child Passenger Safety Survey 2016 Conducted by the University of Iowa Injury Prevention Research Center Under contract to Iowa Governor s Traffic Safety Bureau Background Since 1985, Iowa has had
FLORIDA TRANSPORTATION COMMISSION HIGHWAY SAFETY REPORT CALENDAR YEAR 2008
 FLORIDA TRANSPORTATION COMMISSION HIGHWAY SAFETY REPORT CALENDAR YEAR 2008 January 15, 2010 HIGHWAY SAFETY REPORT FOR CALENDAR YEAR 2008 January 15, 2010 2 TABLE OF CONTENTS INTRODUCTION 5 STRATEGIC HIGHWAY
Louisiana Traffic Records Data Report 2017
 Louisiana Traffic Records Data Report 2017 crashdata.lsu.edu Dr. Helmut Schneider September 2018 Overview Trends in crashes, fatalities & injuries Findings from the Occupant Protection Survey of 2018 Driving
BIA INDIAN HIGHWAY SAFETY PROGRAM FY2016 LAW ENFORCEMENT OVERTIME GRANT
 SECTION A: General Information. This section must be completed for all applicants. Name of Tribe: Click here to enter text. Address : Click here to enter text. City: Click here to enter text. State: Click
ROAD SAFETY ANNUAL REPORT 2018 ISRAEL
 ROAD SAFETY ANNUAL REPORT 2018 ISRAEL ISRAEL Israel recorded 321 road fatalities in 2017, representing a 3.9% decrease when compared to 2016. The mortality rate is 3.6 deaths per 100 000 population. Since
2003 road trauma for. Wairoa District. Road casualties Estimated social cost of crashes* Major road safety issues WAIROA DISTRICT JULY 2004
 WAIROA DISTRICT JULY 24 T he Land Transport Safety Authority (LTSA) has prepared this road safety issues report. It is based on reported crash data and trends for the 1999 23 period. The intent of the
EVERY MOVE YOU MAKE. everymove.ohio.gov OHIO STRATEGIC HIGHWAY SAFETY PLAN
 EVERY MOVE YOU MAKE everymove.ohio.gov OHIO STRATEGIC HIGHWAY SAFETY PLAN A Comprehensive Plan to Reduce Fatalities and Serious Injuries 2014-2019 TABLE OF CONTENTS 1 Partner Pledge 2 Thank You to Our
Pedestrian-Bicycle Emphasis Area Breakout Session. Highway Safety Summit April 26, 2016
 5/20/2016 Pedestrian-Bicycle Emphasis Area Breakout Session Highway Safety Summit April 26, 2016 Fatality and Serious Injury Averages (2008-2013) by Emphasis Area Where We ve Been: February 2014 Highway
EMS professionals face many risks exposure to infectious diseases, violence, hazardous scenes, and oncoming traffic, to name a few.
 EMS professionals face many risks exposure to infectious diseases, violence, hazardous scenes, and oncoming traffic, to name a few. However, none of these risks compares to the potential for death and
Lane Area Transportation Safety and Security Plan Vulnerable Users Focus Group
 Lane Area Transportation Safety and Security Plan Vulnerable Users Focus Group Agenda 1. Planning Process Review 2. What are Emphasis Areas? 3. Your Role Today 4. Data Review 5. Small group discussion
Toward Zero Deaths. Regional SHSP Road Show Meeting. Virginia Strategic Highway Safety Plan. presented by
 Toward Zero Deaths Regional SHSP Road Show Meeting presented by Virginia Strategic Highway Safety Plan December 1, 2016 1 Welcome & Introductions Purpose of the Meeting Objectives & Key Outcomes Agenda»
KANSAS STRATEGIC HIGHWAY SAFETY PLAN
 KANSAS STRATEGIC HIGHWAY SAFETY PLAN 214 Annual Dashboard Report Preliminary Statewide Fatality Analysis The accident data herein, as of February 19, 215, reflect the reporting officer s observations and
KANSAS STRATEGIC HIGHWAY SAFETY PLAN (SHSP) The stakeholder group identified the following direction for the SHSP:
 The stakeholder group identified the following direction for the SHSP:") KANSAS STRATEGIC HIGHWAY SAFETY PLAN (SHSP) Executive Summary On February 2-3, 2006, the Kansas Department of Transportation hosted a safety summit to initiate the development of the Kansas Strategic Highway
KANSAS STRATEGIC HIGHWAY SAFETY PLAN (SHSP) Executive Summary On February 2-3, 2006, the Kansas Department of Transportation hosted a safety summit to initiate the development of the Kansas Strategic Highway
Figure 1. Indiana fatal collisions by young driver involvement,
 INDIANA TRAFFIC SAFETY FACTS YOUNG DRIVERS 2016 MAY 2017 ISSUE 17-C06 IN 2016: In 2016, 13.4 percent of all drivers involved in Indiana collisions were young drivers. Young drivers were involved in 105
road safety issues 2002 road trauma for Tauranga District July 2003 Regional crash causes Estimated social cost of crashes*
 road safety issues July 23 22 road trauma for Tauranga District The Land Transport Safety Authority (LTSA) has prepared this road safety issues report. It is based on reported crash data and trends for
Alabama Observational Survey of Occupant and Child Restraint Use 2010
 Alabama Observational Survey of Occupant and Child Restraint Use 21 Contact Information: Alabama Department of Public Health Bureau of Health Promotion & Chronic Disease Injury Prevention Branch RSA Tower,
1998 SURVEY OF FRONT SEAT OCCUPANT RESTRAINT USE IN EIGHTEEN TEXAS CITIES. by Katie N. Womack. October 1998
 1998 SURVEY OF FRONT SEAT OCCUPANT RESTRAINT USE IN EIGHTEEN TEXAS CITIES by Katie N. Womack October 1998 This report was prepared in cooperation with the Traffic Operations Division Texas Department of
Kansas Department of Transportation Strategic Highway Safety Plan. Intersections
 Kansas Department of Transportation Strategic Highway Safety Plan Intersections Introduction The Federal Highway Administration (FHWA) defines an intersection as a planned point of conflict in the roadway
Partners for Child Passenger Safety Fact and Trend Report October 2006
 Partners for Child Passenger Safety Fact and Trend Report October In this report: Background: Child Restraint Laws in PCPS States Page 3 Restraint Use and Seating Page 3 Vehicles Page People and Injuries
APPENDIX F. Safety Planning. October 2018
 APPENDIX F Safety Planning October 2018 APPENDIX F: SAFETY PLANNING October 17, 2018 ABOUT VISUALIZE 2045 & THE TPB Visualize 2045 is the federally required long-range transportation plan for the National
AAA ON THE ISSUES
 AAA ON THE ISSUES 2 0 1 7 TABLE OF CONTENTS Introduction About AAA Traffic Safety Distracted Driving Impaired Driving Occupant Protection Steer It, Clear It Automated Enforcement Infrastructure Autonomous
NEW JERSEY LAW ENFORCEMENT LIAISON NEWSLETTER
 NEW JERSEY LAW ENFORCEMENT LIAISON NEWSLETTER JULY 2017/10 WWW..ORG NJ DIVISION OF HIGHWAY TRAFFIC SAFETY DRIVE SOBER OR GET PULLED OVER 2017 MOBILIZATION The mission of the Division of Highway Traffic
BIA INDIAN HIGHWAY SAFETY PROGRAM FY2016 LAW ENFORCEMENT GRANT. SECTION A: General Information. This section must be completed for all applicants.
 SECTION A: General Information. This section must be completed for all applicants. Name of Tribe: Click here to enter text. Address : Click here to enter text. City: Click here to enter text. State: Click
2014 QUICK FACTS ILLINOIS CRASH INFORMATION. Illinois Emergency Medical Services for Children February 2016 Edition
 2014 QUICK FACTS ILLINOIS CRASH INFORMATION February 2016 Edition Illinois Emergency Medical Services for Children www.luhs.org/emsc Illinois Emergency Medical Services for Children TABLE OF CONTENTS
Community Traffic Safety Awards Program 2017 Application
 EASY APPLICATION Community Traffic Safety Awards Program 2017 Application AAA Community Traffic Safety Awards are presented to communities for their efforts to improve local traffic safety for all modes
2012 QUICK FACTS ILLINOIS CRASH INFORMATION. Illinois Emergency Medical Services for Children September 2014 Edition
 2012 QUICK FACTS ILLINOIS CRASH INFORMATION September 2014 Edition Illinois Emergency Medical Services for Children www.luhs.org/emsc Illinois Emergency Medical Services for Children TABLE OF CONTENTS
Update on Bicycle Helmet Ordinance. Presented to the Quality of Life & Environment Committee May 12, 2014
 Update on Bicycle Helmet Ordinance Presented to the Quality of Life & Environment Committee May 12, 2014 Purpose On Monday, April 28 th, Quality of Life & Environment Committee members requested background
TOWARD ZERO DEATHS: A NATIONAL STRATEGY ON HIGHWAY SAFETY
 TOWARD ZERO DEATHS: A NATIONAL STRATEGY ON HIGHWAY SAFETY June 2014 Dear Highway Safety Stakeholder: As associations that represent government agencies with a professional role in highway safety, we are
HSIP Project Selection Criteria
 HSIP Project Selection Criteria The purpose of the Highway Safety Improvement Program (HSIP) is to reduce the number of fatal and injury crashes by targeting high crash locations and causes. Projects,
NYC Pedestrian Safety Study & Action Plan. NYTMC Brown Bag Lunch Presentation December 15, 2010
 NYC Pedestrian Safety Study & Action Plan NYTMC Brown Bag Lunch Presentation December 15, 2010 1 Introduction DOT Safety Goal Strategic Plan: Reduce Fatalities by 50% by 2030 From 274 (2007) to 137 (2030)
What is the problem? Transportation Safety Planning Purdue Road School. 42,636 Fatalities. Nearly 3M Injuries. Over 4M PDO crashes
 Transportation Safety Planning Purdue Road School March 29, 2006 What is the problem? 42,636 Fatalities Nearly 3M Injuries Over 4M PDO crashes $230B Cost to the Nation Trends in Motor Vehicle Fatality
NYC Pedestrian Safety Study & Action Plan. Research, Implementation & Safety Division of Traffic Operations
 NYC Pedestrian Safety Study & Action Plan Research, Implementation & Safety Division of Traffic Operations 1 Introduction DOT Safety GOAL Strategic Plan: Reduce Fatalities by 50% by 2030 From 274 (2007)
South Carolina s Strategic Highway Safety Plan
 Target Zero South Carolina s Strategic Highway Safety Plan 215-218 March 4, 215 Dear Highway Safety Partner: The South Carolina Department of Public Safety (SCDPS) and the South Carolina Department of
Road Safety Partnership
 Cambridgeshire and Peterborough Road Safety Partnership Cambridgeshire and Peterborough Road Safety Partnership Introduction Road accidents can have a devastating impact not only for the people directly
MTCF. Michigan Traffic Crash Facts FACT SHEETS
 FACT SHEETS This page left intentionally blank GENERAL FACTS The driver, the roadway, and the motor vehicle contribute in some measure to every crash. A preponderance of evidence, however, points to driver
Dear Fellow Nebraskans:
 Dear Fellow Nebraskans: In accordance with the provisions in the Safe, Accountable, Flexible, and Efficient Transportation Equity Act A Legacy for Users (SAFETEA LU), each state is required to develop
Traffic Safety Facts. State Traffic Data Data. Overview
 Traffic Safety Facts 2015 Data June 2017 DOT HS 812 412 State Traffic Data Key Findings Traffic fatalities increased by 7 percent from 2014 to 2015 (32,744 to 35,092) for the United States. The fatality
Western Bay of Plenty/ Tauranga Area
 ISSN 1176-841X July 5 Land Transport New Zealand has prepared this report. It is based on reported crash data and trends for the 4 period. The intent of the report is to highlight the key and provide partners
Safety and Active Transport. Dr. Maureen Carew, Medical Officer of Health Renfrew County and District Health Unit May 30, 2014
 Safety and Active Transport Dr. Maureen Carew, Medical Officer of Health Renfrew County and District Health Unit May 30, 2014 Active Transport Vision Increase levels of walking and cycling Reduce vehicle
This Workbook has been developed to help aid in organizing notes and references while working on the Traffic Safety Merit Badge Requirements.
 This Workbook has been developed to help aid in organizing notes and references while working on the Traffic Safety Merit Badge Requirements. Visit www.scoutmasterbucky.com for more information SCOUT S
We believe the following comments and suggestions can help the department meet those goals.
 The Honorable Secretary Anthony Foxx The Secretary of Transportation United States Department of Transportation 1200 New Jersey Avenue, SE Washington, DC 20590 August 30, 2013 Dear Secretary Foxx, Thank
Comprehensive Measures to Reduce Traffic Accident Fatalities
 Comprehensive Measures to Reduce Traffic Accident Fatalities Outcomes: 4,621 people died as a result of traffic accidents in 2015. It represents 4% decrease compared to 2014. Year 2012 2013 2014 2015 Traffic
Supporting Tasmania s Road Users
 Supporting Tasmania s Road Users A MAJORITY LIBERAL GOVERNMENT WILL: Grow the Learner Driver Mentor Program Remove barriers to acquiring a Provisional Drivers Licence Continue to fund the valuable RYDA
Lessons Learned from Traffic Culture Research in South Korea. Korea Transportation Safety Authority Sangeon SEO, Dongsoo KANG, Sunyoung PARK
 Lessons Learned from Traffic Culture Research in South Korea Korea Transportation Safety Authority Sangeon SEO, Dongsoo KANG, Sunyoung PARK CONTENTS Ⅰ. Traffic Fatalities and Efforts in Korea Ⅲ. Lessons
road safety issues 2001 road toll for Gisborne district July 2002 Road user casualties Estimated social cost of crashes*
 GISBORNE DISTRICT road safety issues July 22 The Land Transport Safety Authority (LTSA) has prepared this Road Safety Issues Report. It is based on reported crash data and trends for the 1997 21 period.
Minnesota Strategic Highway Safety Plan
 Minnesota Strategic Highway Safety Plan Executive Summary Minnesota s comprehensive and strategic safety planning process began in 2004, involved a cross-section of state, local and private safety partners
FLORIDA STRATEGIC HIGHWAY SAFETY PLAN
 FLORIDA STRATEGIC HIGHWAY SAFETY PLAN 1 FLORIDA STRATEGIC HIGHWAY SAFETY PLAN Presenter: Joe Santos State Safety Engineer FDOT State Safety Office 2 Presentation 3/28/2017 3 FLORIDA STRATEGIC HIGHWAY SAFETY
Civil Society. Dialogue for Progress
 By Madona Gasanova It took George, 15, about two years to rebuild his life aſter getting hit by a car on his way to school. He is lucky to still be alive; other people are not so lucky. In George's words,
A Critical Review of International Road Safety Databases
 A Critical Review of International Road Safety Databases George Yannis, Eleonora Papadimitriou, Katerina Folla National Technical University of Athens, Greece, Department of Transportation Planning and
Part 1 Road Transport
 Part 1 Road Transport Chapter 1 Road Traffic Accident Trends I Outline of Present Situation Title 1 Land Transport 1 Long-Term Transition of Road Traffic Accidents Traffic fatalities are reduced in 1 consecutive
MTCF. Michigan Traffic Crash Facts FACT SHEETS
 FACT SHEETS This page left intentionally blank GENERAL FACTS The driver, the roadway, and the motor vehicle contribute in some measure to every crash. A preponderance of evidence, however, points to driver
Napier City road trauma for Napier City. Road casualties Estimated social cost of crashes* Major road safety issues.
 ISSN 1176-841X July 25 Land Transport New Zealand has prepared this road safety issues report. It is based on reported crash data and trends for the 2 24 period. The intent of the report is to highlight
CHAPTER NINE SELECTED INDIANA LAWS
 CHAPTER NINE SELECTED INDIANA LAWS Child Safety Restraint Laws Motorcycle Helmet Laws Indiana Speed Limit Laws Indiana Safety Belt Laws Safety Belt Laws by State Indiana s Comparative Negligence Law Indiana
State of Kansas. Highway Safety Plan FFY Sam Brownback, Governor. Mike King, Secretary, Kansas Department of Transportation
 State of Kansas Highway Safety Plan FFY 2014 Sam Brownback, Governor Mike King, Secretary, Kansas Department of Transportation Chris Herrick, Director, KDOT Division of Planning and Development Mike Floberg,
Road Safety Annual Report 2016 OECD/ITF Chapter 26. Morocco
 Road Safety Annual Report 2016 OECD/ITF 2016 Chapter 26 Morocco This chapter presents 2014 road safety data for Morocco along with provisional data from 2015. It looks at trends in traffic and road safety
BIA INDIAN HIGHWAY SAFETY PROGRAM FY2016 TRAFFIC RECORDS GRANT. SECTION A: General Information. This section must be completed for all applicants.
 SECTION A: General Information. This section must be completed for all applicants. Name of Tribe: Click here to enter text. Address : Click here to enter text. City: Click here to enter text. State: Click
Vision Zero Richmond Action Plan
 Vision Zero Richmond Action Plan COVER Acknowledgements This Vision Zero Action Plan was prepared by the Safe and Healthy Streets Commission and with numerous partners committed to safety in Richmond,
Keep Customers and Ourselves Safe. Mark Shelton, District Engineer. Tracker. Measures of Departmental Performance
 Keep Customers and Ourselves Safe Mark Shelton, District Engineer Tracker Measures of Departmental Performance Safety is a daily commitment for all MoDOT employees. From design and construction to operations
ADDIS ABABA ROAD SAFETY STRATEGY
 ADDIS ABABA ROAD SAFETY STRATEGY (2017-2030) Feb 22, 2017 Presentation: Daniel Molla Overview Addis Ababa Capital City of Ethiopia, Seat of AU Area: 540 km 2 Population 3.4 million Road safety crises 400
WEEK 3 DRIVING SAFETY
 WEEK 3 DRIVING SAFETY Driving Safe starts before the engine. Most drivers are aware of the affect that things like drinking and cell phone use have on their driving safety, while giving little consideration
NEW YORK STATE 2018 Observational Survey of Seat Belt Use
 NEW YORK STATE 2018 Observational Survey of Seat Belt New York State Governor s Traffic Safety Committee Chuck DeWeese, Assistant Commissioner Empire State Plaza Albany, New York 12228 NEW YORK STATE
COLLISION STATISTICS May Engineering Services Box 5008, th Avenue Red Deer, AB T4N 3T4
 COLLISION STATISTICS 2016 2016 Red Deer Annual Motor Vehicle Collision Report May 2017 Engineering Services Box 5008, 4914 48th Avenue Red Deer, AB T4N 3T4 engineering@reddeer.ca RCMP GRC Red Deer City
The Florida Bicycle and Pedestrian Partnership Council
 The Florida Bicycle and Pedestrian Partnership Council Input to the Update of the Florida Transportation Plan March 2015 This document presents input from the Florida Bicycle and Pedestrian Advisory Council
The 2002 Pedestrian Safety Awareness Campaign
 The 2002 Pedestrian Safety Awareness Campaign From the Metropolitan Washington Council of Governments ABOUT THIS REPORT This report describes the 2002 Street Smart Campaign of the Metropolitan Washington
Institute of Transportation Engineers Safety Action Plan
 I Institute of Transportation Engineers Safety Action Plan 1. Introduction 2. Intersection Crashes 3. Keep Vehicles on the Road 4. Minimize Consequences When Vehicles Leave the Road 5. School Crossing
DRIVING ZERO FATALITIES TO A REALITY ILLINOIS LOCAL SAFETY INITIATIVE
 DRIVING ZERO FATALITIES TO A REALITY ILLINOIS LOCAL SAFETY INITIATIVE Priscilla Tobias, PE State Safety Engineer Illinois Dept of Transportation Illinois Stats 102 Counties 145,000 Roadway Miles 900+ Fatalities
March 22, 2007 File Reference/Dossier: 255
 Ontario Provincial Police Highway Safety Division 777 Memorial Avenue Orillia ON L3V 7V3 Police provinciale de l'ontario Division de la sécurité routière 777, avenue Memorial Orillia ON L3V 7V3 Tel: (705)
Keep Customers and Ourselves Safe. Mark Shelton, District Engineer. Tracker. Measures of Departmental Performance
 Keep Customers and Ourselves Safe Mark Shelton, District Engineer Tracker Measures of Departmental Performance Safety is a daily commitment for all MoDOT employees. From design and construction to operations
Road Safety Annual Report 2016 OECD/ITF Chapter 31. Norway
 Road Safety Annual Report 2016 OECD/ITF 2016 Chapter 31 Norway This chapter presents 2014 road safety data for Norway along with provisional data from 2015. It looks at trends in traffic and road safety
Traffic Safety Plan Traffic Safety Plan 2015
 Traffic Safety Plan 2015 Purpose Airdrie s last Traffic Safety Plan was created in 2011. The 2015 Traffic Safety Plan is a revised model of the traffic operations for the City of Airdrie. The purpose of
Statement before the Maryland Senate Committee on Judicial Proceedings on Senate Bill 277. Research on Automated Speed Enforcement. Stephen L.
 Statement before the Maryland Senate Committee on Judicial Proceedings on Senate Bill 277 Research on Automated Speed Enforcement Stephen L. Oesch The Insurance Institute for Highway Safety is a nonprofit
Transportation and Health Tool
 Working together to evolve the Transportation and Health Tool APHA Webinar March 22, 2016 Ann Steedly, PE Overview THT Development Context Development of Indicators Strategies, Interventions & Policies
Maine Highway Safety Facts 2016
 Maine Highway Safety Facts 216 216 MAINE HIGHWAY SAFETY FACTS The Bureau of Highway Safety and the Maine Department of Transportation are pleased to present the 216 edition of Maine Highway Safety Facts.
Minnesota Toward Zero Deaths: It's more than just a slogan
 Minnesota Toward Zero Deaths: It's more than just a slogan Kristine Hernandez, MBA Minnesota Toward Zero Deaths Program Coordinator May 2017 Toward Zero Deaths & Traffic Safety Culture Minnesota Timeline
Analysis of Pennsylvania Crash Statistics Data
 Analysis of Pennsylvania Crash Statistics Data By: Louis Pesci, Ph.D., Jeffrey Grim, P.T.P, Lucas Tatarko and Joseph Franze Indiana University of Pennsylvania May 2017 Executive Summary In 2015, 1,200
SAFETY PERFORMANCE MEASURES AND TARGET SETTING. Transportation Subcommittee September 15, 2017
 SAFETY PERFORMANCE MEASURES AND TARGET SETTING Transportation Subcommittee September 15, 2017 ACTION REQUESTED No action is requested. This item is for presentation and discussion. PREVIOUS ACTION Presented
HSRC News Briefs. PBIC launches Designing for Pedestrian Safety Webinar series. Three new summary reports from HSIS
 PBIC launches Designing for Pedestrian Safety Webinar series This summer the Pedestrian and Bicycle Information Center (PBIC), a clearinghouse of the Federal Highway Administration (FHWA) housed within
EGYPT: a national decade of action for road safety
 EGYPT: a national decade of action for road safety 2011 2020 Egypt EGYPT Population: 75 497 913 Income group: Middle Gross national income per capita: $1 580 INSTITUTIONAL FRAMEWORK Lead agency Funded
Speed Limits Study and Proposal. Public Input Session: 8/14/13
 Speed Limits Study and Proposal Public Input Session: 8/14/13 Why is Decatur a unique place for this project? First Community Transportation Plan in the nation with a Health Impact Assessment. Strong sense
Road Safety Vademecum
 Road Safety Vademecum Road safety trends, statistics and challenges in the EU 2010-2013 March, 2014 European Commission DG for Mobility and Transport Unit C.4 Road Safety Contents Summary of findings...
Road safety in the Eastern Mediterranean Region
 Road safety in the Eastern Mediterranean Region Facts from the Global Status Report on Road Safety 2013 Road safety in the Eastern Mediterranean Region Introduction In 2004, the World Health Organization
Closing Plenary Session
 TRAFFIC SAFETY CONFERENCE Closing Plenary Session June 9, 2017 Las Colinas, TX Order of Report Out June 9, 2017 Las Colinas, TX Distracted Driving Prioritized Countermeasures Countermeasure 4a Systemically
NEW JERSEY LAW ENFORCEMENT LIAISON NEWSLETTER
 NEW JERSEY LAW ENFORCEMENT LIAISON NEWSLETTER APRIL 2018/19 WWW.NJSACOP.ORG NJ DIVISION OF HIGHWAY TRAFFIC SAFETY The mission of the Division of Highway Traffic Safety is the Safe Passage of all roadway
Work Zone Safety in Oregon
 Work Zone Safety in Oregon Nature of the Problem National studies show Driver Inattention is the biggest contributor to work zone crashes. Driving too fast for conditions or Speed is another significant
People killed and injured per million hours spent travelling, Motorcyclist Cyclist Driver Car / van passenger
 Cyclists CRASH FACTSHEET 27 CRASH STATISTICS FOR THE YEAR ENDED 31 DEC 26 Prepared by Strategy and Sustainability, Ministry of Transport Cyclists have a number of risk factors that do not affect car drivers.