UWE has obtained warranties from all depositors as to their title in the material deposited and as to their right to deposit such material.
|
|
|
- Damon Lindsey
- 5 years ago
- Views:
Transcription
1 Pilkington, P., Bornioli, A., Bray, I. and Bird, E. (2018) The Bristol Twenty Miles Per Hour Limit Evaluation (BRITE) Study. Project Report. University of the West of England. Available from: We recommend you cite the published version. The publisher s URL is: Refereed: No (no note) Disclaimer UWE has obtained warranties from all depositors as to their title in the material deposited and as to their right to deposit such material. UWE makes no representation or warranties of commercial utility, title, or fitness for a particular purpose or any other warranty, express or implied in respect of any material deposited. UWE makes no representation that the use of the materials will not infringe any patent, copyright, trademark or other property or proprietary rights. UWE accepts no liability for any infringement of intellectual property rights in any material deposited but will remove such material from public view pending investigation in the event of an allegation of any such infringement. PLEASE SCROLL DOWN FOR TEXT.

2 The Bristol Twenty Miles Per Hour Limit Evaluation (BRITE) Study Analysis of the 20mph Rollout Project Paul Pilkington, Anna Bornioli, Issy Bray, and Emma Bird Bristol Centre for Public Health and Wellbeing, University of the West of England, Bristol February 2018 This work was commissioned by Bristol City Council Further copies of this report can be downloaded from the UWE Research Repository: Corresponding Author:
3 Table of Contents 1 Executive Summary Background Aim Methods Speed Casualties Wider public health effects Conclusions Introduction and Background Introduction Road traffic casualties and the role of speed Measures to reduce traffic speeds to 20mph Evidence for 20mph speed limits Bristol 20mph speed limit roll out Research Questions Methodology and Methods Vehicle speeds Automated Traffic Counts (ATC) Trafficmaster data Road traffic casualties Wider public health effects YouGov tracker survey on attitudes and behaviours towards 20mph limits Neighbourhood Survey Findings Vehicle speeds Automatic Traffic Count (ATC) data Trafficmaster GPS data Time of day Weekdays vs Weekends Winter vs Summer Road type Average speeds across areas of the city Trafficmaster data by area of the city Roads that are the exception to the trend Road traffic casualties Overall casualties Casualties among vulnerable groups Wider public health effects YouGov tracker survey on attitudes and behaviours towards 20mph limits Neighbourhood Survey Conclusions References Appendices Appendix A Appendix B Appendix C
4 1: Day/night * intervention interaction : Weekday/weekend * intervention interaction : Season * intervention interaction : Road type * intervention interaction : Area * intervention interaction Appendix D Appendix E Roads that are the exception to the trend
5 1 Executive Summary 1.1 Background In July 2012, Bristol City Council voted to introduce 20mph speed limits throughout the city. This followed the completion of successful pilot schemes in South and East Bristol. The 20mph speed limit was introduced in six phases. The first area implemented on 20 th January 2014 covers Central Bristol and borders the two pilot areas. The process of introducing 20mph limits across the city was completed in September The roll-out of the 20mph speed limits in Bristol was about more than reducing road traffic casualties, although this was one of the aims. The roll-out sought to improve health and well-being across the city, taking a holistic perspective as to how slower traffic speeds might impact on people s lives. 1.2 Aim To evaluate the impact of the roll-out of 20mph speed limits across the city of Bristol. 1.3 Methods The research took a holistic, public health approach to evaluation, using a variety of data sources to examine: changes in vehicle speeds; road traffic casualties; levels of walking and cycling; public perceptions and attitudes; and reported levels of health and wellbeing across the communities in Bristol before and after the introduction of 20mph speed limits across Bristol. 1.4 Speed On average, according to Automatic Traffic Count (ATC) speed data (with over 36 million vehicle observations analysed) there was a statistically significant 2.7mph decrease in vehicle speeds on roads where the 20mph speed limit was introduced, when controlling for other factors that might affect speed (areas, calendar year, time of day, season, type of road, and day of week). In the areas that stayed 30mph, there was a statistically significant negligible reduction in speed (0.04 mph) The largest reduction in speed was on 20mph A and B roads. Average speeds on 20mph roads were found to be below 24 mph in every area except for the Outer North and South areas of Bristol. On 30mph roads, average speeds are below 30mph in every area. Average speeds declined by a greater amount in the summer months and on weekends, where traffic volume (and congestion) is lowest. 3
6 94% of roads surveyed saw a reduction in average speeds. Average speed decreased on 100 roads out of Casualties Annual rates of fatal, serious, and slight injuries following the introduction of the 20mph speed limits are lower than the respective pre-20mph limit rate, thus showing a reduction in the number of injuries. The estimated total number of injuries avoided across the city each year is 4.53 fatal, 11.3 serious, and slight injuries. The estimated annual saving following the decrease in casualties is 15,256,309, based on Department for Transport formula for calculating the cost of road traffic casualties. The decrease in casualties has also benefitted some vulnerable groups. It is estimated that: o Two child lives will be saved every three years; 3 older adult lives will be saved every two years; and 3 pedestrian deaths will be avoided every year. o More than 4 child serious injuries will be avoided in just over three years; 4 older adult lives will be saved in three years; and 2 pedestrian severe injuries will be avoided every year. o The number of avoided slight child injuries per year is 7.68; older adult slight injuries will be avoided each year; and pedestrian slight injuries will be avoided each year. 1.6 Wider public health effects Clear majority support remains in Bristol for 20mph speed limits, with 62% supporting such limits on residential roads and 72% on busy streets. However, there is cynicism in Bristol about lack of enforcement of 20mph limits, a lack of compliance from other drivers and an increased readiness to report that it is sometimes okay to drive above the posted speed limit on residential roads. The number of people who walk or cycle to work in Bristol has increased between 2010 and More children in Bristol now walk or cycle to school following the introduction of the 20mph speed limits. 1.7 Conclusions This study has found statistically significant reductions in average traffic speeds of 2.7mph across the city of Bristol, following the introduction of 20mph speed limits. This is a larger reduction than seen in previous evaluations in other cities. The study employed a more sophisticated analysis than previous studies of 20mph limits, including using individual speed data from over 36 million vehicle observations and controlling for other factors that might affect changes in traffic speeds. 4
7 There has been a reduction in the number of fatal, serious and slight injuries from road traffic collisions, equating to estimated cost savings of over 15 million per year. Although there is still majority support for 20mph speed limits in Bristol, there remains concern about compliance and behaviour of other drivers. Walking and cycling across Bristol has increased, both among children travelling to school and adults travelling to work. The introduction of 20mph speed limits in Bristol offers a model for other towns and cities across the UK, who are seeking to reduce traffic speeds, cut road traffic casualties, and promote community health and well-being through road danger reduction. In order to assess effectiveness of 20mph speed limits, it is vital that other towns and cities follow Bristol s example, and prioritise the ongoing collection and analysis of appropriate data on vehicle speeds, road traffic casualties and wider public health impacts. 5
8 2 Introduction and Background 2.1 Introduction This project aimed to evaluate the impact of the roll-out of 20mph speed limits across the city of Bristol. The research took a holistic, public health approach to evaluation, using a variety of data sources to examine; changes in vehicle speeds; road traffic casualties; levels of walking and cycling; public perceptions and attitudes; and reported levels of health and wellbeing across communities in Bristol. 2.2 Road traffic casualties and the role of speed In 2016, 1,792 people were killed on the road in Great Britain, over 24,000 were seriously injured and more than 155,000 received slight injuries.(1) Although the number killed in 2016 represented an increase of 4% compared to the year before, the latest Department for Transport statistical release emphasises that the change (an increase of 62 fatalities) was not statistically significant and could be due to natural fluctuation. Indeed, since 2010, there has been little change in the annual number of road traffic fatalities. This period of plateau follows consistent falls in fatalities in previous decades. Compared to 2011, fatalities are down 6%. However, when it comes to serious injuries, annual numbers have increased by 4% in that time. Meanwhile, slight injuries in 2016 are down by 13% compared to 2011.(1) The relationship between traffic speed and risk of crashes and associated deaths and injuries on the road is well established. Particularly important are speeds between 20mph and 30mph, especially in residential areas where there are larger numbers of vulnerable road users, including pedestrians and cyclists. A 2011 study into pedestrian fatality risk associated with car impact speed concluded that there was a strong association between fatality risk and impact speed, when comparing risks at speeds between 50-30kph (31mph-18.6mph).(2) 2.3 Measures to reduce traffic speeds to 20mph Historically in the United Kingdom, 20mph zones have been introduced to slow vehicle traffic and reduce road traffic collisions (RTCs) and associated non-intentional injuries. 20mph zones use trafficcalming measures, such as speed humps, to reduce vehicle speed across a length of road and are self-enforcing because in theory it is hard to exceed 20mph when driving through them. Such 20mph zones have been demonstrated to reduce road traffic collisions and associated deaths and injuries. A 1996 review of the impact of the introduction of two hundred 20mph zones found reductions in child pedestrian accidents of 70%, child cyclist accidents by 48%, and overall accidents by around 60%. Significantly, there was a 6.2% reduction in collisions for each 1 mph reduction in vehicle speed.(3) A more recent controlled interrupted time series analysis of 20mph zones in London found a 42% reduction in road traffic casualties, with no evidence that casualties increased on nearby roads outside the intervention areas.(4) Default 30kph (18.6mph) speed limits in residential areas is a key aspect of the Safe Systems approach to road safety promoted by the World Health Organization (WHO), World Bank and Organisation for Economic Co-operation and Development (OECD), in which the road system allows for human error while reducing the risk of death or serious injury.(5) 6
9 In response to the road danger reduction approach promoted by the Safe Systems approach, signsonly 20mph speed limits are increasingly being introduced by local authorities in England as a means of reducing road traffic casualties and improving residential quality of life. Signs-only 20mph speed limits have signs placed on poles and painted on the road surface indicating the speed limit. They do not usually feature traffic calming and do not therefore enforce drivers to reduce their speed to 20mph or below. An obvious advantage of signs-only 20mph speed limits is that because they do not usually involve costly traffic calming measures, a far larger number of streets can be covered than with more expensive 20mph zones. The Road Traffic Regulation Act (Amendment) Order 1999, which gave local authorities more control over the introduction of 20mph zones and limits, suggests that 20mph limits are appropriate for roads where average speeds are already below 24mph.(6) Bristol is not alone in introducing 20mph speed limits across most roads in the city. Cities such as Portsmouth, Liverpool, Manchester, Edinburgh, Newcastle, Oxford, Sheffield, Birmingham and a number of London Boroughs have implemented 20mph speed limits. The Parliamentary Advisory Council for Transport Safety, Play England, Local Government Information Unit, and the BMA are just some of those organisations and agencies that support 20mph as routine across residential roads. The National Institute for Health and Care Excellence (NICE) has also issued guidance to local authorities advising on the implementation of 20mph speed limits.(7) The current move towards lower speed limits is only in part powered by the injury prevention agenda. Also significant is the desire to tackle obesity through the promotion of physical activity in the form of walking, cycling and active play. There is recognition that in many societies, an obesogenic (obesity-causing) environment, of which road traffic is a contributory factor, dissuades the population from engaging in healthy behaviours. In the UK, policy reports on obesity have called for reductions in speed limits.(8) The perceived wider equity outcomes from lower speed limits means that the policy also intersects with the sustainability agenda, which seeks to promote sustainable forms of travel. 2.4 Evidence for 20mph speed limits The evidence on the effectiveness of 20mph speed limits is growing. An early evaluation of 20mph limits in Scotland found a considerable drop in the number of recorded collisions per year, and a significant reduction in serious and fatal collisions.(9) A 2015 systematic review of the effectiveness of 20mph speed limits found evidence that introducing these lower speed limits reduce collisions and injuries, vehicle speed and volume, as well as improving perceptions of safety among the local population.(4) A number of local authority-led evaluations have taken place. Portsmouth, the first city in the UK to introduce a 20mph across most of the city, undertook an evaluation and reported a 22% reduction in casualties, with an average speed reduction of 1.4mph.(10) Bristol City Council evaluated the impact of introducing 20mph speed limits in two pilot areas of the city, reporting small but important reductions in average daytime vehicle speeds, an increase in walking and cycling, and strengthening public support.(11) In Bath and North East Somerset (BANES) a recent review of their 20mph limit intervention found an overall reduction in average speeds of 1.3mph, with some reductions in road traffic collisions.(12) Nonetheless, most of the evidence from studies on 20mph limits to date is cross-sectional, has relatively short follow-up periods, and is potentially confounded by a range of factors. In addition, other potential wider benefits of 20mph limits, including improved levels of wellbeing and community cohesion among residents, have not routinely been researched. One issue of discussion regarding 20mph speed limits is the possible impact on air quality. There are many factors which impact upon air pollution levels on a daily and annual basis and it is difficult to 7
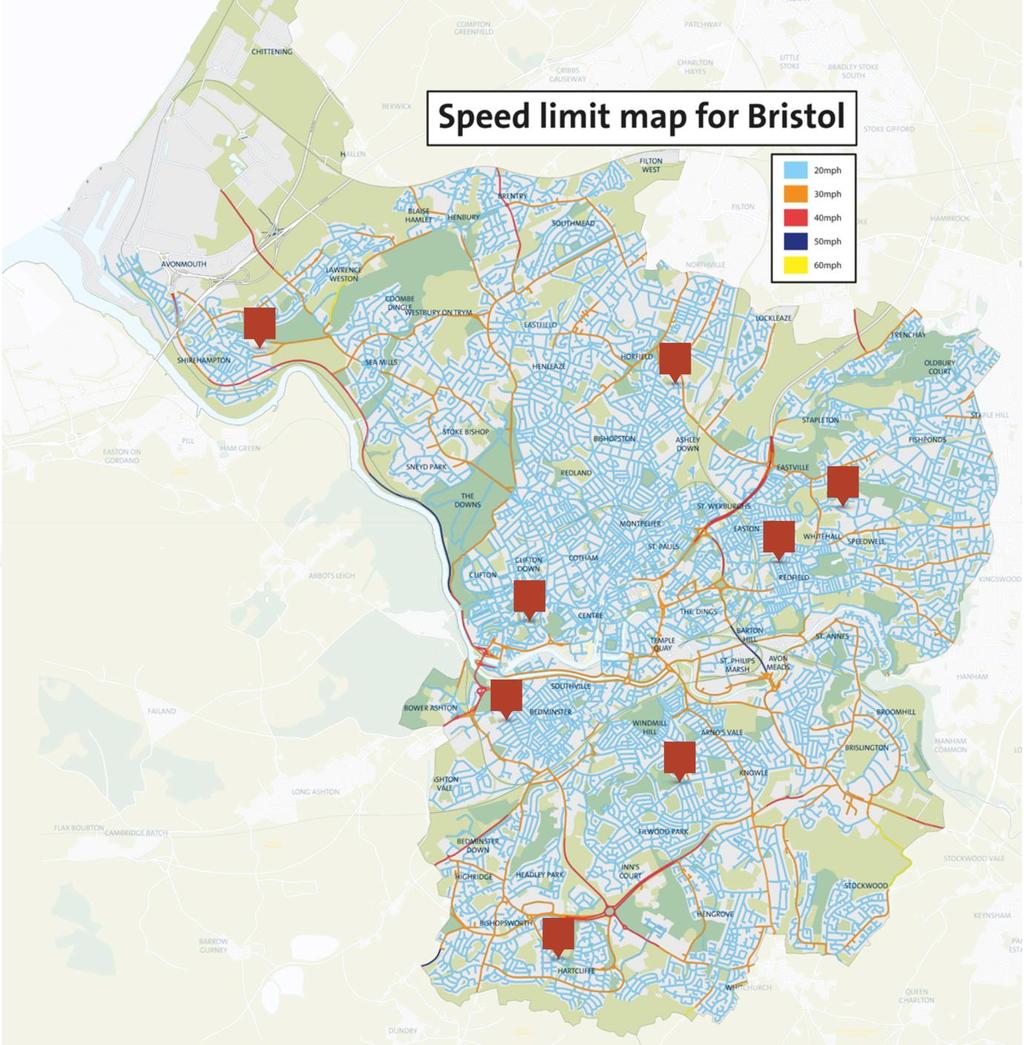
10 quickly and easily separate the influence of these from the impact of measures such as the introduction of 20mph limits. How drivers respond to 20mph limits, whether they are enforced effectively, whether the number of vehicle trips changes and the driving styles on a particular road are also likely to be important in the overall air pollution impact of this measure. A number of studies have been conducted into the effects that 20mph limits have on air pollution. Overall, a smoothing of driving style and cutting out of the acceleration phase from 20mph to 30mph is considered to be beneficial for emissions of harmful pollutants. A study from Berlin concluded that the introduction of 30kph limits (18.6mph) resulted in an up to 30% reduction in particulate emissions and 15% reduction in traffic related nitrogen oxides (NOx) emissions but enforcement of the limit and smoothing of flow with traffic light coordination was thought to play an important role.(13) A 2013 study conducted in London, backed up with real-world monitoring, showed the impacts of 20mph speed limits to be mixed but with particular air quality benefits being seen for particulate and NOx emissions from diesel vehicles.(14) Overall, the evidence suggests that 20mph limits are likely to result in negligible impacts upon air pollution. The Draft NICE Guidance on outdoor air quality suggested that 20mph limits should be considered as an air quality improvement measure but the evidence supporting it was found to be weak. Evidence of a worsening of air pollution from this measure appears to be limited, with several studies highlighting potential air pollution improvements in certain circumstances. Wider benefits from 20mph limits include increases in walking and cycling, reductions in noise, and a range of cobenefits including reductions in casualties and severity of those which do occur as well as proportionately larger positive impacts for poorer communities which otherwise suffer from higher levels of road traffic pollution. Therefore, it is considered that 20mph limits should be seen a positive measure for both safety, encouragement of modal shift and air pollution. 2.5 Bristol 20mph speed limit roll out In July 2012, Bristol City Council voted to introduce 20mph limits throughout the city. This followed the completion of successful pilot schemes in South and East Bristol. The lower speed limit was introduced in six phases. The first area implemented on 20 th January 2014 covers Central Bristol and borders the two pilot areas. The process of introducing 20mph limits across the city was completed in September See Appendix A for maps of the phase areas and speed limit distribution across Bristol following introduction of the 20mph limits. 20mph speed limit installation dates Speed Order Limits Operative date Inner South Bristol area pilot 19/05/ Inner East Bristol area pilot 22/10/ Phase 1 (Central area) 20/01/ Phase 2 (Inner South Area) 11/07/ Phase 3 (Henleaze etc) 29/09/ Phase 4 (East Area) 27/03/ Phase 5 (Outer North Area) 19/06/ Phase 6 (North Area) 23/09/15 8
11 The 20mph speed limit is a sign-only scheme with social marketing support (the use of marketing to achieve social change), and does not involve the introduction of any physical traffic calming measures such as speed humps. 20mph is now the new legal limit in Bristol for all motorised vehicles on most roads except those selected to retain a 30mph limit such as through-routes. Speed limits on dual carriageways and 40mph and 50mph roads were not altered. The roll-out of the 20mph speed limit in Bristol was about more than reducing road traffic casualties, although this was one of the aims. The roll-out sought to improve health and well-being across the city, taking a holistic perspective as to how slower traffic speeds might impact on people s lives. The extension of 20mph limits has three main aims: Road danger reduction the Cycling City and Active Bristol initiatives have already achieved significant change with their emphasis on shared roads and as a result more people walking and cycling around the city. A lower speed limit will make the streets safer for all road users, reducing the risk and the severity of collisions. Making Bristol healthier with lower road speeds, walking, cycling and outdoor play are more attractive options, all of which have a positive impact on health and the community. As well as increasing physical activity, these pursuits offer a greater opportunity for social interaction and community support. Supporting and building communities data from the British Crime Survey shows that speeding traffic is the top rated anti-social behaviour in local communities. The aim of 20mph is to help create more pleasant communities. Calmer speeds, and ultimately reduced car use for local trips, will lead to less noisy and more people-centred communities. 2.6 Research Questions The research took a holistic, public health approach to evaluating the impact of the 20mph limit in Bristol. Although there was a focus on the traditional road safety measures of vehicle speeds and road traffic casualties, there was also an emphasis on wider public health effects such as changes in people walking and cycling, and community perceptions about their local environment. The overarching research question was: What impact has the Bristol 20mph speed limit roll-out had on health and wellbeing across the city? The proposed research project sought to answer the following questions: Speeds and Road Traffic Casualties 1. Have average speeds of vehicles reduced following the introduction of the 20mph limit, what are the patterns across the city in the change of speeds and are there still problematic areas/routes? 2. Has the number of road traffic casualties (deaths and injuries) decreased on those roads where the 20mph speed limit was introduced? 3. Has the introduction of 20mph had measurable effects on speed or road traffic casualties on other roads (i.e. has the speed been affected where it is still 30mph)? 9
12 Wider public health benefits 4. Has the number of people who are walking or cycling in the city increased following the introduction of the 20mph limits? 5. What changes in attitudes have occurred in the 20mph areas following implementation, including those specifically related to the reduced speed limit? 10
13 3 Methodology and Methods As noted previously, the introduction of the 20mph speed limit across the city aimed not only to reduce road traffic casualties by lowering traffic speeds, but also to encourage more people to walk and cycle, and to improve community wellbeing. As such, the evaluation took a holistic approach to assessing impact, utilising a range of data sources that had been collected by Bristol City Council as part of their comprehensive data monitoring and collection programme. This included measuring: Vehicle speeds and compliance Travel modes Road traffic casualties Perceptions and attitudes The research team at UWE were given access to all these data sets, to enable the most holistic evaluation possible to be undertaken, examining outcomes before and after the introduction of the 20mph speed limits across the city. The sub-sections below outline the nature of the various data sources and how these data sources were used by the research team in the evaluation. The roads surveyed in the data sets were based on the old cordon sites that the council have used for several years to monitor the speed of vehicles coming in, travelling around, and moving out of the city. However, to provide a fuller picture of the city speeds additional roads were added into the local data sets, which included the A and B roads that have seen a change in speed limit and several local distributor roads classified as U roads. In terms of the nature of the various road types: A roads are major roads intended to provide large-scale transport links within or between areas; B roads are intended to connect different areas, and to feed traffic between A roads and smaller roads on the network; and unclassified roads are local roads intended for local traffic, with over 60% of roads in the UK being in this category.(15) 3.1 Vehicle speeds In order for the introduction of 20mph speed limits to potentially impact on other outcomes such as road traffic casualties and quality of life, it is first necessary to confirm whether the new lower limits have resulted in a reduction in average motorised traffic speeds. To explore the impact on speeds, the evaluation assessed changes in motorised vehicle speeds before and after the introduction of the 20mph speed limit, both on roads that reduced their limit to 20mph and those that retained a higher limit. This was done to determine both whether introducing a lower limit of 20mph prompted drivers to reduce their speed on those roads, and whether this then also influenced driving behaviour elsewhere, including on roads where the limit remained at 30mph or above. To do this, two sources of vehicle speed data were used: data from Automated Traffic Counts (ATC) and Trafficmaster data. Both sources of vehicle speed data will now be explained Automated Traffic Counts (ATC) Automatic Traffic Counters (radars) measure speed of traffic through the laying of a strip across the road which vehicles travel over. Such strips are usually placed at the point on the road where average traffic speed is greatest. ATCs collected data for roads for seven days, twenty four hours a day. They are designed for free flowing traffic on flat straight roads with one lane of traffic in each direction. Their accuracy will be affected by any factors which affect these ideal conditions (e.g. a delivery vehicle parked in front of the radar will block its ability to detect other vehicles). Data in Bristol were collected from 2014 to 2017 during one or two weeks a year (in winter and summer). 11
14 In order to utilize the full data set, before-after individual vehicle speeds were extracted and used in the analysis, rather than the average road speed over 24 hours as is normally done with such monitoring. By using individual vehicle speed, a much more detailed picture of average speeds in Bristol was obtained, as individual speeds change significantly depending on time of day (day and night speeds are generally very different). This resulted in over thirty-six million individual vehicle observations being used to analyse before-after changes in vehicle speeds, giving the study great power to detect any changes in motorized vehicle speed following the introduction of the 20mph speed limits. Average vehicle speeds can be affected by a range of factors, including the weather and time of year. Taking into account such factors when assessing the impact of 20mph speed limits on traffic speed can help to give a clearer picture of how the new speed limit has affected traffic speeds. A statistical modelling process (General Linear Mixed Models) was used to control for (take into account) other factors that could affect changes in vehicle speeds across the city over the period of study. This included the effect of calendar time, as the 20mph intervention was implemented on a rolling basis throughout the city, with different areas having different installation dates. The General Linear Mixed Model also allowed controlling for the effects of other time variables (time of day; weekend and weekday; season) and other confounding variables (road type and area) Trafficmaster data Motorised traffic speed is also recorded using commercially-available Trafficmaster data. The Trafficmaster in-car Global Positioning System (GPS) records the position of vehicles in which it is fitted and this data is then used to calculate the vehicle s speed. The difference with this way of monitoring speeds compared to the ATCs is that instead of measuring speeds at one point on the road, the data cover most routes in the city at a link-by-link level, for most times of the day. These data have been used to undertake a series of route studies giving a detailed breakdown of speeds along particular routes. The data potentially covers all routes travelled by such vehicles across the city, at all times of day. The make-up of the sample is constantly changing. The current vehicle fleet population is composed of 70,000 vehicles, with 68% cars, 30% light goods vehicles, 1% heavy goods vehicles and another 1% are other vehicles (e.g. buses, taxis, caravans). A recorded journey is defined by the ignition-on to ignition-off of a vehicle. When the data are recorded, if a vehicle is parked for an excessive period of time at the same spot (e.g. longer than 5 minutes) then the Trafficmaster processing assumes that this is the end of the journey and would end the journey at the point it reached that position. Therefore a parked vehicle will not be included in the journey time. 3.2 Road traffic casualties Data regarding personal injury road collisions that have been reported to the police (known as Stats 19 data) are provided to the Council by Avon & Somerset Police. This provides details about each incident, including location, severity and contributory factors. The personal injury road collision database contains records dating back to Personal injury road collisions that have been reported to the Avon & Somerset Police and forwarded to the council are held on the database. Damage only crashes, near misses and unreported casualties are not recorded. 12
15 When a road collision occurs on the public highway and someone involved has been injured the incident should be reported to the police who will complete a collision book. This set of data has details about the circumstances of the collision, including the types of vehicles involved, the resulting casualties and factors that may have contributed to the collision occurring. The data form the basis for annual statistics on road collisions and casualties published by the Department for Transport and Local Authorities. Extensive use is made of the data by those working in the field of collision prevention and road safety education e.g. to establish priority collision sites for remedial measures or as evidence on which to base educational programmes and training aimed at specific road users. The accumulated data is also used by a range of establishments for research into road safety measures. Data are received electronically from the police on a weekly basis in the form of three interrelated data tables and are then systematically processed by the Data Monitoring Officer in order to formulate an objective summary of the circumstances of the collision. The casualty record has details about the age, gender, injury severity and class i.e. driver/passenger/pedestrian, of each casualty. For pedestrian casualties their location and movement on the carriageway are recorded. The vehicle record has details about the vehicle type, direction of travel, objects hit, vehicle manoeuvres and junction location of vehicle, vehicle point of impact, carriageway type, driver age, and driver gender. The main attendant circumstances table has details about the collision location, date, time of day, light conditions, weather, carriageway hazards, road type, junction detail, road surface condition, speed limit, contributory factors and a grid reference. Eight years of data was available for road traffic casualties that occurred in Bristol, between the 1 st January 2008 and 31 st December Reference populations related to single collisions cannot be easily determined, in the sense that each casualty does not relate to a discreet geographical population due to the fact that the total number of drivers, walkers and cyclists at each given day is not known. For this reason, the statistical analysis was descriptive and final conclusions based on statistical significance cannot be drawn. 3.3 Wider public health effects YouGov tracker survey on attitudes and behaviours towards 20mph limits Bristol City Council commissioned a tracker survey in partnership with the University of the West of England (UWE Bristol) with the aim of understanding attitudes and behaviours with respect to 20mph speed limits in Great Britain, with a boosted sample in Bristol. This survey planned to ascertain levels of support and opposition, the reasons for these, and the likely reaction to 20mph limits once they were in place. This has provided measures of attitudes and claimed behaviours for Bristol compared with other UK wide urban centres with 20mph limits, and insights into behaviour change. The first tracker survey took place in May 2013, and was repeated in May 2015 and May The Tracker Survey fieldwork was contracted to YouGov (a large provider of social and market research). The survey was carried out online and the sample size was 3074 GB adults, including approximately 500 residents of Bristol. The figures in the reports have been weighted to be representative of all GB adults (aged 18+). The survey was administered to members of the YouGov panel of 400,000+ individuals who agreed to take part in surveys. An was sent to panellists selected at random from the base sample 13
16 according to the sample definition, inviting them to take part in the survey and providing a link to the survey. The responding sample is weighted to the profile of the sample definition to provide a representative reporting sample. The profile is normally derived from census data. This document reports the findings that have been presented by the UWE Bristol team who led the analysis Neighbourhood Survey Household interview surveys were carried out by an independent research organisation, Crystal Market Research, before and after the implementation of each phase of the 20mph limit roll-out. These surveys provide quantitative research among the public, measuring the extent to which the new speed limits have achieved their wider societal objectives in terms of public approval of the scheme, travel habits and use of local streets. Similar data for Bristol as a whole are available from the Council s annual Quality of Life survey. For each of the six phases of the 20mph rollout, a household interview survey was undertaken 6 months prior to and 18 months after its implementation. Thus 12 surveys were carried out; 6 pre implementation and 6 post implementation. The post surveys were conducted at the same time of year as the pre surveys in order to avoid seasonal influences on the results. In each survey a representative sample of around 250 adults living in the Phase area were interviewed, face to face, at home. To achieve a representative sample, quotas were set for wards within the Phase areas, based on adult population density. Within each ward, quotas were set for gender, age (16-24, 25-44, 45-64, 65+) and economic activity, based on Census data for that ward. To achieve a good geographical spread across each Phase area interviews were conducted in all the Lower Level Super Output Areas within that Phase area. The same questionnaire was used in all the Pre surveys. The Post questionnaire was identical to the Pre questionnaire in order to be able to track changes in behaviour and attitude with some questions about the impact of 20mph specifically. This document reports the findings from a series of reports produced by Crystal Market Research that analysed before-after changes across the phase areas. 14
17 4 Findings This chapter reports the findings from the evaluation of the introduction of 20mph speed limits across Bristol, using the data sources outlined in Section 3. Each data source is presented separately. Where findings are reported as being statistically significant, this means the result found is unlikely to be due to statistical chance i.e. we can have more confidence in the findings. 4.1 Vehicle speeds It is important to note that success is not defined by all average speeds being under the set speed limit of 20mph it is about bringing vehicle speeds down closer to 20mph, and assessing any positive impacts of that speed reduction compared to the situation before the introduction of the lower limits Automatic Traffic Count (ATC) data On average, on roads where the 20mph speed limit was introduced, there was a 2.7mph statistically significant decrease in vehicle speeds after the introduction of the limit, when controlling for other factors that might affect speed (areas, calendar year, time of day, season, type of road, and day of week). In the areas that remained 30mph, there was a statistically significant but negligible reduction in speed (0.04 mph) (Appendix B) Trafficmaster GPS data Trafficmaster speed data showed a statistically significant reduction of 0.8mph on roads where the 20mph speed limit was introduced, with traffic speeds reducing from 17.8mph to 17.0mph. The potential differences between ATC data and Trafficmaster data can be explained by several factors. First, ATC data measure spot speed, while Trafficmaster measures average speed along a whole road; ATC speeds are higher than Trafficmaster speeds, also due to the fact that the ATC radars are positioned in the most problematic spot of a road. Second, the Trafficmaster measurements were taken in a sample of roads that was slightly different from the ATC sample. Among the roads where Trafficmaster data were measured there was a higher proportion of small residential roads, where speeds tend to be lower than in other types of roads. Third, while ATC data include data from several time periods after the 20mph installation (up to Winter 2017), Trafficmaster data only refer to speeds 6 months before and 6 months after the new speed limit installation. The remainder of this section refers to ATC speeds, unless specified otherwise Time of day Controlling for time of day, on roads where the 20mph speed limit was introduced, day speeds (7am to 7pm) reduced by 2.7mph compared to before the introduction of the limit, and night speeds (7pm to 7am) reduced by 2.4mph. On roads that remained 30mph, day speeds decreased by 0.2mph, while night speeds increased by 0.2mph (Appendix C.1). These changes are statistically significant. 15
18 Average speeds 1 on 20mph roads across the city are now 21.8 mph during daytime (7am to 7pm), and 24.1 mph at night time. In 30mph roads, average speeds are 25.1 mph during daytime and 27.6 during night time Weekdays vs Weekends Compared to before the introduction of the 20mph speed limit, average speeds on weekdays reduced by 2.6mph on 20mph roads, while on weekends they decreased by 3mph. On roads that remained 30mph, speeds reduced by 0.2mph on weekends, but did not vary in 30mph streets in weekdays (p > 0.05) (Appendix C.2). These changes are statistically significant. It is a positive finding that speeds decreased even on weekends, when traffic volumes are lower. Average speeds 1 from Monday to Friday were found to be 22.2mph on 20mph roads and 25.6mph on 30mph roads. Average speeds on weekends are now 22.5mph on 20mph roads and 26.9mph on 30mph roads Winter vs Summer Average speeds 1 in winter on roads where the 20mph speed limit was introduced reduced by 2.3 mph, while in summer they declined by 4.7 mph. On roads that remained 30mph, speeds went down by 0.04mph in winter and by 1.8mph in summer (Appendix C.3). It is noticeable that speeds reduced by a greater amount in the summer, even though traffic volumes are lower with more opportunity to drive faster with less congestion. These changes are statistically significant. Average speeds 1 in winter are now 22.4 mph on 20mph roads and 25.6mph on 30mph roads. Average speeds in summer are now 22.6mph on 20mph roads and 26.1mph on 30mph roads Road type Looking at different types of roads, some differences between A, B, and unclassified (U) roads were found. Speed reduced by 3.7mph on A and B roads where the 20mph speed limit was introduced, while speeds decreased by 0.3mph on A and B roads where the limit remained at 30mph. On U roads, speed reduced by 1.6 mph on roads where the 20mph was introduced, and by 0.1mph on roads that retained the 30mph limit (Appendix C.4). These changes are statistically significant. Average speeds 1 following the introduction of 20mph speed limits are below 24 mph in 20mph A, B, and U roads. On the rest of the network average speeds are 26.8mph, below the 30mph speed limit Average speeds across areas of the city Average speeds following the introduction of the 20mph speed limits vary among areas of the city (Table 1). 1 Not controlling for areas, calendar year, time of day, season, type of road, and day of week. 16
19 Table 1: ATC average speeds by area and speed limit of roads following the introduction of the 20mph speed limits 2 New speed limit (mph) Pilot Central Inner South Inner North East Outer North Outer South Average daily speeds (mph) It was possible to calculate changes in vehicle speeds (as measured by ATCs) before and after the introduction of the 20mph speed limits in certain areas of the city for 20mph and 30mph roads (Appendix C.5). When controlling for calendar year, season, day of the week, time of day, and road type, in the Inner North area, the average speed reduction on 20mph roads was 5.9mph, while in both Outer North and Outer South it was approximately 3.3mph. In the East area, speeds on 20mph roads reduced by 1.9mph. These changes are statistically significant. The picture for roads which retained a 30mph limit varies (Table 1). In the Inner North area, average speeds on 30mph roads reduced by 4.9mph. In the Outer North and Outer South areas there was a smaller reduction in speed in the streets that retained the 30mph limit (0.5mph and 0.4mph reduction respectively). However, in the East area there was an increase in average speed of 2.1 mph on 30mph roads. These changes are statistically significant. As can be seen in Table 1, average speeds in 20mph streets are below 24 mph in the Pilot, Central, Inner North, and Inner South areas. In 30mph streets, average speeds are below 30mph Trafficmaster data by area of the city Trafficmaster data show that in 20mph roads in Central, Inner South, Inner North, and Outer South Bristol the average speed reduction was under 1mph (Table 2), while in the East and Outer North areas the reduction was above 1mph. These changes are statistically significant (Appendix D). 2 Not controlling for areas, calendar year, time of day, season, type of road, and day of week. 17
20 Table 2: Trafficmaster average speed variation in 20mph roads by area Area Average speed before intervention (mph) Average speed after intervention (mph) Trafficmaster average speed variation (mph) Central Inner South Inner North East Outer North Outer South Roads that are the exception to the trend According to the ATC data, 94% of the 20mph and 30mph roads surveyed saw a reduction in average speeds following the introduction of 20mph speed limits. Speed decreased on 100 roads out of 106, with 6 roads having increased average speed. These are three 20mph roads and three 30mph roads, although it is worth noting that the average speed in two of the 30mph roads is still below 30mph (Appendix E). Among 20mph roads, twenty-six 20mph roads out of 106 recorded average speeds above 24mph, of which twelve have 24-hour average speeds above 26mph. The list of roads that were exceptions to the overall trend can be found in Appendix E. 4.2 Road traffic casualties Overall casualties Table 3 reports the number of injuries in each area before and after the introduction of 20mph speed limits, on both roads to which the 20mph speed limit applied and those that retained a 30mph limit. Annual rates of fatal, serious, and slight injuries following the introduction of the 20mph speed limits are lower than the respective injury rate before the limits were introduced, thus showing a reduction in the number of injuries. The estimated total number of injuries avoided across the city each year is 4.53 fatal, 11.3 serious, and slight. Table 3: Road traffic casualties before and after the introduction of 20mph speed limits, by area Note: a negative sign in Difference in annual rate of injury post minus pre indicates a reduction in annual rate of injury Phase Pilot (East + South) Injury type Intervention period (before and after 20mph limit) Number of months (adjusted) Absolute number of injuries Annual rate of injury Difference in annual rate of injury post minus pre Fatal Before (1/1/ (-54.9%) to 21/10/10) After (22/10/ Serious Before (1/1/ (-37.2%) to 21/10/10) After (22/10/ Slight Before (1/1/ (-12.8%) to 21/10/10) After (22/10/
21 Central Fatal Before (1/1/2008 to 19/1/2014) After (20/01/14 Serious Before (1/1/2008 to 19/1/2014) After (20/01/14 Slight Before (1/1/2008 to 19/1/2014) After (20/01/14 Inner South Fatal Before (1/1/2008 to 10/7/2014) After (11/07/14 Serious Before (1/1/2008 to 10/7/2014) After (11/07/14 Slight Before (1/1/2008 to 10/7/2014) After (11/07/14 Inner North Fatal Before (1/1/2008 to 28/9/2014) After (29/09/14 Serious Before (1/1/2008 to 28/9/2014) After (29/09/14 Slight Before (1/1/2008 to 28/9/2014) After (29/09/14 East Fatal Before (1/1/2008 to 26/3/2015) After (27/03/15 Serious Before (1/1/2008 to 26/3/2015) After (27/03/15 Slight Before (1/1/2008 to 26/3/2015) After (27/03/15 Outer North Fatal Before (1/1/2008 to 18/6/2015) After (19/06/15 Serious Before (1/1/2008 to 18/6/2015) (-40.9%) (-14.6%) (-17.8%) (-33.3%) (+14.3%) (-1.9%) (-18.75%) (-9.5%) (-24.0%) (-100%) (-9.4%) (-15.9%) (+20%)
22 After (19/06/15 Slight Before (1/1/2008 to 18/6/2015) After (19/06/15 Outer South Fatal Before (1/1/2008 to 22/9/2015) After (23/09/15 Serious Before (1/1/2008 to 22/9/2015) After (23/09/15 Slight Before (1/1/2008 to 22/9/2015) After (23/09/ (-23.2%) (-100%) (+2.3%) (-2.7%) In conclusion, there appears to be a trend of reduction in casualties. However, due to the fact that reference periods after the introduction of 20mph speed limits vary among areas, and identifying the denominator was problematic, it was not possible to ascertain if this trend is statistically significant. A potential positive finding is that the monthly rate of casualties seems to have fallen despite the fact that more people report walking and/or cycling in Bristol (see Section 4.3). Table 4 below shows the estimated yearly value of the prevention of casualties. Based on the Department for Transport s 2016 costing per casualty, the casualties avoided are estimated to have produced an annual saving of more than 15 million.(16) Factors that are included in the cost calculations include costs of emergency services, lost output and damage to property. However the calculations do not take into account the substantial savings relating to costs of misery, grief and suffering of family, friends and colleagues of those killed and injured on the road. Table 4: Estimated casualties avoided per year across Bristol Severity Number of casualties Estimated value of Estimated avoided per year prevention, per casualty saved per year Killed ,971,998 8,933, Serious ,149 2,578, Slight ,514 3,745,075 Totals ,223,661 15,256,309 total The above changes in fatalities, serious injuries and slight injuries are marked and align with international evidence that reports that a 1mph average speed reduction in urban areas is associated with a 6.2% reduction in collisions.(3) The total cost of casualties in Bristol was over 53 million in 2016, so although 15 million is a substantial reduction, more still needs to be done to reduce conflict and injury on the roads Casualties among vulnerable groups Table 5 shows the estimated number of individual injuries/deaths avoided among several vulnerable groups based on the annual rate of injuries before (pre) and after (post) the introduction of 20mph 20
23 speed limits. Figures are city-wide. Due to the small numbers, which would be prone to random fluctuation, figures were not calculated by area. Among fatal injuries, the number of children s deaths per year has decreased by 0.6 across the city, with an estimate of 2 child lives saved in just over three years. Across the city post-intervention, the number of older adults deaths per year has decreased by 1.06, with an estimate of 3 older adult lives saved in two years. Finally, it is estimated that almost 3 pedestrian deaths are avoided each year post intervention. However, due to the very low yearly rate of fatal injuries, it is not possible to ascertain whether these trends are related to the 20mph intervention. Table 5: Difference in annual rate of deaths and injuries in Bristol among vulnerable groups, before (pre) and after (post) 20mph speed limit introduction Injury type Difference in annual rate of injury (post minus pre) Child Older adult Pedestrian Fatal Injuries Serious Injuries Slight Injuries Among serious injuries, across the city 1.28 severe child injuries are avoided each year post intervention, with an estimate of more than 4 child serious injuries avoided in just over three years. The number of older adults who were seriously injured on the road decreased, with 1.34 serious injuries avoided each year post intervention. The estimate is of 4 older adult lives saved in three years. Finally, the number of pedestrian serious injuries decreased by 2.09 each year; 2.09 pedestrian severe injuries are avoided compared with the pre-intervention period. The number of slight child injuries per year has decreased by The number of older adults who had slight injuries also decreased, with slight injuries among older adults and pensioners avoided each year compared with the pre-intervention period. Finally, the number of slight pedestrian injuries decreased, with an estimated slight pedestrian injuries avoided each year compared with the pre-intervention period. 4.3 Wider public health effects Unlike the analysis on speed and casualties, the findings below come from secondary reports, completed by other researchers. The aim of including these findings is to contextualise the main speed and casualty analysis through a recognition of wider public health benefits of the introduction of 20mph speed limits YouGov tracker survey on attitudes and behaviours towards 20mph limits Clear majority public support for 20mph limits was found in the 2013 and 2015 surveys of general public attitudes and driver behaviour among residents of Bristol.(17) The latest 2017 data revealed a maintenance of majority support for 20mph speed limits in the city, at 62% (for residential roads) and 72% (for busy streets). This is very similar to levels across the UK. However, there is cynicism in Bristol (and across Great Britain) about lack of police enforcement of 20mph limits and a lack of compliance from other drivers.(17) There is also an apparent pluralistic ignorance effect a 21
24 widespread belief that there is little support for 20mph limits, whereas the reality is that the opposite is true. These beliefs probably contribute to the claimed lack of compliance from Bristol drivers (40% may not stick to 20mph limits), with levels worse than for Great Britain as a whole (29%). In 2017, Bristol residents adopted both positive and negative extremes compared to Great Britain generally. Negative extremes included Bristol residents being more likely to agree with lists of reasons to oppose 20mph speed limits, and less keen on the police enforcing 20mph speed limits. This may be a reflection of the fact that 39% of Bristol residents agreed that 20mph speed limits have been introduced on too many streets, compared to 22% in Great Britain as a whole.(17) Other attitudinal responses in Bristol were more positive towards 20mph speed limits. Slightly more Bristol residents than Great Britain as a whole (44% v 39%) said that motorists should stick to 20mph limits to accommodate cyclists better, and 42% of residents on 30mph streets wanted 20mph on their streets (which was similar to Great Britain levels).(17) Neighbourhood Survey As noted earlier, these findings relate to a series of reports commissioned by Bristol City Council, based on household interviews in each of the phase areas, before and after the introduction of the 20mph speed limit Safety Residents have similar attitudes towards local road safety before and after 20mph implementation, with slight, non-statistically significant improvements post 20mph. Statistically significant improvements include; In the Central and Inner North areas, where average speeds are below 24mph, there is an indication of fewer safety fears for children walking to school on their own post 20mph. This is also the case in the Outer South area. Inner North Phase and East areas residents, where average speeds are below 25mph, are more inclined to feel it is safe to cross the road in their area post 20mph. In East areas residents are also more inclined to feel it is safe for elderly people to cross the road in their area post 20mph. Main concerns continue to centre on children playing out in the street in most areas, as only between 20% and 27% of residents feel it is safe for children to play out in the street Traffic noise Generally, fewer residents are disturbed by the sound of passing traffic. In the Outer North area, where average speeds are above 24mph in 20mph streets and 27mph in 30mph streets, the variation in the proportion of people disturbed by traffic is not statistically significant Attitudes towards 20mph speed limits Changing the speed limit from 30mph to 20mph seems to have softened residents attitudes towards speeding in the Phase areas surveyed. Following the introduction of the 20mph speed limits, between 24% and 32% of residents are likely to feel it is sometimes acceptable to drive over the signed speed limit on residential roads, while before the 20mph intervention the figures were between 11% and 21%. Between 91% and 97% of residents are aware of the 20mph speed limit. Support for 20mph on residential streets remains very high and has increased or stayed the same after the 20mph speed limit introduction, except for the East area, where post implementation fewer people are in favour of the 20mph speed limit. Possibly 22
25 related to this, the East area is the only area where the average speed in 30mph streets in has increased. Other findings include: Between 77% and 88% of individuals across the city are in favour of the 20mph speed limit in their own street; the support has increased in every area except for the East area, where 73% are in favour of the 20mph speed limit; Support for 20mph on residential roads has become a little more positive post implementation (at least 73% of residents are in favour of the 20mph speed limit across the city); the East area is an exception, as fewer people are now in favour of the new speed limit (70%) although the majority still support the speed limit; Support for 20mph on local main roads, which is generally weaker, has increased in the Central, Outer South and Outer North areas; while in the Central area 41% of residents are in favour of the new speed limit, at least 23% of residents in other areas are in favour, except for the East area, where only 17% support the new speed limit. Between 79% and 95% of drivers say they obey the new speed limit, except for the East area, where the figure is 69%. Since the introduction of 20mph, between 17% and 20% of individuals feel traffic speed has reduced on their street, except for the Outer North area, where the figure is 13%; Between 19% and 25% of individuals feel traffic speed has reduced on main roads, except for the Inner South area, where the figure is 12%; Most people think that it is clear to anyone driving around the local area that they are in a 20mph speed limit, except for the Outer North area, where only 19% of individuals think that it is clear to anyone driving around the local area that they are in a 20mph speed limit Active travel Trends of walking and cycling are similar across all areas, with more people walking or cycling for 10 minutes or more in their local area most days following the introduction of the 20mph speed limit. However, it is not possible to assess whether these trends are related to the 20mph speed limit intervention. In the Central area, where average speeds are below 24mph, people tend to walk and cycle more than in other areas. The number of residents who walk for 10 minutes or more in their local area most days has generally increased in every area. In the Inner South, the increase was smaller than in other areas. The number of people who cycle for 10 minutes or more in their local area at least once a week has remained the same or has slightly increased. In the areas with speeds above 24mph (Outer North, East), cycling is still below 20%. More children walk or cycle to school in every area, with more than 59% of children now walking to school and at least 31% of children now cycling to school. The number of people using the car most days has stayed the same in every area. These figures are also mirrored by the findings on walking and cycling from the Bristol Quality of Life survey. According to the survey: the number of people who walk to work has increased from 2010 to 2015 from 17.5% to 18.9%; 23
26 the number of people who drive to work has decreased from 2010 to 2015 from 53% to 44%; the number of people who cycle to work has increased from 11% in 2010 to 15% in Attitudes towards neighbourhood Residents across the city have generally an extremely positive view of where they live in terms of how pleasant and relaxed their street and local residential streets feel, and how much they feel a part of and are satisfied with their neighbourhood. Attitudes have improved slightly after the 20mph limit implementation but the change is not statistically significant. Levels of community sociability are stable. It is not possible to assess whether these trends are related to the 20mph speed limit intervention. Some significant improvements include: In the Inner North and Outer North areas, where average speeds before 20mph implementation were above 28mph, sense of belonging has increased since the introduction of 20mph. Social interactions have increased in the Inner North area. This is possibly related to the fact that there was a large drop in speed in the area Health Perceptions of their health have not changed significantly before and after the introduction of the 20mph speed limits across all of the phase areas; between 62% and 84% of residents feel that their health has been good in the last 12 months. 5 Conclusions This study has found statistically significant reductions in average traffic speeds of 2.7mph across the city of Bristol, following the introduction of 20mph speed limits. This is a larger reduction than seen in previous evaluations in other cities. The study employed a more sophisticated analysis than previous studies of 20mph limits, including using individual speed data from over 36 million vehicle observations and controlling for other factors that might affect changes in traffic speeds. There has been a reduction in the number of fatal, serious and slight injuries from road traffic collisions, equating to estimated cost savings of over 15 million per year. Although there is still majority support for 20mph speed limits in Bristol, there remains concern about compliance and behaviour of other drivers. Walking and cycling across Bristol has increased, both among children travelling to school and adults travelling to work. The introduction of 20mph speed limits in Bristol offers a model for other towns and cities across the UK, who are seeking to reduce traffic speeds, cut road traffic casualties, and promote community health and well-being. In order to assess effectiveness of 20mph speed limits, it is vital that other towns and cities follow Bristol s example, and prioritise the ongoing collection and analysis of 24
27 appropriate data on vehicle speeds, road traffic casualties and wider public health impacts. 25
28 6 References 1. Department for Transport U. Reported road casualties in GB: 2016 annual report [Internet] Available from: gb pdf 2. Rosén E, Sander U. Pedestrian fatality risk as a function of car impact speed. Accid Anal Prev [Internet] May [cited 2018 Feb 4];41(3): Available from: 3. Allsop R. MASTER Project (Managing the Speeds of Traffic on European Roads) [Internet]. Vol Available from: 4. Cairns J, Warren J, Garthwaite K, Greig G, Bambra C. Go slow: an umbrella review of the effects of 20 mph zones and limits on health and health inequalities. J Public Health (Bangkok) [Internet] Sep 1 [cited 2018 Feb 1];37(3): Available from: 5. Bristol City Council. A Safe Systems Approach to Road Safety in Bristol [Internet] [cited 2018 Feb 4]. Available from: afety+in+bristol.pdf 6. Department for Transport U. Setting Local Speed Limits NICE. Unintentional injuries on the road : interv interventions entions for under 15s. 2010;(November). 8. (NICE) NI for H and CE. Physical activity and the environment: Public health guidance Burns A, Johnstone N, Macdonald N. 20MPH SPEED REDUCTION INITIATIVE [Internet]. [cited 2018 Feb 4]. Available from: Department of Transport. Interim evaluation of the implementation of 20mph speed limits in Portsmouth [Internet] Available from: /rsrr/theme4/interimeval20mphspeedlimits.pdf 11. Bristol City Council. 20mph Speed Limit Pilot Areas: Monitoring Report Bath & North East Somerset Council. Setting Local Speed Limits A review of recent installations of 20mph area schemes ( signage only ). 13. Lutz M. Air quality management in Berlin : tools, challenges and solutions. 2014;(December). 14. Group T and EA. An evaluation of the estimated impacts on vehicle emissions of a 20mph speed restriction in central London [Internet] Available from: Department for Transport. Guidance on Road Classification and the Primary Route Network 2 [Internet] [cited 2018 Feb 4]. Available from: 26
29 ad-classification-guidance.pdf 16. Department for Transport. Accident and casualty costs (RAS60) [Internet] [cited 2018 Feb 1]. Available from: Davis A, Tapp A. The 2017 survey of attitudes and claimed behaviours towards 20mph limits in GB and Bristol

30 7 Appendices 7.1 Appendix A 28
31 29
20mph. We want to make Edinburgh a better and safer place to live, work and play.
 20mph CREATING A BETTER SAFER EDINBURGH We want to make Edinburgh a better and safer place to live, work and play. That s why on 13 January 2015 Councillors approved a new speed limit network for Edinburgh
Speed Limit Policy Isle of Wight Council
 APPENDIX B Speed Limit Policy Isle of Wight Council 2009 Contents Section 1 Introduction 1.1 Links with the Local Transport Plan Section 2 Speed Limits on Urban Roads and Residential Areas 2.1 20mph Limits
Westminster s Joint Health and Wellbeing Strategy
 Westminster s Joint Health and Wellbeing Strategy 2013 2016 Response from Sustrans General comments From a strategic perspective, Sustrans welcomes the Health and Wellbeing Strategy s focus on encouraging
Frequently asked questions (FAQ) about a borough-wide 20 mph speed limit
 about a borough-wide 20 mph speed limit") Frequently asked questions (FAQ) about a borough-wide 20 mph speed limit February 2013 1. Is it safer to drive at 20 mph? Yes. According the Royal Society for Prevention of Accidents (RoSPA) if a pedestrian
Frequently asked questions (FAQ) about a borough-wide 20 mph speed limit February 2013 1. Is it safer to drive at 20 mph? Yes. According the Royal Society for Prevention of Accidents (RoSPA) if a pedestrian
Introduction. Summary conclusions. Recommendation
 20 s Plenty for Us calls for Hampshire County Council to withdraw its report on the 20mph Pilot Programme and to press ahead with rolling out 20mph in residential streets across the county. Introduction
Rural Economy and Connectivity Committee. Restricted Roads (20mph Speed Limit) (Scotland) Bill: Key Themes Arising from the Online Survey
 (Scotland) Bill: Key Themes Arising from the Online Survey") Rural Economy and Connectivity Committee Restricted Roads (20mph Speed Limit) (Scotland) Bill: Key Themes Arising from the Online Survey Introduction On Friday 9 November 2018, the Rural Economy and Connectivity
Rural Economy and Connectivity Committee Restricted Roads (20mph Speed Limit) (Scotland) Bill: Key Themes Arising from the Online Survey Introduction On Friday 9 November 2018, the Rural Economy and Connectivity
4. WIDER SOCIAL DETERMINANTS OF HEALTH
 4. WIDER SOCIAL DETERMINANTS OF HEALTH 4.6 Road Safety Road safety affects all road users; pedestrians, cyclists and vehicle drivers and passengers. This section describes the impact of road safety and
Setting Local Speed Limits. A review of recent installations of 20mph area schemes (signage only).
.") Setting Local Speed Limits A review of recent installations of 20mph area schemes (signage only). 1 Setting Local Speed Limits A review of recent 20mph area scheme installations. Contents. Background to
Setting Local Speed Limits A review of recent installations of 20mph area schemes (signage only). 1 Setting Local Speed Limits A review of recent 20mph area scheme installations. Contents. Background to
SOMERSET ROAD SAFETY PARTNERSHIP CASUALTY REVIEW Working together to reduce casualties
 CASUALTY REVIEW 27-29 Working together to reduce casualties 3 CONTENTS 1 EXECUTIVE SUMMARY 2 2 INTRODUCTION: CASUALTY REDUCTION TARGETS 3 3 COLLISION AND CASUALTY TRENDS 4 4 KILLED AND SERIOUSLY INJURED
BRIEFING PAPER 29 FINDINGS SERIES. Children s travel to school are we moving in the right direction?
 BRIEFING PAPER 29 FINDINGS SERIES Children s travel to school are we moving in the right direction? February 2011 FINDINGS SERIES 29 BRIEFING PAPER KEY FINDINGS National surveys show that while the level
Lincolnshire JSNA: Road Traffic Accidents
 Road Traffic Accidents What do we know? Summary A higher proportion of road traffic collisions in Lincolnshire result in death compared to other areas. This may be due to the types of road in the County
20mph Speed Limit Trial Warrington Borough Council. Mark Tune Traffic Management & Road Safety Manager
 20mph Speed Limit Trial Warrington Borough Council Mark Tune Traffic Management & Road Safety Manager Benefits of reduced speed Reduced number and severity of accidents More cycle friendly environment
Cycle traffic and the Strategic Road Network. Sandra Brown, Team Leader, Safer Roads- Design
 Cycle traffic and the Strategic Road Network Sandra Brown, Team Leader, Safer Roads- Design Highways England A Government owned Strategic Highways Company Department for Transport Road Investment Strategy
BOROUGH-WIDE SPEED LIMIT CONSULTATION
 BOROUGH-WIDE SPEED LIMIT CONSULTATION The Council proposes to reduce the speed limit on all roads to 20mph (except the A316 and A205 which are under Transport for London red route control) The aims of
GD 0043/18 ACTIVE TRAVEL STRATEGY
 GD 0043/18 ACTIVE TRAVEL STRATEGY 2018-2021 May 2018 Minister s Introduction There is strong evidence that regular physical activity reduces the risk of a range of health conditions. The best way to increase
2. Context. Existing framework. The context. The challenge. Transport Strategy
 Transport Strategy Providing quality connections Contents 1. Introduction 2. Context 3. Long-term direction 4. Three-year priorities 5. Strategy tree Wellington City Council July 2006 1. Introduction Wellington
Road Safety Partnership
 Cambridgeshire and Peterborough Road Safety Partnership Cambridgeshire and Peterborough Road Safety Partnership Introduction Road accidents can have a devastating impact not only for the people directly
Background. The scale of the problem. The scale of the problem. Road Safety in London, the statistics. 280 Fatalities from road crashes in 2002
 Impacts: 8th Intercontinental Conference - Geneva Thursday, 13 November 23 European Road Safety Programme Implementation by Cities AN OVERVIEW OF THE LONDON PICTURE Lukman Agboola Senior Road Safety Engineer
TEST OF ENGLISH FOR EDUCATIONAL PURPOSES
 TEST OF ENGLISH FOR EDUCATIONAL PURPOSES Practice Test 2 SOURCE BOOKLET University of Reading 2007-12 Questions relating to the following text are in the Task Booklet University of Reading 2007-12 page
Walking and Cycling Action Plan Summary. A Catalyst for Change The Regional Transport Strategy for the west of Scotland
 Walking and Cycling Action Plan Summary A Catalyst for Change The Regional Transport Strategy for the west of Scotland 2007-2021 Strathclyde Partnership for Transport Contents Purpose...2 Issues, Constraints
20mph Research Study. Process and Impact Evaluation Headline Report. November Report by Atkins, AECOM, and Professor Mike Maher (UCL)
") 20mph Research Study Process and Impact Evaluation November 2018 Report by Atkins, AECOM, and Professor Mike Maher (UCL) Notice This document and its contents have been prepared by Atkins, AECOM and Professor
20mph Research Study Process and Impact Evaluation November 2018 Report by Atkins, AECOM, and Professor Mike Maher (UCL) Notice This document and its contents have been prepared by Atkins, AECOM and Professor
RESTRICTED ROADS (20 MPH SPEED LIMIT) (SCOTLAND) BILL. 1. Is reducing the speed limit to 20mph the best way of achieving the aims of the Bill?
 (SCOTLAND) BILL. 1. Is reducing the speed limit to 20mph the best way of achieving the aims of the Bill?") RURAL ECONOMY AND CONNECTIVITY COMMITTEE RESTRICTED ROADS (20 MPH SPEED LIMIT) (SCOTLAND) BILL SUBMISSION FROM CYCLE STIRLING Questions 1. Is reducing the speed limit to 20mph the best way of achieving
RURAL ECONOMY AND CONNECTIVITY COMMITTEE RESTRICTED ROADS (20 MPH SPEED LIMIT) (SCOTLAND) BILL SUBMISSION FROM CYCLE STIRLING Questions 1. Is reducing the speed limit to 20mph the best way of achieving
This objective implies that all population groups should find walking appealing, and that it is made easier for them to walk more on a daily basis.
 Walking for life The Norwegian Walking Strategy Guro Berge Norwegian public Roads Administration "Walking for life" is the slogan for the National Walking Strategy that is now being formulated in Norway.
The Scottish Collaboration for Public Health Research and Policy; and 20mph speed limits
 The Scottish Collaboration for Public Health Research and Policy; and 20mph speed limits Dr Ruth Jepson and Dr John McAteer Wellington, Jan 2018 SCPHRP* Scottish Collaboration for Public Health Research
British Road Safety: Presentation 28/10/2009 by Duncan Price, Deputy Head, Road User Safety Division
 British Road Safety: Presentation 28/10/2009 by Duncan Price, Deputy Head, Road User Safety Division New British Road Safety Strategy Vulnerable Road Users Driving During Business Delivery with Local Organisations
20mph in Edinburgh. Phil Noble
 20mph in Edinburgh Phil Noble Structure of Presentation Where have we come from? South Edinburgh Pilot results Citywide 20 - strategy, consultation, implementation IMAGE? 2 20mph zones and pilot area (2012)
EUROPEAN TRANSPORT CONFERENCE 2006 ROAD SAFETY IN LONDON PAST SUCCESSES AND FUTURE INNOVATIONS
 EUROPEAN TRANSPORT CONFERENCE 26 ROAD SAFETY IN LONDON PAST SUCCESSES AND FUTURE INNOVATIONS Mr Chris Lines Head of the London Road Safety Unit, Transport for London 1. PAST SUCCESSES Road safety is a
Central London Bus Services Review
 Central London Bus Services Review Sustrans response to Transport for London November 2018 About Sustrans Sustrans is the charity making it easier for people to walk and cycle. We are engineers and educators,
Delivering Accident Prevention at local level in the new public health system
 1 Safety issue accidents don t have to happen Delivering Accident Prevention at local level in the new public health system Part 2: Accident prevention in practice Raise awareness Fact Sheet Road casualties
Traffic Management and Emissions
 Traffic Advisory Leaflet 4/96 April 1996 Traffic Management and Emissions Introduction The Environment Act 1995 requires local authorities to review air quality in their area against targets to be set
Bristol City Council has produced a draft Bristol Transport Strategy document.
 Bristol Transport Strategy Summary Document Introduction Bristol City Council has produced a draft Bristol Transport Strategy document. The Strategy fills a gap in transport policy for Bristol. We have
Safe Routes to School
 Safe Routes to School Paul Osborne, Safe Routes to Schools Project Director, Sustrans The Danesmead Wing, 33 Fulford Cross, York YO10 4PB, UK paulo@sustrans.org.uk Summary Safe Routes to Schools is a practical
PERSONALISED TRAVEL PLANNING IN MIDLETON, COUNTY CORK
 PERSONALISED TRAVEL PLANNING IN MIDLETON, COUNTY CORK Elaine Brick Principal Transport Planner AECOM Abstract Smarter Travel funding was awarded to the Chartered Institute of Highways and Transportation
Safe Speed programme ATTACHMENT 1. Randhir Karma, Group Manager Network Management and Safety
 Safe Speed programme ATTACHMENT 1 Randhir Karma, Group Manager Network Management and Safety 1 Why Safe Speeds? AT s strategic context National guidance AT has embraced Vision Zero principles and recognises
CASUALTY REVIEW
 SOMERSET HEADINGROAD SAFETY PARTNERSHIP CASUALTY REVIEW 22-27 IMPROVING ROAD SAFETY WORKING TOGETHER TO REDUCE CASUALTIES HEADING HEADING CONTENTS 3 1. EXECUTIVE SUMMARY........................................
Active Travel Strategy Dumfries and Galloway
 Active Travel Strategy Dumfries and Galloway Our Active Travel Strategy The agreed Interventions for Dumfries and Galloway Council s Local Transport Strategy includes an action to Develop an Active Travel
Living Streets response to the Draft London Plan
 Living Streets response to the Draft London Plan Contents Living Streets response to the Draft London Plan... 1 About Living Streets... 2 Summary... 2 Consultation response... 3 Chapter 1: Planning London
Reduction of Speed Limit at Approaches to Railway Level Crossings in WA. Main Roads WA. Presenter - Brian Kidd
 Australasian College of Road Safety Conference A Safe System: Making it Happen! Melbourne 1-2 September 2011 Reduction of Speed Limit at Approaches to Railway Level Crossings in WA Radalj T 1, Kidd B 1
Merseyside Road Safety Partnership s Annual Road Traffic Casualties Report 2015
 Merseyside Road Safety Partnership s Annual Road Traffic Casualties Report 2015 Contents 1. Overview of KSI s 2 2. Cyclists 4 3. Motorcyclists 8 4. Senior Road Users 10 5. Pedestrians 14 6. Car Drivers
LEA BRIDGE ROAD - A STREET FOR EVERYONE Public consultation document
 LEA BRIDGE ROAD - A STREET FOR EVERYONE Public consultation document TELL US Bakers Arms to Leyton Green Road (Section D, E, F) Leyton Green Road to Whipps Cross Roundabout (Section G) YOUR VIEWS www.enjoywalthamforest.co.uk
Determining bicycle infrastructure preferences A case study of Dublin
 *Manuscript Click here to view linked References 1 Determining bicycle infrastructure preferences A case study of Dublin Brian Caulfield 1, Elaine Brick 2, Orla Thérèse McCarthy 1 1 Department of Civil,
CHAIR AND MEMBERS CIVIC WORKS COMMITTEE MEETING ON APRIL 25, 2016
 TO: FROM: SUBJECT: CHAIR AND MEMBERS CIVIC WORKS COMMITTEE MEETING ON APRIL 25, 2016 JOHN BRAAM, P. ENG. MANAGING DIRECTOR, ENVIRONMENTAL & ENGINEERING SERVICES AND CITY ENGINEER SCHOOL ZONE SPEED LIMIT
Reflections on our learning: active travel, transport and inequalities
 Reflections on our learning: active travel, transport and inequalities Jill Muirie Glasgow Centre for Population Health Active travel definition Active travel refers to walking, cycling or using some other
London Safety Camera Partnership
 London Safety Camera Partnership Between 2001 and 2003 over 17,000 speed related collisions occurred in London, of which 2,000 people lost their lives or were seriously injured. Excessive and inappropriate
Trends in cyclist casualties in Britain with increasing cycle helmet use
 Trends in cyclist casualties in Britain with increasing cycle helmet use Introduction This analysis is to the year 2000 Later information may be found elsewhere on this site Cycle helmet use in Britain
CASUALTY REVIEW
 SOMERSET HEADINGROAD SAFETY PARTNERSHIP CASUALTY REVIEW 26-28 IMPROVING ROAD SAFETY WORKING TOGETHER TO REDUCE CASUALTIES HEADING HEADING CONTENTS 3 1. EXECUTIVE SUMMARY........................................
Local Highway Panels Members Guide. 2 Speed and Traffic Management
 Local Highway Panels Members Guide 2 Speed and Traffic Management 2 Local Highway Panels (LHP) Members Guide 2016/17 1. Introduction Following the publication of the DfT guidance on setting local speed
Projections of road casualties in Great Britain to 2030
 5 Projections of road casualties in Great Britain to 2030 C G B (Kit) Mitchell and R E Allsop Published March 2014 Contents Section 1 Introduction 4 Section 2 Trends in road casualty rates 6 Section 3
Strategic Director for Environment. Enclosures Appendix A - Option drawings. Jamie Blake- Strategic Director for Environment
 Chipping Barnet Area Committee 9 July 2018 Title Report of Wards Status Urgent Key Cromer Road Request for 20mph Zone Strategic Director for Environment High Barnet Public No No Enclosures Appendix A -
Bramshaw traffic calming proposal
 - 1 - Bramshaw traffic calming proposal Initial options appraisal report July 2017 - 2-1. Project background Hampshire Country Council has commissioned Test Valley Borough Council to carry out an option
Trial 3: Interactions Between Autonomous Vehicles and Pedestrians and Cyclists
 Trial 3: Interactions Between Autonomous Vehicles and Pedestrians and Cyclists What is VENTURER? VENTURER is a 5m research and development project funded by government and industry and delivered by Innovate
WEST YORKSHIRE LTP CYCLE PROSPECTUS
 WEST YORKSHIRE LTP CYCLE PROSPECTUS The West Yorkshire Ambition: To be recognised as a great place for safe cycling, inspiring more people to cycle more often. INTRODUCTION Cycling is low cost, environmentally
Cycling and Walking Investment Strategy & Local Cycling and Walking Infrastructure Plans
 Cycling and Walking Investment Strategy & Local Cycling and Walking Infrastructure Plans 1 Investing in cycling and walking contributes to a broad range of cross-cutting policy objectives Cycling and walking
An evaluation of pedestrian countdown timers in the Sydney CBD
 An evaluation of pedestrian countdown timers in the Sydney CBD Cleaver, M. A., Hislop, J., de Roos, M. P., Fernandes, R., Prendergast, M. (NSW Centre for Road Safety) Brisbane, G., Levasseur, M., McTiernan,
Understanding Road Safety. A presentation to the Chislehurst Society by Roger Lawson April 2016 Alliance of British Drivers
 Understanding Road Safety A presentation to the Chislehurst Society by Roger Lawson April 2016 Alliance of British Drivers Agenda Road Casualty Definitions. National Casualty Trends. The Major Contributions
 Siła-Nowicka, K. (2018) Analysis of Actual Versus Permitted Driving Speed: a Case Study from Glasgow, Scotland. In: 26th Annual GIScience Research UK Conference (GISRUK 2018), Leicester, UK, 17-20 Apr
Chicane Schemes. Traffic Advisory Leaflet 12/97 December Introduction
 Traffic Advisory Leaflet 12/97 December 1997 Chicane Schemes Introduction Traffic Advisory Leaflet 9/94 "Horizontal Deflections" reported on the results of track trials carried out by the Transport Research
Nottingham Cycle City Frequently Asked Questions
 Nottingham Cycle City Frequently Asked Questions About the scheme How much money is to be spent on cycling? And where is the money from? We have 6.1 million in Growth Fund which we will be investing directly
Update June 2018 OUR 2017 PUBLIC ENGAGEMENT
 Update June 2018 Hi, Let s Get Wellington Moving (LGWM) is developing a Recommended Programme of Investment (RPI) that meets our programme objectives and supports the city s and region s growth. As part
Low Level Cycle Signals used as repeaters of the main traffic signals Appendices
 Low Level Cycle Signals used as repeaters of the main traffic signals Appendices Track trial report This document contains the appendices to accompany the report from the first sub-trial of a larger track
// RoWSaF Making roads safer for road workers rowsaf.org.uk. RoWSaF Strategy 2015
 // RoWSaF Making roads safer for road workers rowsaf.org.uk Working in partnership with clients, industry and key stakeholders to improve worker safety Often working close to live traffic, activities conducted
Managed Motorways All Lanes Running
 Managed Motorways All Lanes Running All-Purpose Trunk Roads (APTR)/Dual 3- lane Motorway (D3M) Analysis and Hazard Assessment 1039092-ATA-035 Date: 8 May 2012 Version: 1.0 MMFD-ATA-035 - Issue 1 0 08-05-12.doc
Safer Roads Humber Annual Safety Camera Progress Report April 2010 March 2011
 Safer Roads Humber Annual Safety Camera Progress Report April 2010 March 2011 www.saferroadshumber.com Published March 2012 CONTENTS Safer Roads Humber Camera Performance Summary... 1 Safer Roads Humber
Route User Intercept Survey Report
 Route User Intercept Survey Report Hills Road, Cambridge Fieldwork: October 2016 Report published: December 2016 1 About Sustrans Sustrans makes smarter travel choices possible, desirable and inevitable.
March Maidstone Integrated Transport Strategy Boxley Parish Council Briefing Note. Context. Author: Parish Clerk 2 March 2016
 Context. Author: Parish Clerk 2 The Draft Integrated Transport Policy (DITS) sets out a vision and objectives, and identifies a detailed programme of interventions to support the Maidstone Borough Local
TYPES OF CYCLING. Figure 1: Types of Cycling by Gender (Actual) Figure 2: Types of Cycling by Gender (%) 65% Chi-squared significance test results 65%
 Figure 2: Types of Cycling by Gender (%) 65% Chi-squared significance test results 65%") TYPES OF CYCLING 1,980 responses were received to this question (multiple answers were allowed), 727 female (41%) and 1,242 (71%) from male respondents. The most common responses for both genders were
TYPES OF CYCLING 1,980 responses were received to this question (multiple answers were allowed), 727 female (41%) and 1,242 (71%) from male respondents. The most common responses for both genders were
Briefing Paper #1. An Overview of Regional Demand and Mode Share
 2011 Metro Vancouver Regional Trip Diary Survey Briefing Paper #1 An Overview of Regional Demand and Mode Share Introduction The 2011 Metro Vancouver Regional Trip Diary Survey is the latest survey conducted
Kings Road, Herne Bay: Proposed Crash Remedial Measure
 Kings Road, Herne Bay: Proposed Crash Remedial Measure To: Canterbury Joint Transportation Board 17 February 2015 By: Classification: Ward: Tim Read - Head of Transportation Unrestricted Herne Bay Summary:
Report to Cabinet. 18 May 2016
 Agenda Item 8 Report to Cabinet 18 May 2016 Subject: Presenting Cabinet Member: Proposed CCTV Enforcement of Traffic Contraventions in a Bus Lane (Key Decision Ref. No. HE030) Highways and Environment
Using a Mixed-Method Approach to Evaluate the Behavioural Effects of the Cycling City and Towns Programme
 1 of 25 Using a Mixed-Method Approach to Evaluate the Behavioural Effects of the Cycling City and Towns Programme Kiron Chatterjee (Centre for Transport & Society, UWE) with acknowledgements to research
CAMPAIGN ASSETS THINK CYCLIST STAKEHOLDER TOOLKIT
 STAKEHOLDER TOOLKIT IN TOUCH DUCTION The Department for Transport s campaign provides road safety information for road users. Our aim is to encourage safer behaviour to reduce the number of people killed
Understanding school road safety
 Understanding school road safety 1. The purpose of these guidelines The safety of students travelling to and from school is one of the most important issues for school communities. Road environments around
Regional Cycle Programme Update
 Agenda Item 10 (ii) Regional Cycle Programme Update Glossary Auckland Council Auckland Transport Cycle Action Auckland New Zealand Transport Agency Regional Cycle Network (AC) (AT) (CAA) (NZTA) (RCN) Executive
Building An Active Travel Future for Northern Ireland Consultation Response
 Building An Active Travel Future for Northern Ireland Consultation Response Belfast Healthy Cities welcomes the opportunity to comment on the Draft Active Travel Strategy. About Belfast Healthy Cities:
Cycle journeys on the Anderston-Argyle Street footbridge: a descriptive analysis. Karen McPherson. Glasgow Centre for Population Health
 Cycle journeys on the Anderston-Argyle Street footbridge: a descriptive analysis Karen McPherson Glasgow Centre for Population Health March 2017 Key points: There were 116,334 cycle journeys made using
University of Leeds Travel Plan
 University of Leeds Travel Plan 2015-2018 Contents 1: Introduction 1.1 What is a Travel Plan? 1.2 Why do we need one? 1.3 Sustainability Strategy 2: Overview 2.1 The bigger picture 2.2 The City scale 2.3
The Effect of 20 mph zones on Inequalities in Road Casualties in London
 The Effect of 20 mph zones on Inequalities in Road Casualties in London A report to the London Road Safety Unit Chris Grundy, Rebecca Steinbach, Phil Edwards, Paul Wilkinson, Judith Green London School
Traffic Calming Regulations
 Traffic Advisory Leaflet 7/93 August 1993 Traffic Calming Regulations Introduction Traffic calming can help drivers to make their speeds appropriate to local conditions, through measures which are self-enforcing.
An intelligent approach that works for all Brake Fleet Safety Conference 2016 Nick O Donnell, Assistant Director Strategic Transport, Ealing Council
 An intelligent approach that works for all Brake Fleet Safety Conference 2016 Nick O Donnell, Assistant Director Strategic Transport, Ealing Council REGENERATION & HOUSING Background Every year around
London Cycle Network Annual Report 2000
 London Cycle Network Annual Report 2000 A cycle network for London by 2005 A cycle network for London by 2005 The London Cycle Network will: provide local links between residential neighbourhoods, railway
ROSEE RSA/RSI Introduction courses ROSEE Speed Management courses
 ROSEE RSA/RSI Introduction courses ROSEE Speed Management courses ROSEE PP8 UL FGG-PTI & WP4 leader Kostanjsek, Jure & Lipar, Peter Munchen, June 6, 2013 ROSEE WP4: Safe Roads and Mobility RSA/RSI course
Napier City road trauma for Napier City. Road casualties Estimated social cost of crashes* Major road safety issues.
 ISSN 1176-841X July 25 Land Transport New Zealand has prepared this road safety issues report. It is based on reported crash data and trends for the 2 24 period. The intent of the report is to highlight
the Ministry of Transport is attributed as the source of the material
 Cyclists 2015 Disclaimer All reasonable endeavours are made to ensure the accuracy of the information in this report. However, the information is provided without warranties of any kind including accuracy,
DRIVING ON THE HARD SHOULDER A SAFETY ASSESSMENT ABSTRACT
 DRIVING ON THE HARD SHOULDER A SAFETY ASSESSMENT P LOUW and M SINCLAIR Address of both authors: Department of Civil Engineering University of Stellenbosch, Private bag X1, Matieland, 7602 Emails: Perot
ANNEX1 The investment required to achieve the Government s ambition to double cycling activity by 2025
 ANNEX1 The investment required to achieve the Government s ambition to double cycling activity by 2025 May 2016 About Sustrans Sustrans makes smarter travel choices possible, desirable and inevitable.
Cyclists at road narrowings
 Traffic Advisory Leaflet 1/97 February 1997 Cyclists at road narrowings Introduction Traffic calmed streets can offer a more attractive environment for cycling, by reducing motor vehicles speeds to a level
Response of the Road Haulage Association to Department for Transport. Cycling and Walking Investment Strategy safety review: Call for Evidence
 Response of the Road Haulage Association to Department for Transport Cycling and Walking Investment Strategy safety review: Call for Evidence Summary 23 May 2018 1. The Department for Transport has stated
TRAFFIC ADVISORY LEAFLET
 TRAFFIC ADVISORY LEAFLET 2/04 Rural traffic calming: Bird Lane, Essex INTRODUCTION Many rural communities are concerned about traffic growth and high vehicle speeds. Local authorities have to balance the
Launceston's Transport Futures. Greater travel options for the people of Launceston
 Launceston's Transport Futures Greater travel options for the people of Launceston Final Draft 13 Jan 2014 1 Page Number Executive summary 3 What is Transport Futures? 4 Vision 6 Economy, access and liveability
Traffic calming regulations (Scotland)
") Traffic Advisory Leaflet 11/94 December 1994 Traffic calming regulations (Scotland) Introduction Traffic calming can help drivers to make their speeds appropriate to local conditions, through measures
Traffic Advisory Leaflet 11/94 December 1994 Traffic calming regulations (Scotland) Introduction Traffic calming can help drivers to make their speeds appropriate to local conditions, through measures
Appendix A Type of Traffic Calming Measures Engineering Solutions
 Appendix A Type of Traffic Calming Measures Engineering Solutions PHYSICAL MEASURES Central Hatching The major consideration of this feature is that, these markings can only be laid down the centre of
w w w. r o a d s a f e t y a n a l y s i s. o r g
 w w w. r o a d s a f e t y a n a l y s i s. o r g Cycling Casualties in Birmingham Birmingham City Council Road Safety Team Aim: identify cycling casualties in Birmingham and compare results with Hagley
Crash Patterns in Western Australia. Kidd B., Main Roads Western Australia Willett P., Traffic Research Services
 Crash Patterns in Western Australia Kidd B., Main Roads Western Australia Willett P., Traffic Research Services Abstract Examination of crash patterns is one way of identifying key factors on which focus
Transport Research Laboratory Creating the future of transport
 Transport Research Laboratory Creating the future of transport PUBLISHED PROJECT REPORT PPR704 TfL Cycle Facility Trials: Alternative Separation Methods for Cycle Lanes G Beard Prepared for: Project Ref:
1 Road and HGV danger in London. Hannah White, Freight & Fleet Programme Manager November 2017
 1 Road and HGV danger in London Hannah White, Freight & Fleet Programme Manager November 2017 2 London and its transport networks London: 8.6m residents + 30m visitors 30m journeys per day 6.3m by bus
Active travel and economic performance: A What Works review of evidence from cycling and walking schemes
 1 Making the economic case for active travel Active travel and economic performance: A What Works review of evidence from cycling and walking schemes Active Travel Toolkit Slide Pack July 2017 Active travel
Aiming for Zero Road Worker Safety. Mark Pooley Highways Agency Road Worker Safety Programme Manager Monday 11 June 2012
 Aiming for Zero Road Worker Safety Mark Pooley Highways Agency Road Worker Safety Programme Manager Monday 11 June 2012 1. Road Worker Safety Strategy. RWS Strategic Target No. 1: achieve a substantial
Public health: a new priority in transport policy. Philip Insall Director, International, Sustrans
 Public health: a new priority in transport policy Philip Insall Director, International, Sustrans Transport policy is bad for public health Europeans are inactive and unhealthy Two thirds of the adult
Glasgow City Council. Evaluation of Glasgow s School Bus Signage Pilot - Final Report
 Glasgow City Council Evaluation of Glasgow s School Bus Signage Pilot - Final Report September 2015 Contents Executive Summary... i 1. Introduction... 1 2. Driver experiences... 5 3. Bus company experiences...
1. UK policy context
 1. UK policy context 2. Political leadership The Mayor s Vision My vision to create Healthy Streets aims to reduce traffic, pollution and noise, create more attractive, accessible and people-friendly streets