The Bay Bridge Corridor Congestion Study
|
|
|
- Ruby Miller
- 5 years ago
- Views:
Transcription
1 Bay Bridge Corridor Congestion Study Tony Bruzzone, Arup TJPA Board Nov 1, 2010 Funded by AC Transit/Federal Transit Administration (FTA) Contracted with the Transbay Joint Powers Authority (TJPA) Stakeholders: Caltrans, ACCMA, SFCTA, AC Transit, BART, SFMTA, TJPA

2 The Bay Bridge Corridor Congestion Study A first look at the Corridor s projected freeway performance between the East Bay and San Francisco East Bay to San Francisco during the morning commute Investigate if the existing bus/hov priority measures at the Bay Bridge toll plaza will continue to allow buses to bypass queues as conditions worsen in the future San Francisco South-of-Market (SoMa) to the East Bay during the afternoon commute Investigate how to better manage Bay Bridge bound traffic that queues on local SoMa streets during the afternoon
3 Bay Bridge Corridor East Bay residents commute to San Francisco using four modes Approximately 130,000 commuters; 42,000 AM peak hour trips
4 East Bay Commuters Needed to Fill These Jobs

5 Auto Demand Already Exceeds Capacity Auto demand on the Bay Bridge already exceeds capacity and conditions will only worsen
6 But the Corridor is Close to Exceeding Capacity Additional Capacity with new Transbay Terminal Demand exceeds total capacity in the Bay Bridge Corridor Current Latent Capacity (BART, AC Transit) +20,000 additional peak hour trips expected by 2035

 Bus deck")

7 The Challenge in the Bay Bridge Corridor How can we increase capacity in the Corridor to serve 20,000 additional peak hour trips? BART Expects to increase peak hour capacity by 8,000 12,000 riders Additional bus service to the new Transbay Terminal Center (TTC) Bus deck can handle over 300 buses in the peak hour Could serve upwards of 15,000 20,000 additional riders The TTC requires reliable access from the East Bay so it can be fully utilized

8 Bay Bridge Constraints Queuing at the Bay Bridge toll plaza and metering lights lasts from 6:30 to 10:00 AM or later Buses and HOVs currently use bypass lanes on most days
 the metering lights turn on Metering lights activated around 6:30 AM Queues quickly spill back from the stop bar to the plaza for")

9 Bay Bridge Toll Plaza and Metering Lights Metering light activation Detectors at the base of the bridge measure traffic volumes every minute When volume exceeds capacity of the Bridge (approximately 9,300 vph) the metering lights turn on Metering lights activated around 6:30 AM Queues quickly spill back from the stop bar to the plaza for FasTrak and cash lanes Rate is adjusted as demand and queues upstream of the toll plaza change Metering Lights Toll Plaza West Grand HOV I-880 HOV I-80 HOV I-580 HOV Distribution Structure Extent of vehicle queuing on a normal day Queues do not typically extend back to the distribution structure Most HOV / transit bypass lanes stay clear
10 The Challenge in the Bay Bridge Corridor However, an increase in future traffic congestion could block the HOV bypass lanes that buses use to jump the toll plaza queues This could degrade bus operations and limit transit capacity
11 Study Limitations Improvements recommended in the study have undergone a basic feasibility review by Arup s engineering staff However, they are considered conceptual at this stage of the analysis (further study is required) Congestion pricing is not considered BART capacity is not constrained The effects of induced demand are not considered
12 Study Approach Build two separate peak period VISSIM microsimulation models to analyze the traffic and transit constraints along the corridor Calibrated to 2009 traffic; forecast to 2035 volumes (about 0.42% annual increase). Analyzed no project, increased green metering and several improvement options.
13 Bay Bridge AM Model Performance Measures Congestion The length of the Toll Plaza queue should not extend beyond the distribution structure Total vehicle-hours of delay and person-hours of delay in each 2035 improvement scenario should be less than the 2020 and 2035 No Project condition Transit Travel Transit speeds should average not less than 42 miles-per hour (mph) between the distribution structure and the TTC Notes: The distance from the distribution structure to the TTC is approximately seven miles. A bus traveling at 42 mph will cover this distance in about 10 minutes. Transit Reliability No individual peak period transit trip should exceed 14 minutes between the distribution structure and the TTC.
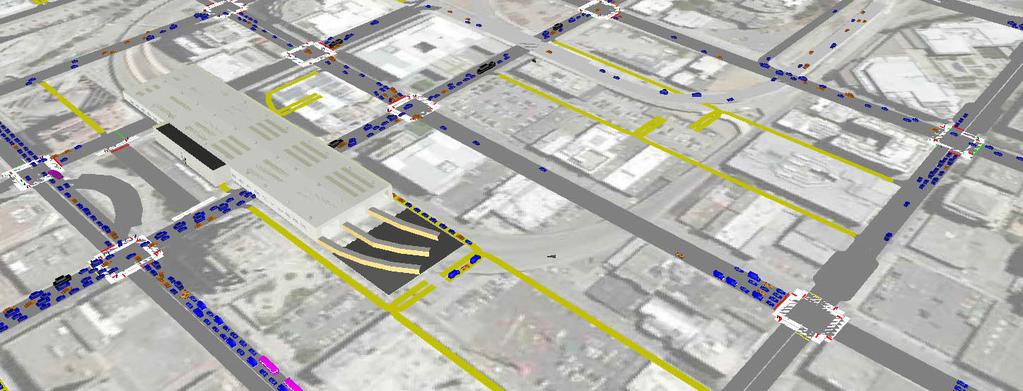
14 Bay Bridge AM Model Calibrated Model Queues 7:00 AM 8:00 AM


15 Bay Bridge AM No Project VISSIM Video
16 Bay Bridge Physical Improvements Physical Improvements
17 Bay Bridge Improvements Contraflow Lane
 Lower Deck (to")

18 Bay Bridge Improvements SF Exit Upper Deck (to SF) Lower Deck (to East Bay) Contraflow off ramp to SF Essex St. on ramp Bus off ramp to Transbay
19 Bay Bridge Improvements Cost Estimates (add 25% for contingencies) Improvement Option Low Range Cost High Range Cost Core Items (Contraflow Lane, access from I-80/580/880, HOV extensions) $40,300,000 $73,400,000 East Bay Options West Grand Option A $12,300,000 $19,700,000 West Grand Option B $8,200,000 $19,700,000 West Grand Option C $17,500,000 $28,000,000 West Grand Option D $31,700,000 $60,300,000 San Francisco Options Exit Option A/B $25,400,000 $42,900,000 Total Improvement Costs Total Low Range Improvement Cost $73,900,000 Total High Range Improvement Cost $176,700,000 Source: Arup, 2010
20 Bay Bridge AM Model Future Scenario Analysis Performance Measures (8-9AM) Summary Category Measure 2009 Base Year 2020 No Project Target Met? Congestion Toll Plaza queue - Not Beyond Dist Structure Total Vehicle Hrs of Delay Chg from 2009 Base Year (%) Chg from 2035 Base Case (%) 2035 No Project Target Met? 2035 Alternative Metering Target Met? 2035 With Physical Improvements Target Met? 2035 With Reduced Set of Physical Improvements Target Met? Pass Pass Fail Pass Pass Pass 2,350 2,725 3,208 3,680 2,168 2,288 N/A 16% 37% 57% -8% -3% N/A N/A N/A 15% -32% -29% Total Person Hrs of Delay Chg from 2009 Base Year (%) Chg from 2035 Base Case (%) 3,583 3,937 4,720 6,256 3,254 3,426 N/A 10% 32% 75% -9% -4% N/A N/A N/A 33% -31% -27% Transit Travel Transit Reliability Transit speeds should average not less than 42 mph (measured from I- 80) No individual peak period transit trip should exceed 14 minutes (measured from I-80) 47 mph = Pass 11.5 min = Pass 46 mph = Pass 37 mph = Fail 27 mph = Fail 53 mph = Pass 53 mph = Pass 12 min = Pass 15 min = Fail 20 min = Fail 10 min = Pass 10 min = Pass
21 Bay Bridge AM Summary Bay Bridge corridor is approaching capacity for all modes Capacity for 20,000 additional peak hour trips from the East Bay is required to meet the regional job forecasts Additional bus service to the new Transbay Terminal would provide the necessary capacity But future traffic growth will block bypass lanes, degrade transit operations, and limit bus capacity to San Francisco A contraflow lane with entry/exit improvements would maintain bus operations

22 SoMa PM Analysis Purpose Identify improvements that better manage Bay Bridge queues Keep Bridge queues from blocking transit service Improvements should mesh with AM contraflow project The modeling has limitations and requires additional work beyond this study Large model: 80 intersections, 9 freeway ramps.
23 SoMa PM Analysis Study Area
24 SoMa PM Model: Desired Outcomes The following desired outcomes will become performance measures when the model is further developed Congestion: Bridge queue on 1st Street/ 2nd Street, and Beale should not extend beyond Howard at any time. Bridge queues on 1st Street/2nd Street, and Beale should be reduced in the improvement option (compared to the base alternative). The total vehicle-hours/person-hours of delay should be reduced in the improvement option. Transit Travel: Transit travel times on Mission Street, First Street, 2nd Street and Folsom Street should decrease with any improvement option.

25 SoMa PM Existing Conditions VISSIM


26 SoMa PM Improvements Close Sterling St HOV on-ramp Move HOVs to First Street Grade separation of Harrison & Essex Widen Essex St New connection from First to Folsom (under off-ramp)
27 SoMa PM Model Summary Improvements and circulation changes show promise (results still preliminary) The exit options proposed in the AM contraflow scheme will help afternoon conditions Grade separation and other changes at Essex could provide sufficient queuing capacity during the PM peak hour
28 Next Steps Better understanding of operational issues related to the contraflow lane Survey of Best Practices Transit and overall corridor demand Continue feasibility analysis of improvement options Eastbound analysis Implementation options Further development and refinement of SoMa model
29 Questions Tony Bruzzone Mike Iswalt Report Link:
GEARY BRT SIMULATION VISSIM Calibration and Existing Conditions Results
 GEARY BRT SIMULATION VISSIM Calibration and Existing Conditions Results Geary BRT Citizens Advisory Committee February 17, 2011 www.gearybrt.org Presentation Objectives 1. Overview of modeling process
Dumbarton Transportation Corridor Study. San Francisco Bay ITE November 2016
 Dumbarton Transportation Corridor Study San Francisco Bay ITE November 2016 Dumbarton Corridor Source: Wikipedia 2 Dumbarton Corridor 3 Growth Imbalance Jobs-housing imbalance Major employers driving growth
Freeway ramp intersection study
 Freeway ramp intersection study Supporting Vision Zero: Zero traffic deaths in San Francisco by 2024 Study Goals: Primary Improve Safety Improve Accessibility Secondary Provide Efficient Circulation Accommodate
Freeway Improvement Project
 CapCity Corridor History and Milestones CapCity Partners CapCity Origin and Destination analysis Origins and Destinations Destinations based on Origins North of I-80 8% O & D data prepared by SACOG Origins
Final Technical Report RAILYARD ALIGNMENT AND BENEFITS STUDY. Appendix F: Traffic Analysis, I 280
 Final Technical Report RAILYARD ALIGNMENT AND BENEFITS STUDY Appendix F: Traffic Analysis, I 280 MEMORANDUM Date: To: From: Subject: Susan Gygi, San Francisco Planning Department Dennis Lee and Eric Womeldorff
I-80 Corridor Overhaul
 I-80 Corridor Overhaul MTC Horizon Transformative Projects 15 November, 2018 Megan Gee Arup Vision A rightsized freeway network future-proofs the region for population growth, new mobility innovations,
Better Market Street Project. Project Update January 15, 2015
 Better Market Street Project Project Update January 15, 2015 Better Market Street Project Area Limits Market Street 2.2 Miles Mission Street Better Market Street Schedule Market Street City s busiest transit
405 Express Lanes General Information & Frequently Asked Questions
 The questions and answers below provide current information on the project to improve Interstate 405 (I-405) in Orange County from State Route 73 to Interstate 605. Why are improvements needed on I-405?
Simulating Street-Running LRT Terminus Station Options in Dense Urban Environments Shaumik Pal, Rajat Parashar and Michael Meyer
 Simulating Street-Running LRT Terminus Station Options in Dense Urban Environments Shaumik Pal, Rajat Parashar and Michael Meyer Abstract The Exposition Corridor transit project is a light rail project
State Road 54/56 Tampa Bay s Northern Loop. The Managed Lane Solution Linking I-75 to the Suncoast Parkway
 State Road 54/56 Tampa Bay s Northern Loop The Managed Lane Solution Linking I-75 to the Suncoast Parkway SUNCOAST PARKWAY Both I 75 and the Suncoast Parkway are planning, or in the process of constructing,
Memorandum. Fund Allocation Fund Programming Policy/Legislation Plan/Study Capital Project Oversight/Delivery Budget/Finance Contract/Agreement Other:
 Memorandum Date: November 20, 2017 To: Transportation Authority Board From: Eric Cordoba Deputy Director Capital Projects Subject: 12/5/17 Board Meeting: San Francisco Freeway Corridor Management Study
modes, the increased roadway capacity is the implied solution, which, in turn, has been shown to lead to more driving (induced demand).
.") CONGESTION MANAGEMEN T PROGRAM DECEMBER, 201 7 EXECUTIVE SUMMARY A. Introduction Every two years, the San Francisco County Transportation Authority (SFCTA) prepares the San Francisco Congestion Management
CONGESTION MANAGEMEN T PROGRAM DECEMBER, 201 7 EXECUTIVE SUMMARY A. Introduction Every two years, the San Francisco County Transportation Authority (SFCTA) prepares the San Francisco Congestion Management
Washington DC Section of ITE Project Briefing
 Washington DC Section of ITE Project Briefing November 5, 2015 Renée Hamilton, VDOT, Deputy District Administrator I-66 Outside the Beltway Improvement Area Project Location Virginia 2 Purpose and Need
EXECUTIVE SUMMARY... vii 1 STUDY OVERVIEW Study Scope Study Area Study Objectives
 Contents EXECUTIVE SUMMARY... vii 1 STUDY OVERVIEW... 1-1 1.1 Study Scope... 1-1 1.2 Study Area... 1-1 1.3 Study Objectives... 1-3 2 EXISTING CONDITIONS... 2-1 2.1 Existing Freeway Conditions... 2-4 2.1.1
modes, the increased roadway capacity is the implied solution, which, in turn, has been shown to lead to more driving (induced demand).
.") EXECUTIVE SUMMARY A. Introduction The San Francisco Congestion Management Program (CMP) is a biennial program conducted in accordance with state law to monitor congestion and adopt plans for mitigating
EXECUTIVE SUMMARY A. Introduction The San Francisco Congestion Management Program (CMP) is a biennial program conducted in accordance with state law to monitor congestion and adopt plans for mitigating
LOOP 360 IMPROVEMENT STUDY
 LOOP 360 IMPROVEMENT STUDY Overview and Preliminary Analysis August 2015 1 STUDY PROCESS 2 Study Background Loop 360 serves a wide range of users, including residents, businesses, bicyclists, and commuters
DULLES AREA TRANSPORTATION ASSOCIATION (DATA) February 18, Susan Shaw, P.E., VDOT, Megaprojects Director
 February 18, Susan Shaw, P.E., VDOT, Megaprojects Director") DULLES AREA TRANSPORTATION ASSOCIATION (DATA) February 18, 2015 Susan Shaw, P.E., VDOT, Megaprojects Director I-66 Corridor Conditions Steady population growth Employment growth in activity centers Congestion
DULLES AREA TRANSPORTATION ASSOCIATION (DATA) February 18, 2015 Susan Shaw, P.E., VDOT, Megaprojects Director I-66 Corridor Conditions Steady population growth Employment growth in activity centers Congestion
Central Freeway and Octavia Circulation Study
 Central Freeway and Octavia Circulation Study Final Report Plans and Programs Committee San Francisco County Transportation Authority September 18, 2012 Presentation Outline Background and Study Purpose
Durham Region Long Term Transit Strategy
 Durham Region Long Term Transit Strategy An adaptive, safe, reliable, frequent, accessible and desirable transit system that shapes and connects Durham Region and beyond in an economically and environmentally
3.0 PROJECT DESCRIPTION
 The following section of the Draft EIR contains a description of the proposed Elk Grove Boulevard/SR 99 Interchange Modification project, consistent with the requirements of CEQA Guidelines Section 15124.
TRANSBAY JOINT POWERS AUTHORITY
 THIS STAFF REPORT COVERS CALENDAR ITEM NO.: 8 FOR THE MEETING OF: April 19, 2007 TRANSBAY JOINT POWERS AUTHORITY BRIEF DESCRIPTION: This staff report provides the status of a planning feasibility study
Highway 217 Corridor Study. Phase I Overview Report
 Highway 217 Corridor Study Phase I Overview Report November 3, 24 BACKGROUND AND OVERVIEW Study purpose The Highway 217 Corridor Study is developing multi-modal transportation solutions for traffic problems
Geary Corridor Bus Rapid Transit
 Geary Corridor Bus Rapid Transit Near-term Improvements Update SAN FRANCISCO COUNTY TRANSPORTATION AUTHORITY SAN FRANCISCO MUNICIPAL TRANSPORTATION AGENCY Phasing Packages Phase 1 Near-term: Delivers project
APPENDIX S REVISED PAGES OF THE SUPPLEMENTAL TRAFFIC IMPACT ANALYSIS
 APPENDIX S REVISED PAGES OF THE SUPPLEMENTAL TRAFFIC IMPACT ANALYSIS The capacity of the toll plaza was estimated based on data from numerous studies as well as traffic counts conducted at the toll plaza
Geary Corridor Bus Rapid Transit SFMTA Citizens Advisory Committee
 Geary Corridor Bus Rapid Transit SFMTA Citizens Advisory Committee Project Update SAN FRANCISCO COUNTY TRANSPORTATION AUTHORITY SAN FRANCISCO MUNICIPAL TRANSPORTATION AGENCY August 6, 2015 Project Overview
FINAL REPORT DECEMBER 2011
 FINAL REPORT DECEMBER 2011 AKNOWLEDGEMENTS SFMTA Staff Erin Miller, Project Manager Timothy Papandreou Jerry Robbins Pamela Stone Mike Sallaberry Chris Dimeling Emily Drennen Suzanne Chen-Harding San
FALL 2014 WORKSHOPS TAKEAWAYS
 SFMTA WORKSHOP FEEDBACK The SFMTA and partner agencies are continuing to utilize feedback from the Fall 2014 workshops to inform priorities and next steps for the Embarcadero Enhancement Project. Throughout
Orange County Rail-Highway Grade Crossing Safety Enhancement Program. City of San Juan Capistrano April 17, 2012
 Orange County Rail-Highway Grade Crossing Safety Enhancement Program City of San Juan Capistrano April 17, 2012 Orange County Rail-Highway Grade Crossing Safety Enhancement Program (OCX) 52 crossings 8
Data Analysis February to March Identified safety needs from reported collisions and existing travel patterns.
 Welcome! Thank you for participating in today s Valencia Bikeway Improvements workshop. Data Analysis February to March Identified safety needs from reported collisions and existing travel patterns. Initial
Innovative BRT Operating Solutions through a Congested Segment in San Jose
 Innovative BRT Operating Solutions through a Congested Segment in San Jose Michael Iswalt (Corresponding Author) Arup 560 Mission Street, 7th Floor, San Francisco, CA 94103 michael.iswalt@arup.com Phone:
FOLSOM-HOWARD STREETSCAPE OVERVIEW
 FOLSOM-HOWARD STREETSCAPE OVERVIEW SoMa residents should have the same kinds of amenities that other neighborhoods have. The Folsom- Howard Streetscape Project will make SoMa more livable by making it
Data Analysis February to March 2018 Identified safety needs from reported collisions and existing travel patterns. SFMTA Board of
 Welcome! Thank you for participating in today s Valencia Data Analysis February to March 2018 Identified safety needs from reported collisions and existing travel patterns. First Community Event(s) July
TAKOMA METRO STATION
 TKOM METRO STTION Traffic nalysis Technical Memorandum Station Planning in Support of Joint evelopment Job No. 13-FQ165-LN-2 November 213 WSHINGTON METROPOLITN RE TRNSIT UTHORITY (WMT) Takoma Metro Station
Reference number /VP. Lafayette Downtown Congestion Study - Additional Traffic Analysis
 To James Hinkamp and Tony Coe, City of Lafayette Date January 19, 2017 Copies Reference number 243381/VP From Michael Iswalt and Vanessa Peers File reference 4-05 Subject Lafayette Downtown Congestion
Appendix B: Forecasting and Traffic Operations Analysis Framework Document
 Existing Conditions Report - Appendix Appendix B: Forecasting and Traffic Operations Analysis Framework Document This document defines the methodology and assumptions that will be used in the traffic forecasting
Operational Comparison of Transit Signal Priority Strategies
 Operational Comparison of Transit Signal Priority Strategies Revision Submitted on: November, 0 Author: Adriana Rodriguez, E.I Assistant Engineer Parsons Brinckerhoff 0 South Orange Avenue, Suite 00 Orlando,
Model Applications for Oakland Park Boulevard Transit Corridor Study
 Model Applications for Oakland Park Boulevard Transit Corridor Study Southeast Florida FSUTMS Users Group June 13, 2014 Vikas Jain, AICP, GISP FDOT District Four Auditorium 3400 West Commercial Boulevard,
I-66 Corridor Improvements Route 15 to I-495. November 2014
 I-66 Corridor Improvements Route 15 to I-495 November 2014 I-66 Corridor: Haymarket to the Beltway = Park and Ride Lots 2 Purpose and Need Improve multimodal mobility along the I-66 corridor by providing
Scope of the Transit Priority Project
 Transit Planning Committee #1 March 19, 2015 Scope of the Transit Priority Project Review of the 2010 plan Analysis of Transit Priority Measures Preliminary plans for rapid transit Recommendations for
1. Operate along freeways, either in regular traffic lanes, in high-occupancy vehicle (HOV) lanes, or along the shoulders.
 lanes, or along the shoulders.") Most decisions about whether or not to use transit involve time and cost, and most transit services are slower than travel by private vehicle. However, when transit is faster or nearly as fast as travel
Most decisions about whether or not to use transit involve time and cost, and most transit services are slower than travel by private vehicle. However, when transit is faster or nearly as fast as travel
Managed Lanes. Steve Schilke, P.E. Major Projects Unit Head District 1. Illinois Traffic Engineering and Safety Conference October 2016
 Managed Lanes Steve Schilke, P.E. Major Projects Unit Head District 1 Illinois Traffic Engineering and Safety Conference October 2016 Agenda Managed Lanes Projects I-55 (Stevenson Expressway) Express Toll
2.2 TRANSIT VISION 2040 FROM VISION TO ACTION. Emphasize transit priority solutions STRATEGIC DIRECTION
 TRANSIT VISION 2040 FROM VISION TO ACTION TRANSIT VISION 2040 defines a future in which public transit maximizes its contribution to quality of life with benefits that support a vibrant and equitable society,
Arlington Public Schools Thomas Jefferson Site Evaluation Transportation Networks. Thomas Jefferson Working Group Meeting #6 November 10, 2014
 Arlington Public Schools Thomas Jefferson Site Evaluation Transportation Networks Thomas Jefferson Working Group Meeting #6 November 10, 2014 2 3 INTRODUCTION 4 Goal of our work: Identify and assess multi-modal
Task Force Meeting #5, August 3, Prepared by DKS Associates
 Task Force Meeting #5, August 3, 2018 Prepared by DKS Associates Agenda 1. Agenda Review and Meeting #4 Recap 2. Review Project Goal, Data, and Project Ideas 3. Recommendations and Reporting a) Recommended
TRANSIT CENTER DISTRICT. Public Realm
 TRANSIT CENTER DISTRICT Public Realm TJPA CAC December 13, 2016 Today s Presentation Public Realm Projects for opening of TTC + SF Public Works + TTC Public Realm improvements in Rincon/Transit District
Alternatives Public Workshop
 US 1 Express Lanes Project Development & Environment (PD&E) Study Alternatives Public Workshop August 2013 1 Today s Agenda Project Background and Overview Tier 1 Alternatives Development Tier 2 Decision-Making
METHODOLOGY. Signalized Intersection Average Control Delay (sec/veh)
") Chapter 5 Traffic Analysis 5.1 SUMMARY US /West 6 th Street assumes a unique role in the Lawrence Douglas County transportation system. This principal arterial street currently conveys commuter traffic
Chapter 5 Traffic Analysis 5.1 SUMMARY US /West 6 th Street assumes a unique role in the Lawrence Douglas County transportation system. This principal arterial street currently conveys commuter traffic
Los Altos Hills Town Council - June 18, 2015 Palo Alto City Council June 22, AGENDA ITEM #2.B Presentation
 Los Altos Hills Town Council - June 18, 2015 Palo Alto City Council June 22, 2015 AGENDA ITEM #2.B Presentation Previous Presentations Los Altos Hills Town Council in May 2014 and February 2015 Palo Alto
San Francisco Mobility Trends Report 2018
 San Francisco Mobility Trends Report 2018 San Francisco Municipal Transportation Agency Jan 28, 2019 San Francisco, California 2 Table of Contents 2 5 6 7 9 11 12 13 Executive Summary Transit Bicycling
Tunnel Reconstruction South 5 th Street Association October 16, 2018
 Tunnel Reconstruction South 5 th Street Association October 16, 2018 Reconstructing the Tunnel 2 Service During Tunnel Reconstruction April 2019 through July 2020 3 Projected Cross River Travel Paths of
Northbound San Jose Avenue & I-280 Off-Ramp Road Diet Pilot Project
 Project Overview Fed by a two-lane Interstate-280 (I-280) off-ramp, high vehicular volumes and speeds are longstanding issues along San Jose Avenue. Residents in the surrounding neighborhoods have expressed
Figure 1: East West Connector Alignment Alternatives Concept Drawing
 Page 2 of 9 Figure 1: East West Connector Alignment Alternatives Concept Drawing The Montebello Drive extension will run north south and connect Wilsonville Road to the Boones Ferry Road to Brown Road
Regional Transportation Needs Within Southeastern Wisconsin
 Regional Transportation Needs Within Southeastern Wisconsin #118274 May 24, 2006 1 Introduction The Southeastern Wisconsin Regional Planning Commission (SEWRPC) is the official areawide planning agency
Better Market Street Project Update. Urban Forestry Council September 17, 2014
 Better Market Street Project Update Urban Forestry Council September 17, 2014 Project Area Limits Better Market Street Schedule Market Street City s busiest transit corridor Over 85 buses per hour 14 surface
Queensboro Bridge Bus Priority Study: Summary of Recommendations. Presentation to Manhattan Community Board 8 May 4, 2011
 : Summary of Recommendations Presentation to Manhattan Community Board 8 May 4, 2011 1 Overview Study Goal: Identify cost-effective ways to improve bus speed and reliability for local and express buses
Tunnel Reconstruction Brooklyn CB 1 August 14, 2018
 Tunnel Reconstruction Brooklyn CB 1 August 14, 2018 Reconstructing the Tunnel 2 Service During Tunnel Reconstruction April 2019 through July 2020 3 Projected Cross River Travel Paths of Customers The Service
11,000. P.M. Peak Hour Vehicles/Hour 10,000 9,000 8,000. Year
 CONGESTION RELIEF TASK FORCE The problem today With traffic levels hampering downtown circulation, and long delays in west Salem, policy makers are evaluating potential transportation infrastructure, programs,
Welcome! San Jose Avenue Open House August 25, 2015
 Welcome! San Jose Avenue Open House August 25, 2015 Vision Zero The City and County of San Francisco adopted Vision Zero San Francisco Vision Zero High Injury Network as a policy in 2014, committing an
Preliminary Transportation Analysis
 Preliminary Transportation Analysis Goals of a Robust, Multimodal Transportation Network Safe Accessible/Connected Efficient Comfortable Context-Sensitive Motor Vehicle: Continue to analyze the data to
Purpose and Need. Chapter Introduction. 2.2 Project Purpose and Need Project Purpose Project Need
 Chapter 2 Purpose and Need 2.1 Introduction The El Camino Real Bus Rapid Transit (BRT) Project (Project) would make transit and other transportation improvements along a 17.6-mile segment of the El Camino
A127/A130 Fairglen Interchange Improvement Schemes. Information Leaflet February 2017
 A127/A130 Fairglen Interchange Improvement Schemes Information Leaflet February 2017 1 2 Foreword By Councillor Kevin Bentley Essex is continuing to grow as a vibrant economic hub and as a fantastic place
Harrah s Station Square Casino
 Transportation Analysis Harrah s Station Square Casino Pittsburgh, Pennsylvania Submitted To: City of Pittsburgh and Pennsylvania Gaming Control Board Prepared By: DKS Associates GAI Consultants December
APPENDIX 2 LAKESHORE ROAD TRANSPORTATION REVIEW STUDY EXECUTIVE SUMMARY
 APPENDIX 2 LAKESHORE ROAD TRANSPORTATION REVIEW STUDY EXECUTIVE SUMMARY Appendix 2 City of Mississauga Lakeshore Road FINAL REPORT Transportation Review Study December 2010 EXECUTIVE SUMMARY Study Purpose
Congestion Reducing Activities. Toby Carr GDOT Director of Planning April 10, 2014
 Congestion Reducing Activities Toby Carr GDOT Director of Planning April 10, 2014 GDOT Performance Dashboard Congestion Congestion Relief Strategies 511 HEROS RTOP Highway Emergency Response Operators
1.0 Purpose and Organization of the Update to the Transit Market Analysis of Freeway-Oriented Express Buses (2008)
") Memorandum To: From: Laura Prickett, Horizon Water and Environment Genevieve Munsey, Environmental Planner, Parsons; Carie Montero, Senior Project Manager and Environmental Practice Lead, Parsons; Date:
Memorandum To: From: Laura Prickett, Horizon Water and Environment Genevieve Munsey, Environmental Planner, Parsons; Carie Montero, Senior Project Manager and Environmental Practice Lead, Parsons; Date:
WATERFRONT TRANSPORTATION ASSESSMENT T R A N S P O T A T I O N A U T H O R I T Y B O A R D SAN FRANCISCO, CALIFORNIA
 SFMTA Municipal Transportation Agency Image: Crosswalk of California Street and Grant Avenue WATERFRONT TRANSPORTATION ASSESSMENT T R A N S P O T A T I O N A U T H O R I T Y B O A R D 11 26 2013 SAN FRANCISCO,
Data Analysis February to March Identified safety needs from reported collisions and existing travel patterns.
 Welcome! Thank you for participating in today s Valencia Bikeway Improvements workshop. Data Analysis February to March Identified safety needs from reported collisions and existing travel patterns. Initial
EXECUTIVE SUMMARY OF CALEDON TRANSPORTATION NEEDS STUDY
 EXECUTIVE SUMMARY OF CALEDON TRANSPORTATION NEEDS STUDY The Caledon Transportation Needs Study has been undertaken as a joint project by the Town of Caledon and the Region of Peel to determine the existing
A simulation study of using active traffic management strategies on congested freeways
 Journal of Modern Transportation Volume 20, Number 3, September 2012, Page 178-184 Journal homepage: jmt.swjtu.edu.cn DOI: 10.1007/BF03325796 A simulation study of using active traffic management strategies
Transportation Analysis
 Van Ness Avenue Bus Rapid Transit Project Chapter 3: Transportation Analysis CHAPTER SUMMARY: This chapter provides an overview of transportation in and around the project study area, with and without
Traffic Academy: IJS & IMS FAQ/RULES OF THUMB
 FAQ/RULES OF THUMB HCS intersection analysis criteria See LDM Figure 401-14aE Cycle lengths between 60 to 120 seconds No impractical phases, i.e., 1 second green time Yellow + All Red must be no less than
Oakland Central Estuary Plan Existing Conditions Report. Transportation. September 2009
 Oakland Central Estuary Plan Existing Conditions Report September 2009 Contents Page 1 Context and Setting 1 1.1 Regional and Local Components 1 1.2 Issues 3 1.3 Existing Conditions Analysis Overview 6
101 Corridor Managed Lanes
 101 Corridor Managed Lanes TA BOD Meeting May 5, 2016 Agenda Item 11a Presentation Outline 101 Corridor Profile System Deficiencies Background Managed Lanes Proposed Purpose and Need Alternatives Under
WELCOME Mission-Geneva Transportation Study
 WELCOME Mission-Geneva Transportation Study Study Process and Schedule 2005 2006 Oct Nov Dec Jan Feb Mar Apr May Jun Jul Aug Sept Oct Task 2 Develop Outreach Plan Task 3 Document Existing Conditions/ Prioritize
SH-6 Corridor Improvement Study Policy Committee Progress Report M O N D AY, J U N E 1 0, B R A Z O S C E N T E R
 SH-6 Corridor Improvement Study Policy Committee Progress Report M O N D AY, J U N E 1 0, 2 0 1 3 B R A Z O S C E N T E R Project Overview Study Goals and Objectives» Improve traffic flow» Reduce delay»
MoPac South: Impact on Cesar Chavez Street and the Downtown Network
 MoPac South: Impact on Cesar Chavez Street and the Downtown Network Prepared by: The University of Texas at Austin Center for Transportation Research Prepared for: Central Texas Regional Mobility Authority
I-290 Phase I Study Village of Forest Park November 9, of 25
 I-290 Phase I Study Village of Forest Park November 9, 2015 1 of 25 I-290 Study Area Reconstruction Section (9 miles) Re-striping Section (4 miles) 13 miles West of Mannheim Road to Racine Avenue Connects
Magnolia Place. Traffic Impact Analysis. Prepared for: City of San Mateo. Prepared by: Hexagon Transportation Consultants, Inc.
 Magnolia Place Traffic Impact Analysis Prepared for: City of San Mateo Prepared by: Hexagon Transportation Consultants, Inc. Updated January 4, 2010 Table of Contents 1. Introduction...1 2. Existing Conditions...6
FREEWAY CORRIDOR MANAGEMENT STUDY PHASE 2 DRAFT REPORT I NOVEMBER 2018
 FREEWAY CORRIDOR MANAGEMENT STUDY PHASE 2 DRAFT REPORT I NOVEMBER 2018 CONTENTS ACKNOWLEDGEMENTS We wish to thank the following members of the study team: TILLY CHANG ERIC CORDOBA JEFF HOBSON JOE CASTIGLIONE
4.12 TRANSPORTATION Executive Summary. Setting
 4.12 TRANSPORTATION 4.12.1 Executive Summary This section is based on the Multimodal Transportation Impact Study (TIS; 2016) prepared by Omni-Means, Ltd. to evaluate projected transportation impact conditions
Feasibility Study of Pedestrian Crossings Along Route 7, East of Cascades Parkway and West of Dranesville Road. October 3, 2017
 Feasibility Study of Pedestrian Crossings Along Route 7, East of Cascades Parkway and West of Dranesville Road October 3, 2017 Study Area (area within a ¼-mile radius of the study intersections) Route
Let s Make I-40 Better Action Team. Friday, March 29, 2019 Hosted by RTP Foundation
 Let s Make I-40 Better Action Team Friday, March 29, 2019 Hosted by RTP Foundation RTA Welcome Geoff Lang, MetLife, RTA Chair Jim Beley, The Umstead Hotel & Spa, RTA regional travel experience chair NCDOT
4 Level of Service Results: HOV and Express Lanes
 4 Level of Service Results: HOV and Express Lanes Considering the importance of managed lanes (such as HOV and express lanes) in improving the overall performance of a corridor, Alameda CTC started monitoring
University Hill Transportation Study Technical Memorandum Alternatives Modeling and Analysis May 2007
 Technical Memorandum May 2007 Syracuse Metropolitan Transportation Council Edwards and Kelcey with Wallace Roberts and Todd Alta Planning and Design CONTENTS SECTION ONE- INTRODUCTION...1 SECTION TWO-
I-105 ExpressLanes Project
 I-105 ExpressLanes Project Public Scoping Meetings March 2018 Introduction to Scoping This process is your opportunity to give us your thoughts on: The purpose and need for the proposed improvements The
Charlotte Region Fast Lanes Study Phase III
 Charlotte Region Fast Lanes Study Phase III Stakeholder Workshop #3 December 13, 2012 Fast Lanes Study, Phases I and II Performed between 2007 and 2009 Evaluated all types of managed lanes (HOV, HOT, truck-only
BALBOA AREA: TRANSPORTATION PROJECTS & PLANNING
 BALBOA AREA: TRANSPORTATION PROJECTS & PLANNING TRANSPORTATION FOR ALL AGES, ABILITIES & MEANS CHANGING PATTERNS: TRENDING TO WALKING, BIKING, TRANSIT San Francisco s Change in Number of Commuters by Mode
Preliminary Review of the T-REX Southeast Corridor Highway and Light Rail Transit Project
 Preliminary Review of the T-REX Southeast Corridor Highway and Light Rail Transit Project DRCOG Congestion Mitigation Program White Paper 07-1 (February 16, 2007) On time and under budget! Festivities
4. ENVIRONMENTAL IMPACT ANALYSIS 9. TRANSPORTATION AND TRAFFIC
 4. ENVIRONMENTAL IMPACT ANALYSIS 9. TRANSPORTATION AND TRAFFIC 4.9.1 INTRODUCTION The following section addresses the Proposed Project s impact on transportation and traffic based on the Traffic Study
Southwest Bus Rapid Transit (SW BRT) Functional Planning Study - Executive Summary January 19 LPT ATTACHMENT 2.
 Functional Planning Study - Executive Summary January 19 LPT ATTACHMENT 2.") Southwest Bus Rapid Transit (SW BRT) Functional Planning Study - Executive Summary 2011 January 19 1 of 19 Introduction This executive summary presents the results of the Southwest Bus Rapid Transit (SW
Southwest Bus Rapid Transit (SW BRT) Functional Planning Study - Executive Summary 2011 January 19 1 of 19 Introduction This executive summary presents the results of the Southwest Bus Rapid Transit (SW
BRT for Berkeley A Proposal for Consideration
 BRT for Berkeley A Proposal for Consideration CITY OF BERKELEY STAFF PROPOSAL FOR A LOCALLY PREFERRED ALTERNATIVE OF THE EAST BAY BUS RAPID TRANSIT PROJECT SEPTEMBER 8, 2009 Table of Contents Executive
Protected Bike Lanes in San Francisco Mike Sallaberry SFMTA NACTO Workshop - Chicago IL
 Protected Bike Lanes in San Francisco Mike Sallaberry SFMTA 10 14 2011 NACTO Workshop - Chicago IL San Francisco 2 nd Highest Density in the U.S. 47 square miles Mild Climate Market Population ~810,000
Freeway System Considerations
 Session 11 Jack Broz, PE, HR Green May 5-7, 2010 Freeway System Considerations Mainline Transit: Shoulder Operations, BRT, Stations HOV, HOT, UPA Interchanges Exit Ramps Entrance Ramps Bridges Local Crossings
VT15 / Allen Martin Drive Intersection Scoping Study
 VT15 / Allen Martin Drive Intersection Scoping Study ALTERNATIVES PRESENTATION MEETING DECEMBER 19, 2016 Agenda Study Area Project Background Existing Conditions Identified Issues Proposed Alternatives
Better Market Street. Engineering, Maintenance & Safety Committee (EMSC) February 28, 2018
 February 28, 2018") Better Market Street Engineering, Maintenance & Safety Committee (EMSC) February 28, 2018 1 Market Street Market Street - San Francisco by rulenumberone2 2 Market Street is the... City s busiest pedestrian
Better Market Street Engineering, Maintenance & Safety Committee (EMSC) February 28, 2018 1 Market Street Market Street - San Francisco by rulenumberone2 2 Market Street is the... City s busiest pedestrian
INTRODUCTION. The focus of this study is to reduce congestion and improve mobility for all modes of transportation. Figure ES-1 Study Corridor Map
 INTRODUCTION The I-280 Corridor Study is a highway planning study led by Santa Clara VTA, in partnership with the City of Cupertino and in coordination with other stakeholders in the study area. The study
Figure 1: Vicinity Map of the Study Area
 ARIZONA TEXAS NEW MEXICO OKLAHOMA May 5, 2016 Mr. Anthony Beach, P.E. BSP Engineers 4800 Lakewood Drive, Suite 4 Waco, Texas 76710 Re: Intersection and Access Analysis along Business 190 in Copperas Cove
BC Ministry of Transportation and Infrastructure
 BC Ministry of Transportation and Infrastructure Highway 99 () Corridor Assessment DRAFT V 1.5 TABLE OF CONTENTS 1.0 BACKGROUND...1 2.0 REGIONAL CONTEXT...2 3.0 HIGHWAY 99 CONFIGURATION...4 4.0 HIGHWAY
INDUSTRIAL BUILDING 1660 COMSTOCK ROAD CITY OF OTTAWA TRANSPORTATION OVERVIEW. Prepared for:
 INDUSTRIAL BUILDING 1660 COMSTOCK ROAD CITY OF OTTAWA TRANSPORTATION OVERVIEW Prepared for: Simluc Contractors Limited 2550 Blackwell Street, Ottawa K1B 5R1 October 18, 2013 113-584 Overview_1.doc D. J.
Highway 17 Transportation Improvement Study
 Final Report Highway 17 Transportation Improvement Study prepared for Santa Cruz County Regional Transportation Commission (SCCRTC) prepared by Planning and Engineering, Inc. 1155 North First Street, Suite