Downtown Tampa Parking User Survey
|
|
|
- Garey Watts
- 5 years ago
- Views:
Transcription


1 Downtown Tampa Parking User Survey 2017

2 Introduction This Downtown Tampa Parking User Survey was commissioned by the Tampa Downtown Partnership and carried out by Plan Hillsborough. The survey was overseen by the Tampa Downtown Partnership Parking Task Force representing Downtown stakeholders. While results of this Survey show the majority of respondents were unsatisfied with parking in Downtown Tampa, responses to the various questions can provide insight about potential improvements that could be made to improve parking satisfaction. The Survey shows the most important factors in parking choice are proximity, availability, and cost. While the proximity of parking to their final destination was identified as the most important factor in parking choice, a majority of respondents were willing to walk three blocks or more from their final destination. Parking facilities to cover a three block radius of development would be considered acceptable for most drivers according to the data collected. Another major factor focused on the availability of parking. The vast majority of open-ended responses indicated a need for more parking garages. In fact, the greatest proportion of respondents stated that they prefer to park in garages as opposed to on-street or surface level parking lots. While the cost of parking is a major factor in parking choice, only about two out of every five respondents indicated the cost of parking in Downtown Tampa was too high. The majority were comfortable with the current cost of parking. Employees in Downtown tended to have the greatest concern about the cost of parking. 1 When it comes to finding their way around Downtown and to available parking, the majority of respondents found wayfaring signage to be inadequate. Respondents indicated the need for real-time parking information delivered to parking garage message boards, message board street signs, and mobile applications directing drivers to available parking. Improving wayfaring signage as well as implementing real-time
3 parking information delivered to message boards and mobile applications could help drivers find parking more easily and reduce the time it takes to find a parking space. Future Steps In general, parking is supportive of, and subordinate to the surrounding land uses. People do not go to a destination to park, but go to a destination for a reason and then park. To that end, the role of parking is to support these uses and activities, not for the activities to support parking. Parking should be seen as a tool of economic development and a part of the overall multimodal transportation system. As part of the transportation system, parking must be managed to assure it meets the transportation and land use goals of the City as well as being useful and efficient for its users. While this Survey should be used to improve certain aspects of parking, it could serve as the impetus for the City to develop a comprehensive parking management plan for Downtown Tampa. The plan could identify Downtown parking strategies to better manage the current parking supply to serve existing demand as well as estimate the future parking need and understand the most appropriate funding opportunities to fund the on-going and future parking program. The plan could recommend strategies for improving on-street and off-street parking; manage future growth in ways that minimize traffic congestion while improving economic vitality, and improve transportation choices for traveling to and moving around Downtown. A parking management plan may be a key step in ensuring Downtown Tampa achieves its full potential. Methodology The Downtown Tampa Parking Survey was conducted between November 2016 and February A total of 1,428 responses were collected using SurveyMonkey, an interactive online survey tool. The survey was distributed via , partner websites, social media (Facebook, Twitter, LinkedIn), info cards distributed to patrons of local businesses and events, and word of mouth. Survey responses were analyzed collectively and by dividing respondents into groups of employees, residents and visitors. The grouping of employees comprises respondents who indicated they work downtown, park monthly or for more than three hours each visit, and park in downtown multiple days per week. A total of 442 respondents met these criteria. The grouping of residents comprises respondents from the remaining 986 entries who indicated they were a resident and who listed their home ZIP code as 33602,. This ZIP code envelops downtown Tampa as well as Ridgewood Park and southern Tampa Heights. A total of 91 respondents met these criteria. Finally, the grouping of visitors comprises all respondents who were not categorized as employees or residents. A total of 895 respondents were classified as visitors. 2
4 OVERALL SATISFACTION WITH PARKING Overall, respondents were unsatisfied with parking in downtown. More than half (56.2%) stated they were unsatisfied or very unsatisfied with parking Downtown, while fewer than one-in-four (23.8%) stated they were satisfied or very satisfied. Separating respondents into groups of employees, residents and visitors shows that employees were the most unsatisfied with downtown parking (58.6%). Residents (49.5%) were the only group that had a greater proportion of neutral, satisfied and very satisfied overall opinions on parking compared to unsatisfied and very unsatisfied opinions. In general, how satisfied are you with parking in Downtown? Very satisfied Satisfied Neither satisfied nor unsatisfied Unsatisfied Very unsatisfied 0% 5% 10% 15% 20% 25% 30% 35% 40% PARKING PURPOSE Overall, the majority of respondents used parking in downtown for entertainment (68.7%), with work (45.3%) and dining (41.5%) the second and third most common activities, respectively. More than one-in-three respondents used parking Downtown for outdoor activities (39.6%), and nearly one-in-three used parking for civic events (30.5%). Fewer than one-in-ten respondents used parking downtown for government service (9.3%), shopping (9%), and conferences (6.3%). Just over fifteen percent of respondents stated they used downtown parking for other activities, with 80 (36%) of those respondents stating they used Downtown parking for classes or the library at the Patel Conservatory. Twenty-three respondents who used parking downtown for other activities did so for volunteering (10%), generally at the Straz Center for the Performing Arts. Six respondents (2.7%) used parking Downtown for religious services or church attendance. 3 In general, what activities do you use parking for in Downtown? (check all that apply) Other Conference Entertainment Sporting event Outdoor activities Civic event Government service Dining Work Residence Shopping 0% 10% 20% 30% 40% 50% 60% 70% 80%
5 COST OF PARKING Response to the cost of parking was mixed, although not as negative as the overall level of satisfaction with parking. Slightly fewer than two-in-five respondents were unsatisfied or very unsatisfied with the cost of parking (38%), while the greatest single-category response was Neither Satisfied nor Unsatisfied (28.7%). Approximately one-in-three respondents (34.9%) were satisfied or very satisfied with the cost of parking. As with the overall perceptions of parking, employees of downtown had the highest rates of dissatisfaction with parking costs (45.7%), while residents (31.9%) again had the lowest. Dissatisfaction with parking costs for visitors (34.7%) closely matched the overall response to parking costs (38%). Overall, how satisfied are you with the cost of parking in Downtown? Very satisfied Satisfied Neither satisfied nor unsatisfied Unsatisfied Very unsatisfied 0% 5% 10% 15% 20% 25% 30% 35% PARKING FREQUENCY When asked about parking frequency, there was no surprise that the majority of employees (100%) and residents (99%) park in Downtown either everyday or multiple times week. Among visitors, about 38% park in Downtown once per week, while 30% park in Downtown once per month. 21% park in downtown once per month. Only a small percentage (6%) park seldomly. This is my first time parking Never Seldom About once a month How often do you park in Downtown? About once a week Multiple times per week Every day 0% 20% 40% 60% 80% 100%
, followed by on-street parking (34.2%) and parking lots (21%).")
6 PARKING PREFERENCE Parking Garage Parking Lot On-Street Parking Where do you prefer to park? 0% 10% 20% 30% 40% 50% 60% 70% The greatest proportion of respondents stated that they prefer to park in garages (42.8%), followed by on-street parking (34.2%) and parking lots (21%). Residents were much more likely to prefer on-street parking (63.7%) compared to visitors (35.9%) and employees (24.9%), while employees and visitors had similar rates of preference for parking garages (46.6% and 42.7%, respectively). Employees had the highest preference for parking lots (26.5%), followed by visitors (19.6%) and residents (8.8%). Why one location over another? Of the 800 explanations provided, 155 (19.4%) chose their preference due to ease, 85 (10.6%) mentioned closeness or proximity to their destination, and 58( 7.3%) mentioned convenience. While both ease and convenience was often presented by respondents generally did not indicate whether their choice was due to ease or convenience as it relates to their destination or maneuvering to and from the spot itself, 30 respondents (3.8%) chose their spot due to the ease or difficulty of entering and exiting nearby onstreet spots, lots and garages. Safety was another shared concern, with 130 (16.2%) citing either safety or presence of security in their responses. A total of 126 (15.8%) respondents chose their preference in part due to cost, mentioning words such as cost (6.3%), expensive (3.1%), free (3.5%), and cheap (3.5%). Another significant reason for their preference was the availability of spaces, with 53 (6.6%) choosing their preference due in part to spot availability. 5
7 PARKING LOCATION The majority of respondents (54.1%) generally park in the River Arts District of downtown, with the Central Business District (26%) and Arena District (21.4%) the second and third most common parking locations, respectively. Fewer than one-in-five respondents usually park in the Channel District (15.8%) and East Downtown (12.2%), while fewer than one-in-ten park in the University Area (8%) and Encore/Marion Transit Center (3.2%) locations. Employees and residents were more likely to park in the Central Business District and less likely to park in the Arena District than visitors. Residents were more likely to park in the University Area and Channel District than either visitors or employees, and along with visitors were more likely to park in the River Arts district than employees. A total of 399 Other locations were provided, of which 249 (62.4%) referenced either the Straz Center for the Performing Arts, the Poe Garage, or the Patel Conservancy. TECO Plaza received another 9 responses (2.3%). Where do you park in downtown (select all that apply)? Other University Area River Arts Encore/MTC Channel District East Downtown CBD Arena District 0% 10% 20% 30% 40% 50% 60% 70% WAYFARING SIGNAGE Overall, the majority of respondents (54.7%) felt there was not adequate, easy-to-understand wayfaring signage to help navigate to parking in Downtown. Only slightly more than one-in-four respondents felt there was adequate signage. Separating respondents into groups of employees, residents and visitors shows that groups are generally in agreement about wayfaring signage, although employees (53.6%) and visitors (55.9%) were slightly more likely to state that there is not adequate signage when compared to residents (48.6%). Do you feel there is adequate, easy-to-understand wayfaring signage to help navigate parking in Downtown? Not Sure No Yes 0% 10% 20% 30% 40% 50% 60% 6
8 TIME TAKEN TO LOCATE A SPOT The average respondent took less than ten minutes to find a spot after arriving in Downtown, with three-in-five respondents (60%) providing that response. Approximately one-in-seven respondents (15%) took longer than 15 minutes to find a spot after arriving in Downtown. Employees and residents were quicker at finding spots than visitors, with 63.4% of employees and 68.1% of residents stating than it took them less than ten minutes to find a spot, compared to 57.4% of visitors. Approximately one-in-five visitors took longer than 15 minutes to find a spot after arriving in Downtown (18.5%), compared to onein-ten for employees (10%) and one-in-twenty for residents (4.4%). After arriving in Downtown, how long does it typically take you to find a lot, garage or on-street parking space to park in? 20 min min min 5-10 min 0-5 min 0% 5% 10% 15% 20% 25% 30% 35% 40% 45% PARKING DISTANCE The distance people are willing to walk to their final destination from where they park varied greatly. Overall, however, 57.3% of respondents were willing to park three blocks or more from their destination. Less than half (41.7%) were willing to park no more than two blocks. Separating respondents into groups, residents (74.7%) were most willing to park three or more blocks to their destination while only 57.3% employees were willing to park three or more blocks. Visitors (54.7%) showed the least desire to park three or more blocks with 44.1% indicating their desire to park no more than two blocks In general, how far are you willing to park from your destination in Downtown? More than 4 blocks 4 blocks 3 blocks 2 blocks 1 block 0% 5% 10% 15% 20% 25% 30% 35% 40% 7
9 DAY OF DOWNTOWN VISITS The greatest number of respondents parked in Downtown during weekdays (66.1%), followed by weekends (57.4%) and evenings (42.5%). All but seven of the 442 respondents who were employees parked in Downtown during weekdays, though fewer of them returned during weekends (42.9%) and evenings (43.7%) compared to residents and visitors. Approximately half of all visitors parked in Downtown during weekdays (49.9%), compared to about two-in-three for evenings and weekends (62.8%). Residents were about equally likely to report that they parked in Downtown during weekdays (68.1%), evenings (72.5%) and weekends (73.6%). Weekends Evenings Weekdays Do you generally park in Downtown during (check all that apply): 0% 20% 40% 60% 80% 100% Vistors Residents Employees Overall TIME OF ARRIVAL Overall, respondents were far more likely to report they generally arrive Downtown between the hours of 7 am to 10 am (28.2%) and the hours of 4 pm to 7 pm (39.8%) compared to any other three-hour span of the day. Approximately four-in-five employees arrived to downtown between the hours of 4 am and 10 am (80.5%), while residents and visitors were more likely to arrive later in the day. More than half of all residents arrived between the hours of 4 pm to 7 pm (51.7%), with three-in-four arriving between 1 pm and 10 pm (75.8%). More than half of all visitors arrived during the evening hours of 4 pm to 7 pm (55.5%), with only approximately one-in-ten arriving before 10 am (11.7%). Very early morning Early morning Morning Mid-day Afternoon Evening Night What time do you generally arrive to downtown? Late night 0% 10% 20% 30% 40% 50% 60% 70% 80%
10 FACTORS IN PARKING CHOICE When asked about the most important factor in parking choice proximity (33.2%), availability (26%), and cost (20.6%) were ranked the highest. The least important factor was time limits on parking with less than 5% indicating this was important. Separated into groups, employees (29.6%) and visitors (36.4%) felt proximity to their destination was the most important factor, while residents (36.3%) felt availability of parking is the most important factor. What is usually the most important factor in your parking choice? Other Proximity to destination Safety Cost Time limits Availability 0% 5% 10% 15% 20% 25% 30% 35% 40% SAFETY Overall, the majority of respondents felt safe in Downtown (74.4%) while only a small percentage felt unsafe (5.7%). When separated into groups, employees tended to have a more varied perception of safety with 7.3% indicating they felt unsafe, 25.1% indicating neither safe nor unsafe, and 67.2% feeling safe. The perception of feeling safe skewed higher with residents (79.1%) and visitors (77.4%) tending to feel safer in Downtown. How safe did you feel parking during your most recent visit to Downtown? Very Safe Safe Neither Safe nor Unsafe Unsafe Very Unsafe 0% 10% 20% 30% 40% 50% 60% 9
11 GARAGE AND LOT-RELATED IMPROVEMENTS When asked about which parking garage and lot-related improvements are most desired, the top three of nine suggested improvements were real-time parking information delivered to message boards (44.5%), message board street signs directing drivers to available parking (39.9%), and safety improvements (38.5%). A significant number of respondents indicated the desire for mobile applications directing to available parking (31.7%) and more options to pay to park (29.8%). A total of 230 other options were provided, of which 38% indicated the need for additional parking spaces and garages in Downtown, 7% felt the need for free or reduced cost of parking. Which of these parking garage or lot-related improvements would you like to see in Downtown? Please pick up to three. Other Real-time parking info delivered to Mobile applications directing to Message board street signs directing Bike share options outside lots and Safety improvements More electric car charging stations More handicapped parking spaces More options to pay for parking More public transit spots near parking 0% 10% 20% 30% 40% 50% WHO PAID FOR PARKING The vast majority of respondents (72.1%) indicated that they paid for their own parking in Downtown during their most recent visit. Only 13.6% of respondents indicated their employer paid for parking. Only 4.8% indicated they parked for free. 1.9% indicated a merchant paid for their parking, and less than.5% had a client pay for their parking. A total of 95 other responses were received. Of those, 11% indicated they share their parking expense with their employer. Who paid for your parking during your most recent visit to Downtown? Other Parking was free Merchant paid Client paid Employer paid I paid 0% 10% 20% 30% 40% 50% 60% 70% 80%
 compared to those who can never find a spot (6.")
12 PARKING AVAILABILITY Response to parking availability was mixed, with 44.5% of respondents stating they can often find a spot near their destination and 37.5% stating they can rarely find a spot near their destination. More respondents stated they can always find a spot (9.7%) compared to those who can never find a spot (6.1%), but these groups each represented fewer than one-in-ten respondents. Separating respondents into groups of employees, residents and visitors shows that groups are generally in agreement about parking availability, although residents were slightly more likely to state that they can always or often find a spot (57.1%) than employees (53.8%) or visitors (54.2%). What is your perception of parking availability in Downtown? No opinion/don t know Can never find a space near my destination Can rarely find a space near my destination Can often find a space near my destination Can always find a space near my 0% 10% 20% 30% 40% 50% 60% AVAILABILITY OF PARKING AND TIME OF VISIT Overall, the majority (55.1%) of respondents indicated that availability of parking does not influence the time of day they visit Downtown; however, a significant portion (36.3%) said it does influence their decision. Not sure Does the availability of parking influence the time of day you go Downtown? No Yes 0% 10% 20% 30% 40% 50% 60% 11
 and rideshare (5.")

13 GETTING TO YOUR DESTINATION The vast majority of respondents indicated walking (96.9%) from their parking spot to their final destination. Separated into groups, only residents showed a somewhat significant use of other services including the Downtowner (14.3%) and rideshare (5.5%) to get from their parking spot to their final destination. How did you get from your parking spot to your destination during your most recent visit to Downtown? (Check all that apply) Other Ride share Taxi Streetcar Coast Bike In-Towner HART Downtowner Walking 0% 20% Visitors 40% Residents 60% Employees 80% 100% Overall 12
14 NAVIGATING AROUND DOWNTOWN Overall, visitors tended to be the least likely to use a variety of services to navigate downtown including the Downtowner, HART, the In-Towner, Coast Bike Share, Streetcar, Taxi, Rideshare, or other forms of transport. Only rideshare services (20.8%) such as Uber and Lyft and the Streetcar (15.5%) have been used by visitors to navigate downtown in significant numbers. Among employees, rideshare services (32.1%), the Downtowner (28%), and Streetcar (22.2%) seemed to be the most widely used. Residents of Downtown showed the highest usage of the various services to move around Downtown including rideshare (60.4%), the Downtowner (55%), Streetcar (47.3%), and Coast Bike Share (31.9%). Among all respondents for each of the services indicated in the survey, taxis (6.4%) were the least likely to be utilized while rideshare (26.8%) services were the most likely to be utilized. A total of 141 other responses were collected. Of those, 9% indicated using their own bicycle to navigate Downtown. Have you ever used any of the following services to navigate Downtown? (Check all that apply) Other Ride share Taxi Streetcar Coast Bike In-Towner HART Downtowner 0% 10% 20% 30% 40% 50% 60% 70% OPEN ENDED RESPONSES The survey invited respondents to provide an open-ended response to the question: Is there anything else you would like to add to help improve your Downtown Tampa parking experience? The purpose was to gain information regarding respondents major concerns and issues above and beyond what was to be gathered in this survey. General themes regarding perception of and suggestions for parking in Downtown Tampa fell into seven general 13 categories including: More parking Information and technology Safety and security Street and garage improvements Traffic and routing Public Transit, Bike, and Pedestrian Cost of parking
15 Of the 701 open-ended responses, 323 (41%) indicated the need for more parking in Downtown Tampa including more garages. Many of the responses expressed a need for more parking in the River Arts District around the Straz Center, Patel Conservatory, Curtis Hixon Park, and Germany Library. Several respondents specified the need for more parking for handicapped parking and senior citizens who do not have the ability to walk several blocks. Many expressed the need to build parking garages on existing surface level parking lots to accommodate additional automobiles. Information and technology emerged as a topic many respondents felt needed attention. Of the 53 (7.6%) responses in this category, a large number indicated the need for better real-time parking information. Expanding the use of technology could include the use of mobile applications, electronic signs, and easier to use parking meters/pay stations. Many expressed the desire for expanding options to pay for parking including the use of services such as Apple Pay. A few respondents also mentioned that parking payment machines occasionally do not function properly. While the vast majority of participants felt safe in Downtown Tampa, as indicated in the results of the survey, safety and security did emerge as a theme. A large number of those providing responses felt homeless made them feel unsafe. Several participants also expressed a need for better lighting in Downtown and the need to clean up trash and debris on streets and in garages. In the category of street and garage improvements, of the 20 responses, the majority indicated the need for better maintenance of garages and lots. This would include cleaning of litter. Some responses felt there is a need for wider parking spaces to accommodate larger vehicles. Seventy-six (10.8%) responses dealt with traffic and routing in Downtown Tampa. The majority of responses stated how difficult it could be to exit parking garages after a special event, and many respondents mentioned that overlapping events cause additional delays. Many felt the City could do a better job improving traffic flow during special events in and around parking garages. Better timing for traffic lights to accommodate traffic flow in and out of Downtown during special events was also mentioned by several respondents. A significant portion of respondents (11.4%) voiced their desire for transportation options to and from Downtown Tampa. Responses indicated the need for more transit including bus and rail, more Downtowner vehicles and the expansion of the Downtowner program to a wider area, and more bicycle infrastructure and bike parking. Moreover, the cost of parking emerged as a general category with 58 survey takers (8.3%) Most stated their desire for a reduction in the cost of parking or even providing free parking. Project Team Tony LaColla, AICP, Principal Planner, Hillsborough County City-County Planning Commission Vanko Antonov, University of South Florida Graduate Fellow, Hillsborough County City-County Planning Commission Brandon Berry, University of South Florida Graduate Fellow, Metropolitan Planning Organization 14


16 E. Kennedy Blvd. 18th Floor Tampa, FL 33602
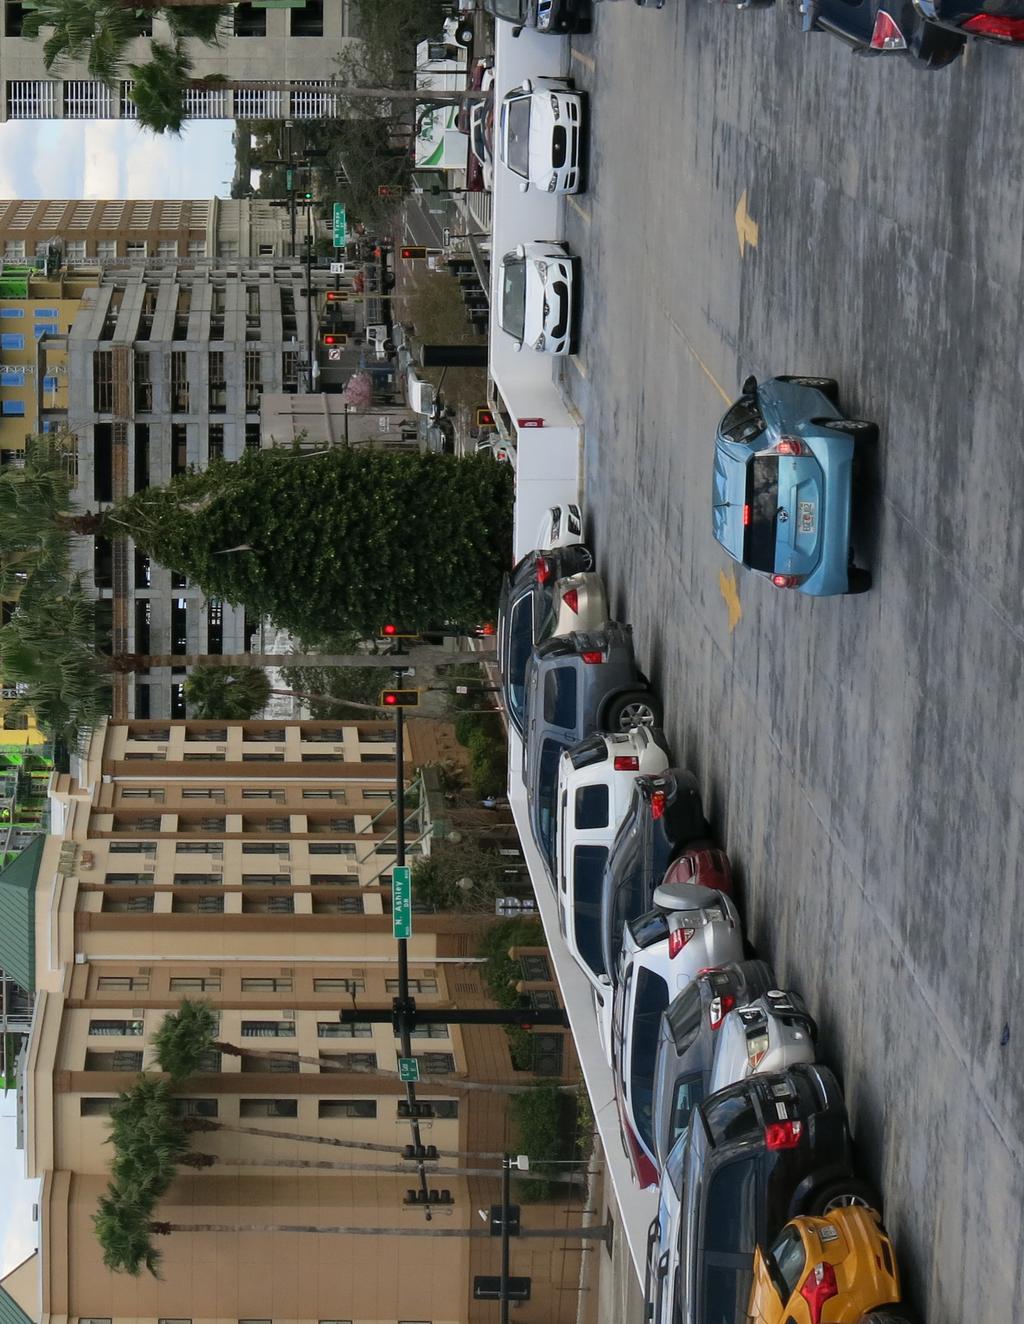
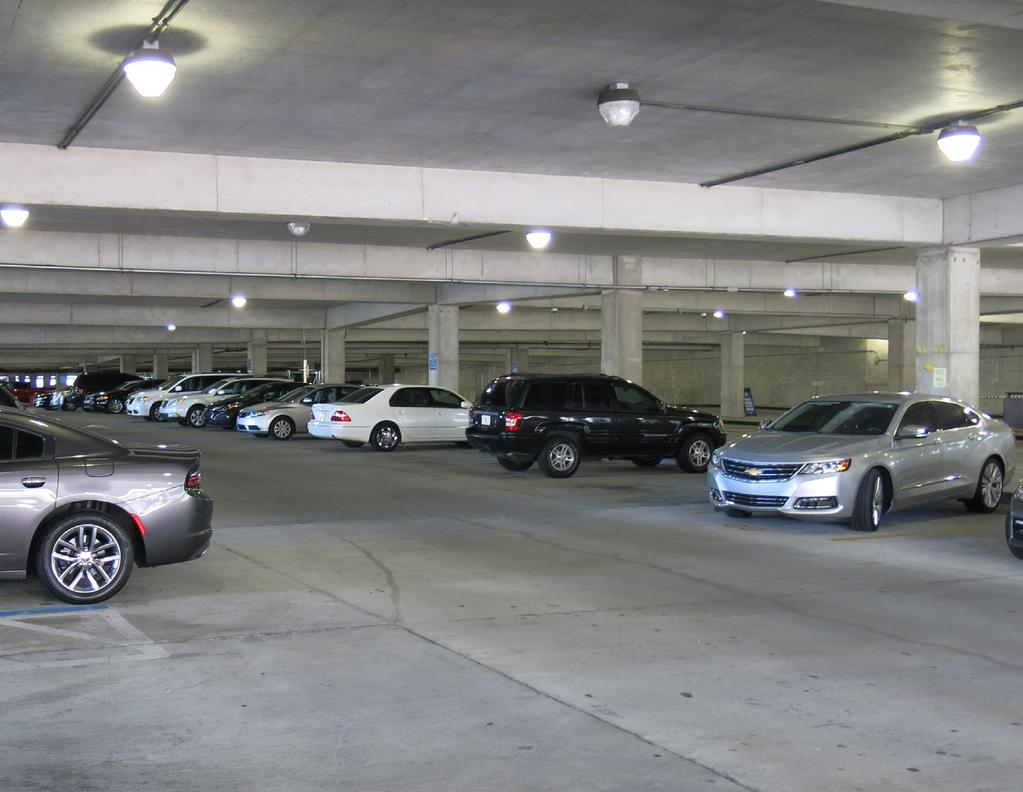
Downtown Tampa Public Parking Garage Assessment
 Downtown Tampa Public Parking Garage Assessment 2017 Table of Contents 3 4 6 8 10 12 13 15 Introduction Accessibility Efficiency Aesthetics Safety Capacity & Amenities Recommendations Conclusion Introduction
1999 On-Board Sacramento Regional Transit District Survey
 SACOG-00-009 1999 On-Board Sacramento Regional Transit District Survey June 2000 Sacramento Area Council of Governments 1999 On-Board Sacramento Regional Transit District Survey June 2000 Table of Contents
INTRODUCTION. Specifically, the objectives are to:
 INTRODUCTION The River to Sea Transportation Planning Organization (TPO) conducts the Tell the TPO Transportation Trends Survey to better understand the transportation preferences and priorities for the
2012 Transit Study Randolph County
 2012 Transit Study Randolph County Appendix B Technical Memorandum 2011 Transportation Survey Prepared for: Randolph County Housing Authority Country Roads Transit Submitted by: July 1, 2012 Table of Contents
AAMPO Regional Transportation Attitude Survey
 AAMPO Regional Transportation Attitude Survey Traditionally Underserved Populations helping organizations make better decisions since 1982 2018 Submitted to the AAMPO By: ETC Institute 725 W. Frontier
2016 Capital Bikeshare Member Survey Report
 2016 Capital Bikeshare Member Survey Report Prepared by: LDA Consulting Washington, DC 20015 (202) 548-0205 February 24, 2017 EXECUTIVE SUMMARY Overview This report presents the results of the November
Pocatello Regional Transit Master Transit Plan Draft Recommendations
 Pocatello Regional Transit Master Transit Plan Draft Recommendations Presentation Outline 1. 2. 3. 4. What is the Master Transit Plan? An overview of the study Where Are We Today? Key take-aways from existing
Sherwood Drive Traffic Circle
 Strathcona County Sherwood Drive Traffic Circle Online Survey Results April 7, 215 I. Executive Summary The Sherwood Drive Traffic Circle Survey was administered in March 215. In total, 2,263 residents
On the Move: Transportation Plan Wood County Survey Assessment
 On the Move: 2015 2045 Transportation Plan Wood County Survey Assessment Bowling Green State University Master of Public Administration Program conducted by Alina Raulinaitis, Guang Yang, Sarah Tekle,
Key objectives of the survey were to gain a better understanding of:
 3 COMMUNITY INPUT Community input is an essential part of corridor studies. For the SR 87 corridor study, VTA staff conducted an extensive online survey of people living and commuting along the corridor.
COLUMBUS AVENUE NEIGHBORHOOD TRANSPORTATION STUDY
 COLUMBUS AVENUE NEIGHBORHOOD TRANSPORTATION STUDY Pedestrian Survey Findings Survey Main Findings: Transit and walking are the main two modes used by both visitors and residents of the area, regardless
Grove Hall Business District Parking Analysis
 Grove Hall Business District Parking Analysis February 2014 Prepared for The Roxbury Great Neighborhoods Partnership Nuestra Comunidad Development Corporation Dudley Square Main Streets Greater Grove Hall
EXCELLENCE. Executive Summary. Destination: 2014 Downtown Detroit Perceptions Survey
 Executive Summary Destination: EXCELLENCE 2014 Downtown Detroit Perceptions Survey Capturing the Voice of Detroit so we can continue to take giant leaps forward. 1 Executive Summary Overall Impressions
Investment in Active Transport Survey
 Investment in Active Transport Survey KEY FINDINGS 3 METHODOLOGY 7 CYCLING INFRASTRUCTURE 8 Riding a bike 9 Reasons for riding a bike 9 Mainly ride on 10 Comfortable riding on 10 Rating of cycling infrastructure
Capital Bikeshare 2011 Member Survey Executive Summary
 Capital Bikeshare 2011 Member Survey Executive Summary Prepared by: LDA Consulting Washington, DC 20015 (202) 548-0205 June 14, 2012 EXECUTIVE SUMMARY Overview This report presents the results of the 2012
APPENDIX A. Outreach Summary
 APPENDIX A Outreach Summary COUNTYWIDE TRANSPORTATION PLAN Summary of Public Outreach and Engagement To gather an understanding of the transportation issues and priorities throughout the county, and inform
Transit Ridership - Why the Decline and How to Increase. Hosted by the. Virginia Transit Association
 Transit Ridership - Why the Decline and How to Increase Hosted by the Virginia Transit Association Virginia Transit Association 1108 East Main Street, Suite 1108 Richmond, VA 23219 804.643.1166 www.vatransit.com
FLETCHER AVENUE PEDESTRIAN AND BICYCLIST BEHAVIOR CHANGE FORMATIVE RESEARCH PROJECT
 FLETCHER AVENUE PEDESTRIAN AND BICYCLIST BEHAVIOR CHANGE FORMATIVE RESEARCH PROJECT EXTENT OF CHANGES IN PEDESTRIAN AND BICYCLIST ATTITUDES AND BEHAVIORS DIRECTLY AFTER A COMPLETE STREETS PROJECT IN FLORIDA
METROPOLITAN TRANSPORTATION PLAN OUTREACH: INTERACTIVE MAP SUMMARY REPORT- 10/03/14
 METROPOLITAN TRANSPORTATION PLAN OUTREACH: INTERACTIVE MAP SUMMARY REPORT- 10/03/14 INTRODUCTION This document summarizes the results of the online interactive mapping exercise implemented by MIG for the
NACTO Designing Cities Conference Project Evaluation: Tools for Measuring Success and Building Support. October 29, 2015
 NACTO Designing Cities Conference Project Evaluation: Tools for Measuring Success and Building Support October 29, 2015 The case for evaluation: Have a social contract with City Council, staff and community
Board & Committee Agenda Item
 Board & Committee Agenda Item Agenda Item Getting to School Survey Results Presenter Patti Simmons, Ed. S, Hillsborough County Public Schools Summary Members of the Hillsborough Metropolitan Planning Organization
Washington Metropolitan Area Transit Authority Board Action/Information Summary. MEAD Number:
 Washington Metropolitan Area Transit Authority Board Action/Information Summary Action Information MEAD Number: 100962 Resolution: Yes No TITLE: Bicycle and Pedestrian Access Improvements Study PURPOSE:
2014 Ontario Works Transit Survey: Final Results
 2014 Ontario Works Transit Survey: Final Results Irena Pozgaj-Jones, Project Manager, Transportation September 2014 Overview Background Survey Purpose and Objectives Methodology Respondent Demographics
Cherry Creek Transportation and Land Use Forum September 25, 2013 Meeting Summary
 Cherry Creek Transportation and Land Use Forum September 25, 2013 Meeting Summary I. LEAD-IN TO SMALL GROUP DISCUSSION, POLLING AND STEERING COMMITTEE/TECHNICAL TASK FORCE DISCUSSION The meeting began
TRAVEL PLAN: CENTRAL EUROPEAN UNIVERSITY CAMPUS REDEVELOPMENT PROJECT TRAVEL PLAN. Central European University Campus Redevelopment Project.
 TRAVEL PLAN Central European University Campus Redevelopment Project Page 1 Table of Contents Introduction... 3 Background... 7 Building Users... 7 Transportation in Community Consultation... 7 Summary
City of Novi Non-Motorized Master Plan 2011 Executive Summary
 City of Novi Non-Motorized Master Plan 2011 Executive Summary Prepared by: February 28, 2011 Why Plan? Encouraging healthy, active lifestyles through pathway and sidewalk connectivity has been a focus
Bikeway action plan. Bicycle Friendly Community Workshop March 5, 2007 Rochester, MN
 Bikeway action plan Summary The was held on March 5, 2007 at the Rochester Mayo Civic Center. The workshop was hosted by Rochester-Olmsted County Planning Department in collaboration with the League of
Parking & Transportation Update Spring Parking
 Parking & Transportation Update Spring 2018 As the beginning of the Spring 2018 semester rapidly approaches, Mason students, faculty and staff are reminded that traffic on and around the Fairfax campus
Baseline Survey of New Zealanders' Attitudes and Behaviours towards Cycling in Urban Settings
 Baseline Survey of New Zealanders' Attitudes and Behaviours towards Cycling in Urban Settings Highlights 67% of urban New Zealanders, 18 years of age or more own or have access to a bicycle that is in
Cobb Community Transit
 Cobb Community Transit Ridership Survey January 2014 1 Methodology Paper survey of 315 CCT riders 165 on local routes (margin of sampling error: ± 7.6%) 150 on express routes (margin of sampling error:
Transportation 2040 Update: Eudora Public Input As of June 1, 2017
 Transportation 2040 Update: Eudora Public Input As of June 1, 2017 Overview... 1 Survey Responses... 2 Overview The Lawrence Douglas County Metropolitan Planning Organization (MPO) is updating our long
BETHEL ROAD AND SEDGWICK ROAD CORRIDOR STUDY
 DRAFT PLAN City Council Meeting August 14, 2017 STUDY AREA Sedgwick Corridor State Route 160, principal arterial with Class 3 access management designation, commuter and freight route, connection to SR
WELCOME. City of Greater Sudbury. Transportation Demand Management Plan
 WELCOME City of Greater Sudbury Transportation Demand Management Plan Public Consultation Session St. Andrew s Place, Activity Hall 111 Larch Street Wednesday September 13, 2017 6:00 to 8:00 pm Welcome
NASHUA REGIONAL PLANNING COMMISSION REGIONAL BICYCLE AND PEDESTRIAN PLAN
 NASHUA REGIONAL PLANNING COMMISSION REGIONAL BICYCLE AND PEDESTRIAN PLAN June, 2005 Prepared by the Nashua Regional Planning Commission 2005 NRPC Regional Bicycle and Pedestrian Plan- JUNE 2005 ACKNOWLEDGEMENTS
WILMAPCO Public Opinion Survey Summary of Results
 Wilmington Area Planning Council WILMAPCO Public Opinion Survey Summary of Results Prepared by: 2955 Valmont Road, Suite 300 Boulder, Colorado 80301 t: 303-444-7863 f: 303-444-1145 www.n-r-c.com Table
Rider Satisfaction Survey Total Market 2006
 Rider Satisfaction Survey Total Market 2006 Prepared For: Valley Metro Fall 2006 2702 North 44 th Street Suite 100-A. Phoenix, Arizona 85008 602-707-0050 www.westgroupresearch.com Valley Metro 2006 Rider
The five potential solutions and some of their benefits and costs are listed in the following table: Ferry Patron Bike Parking Alternatives
 STAFF REPORT City Council of the City of Sausalito AGENDA TITLE: Ferry Patron Bicycle Parking Plan - Summer 2014 RECOMMENDED MOTION: Note and file informational item, no action necessary SUMMARY In April
2011 Countywide Attitudinal and Awareness Survey Results
 2011 Countywide Attitudinal and Awareness Survey Results Purpose of Study Establish baseline for measuring future performance Identify perceptions about transportation system, issues, priorities Assess
Golfers in Colorado: The Role of Golf in Recreational and Tourism Lifestyles and Expenditures
 Golfers in Colorado: The Role of Golf in Recreational and Tourism Lifestyles and Expenditures by Josh Wilson, Phil Watson, Dawn Thilmany and Steve Davies Graduate Research Assistants, Associate Professor
Speed Limits Study and Proposal. Public Input Session: 8/14/13
 Speed Limits Study and Proposal Public Input Session: 8/14/13 Why is Decatur a unique place for this project? First Community Transportation Plan in the nation with a Health Impact Assessment. Strong sense
Rider Satisfaction Survey Phoenix Riders 2004
 Rider Satisfaction Survey Riders Prepared For: Valley Metro Spring 2720 E. Thomas Rd. Bldg. A, Arizona 85016-8296 602-707-0050 answers@westgroupresearch.com Valley Metro Rider Satisfaction Survey - Page
June 3, Attention: David Hogan City of San Mateo 330 W. 2oth Avenue San Mateo, CA 94403
 June 3, 2015 Attention: David Hogan City of San Mateo 330 W. 2oth Avenue San Mateo, CA 94403 Regarding: PA # 15-030, Bridgepointe Shopping Center 2202 Bridgepointe Parkway, APN 035-466-10 Dear David: Enclosed
Complete Streets Policy Survey in Grant County, Kentucky
 Complete Streets Policy Survey in Grant County, Kentucky 1 Partnerships Northern Kentucky Independent District Health Department Fitness For Life Around Grant County (FFLAG) 2 Goals and Objectives Goals:
ABOUT THIS STUDY The Tenderloin-Little Saigon Community-Based Transportation Plan
 ABOUT THIS STUDY The Tenderloin-Little Saigon Community-Based Transportation Plan The Greater Tenderloin Community Study Milestones October Community based organizations (Tenderloin Housing Clinic and
This objective implies that all population groups should find walking appealing, and that it is made easier for them to walk more on a daily basis.
 Walking for life The Norwegian Walking Strategy Guro Berge Norwegian public Roads Administration "Walking for life" is the slogan for the National Walking Strategy that is now being formulated in Norway.
Evan Johnson, Tindale Oliver & Associates. Alan Danaher, P.E., PTOE, AICP, PTP
 To: Copies: From: Evan Johnson, Tindale Oliver & Associates Matt Muller, RTS Jesus Gomez, RTS Alan Danaher, P.E., PTOE, AICP, PTP Date: January 14, 2014 Subject: Ridership Projections Gainesville Streetcar
Sustainable Transportation Plan Draft 4/24/2012
 Sustainable Transportation Plan 2011-2012 Draft 4/24/2012 Contents I. Purpose... 3 II. Background... 3 III. Recent Accomplishments... 6 IV. Anticipated Changes... 8 V. Planning Process... 8 VI. Priorities...
Encouragement. Chapter 4. Education Encouragement Enforcement Engineering & Facilities Evaluation & Planning. Encouragement Chapter 4
 Encouragement Education Encouragement Enforcement Engineering & Facilities Evaluation & Planning Photo above: Children show off their ribbons at the Tour de Virginia Beach. Virginia Beach Bikeways and
Purpose and Need. Chapter Introduction. 2.2 Project Purpose and Need Project Purpose Project Need
 Chapter 2 Purpose and Need 2.1 Introduction The El Camino Real Bus Rapid Transit (BRT) Project (Project) would make transit and other transportation improvements along a 17.6-mile segment of the El Camino
Department of Transportation
 Department of Transportation I. Internal Scan The number of older drivers in the United States will double over the next 30 years. By 2030 one in five Americans will be age 65 or older. On a licensed-driver
Data Analysis February to March Identified safety needs from reported collisions and existing travel patterns.
 Welcome! Thank you for participating in today s Valencia Bikeway Improvements workshop. Data Analysis February to March Identified safety needs from reported collisions and existing travel patterns. Initial
How To Encourage More Efficient Transportation in Brazilian Cities
 How To Encourage More Efficient Transportation in Brazilian Cities Todd Litman Victoria Transport Policy Institute Presented Seminar on Discouraging The Use Of Cars São Paulo, Brazil 3 September 2013 Creating
WALK- AND bike-friendly TURLOCK
 WALK- AND bike-friendly TURLOCK Ideas to Encourage Walking and Biking Benefits to the COMMUNITY Get Connected People who walk and bike have many more opportunities for casual interactions with friends
CITY OF COCOA BEACH 2025 COMPREHENSIVE PLAN. Section VIII Mobility Element Goals, Objectives, and Policies
 CITY OF COCOA BEACH 2025 COMPREHENSIVE PLAN Section VIII Mobility Element Goals, Objectives, and Policies Adopted August 6, 2015 by Ordinance No. 1591 VIII MOBILITY ELEMENT Table of Contents Page Number
Congestion Management Report
 Congestion Management Report F.E. EVERETT TURNPIKE (NORTH), MERRIMACK Segment Length: 7.0 miles Daily Traffic Volumes: 60,000-69,000 Analysis Period: May 2015 Number of Traffic Signals: 0 Number of travel
Cabrillo College Transportation Study
 Cabrillo College Transportation Study Planning and Research Office Terrence Willett, Research Analyst, Principle Author Jing Luan, Director of Planning and Research Judy Cassada, Research Specialist Shirley
EAST VILLAGE SHOPPERS STUDY A SNAPSHOT OF TRAVEL AND SPENDING PATTERNS OF RESIDENTS AND VISITORS IN THE EAST VILLAGE
 EAST VILLAGE SHOPPERS STUDY A SNAPSHOT OF TRAVEL AND SPENDING PATTERNS OF RESIDENTS AND VISITORS IN THE EAST VILLAGE CONTENTS 2 4 5 6 7 16 17 19 SUMMARY INTRODUCTION BACKGROUND METHODOLOGY RESULTS CONCLUSION
MORE CONNECTIONS. Redesigning routes for the future of transit in Milwaukee County.
 What is MCTS NEXT? FASTER SERVICE MORE CONNECTIONS INCREASED ACCESSIBILITY Redesigning routes for the future of transit in Milwaukee County. MCTS NEXT is a new way of looking at transit. We re examining
El Paso County 2040 Major Transportation Corridors Plan
 El Paso County 2040 Major Transportation Corridors Plan Connect-our-County Online Transportation User Survey Preliminary Results June 24, 2010 Years of Residence 2. How many years have you LIVED HERE?
Southern California Walking/Biking Research And Creative Evaluation
 Southern California Walking/Biking Research And Creative Evaluation Quantitative Research Topline Report December 7, 2015 Background & Objectives The Southern California Association of Governments (SCAG)
Business owner or commercial property owner in Arlington, 8. Visitor in Arlington, 17
 1. How do you currently travel around your neighborhood? (Select your top 3) Resident of Arlington 86.72% 222 Worker in Arlington 20.70% 53 Business owner or commercial property own 3.13% 8 Visitor in
2016 Capital Bikeshare Member Survey Report
 2016 Capital Bikeshare Member Survey Report Prepared by: LDA Consulting Washington, DC 20015 (202) 548-0205 February 24, 2017 EXECUTIVE SUMMARY Overview This report presents the results of the November
The National Citizen Survey. Bowling Green, KY. Technical Appendices
 The National Citizen Survey Bowling Green, KY Technical Appendices 2014 National Research Center, Inc. Boulder, CO International City/County Management Association Washington, DC Contents Appendix A: Complete
Hamilton Transportation Master Plan Public Consultation. Public Information Centre One Summary
 Hamilton Transportation Master Plan Public Consultation Public Information Centre One Summary Table of Contents Introduction 1 Purpose 2 What Was Presented 2 Who Came to the Meeting 2 The Breakout Sessions
MTP BICYCLE ELEMENT UPDATE. November 2017
 MTP BICYCLE ELEMENT UPDATE November 2017 TIME FOR AN UPDATE Bicycle Element adopted in July 2008 Almost 10 years old Many planned facilities have been implemented 10 years more experience in planning,
Regional Alternatives Analysis. Downtown Corridor Tier 2 Evaluation
 Regional Alternatives Analysis Downtown Corridor Tier 2 Evaluation September 19, 2011 EVALUATION PROCESS REVIEW OF EVALUATION PROCESS Tier 1: Screen Seven Alignment Options into a Short List Tier 2: Evaluate
I-20 East Transit Initiative. Stakeholder Advisory Committee Meeting September 9, :00-6:00 PM
 I-20 East Transit Initiative Stakeholder Advisory Committee Meeting September 9, 2010 4:00-6:00 PM Meeting Agenda Introductions Project Background Study Overview Role of the SAC Initial Study Findings
o n - m o t o r i z e d transportation is an overlooked element that can greatly enhance the overall quality of life for the community s residents.
 N o n - m o t o r i z e d transportation is an overlooked element that can greatly enhance the overall quality of life for the community s residents. 84 Transportation CHAPTER 11 INTRODUCTION Transportation
Bowling Green, KY Technical Appendices
 Bowling Green, KY Technical Appendices 2018 2955 Valmont Road Suite 300 777 North Capitol Street NE Suite 500 Boulder, Colorado 80301 Washington, DC 20002 n-r-c.com 303-444-7863 icma.org 800-745-8780 Contents
HENDERSON DEVELOPMENT 213, 217, 221, 221 ½, 223 HENDERSON AVENUE and 65 TEMPLETON STREET OTTAWA, ONTARIO TRANSPORTATION OVERVIEW.
 HENDERSON DEVELOPMENT 213, 217, 221, 221 ½, 223 HENDERSON AVENUE and 65 TEMPLETON STREET OTTAWA, ONTARIO TRANSPORTATION OVERVIEW Prepared for: 2294170 Ontario Inc. February 2, 2017 117-652 Report_1.doc
2018 Transportation Survey October 17, Prepared by:
 Transportation Survey October 17, Prepared by: Overview Methodology Systemwide results Strengths/Weaknesses by mode Importance of possible improvements Conclusions Methodology 500 Chittenden County residents
Lee s Summit Road Improvement Study Public Open House June 7, 2007 Summary of Comment Card Responses
 Lee s Summit Road Improvement Study Public Open House June 7, 2007 Summary of Comment Card Responses Introduction At the Lee s Summit Road Improvement Study Public Open House held Thursday, June 7, 2007
2045 Long Range Transportation Plan. Summary of Draft
 2045 Long Range Transportation Plan Summary of Draft Fredericksburg Area Metropolitan Planning Organization The George Washington Region includes the City of Fredericksburg and the counties of Caroline,
DRAFT BUENA VISTA 2020 TRANSPORTATION PLAN
 DRAFT BUENA VISTA 2020 TRANSPORTATION PLAN DEVELOPED BY THE TRANSPORTATION PLANNING DIVISION OF THE VIRGINIA DEPARTMENT OF TRANSPORTATION IN COOPERATION WITH THE U.S. DEPARTMENT OF TRANSPORTATION, FEDERAL
OVERVIEW OF METHODOLOGY
 I N T R O D U C T I O N The Orange County Transportation Authority () is the county transportation commission responsible for planning, funding and delivering transportation improvements in Orange County
Travel and Rider Characteristics for Metrobus
 Travel and Rider Characteristics for Metrobus 040829040.15 Travel and Rider Characteristics for Metrobus: 2012-2015 Overview The Miami Dade County Metropolitan Planning Organization (MPO) conducted a series
JOINT PARTNERSHIPS: Working Together To Support Light Rail in Santa Monica
 JOINT PARTNERSHIPS: Working Together To Support Light Rail in Santa Monica ITY OF ANTA MONICA RAIL-VOLUTION / OCTOBER 17, 2012 SARAH LEJEUNE, PRINCIPAL PLANNER, STRATEGIC + TRANSPORTATION PLANNING DIVISION
Engagement Summary: Round 1
 Engagement Summary: Round 1 June 21, 2018 REPORT FOR: City of Courtenay 830 Cliff Avenue Courtenay, BC V9N 2J7 PREPARED BY: Urban Systems Ltd. 550 1090 Home Street Vancouver, BC V6B 2W9 ALONG WITH: Kathleen
CONNECTING PEOPLE TO PLACES
 CONNECTING PEOPLE TO PLACES 82 EAST BENCH MASTER PLAN 07 Introduction The East Bench transportation system is a collection of slow moving, treelined residential streets and major arteries that are the
North Shore Transportation Improvement Strategy
 North Shore Transportation Improvement Strategy Preliminary, Near-term Recommendation 2016 April Transportation Improvement Strategy (TIS) Comprehensive and Analytical A multi-modal transportation strategy
NM-POLICY 1: Improve service levels, participation, and options for non-motorized transportation modes throughout the County.
 Transportation PRINCE WILLIAM COUNTY 2008 COMPREHENSIVE PLAN NON-MOTORIZED PLAN CONTENTS Goals, Policies, and Action Strategies Table 4 (Bike Facility Classifications and Descriptions) Table 5 (Bike Facility
Urban planners have invested a lot of energy in the idea of transit-oriented
 DOES TRANSIT-ORIENTED DEVELOPMENT NEED THE TRANSIT? D A N I E L G. C H AT M A N Urban planners have invested a lot of energy in the idea of transit-oriented developments (TODs). Developing dense housing
METRO Light Rail: Changing Transit Markets in the Phoenix Metropolitan Area
 METRO Light Rail: Changing Transit Markets in the Phoenix Metropolitan Area Abhishek Dayal, AICP Planner III, METRO Light Rail Phoenix, AZ BACKGROUND Transit in the Phoenix Region Transit services in the
Birmingham Connected. Edmund Salt. Transportation Policy Birmingham City Council
 Birmingham Connected Edmund Salt Transportation Policy Birmingham City Council www.birmingham.gov.uk/connected Birmingham Connected the story so far Broadly following EU Guidance We ve done all of this
Sound Transit Permit Parking Program
 Sound Transit Permit Parking Program Purpose The purposes of the proposed permit parking program are to increase the number of transit customers accommodated per parking space provided, to improve the
EXECUTIVE SUMMARY. A Executive Summary
 EXECUTIVE SUMMARY The Monroe Avenue Parking and Mobility Study was initiated to provide a comprehensive assessment of existing parking and mobility conditions along the Monroe Avenue corridor from the
SMART 1 Public Meeting #1. February 24, 2016
 SMART 1 Public Meeting #1 February 24, 2016 Agenda Who is the SMTC? SMART 1 project overview Syracuse Metropolitan Transportation Council An Introduction: Who we are & what we do What is an MPO? A Metropolitan
Providence Downtown Transit Connector STAKEHOLDER MEETING #2. Stakeholder Meeting #1 October 24, 2016
 Providence Downtown Transit Connector STAKEHOLDER MEETING #2 Stakeholder Meeting #1 October 24, 2016 February 2017 1 AGENDA 1 DTC Goals and Expectations 2 Street Design Concepts 3 Potential Benefits and
SHORT RANGE TRANSIT PLAN: Survey Results and Analysis
 GOLD COAST TRANSIT DISTRICT SHORT RANGE TRANSIT PLAN: Survey Results and Analysis FY 2014-15 to FY 2018-19 Overview As part of the Short Range Transit Plan (SRTP) community outreach process, Gold Coast
Bay Area Council 2016 Report of Survey Results Regarding Transportation
 Bay Area Council Report of Survey Results Regarding Transportation Methodology Web survey of San Francisco Bay Area residents The survey was available in English, Chinese, and Spanish Report includes analysis
Moving Ahead. (Community Engagement) Chapter Three
 Chapter Three") 3 Community Chapter Three Moving Ahead (Community Engagement) engagement provided an exciting opportunity to engage Redwood City residents, workers, and business owners people who walk, bike, take transit,
3 Community Chapter Three Moving Ahead (Community Engagement) engagement provided an exciting opportunity to engage Redwood City residents, workers, and business owners people who walk, bike, take transit,
Chapter 2. Bellingham Bicycle Master Plan Chapter 2: Policies and Actions
 Chapter 2 Bellingham Bicycle Master Plan Chapter 2: Policies and Actions Chapter 2: Policies and Actions The Bicycle Master Plan provides a road map for making bicycling in Bellingham a viable transportation
Sun Metro Fixed Route Rider Survey
 University of Texas at El Paso DigitalCommons@UTEP IPED Technical Reports Institute for Policy and Economic Development 8-1-2006 Dennis L. Soden University of Texas at El Paso, desoden@utep.edu Mathew
PEDESTRIAN ACTION PLAN
 ATTACHMENT 2 CITY OF SANTA MONICA PEDESTRIAN ACTION PLAN CITY OF SANTA MONICA PEDESTRIAN ACTION PLAN This page intentionally left blank EXECUTIVE SUMMARY CHAPTER 1 EXECUTIVE SUMMARY Setting the Stage
Cheryl Thole CUTR/NBRTI, Senior Research Associate Tampa, Florida
 A Change in Accessibility and Convenience? Implementing BRT and the Impact on Transit Riders Cheryl Thole CUTR/NBRTI, Senior Research Associate Tampa, Florida Project Background Greater station spacing
Bluffdale South (SR140) Bicycle/Shoulder Lanes Project Type Bicycle
 Bicycle/Shoulder Lanes Project Type Bicycle") Bluffdale 14600 South (SR140) Bicycle/Shoulder Lanes Project Type Bicycle From Pony Express to UPRR Bridge over SR-140 $ 669,700 $ 624,361 To build bicycle/shoulder lanes on SR-140. SR-140 is an official
Bluffdale 14600 South (SR140) Bicycle/Shoulder Lanes Project Type Bicycle From Pony Express to UPRR Bridge over SR-140 $ 669,700 $ 624,361 To build bicycle/shoulder lanes on SR-140. SR-140 is an official
APPENDIX B. TDM Existing Conditions
 APPENDIX B TDM Existing Conditions SCARBOROUGH CENTRE TMP TRANSPORTATION DEMAND MANAGEMENT INTRODUCTION Scarborough Centre has grown into a mixed-use hub for population, transportation, and employment
Changing Commuting Patterns and Impacts on Planning & Infrastructure. William E. Frawley, AICP Texas A&M Transportation Institute October 3, 2013
 Changing Commuting Patterns and Impacts on Planning & Infrastructure William E. Frawley, AICP Texas A&M Transportation Institute October 3, 2013 Change is Constant... Various studies and data sources 1960
9. Parking Supporting Statement
 9. Parking Supporting Statement Content 1. Setting the Scene 2. Vision 3. Parking and the Shared Priorities 4. Issues 5. Delivery Programme in the first Plan Period 2001/02 2005/06 6. Good Practice 7.
Extracting Maximum Benefit from Parking Policy - 10 Years Experience in Perth, Australia. By Emmerson Richardson Sinclair Knight Merz
 Extracting Maximum Benefit from Parking Policy - 10 Years Experience in Perth, Australia By Emmerson Richardson Sinclair Knight Merz Snapshot of Perth > Metropolitan Area Population 1.7 million > 3.5 million