Traffic Safety Barriers to Walking and Bicycling Analysis of CA Add-On Responses to the 2009 NHTS
|
|
|
- Polly Norton
- 5 years ago
- Views:
Transcription


1 Traffic Safety Barriers to Walking and Bicycling Analysis of CA Add-On Responses to the 2009 NHTS NHTS Users Conference June 2011 Robert Schneider, Swati Pande, & John Bigham, University of California Berkeley Safe Transportation Research & Education Center (SafeTREC)
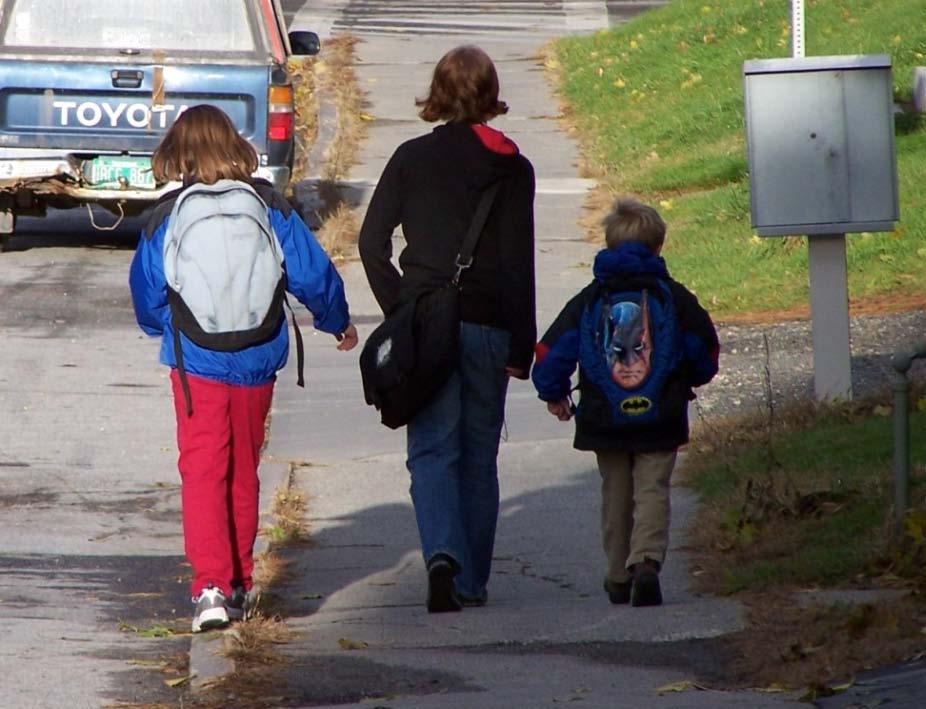
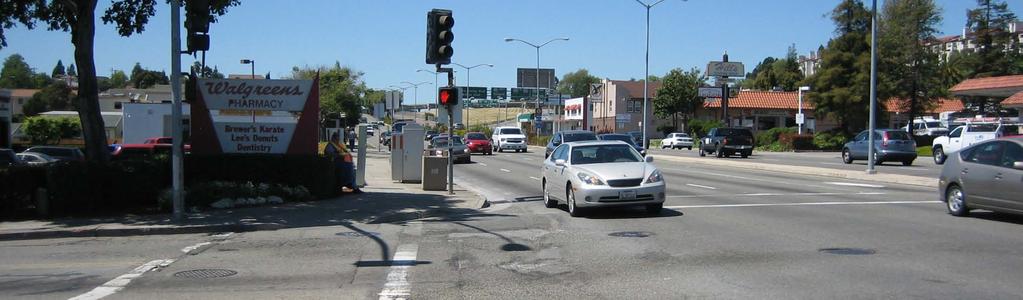
2 Community Goals vs. Perceived Pedestrian & Bicycle Safety Barriers Goal: Increase walking & bicycling If there was less traffic I would probably walk even more. --Male, Age 30, San Francisco Fillmore Street Bicycling itself I would do it if I wasn t right up next to cars. --Female, Age 52, South SF Goal: Improve pedestrian & bicycle safety There are definitely certain intersections that I m very cautious about because I have seen drivers do crazy things --Female, Age 52, South SF Sometimes I feel scared for [bicyclists] sometimes it is very hard to see them and sometimes they have no protection. --Male, Age 30-39, Berkeley
3 Community Goals vs. Perceived Pedestrian & Bicycle Safety Barriers Goal: Increase walking & bicycling If there was less traffic I would probably walk even more. --Male, Age 30, San Francisco Fillmore Street Bicycling itself I would do it if I wasn t right up next to cars. --Female, Age 52, South SF Goal: Improve pedestrian & bicycle safety There are definitely certain intersections that I m very cautious about because I have seen drivers do crazy things --Female, Age 52, South SF Sometimes I feel scared for [bicyclists] sometimes it is very hard to see them and sometimes they have no protection. --Male, Age 30-39, Berkeley
4 Community Goals vs. Perceived Pedestrian & Bicycle Safety Barriers Goal: Increase walking & bicycling If there was less traffic I would probably walk even more. --Male, Age 30, San Francisco Fillmore Street Bicycling itself I would do it if I wasn t right up next to cars. --Female, Age 52, South SF Goal: Improve pedestrian & bicycle safety There are definitely certain intersections that I m very cautious about because I have seen drivers do crazy things --Female, Age 52, South SF Sometimes I feel scared for [bicyclists] sometimes it is very hard to see them and sometimes they have no protection. --Male, Age 30-39, Berkeley


5 What Factors are Associated with Perceived Pedestrian & Bicycle Safety Barriers?
6 2009 NHTS California Supplement All people N = 47,559 (in 21,225 households) Person File
7 2009 NHTS California Supplement All people N = 47,559 (in 21,225 households) Walked 1+ times during week N = 29,894 Person File
8 2009 NHTS California Supplement All people N = 47,559 (in 21,225 households) Walked 1+ times during week N = 29,894 Answered walk barriers N = 23,105 Person File
9 2009 NHTS California Supplement All people N = 47,559 (in 21,225 households) Person File Walked 1+ times during week N = 29,894 Answered walk barriers N = 23,105 Biked 1+ times during week N = 5,175
10 2009 NHTS California Supplement All people N = 47,559 (in 21,225 households) Person File Walked 1+ times during week N = 29,894 Answered walk barriers N = 23,105 Biked 1+ times during week N = 5,175 Answered bike barriers N = 3,073
11 2009 NHTS California Supplement: Please tell me if any of the following keep you from doing more walking Too busy Not enough light Too many things to carry No shops or interesting places to go No nearby paths or trails No one to walk with Poor health No nearby parks Fast traffic No sidewalks Fear street crime Too many cars Street crossings unsafe Traveling with small children Air pollution N = 23,105 (could choose more than 1) Not enough people around Streets too wide 0% 2% 4% 6% 8% 10% 12% 14% Percent of respondents who answered walking barriers questions
12 2009 NHTS California Supplement: Please tell me if any of the following keep you from doing more walking Too busy Not enough light Too many things to carry No shops or interesting places to go No nearby paths or trails No one to walk with Poor health No nearby parks Fast traffic No sidewalks Fear street crime Too many cars Street crossings unsafe Traveling with small children Air pollution Traffic Safety Factor (8.1% of variance) Not enough people around Streets too wide 0% 2% 4% 6% 8% 10% 12% 14% Percent of respondents who answered walking barriers questions
13 2009 NHTS California Supplement: Please tell me if any of the following keep you from doing more walking Too busy Not enough light Too many things to carry No shops or interesting places to go No nearby paths or trails No one to walk with Poor health No nearby parks Fast traffic No sidewalks Fear street crime Too many cars Street crossings unsafe Traveling with small children Air pollution Proximity Factor (6.3% of variance) Not enough people around Streets too wide 0% 2% 4% 6% 8% 10% 12% 14% Percent of respondents who answered walking barriers questions
14 2009 NHTS California Supplement: Please tell me if any of the following keep you from doing more walking Too busy Not enough light Too many things to carry No shops or interesting places to go No nearby paths or trails No one to walk with Poor health No nearby parks Fast traffic No sidewalks Fear street crime Too many cars Street crossings unsafe Traveling with small children Air pollution Security Factor (6.2% of variance) Not enough people around Streets too wide 0% 2% 4% 6% 8% 10% 12% 14% Percent of respondents who answered walking barriers questions
15 2009 NHTS California Supplement: Please tell me if any of the following keep you from doing more walking Too busy Not enough light Too many things to carry No shops or interesting places to go No nearby paths or trails No one to walk with Poor health No nearby parks Fast traffic No sidewalks Fear street crime Too many cars Street crossings unsafe Traveling with small children Air pollution Effort Factor (6.2% of variance) Not enough people around Streets too wide 0% 2% 4% 6% 8% 10% 12% 14% Percent of respondents who answered walking barriers questions
16 2009 NHTS California Supplement: Please tell me if any of the following keep you from doing more biking Too busy Fast traffic Not enough light Too many cars Not enough bike lanes Street crossings unsafe No nearby paths or trails Too many things to carry No sidewalks No one to bike with Traveling with small children No shops or interesting places to go Air pollution Fear street crime N = 3,073 (could choose more than 1) Poor health Not enough people around 0% 2% 4% 6% 8% 10% 12% 14% Percent of respondents who answered bicycle barriers questions
17 2009 NHTS California Supplement: Please tell me if any of the following keep you from doing more biking Too busy Fast traffic Not enough light Too many cars Not enough bike lanes Street crossings unsafe No nearby paths or trails Too many things to carry No sidewalks No one to bike with Traveling with small children No shops or interesting places to go Air pollution Fear street crime Traffic Safety Factor (8.4% of variance) Poor health Not enough people around 0% 2% 4% 6% 8% 10% 12% 14% Percent of respondents who answered bicycle barriers questions
18 2009 NHTS California Supplement: Please tell me if any of the following keep you from doing more biking Too busy Fast traffic Not enough light Too many cars Not enough bike lanes Street crossings unsafe No nearby paths or trails Too many things to carry No sidewalks No one to bike with Traveling with small children No shops or interesting places to go Air pollution Fear street crime Social Factor (7.0% of variance) Poor health Not enough people around 0% 2% 4% 6% 8% 10% 12% 14% Percent of respondents who answered bicycle barriers questions
19 2009 NHTS California Supplement: Please tell me if any of the following keep you from doing more biking Too busy Fast traffic Not enough light Too many cars Not enough bike lanes Street crossings unsafe No nearby paths or trails Too many things to carry No sidewalks No one to bike with Traveling with small children No shops or interesting places to go Air pollution Fear street crime Facilities Factor (6.8% of variance) Poor health Not enough people around 0% 2% 4% 6% 8% 10% 12% 14% Percent of respondents who answered bicycle barriers questions
20 Dependent Variables Walk Traffic Safety Barrier factor score Too many cars Street crossings unsafe Fast traffic Streets too wide Air pollution Bicycle Traffic Safety Barrier factor score Fast traffic Street crossings unsafe Too many cars Not enough light Have enough time
21 What Characteristics are Associated with Perceived Pedestrian & Bicycle Safety Barriers? Traffic Safety Factor for each Respondent
22
23
24
25 What Characteristics are Associated with Perceived Pedestrian & Bicycle Safety Barriers? Traffic Safety Factor for each Respondent Roadway System & Design Land Use & Surrounding Environment Reported Crashes Travel Behavior Individual & Household
26 What Characteristics are Associated with Perceived Pedestrian & Bicycle Safety Barriers? Traffic Safety Factor for each Respondent Roadway System & Design Land Use & Surrounding Environment Reported Crashes Travel Behavior Individual & Household Transportation agency roadway base layers
27 What Characteristics are Associated with Perceived Pedestrian & Bicycle Safety Barriers? Traffic Safety Factor for each Respondent Roadway System & Design Land Use & Surrounding Environment Reported Crashes Travel Behavior Individual & Household Census, Bike & Walk Friendly Communities
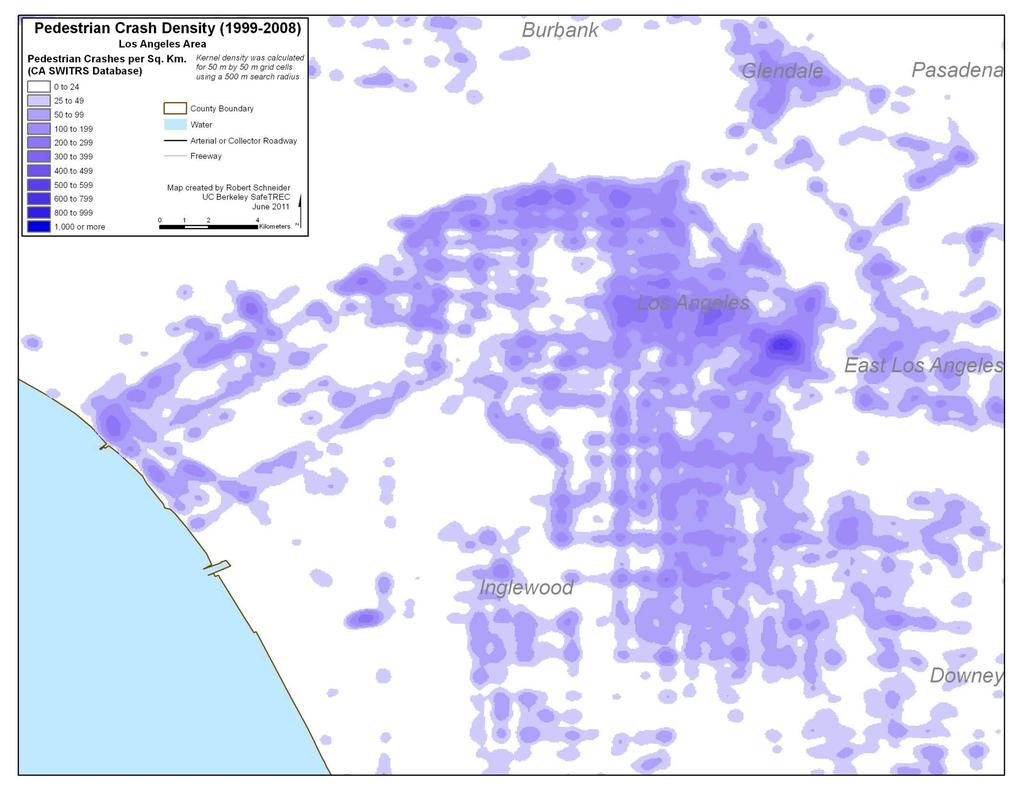
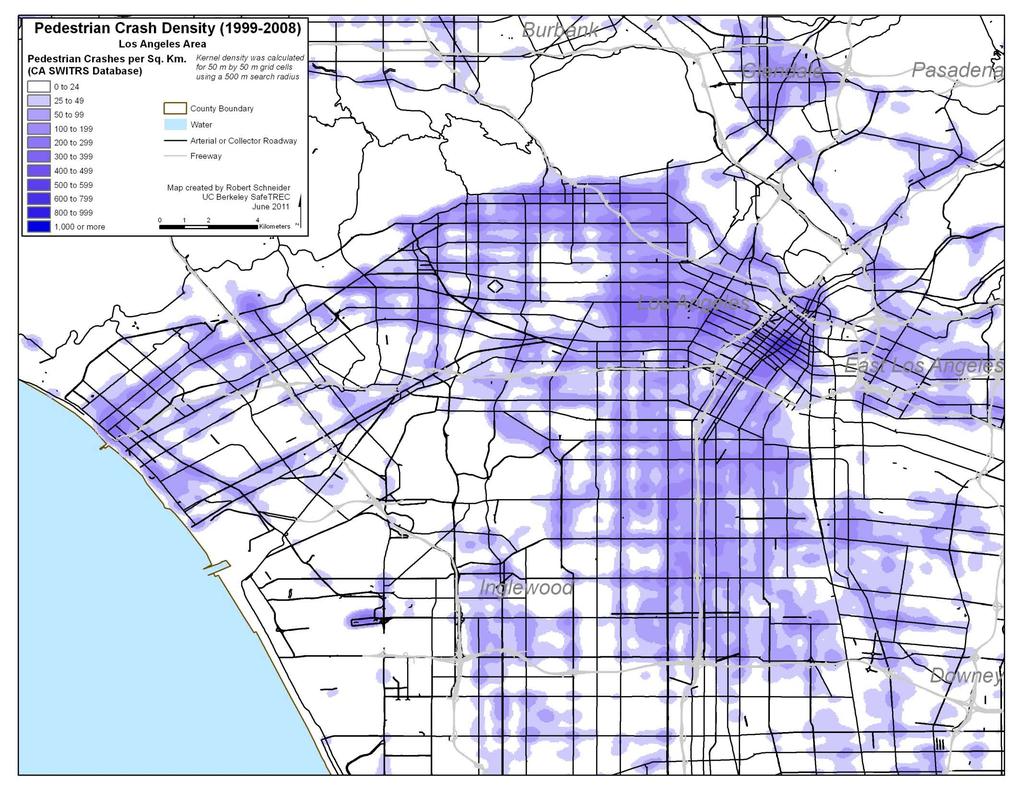
28 What Characteristics are Associated with Perceived Pedestrian & Bicycle Safety Barriers? Traffic Safety Factor for each Respondent Roadway System & Design Land Use & Surrounding Environment Reported Crashes Travel Behavior Individual & Household California SWITRS Reported Crash Database
29 What Characteristics are Associated with Perceived Pedestrian & Bicycle Safety Barriers? Traffic Safety Factor for each Respondent Roadway System & Design Land Use & Surrounding Environment Reported Crashes Travel Behavior Individual & Household National Household Travel Survey
30 Linear Random-Intercept Model Explanatory variables and associated parameters
31 Linear Random-Intercept Model Unobserved correlated error between people in the same household (normal)
32 Linear Random-Intercept Model Unobserved error across all people (normal)
33 Linear random intercept model for 2009 CA NHTS survey respondents 1 Variable Parameter Est. p-value Constant Major road miles within 100 m Local street miles within 400 m Population within 400 m Walked for recreation only Number of walking trips in previous week Male White Number of children in household under age Is an automobile driver Medical condition preventing travel Lower household income (< $30,000/yr) Roadway & Land Use Travel & Socioeconomic Random Effects Household-level error standard deviation 0.34 Person-level error standard deviation 0.92 Overall Model Sample Size (Number of people) Sample Size (Number of households) Log-Likelihood (Constant) Log-Likelihood (Restricted Model) 2 Log-Likelihood (Full Model) Linear Random- Intercept Model (15836 households people) Pedestrian Traffic Safety Barriers Factor
34 Characteristics Associated with Perceived Pedestrian Traffic Safety Barriers Roadway System & Design Land Use & Surrounding Environment Reported Crashes Travel Behavior Individual & Household (+) Population density *** (+) Major roads *** (-) Local streets *** Statistical significance: *** (p < 0.01) ** (0.01 < p < 0.05) * (0.05 < p < 0.10)
35 Characteristics Associated with Perceived Pedestrian Traffic Safety Barriers Roadway System & Design Land Use & Surrounding Environment Reported Crashes Travel Behavior Individual & Household (+) Major roads *** (-) Local streets *** (+) Population density *** Statistical significance: *** (p < 0.01) ** (0.01 < p < 0.05) * (0.05 < p < 0.10) (+) More walk trips ** (-) Walk rec. only *** (+) Number of kids *** (+) Disability *** (+) Low income *** (-) Male *** (-) White *** (-) Driver ***
36 Linear random intercept model for 2009 CA NHTS survey respondents 1 Variable Parameter Est. p-value Constant Major road miles within 100 m Local street miles within 400 m Population within 400 m Household is in a Bicycle Friendly Community Bicycled for recreation only Number of bicycling trips in previous week Male White Medical condition preventing travel Roadway & Land Use Travel & Socioeconomic Random Effects Household-level error standard deviation 0.31 Person-level error standard deviation 0.94 Overall Model Sample Size (Number of people) 3073 Sample Size (Number of households) 2570 Log-Likelihood (Constant) Log-Likelihood (Restricted Model) Log-Likelihood (Full Model) ) Th d d t i bl i th d l i th bi l t ffi f t b i f t Linear Random- Intercept Model (2570 households, 3073 people) Bicycle Traffic Safety Barriers Factor
37 Characteristics Associated with Perceived Bicycle Traffic Safety Barriers Roadway System & Design Land Use & Surrounding Environment Reported Crashes Travel Behavior Individual & Household (+) Population density * (+) Major roads * Statistical significance: *** (p < 0.01) ** (0.01 < p < 0.05) * (0.05 < p < 0.10)
38 Characteristics Associated with Perceived Bicycle Traffic Safety Barriers Roadway System & Design Land Use & Surrounding Environment Reported Crashes Travel Behavior Individual & Household (+) Major roads * (+) Population density * Statistical significance: *** (p < 0.01) ** (0.01 < p < 0.05) * (0.05 < p < 0.10) (-) More bike trips (-) Bike rec. only ** (+) Disability (-) Male *** (-) White *
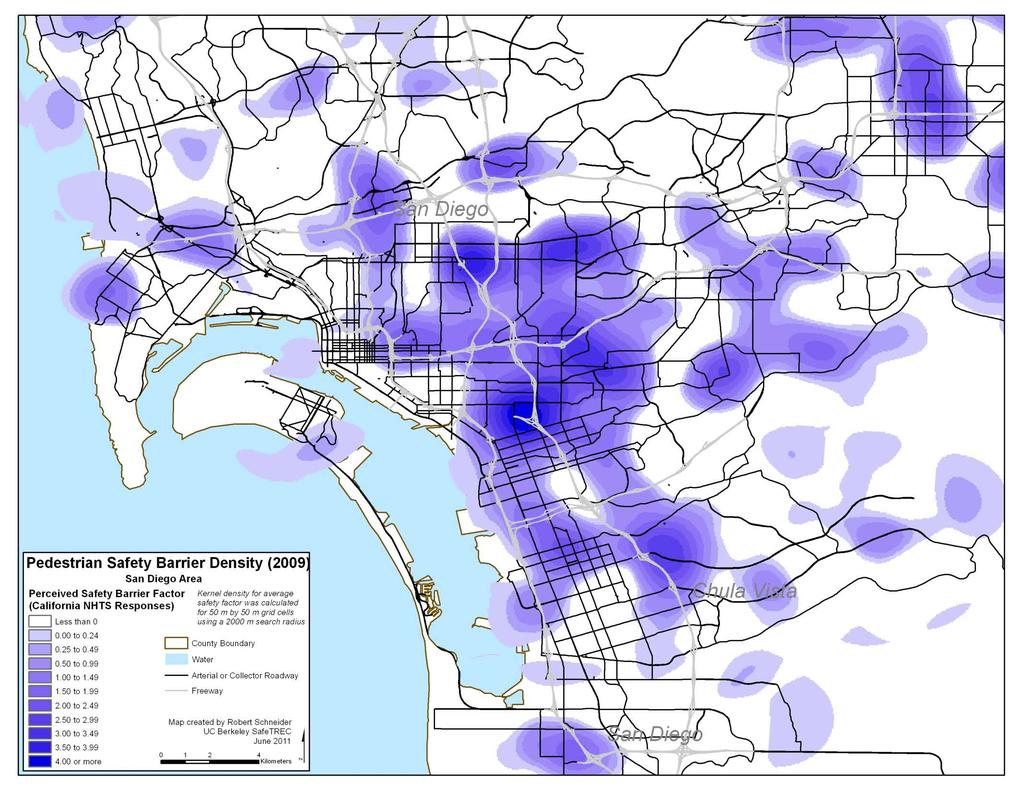
39 What about the relationship between reported crashes & perceived traffic safety risk? Roadway System & Design Land Use & Surrounding Environment Reported Crashes Travel Behavior Individual & Household?????
40

41 La Jolla El Cajon San Diego Neighborhoods
42 La Jolla El Cajon San Diego Neighborhoods
43 La Jolla El Cajon San Diego Neighborhoods

44 Downtown San Diego Coronado Chula Vista

45 Downtown San Diego Coronado Chula Vista
46 Conclusions NHTS travel behavior & socioeconomic data improves understanding of traffic safety barriers and suggests comprehensive set of interventions Major roadways, population density slower automobile speeds, mode shift strategies Utility travel, more walk trips, fewer bike trips Complete Streets for all modes Disabilities, female, minority, low-income, more kids accessibility improvements, Safe Routes to School, targeted education & encouragement
47 Considerations & Future Research Greater understanding of barriers to people who already walk & bike, but not people who don t Not all major roads are alike Could analyze respondent tours Could ask more detailed questions about traffic safety barriers instead of factor analysis Need more research on perceived vs. actual pedestrian & bicycle safety risk

48 Questions & Answers
49
50
51
52
53 Contact Information: Robert Schneider, Ph.D. UC Berkeley SafeTREC
2017 Northwest Arkansas Trail Usage Monitoring Report
 2017 Northwest Arkansas Trail Usage Monitoring Report Summary Findings: The study showed that average daily weekday bicycle volumes per study site increased by about 32% between 2015 and 2017, from 142
Walking and Biking in California: Summary of Findings
 Walking and Biking in California: Summary of Findings Nancy McGuckin Travel Behavior Analyst www.travelbehavior.us Goal for California Add-on to the National Household Travel Survey: Obtain data for performance
International Physical Activity Prevalence Study SELF-ADMINISTERED ENVIRONMENTAL MODULE
 International Physical Activity Prevalence Study SELF-ADMINISTERED ENVIRONMENTAL MODULE There is increasing interest in the contextual (environmental) barriers that prevent or limit the opportunity to
Attitude towards Walk/Bike Environments and its Influence on Students Travel Behavior: Evidence from NHTS, 2009
 Attitude towards Walk/Bike Environments and its Influence on Students Travel Behavior: Evidence from NHTS, 2009 Dr. Mintesnot Woldeamanuel California State University Northridge The 9 th Active Living
Ongoing Challenges with Pedestrian Safety Data May 15: 10:15AM-11:45AM. PedsCount! 2014 May 14-16, 2014 Sacramento, CA
 Ongoing Challenges with Pedestrian Safety Data May 15: 10:15AM-11:45AM PedsCount! 2014 May 14-16, 2014 Sacramento, CA David Ragland, Director, Safe Transportation Research & Education Center (SafeTREC),
El Paso County 2040 Major Transportation Corridors Plan
 El Paso County 2040 Major Transportation Corridors Plan Connect-our-County Online Transportation User Survey Preliminary Results June 24, 2010 Years of Residence 2. How many years have you LIVED HERE?
How Common is Pedestrian Travel To, From, and Within Shopping Districts?
 How Common is Pedestrian Travel To, From, and Within Shopping Districts? Robert J. Schneider, PhD* University of California, Berkeley, Safe Transportation Research and Education Center Dwight Way # Berkeley,
Chapter 14 PARLIER RELATIONSHIP TO CITY PLANS AND POLICIES. Recommendations to Improve Pedestrian Safety in the City of Parlier (2014)
") Chapter 14 PARLIER This chapter describes the current status and future plans for biking and walking in the City of Parlier. RELATIONSHIP TO CITY PLANS AND POLICIES The Parlier General Plan is the primary
Chapter 14 PARLIER This chapter describes the current status and future plans for biking and walking in the City of Parlier. RELATIONSHIP TO CITY PLANS AND POLICIES The Parlier General Plan is the primary
APPENDIX A. Outreach Summary
 APPENDIX A Outreach Summary COUNTYWIDE TRANSPORTATION PLAN Summary of Public Outreach and Engagement To gather an understanding of the transportation issues and priorities throughout the county, and inform
Southern California Walking/Biking Research And Creative Evaluation
 Southern California Walking/Biking Research And Creative Evaluation Quantitative Research Topline Report December 7, 2015 Background & Objectives The Southern California Association of Governments (SCAG)
San Mateo County Comprehensive Bicycle and Pedestrian Plan Open House
 San Mateo County Comprehensive Bicycle and Pedestrian Plan Open House October 28, 2010 Presented to San Mateo County residents and interested parties by Lauren Ledbetter, Alta Planning + Design Matt Haynes,
Findings and Lessons from Safe Routes to Transit (SR2T) David Weinzimmer, SafeTREC, UC Berkeley PedsCount!, May 2014
 David Weinzimmer, SafeTREC, UC Berkeley PedsCount!, May 2014") Findings and Lessons from Safe Routes to Transit (SR2T) David Weinzimmer, SafeTREC, UC Berkeley PedsCount!, May 2014 Safe Routes to Transit (SR2T) Funded by Regional Measure 2 (2004), $20M in total funding
Findings and Lessons from Safe Routes to Transit (SR2T) David Weinzimmer, SafeTREC, UC Berkeley PedsCount!, May 2014 Safe Routes to Transit (SR2T) Funded by Regional Measure 2 (2004), $20M in total funding
2017 North Texas Regional Bicycle Opinion Survey
 2017 North Texas Regional Bicycle Opinion Survey Sustainable Development Program Kevin Kokes, AICP Public Meetings April, 2018 North Central Texas Council of Governments MPO for the Dallas-Fort Worth Region
Summary Report: Built Environment, Health and Obesity
 Research and education Built Environment Edmonton Project Summary Report: Built Environment, Health and Obesity Introduction In 2007 the Canadian Institutes of Health Research and the Heart and Stroke
Rail Station Fact Sheet Downtown Carrollton Station
 Rail Station Fact Sheet Downtown Carrollton Station Station Overview Downtown Carrollton Station is located at East Belt Line Road and Broadway Street near the historic Downtown Carrollton Square. The
ESP 178 Applied Research Methods. 2/26/16 Class Exercise: Quantitative Analysis
 ESP 178 Applied Research Methods 2/26/16 Class Exercise: Quantitative Analysis Introduction: In summer 2006, my student Ted Buehler and I conducted a survey of residents in Davis and five other cities.
Pedestrian Survey Report
 Pedestrian Survey Report The City of Albany conducted a Pedestrian Survey in 2007 with the purpose of identifying resident s concerns about barriers to walking and accessibility in the City. The survey
GIS Based Data Collection / Network Planning On a City Scale. Healthy Communities Active Transportation Workshop, Cleveland, Ohio May 10, 2011
 The Purpose of GIS Based Network Planning GIS Based Data Collection / Network Planning Healthy Communities Active Transportation Conference Tuesday, May 10, 2011 10:00 AM Norman Cox, LLA, ASLA. Ann Arbor,
BICYCLE ACTIVITY AND ATTITUDES SURVEY
 BICYCLE ACTIVITY AND ATTITUDES SUBMITTED TO: STATE OF NEW JERSEY Department of Transportation (NJDOT) Trenton, New Jersey 1035 Parkway Avenue P.O. Box 600 Trenton, NJ 08635-0600 SUBMITTED BY: ALAN M. VOORHEES
2014 Regional Bicycle and Pedestrian Study Evaluation Tools Leslie A. Meehan, AICP MPO Technical Coordinating Committee Meeting April 1, 2015
 Mayor Mayor Kenneth Karl Dean, Wilber, Chairman 2014 Regional Bicycle and Pedestrian Study Evaluation Tools Leslie A. Meehan, AICP MPO Technical Coordinating Committee Meeting April 1, 2015 Evaluation
Local environment characteristics associated with walking and taking transit to shopping districts
 THE JOURNAL OF TRANSPORT AND LAND USE http://jtlu.org VOL. 8 NO. 2 [2015] pp. 125 147 Local environment characteristics associated with walking and taking transit to shopping districts Robert James Schneider
About the Active Transportation Alliance
 About the Active Transportation Alliance Chicagoland s voice for better biking, walking and transit Founded 1985 7,000 members, ~33 full time staff Serve Chicago metro region 1 More Cars, More Driving
Thresholds and Impacts of Walkable Distance for Active School Transportation in Different Contexts
 Thresholds and Impacts of Walkable Distance for Active School Transportation in Different Contexts Xuemei Zhu, Chanam Lee, Zhipeng Lu, Chia-Yuan Yu College of Architecture, Texas A&M University CONTENT
Rerouting Mode Choice Models: How Including Realistic Route Options Can Help Us Understand Decisions to Walk or Bike
 Portland State University PDXScholar TREC Friday Seminar Series Transportation Research and Education Center (TREC) 4-1-2016 Rerouting Mode Choice Models: How Including Realistic Route Options Can Help
APPENDIX D. BICYCLE AND PEDESTRIAN AWARENESS SURVEY (Completed by Zogby International)
") APPENDIX D BICYCLE AND PEDESTRIAN AWARENESS SURVEY (Completed by Zogby International) Residents Views On Bicycling, Walking, and Jogging In Onondaga County Submitted to: Danielle Zebley Syracuse Metropolitan
APPENDIX D BICYCLE AND PEDESTRIAN AWARENESS SURVEY (Completed by Zogby International) Residents Views On Bicycling, Walking, and Jogging In Onondaga County Submitted to: Danielle Zebley Syracuse Metropolitan
Measuring Transportation: Traffic, Mobility and Accessibility
 Measuring Transportation: Traffic, Mobility and Accessibility THIS FEATURE COMPARES THREE APPROACHES TO MEASURING TRANSPORTATION SYSTEM PERFORMANCE. TRAFFIC-BASED MEASUREMENTS EVALUATE MOTOR VEHICLE MOVEMENT;
Rail Station Fact Sheet CentrePort/DFW Airport Station
 Rail Station Fact Sheet CentrePort/DFW Airport Station Station Overview CentrePort/DFW Airport Station is located by Statler Boulevard at Breezewood Drive in Fort Worth. Free shuttles connect the station
Bikeway action plan. Bicycle Friendly Community Workshop March 5, 2007 Rochester, MN
 Bikeway action plan Summary The was held on March 5, 2007 at the Rochester Mayo Civic Center. The workshop was hosted by Rochester-Olmsted County Planning Department in collaboration with the League of
MASTER BICYCLE AND PEDESTRIAN PLAN
 VILLAGE OF NORTHBROOK MASTER BICYCLE AND PEDESTRIAN PLAN DRAFT PLAN OPEN HOUSE May 2, 2018 AGENDA 1. Community Engagement 2. Vision and Goals 3. General Structure of Plan 4. Recommendations Overview 5.
Why Zone In on Speed Reduction?
 Learn it. Do it. Live it! SPEED REDUCTION IN THE ZONE Why Zone In on Speed Reduction? Speeding is a serious issue that plays a major role in the risk of serious injury and pedestrian fatality in a crash.
FLETCHER AVENUE PEDESTRIAN AND BICYCLIST BEHAVIOR CHANGE FORMATIVE RESEARCH PROJECT
 FLETCHER AVENUE PEDESTRIAN AND BICYCLIST BEHAVIOR CHANGE FORMATIVE RESEARCH PROJECT EXTENT OF CHANGES IN PEDESTRIAN AND BICYCLIST ATTITUDES AND BEHAVIORS DIRECTLY AFTER A COMPLETE STREETS PROJECT IN FLORIDA
Evaluation of San Diego's First CicloSDias Open Streets Event
 Evaluation of San Diego's First CicloSDias Open Streets Event Funded by a grant from The California Endowment San Diego State University School of Public Affair University of California San Diego Department
Rail Station Fact Sheet University of Dallas Station
 Rail Station Fact Sheet University of Dallas Station Station Overview University of Dallas Station is located on John Carpenter Freeway and west of Loop 12 across from the University of Dallas in Irving.
NEWS-CFA: Confirmatory Factor Analysis Scoring for Neighborhood Environment Walkability Scale (Updated: March 15, 2011)
") NEWS-CFA: Confirmatory Factor Analysis Scoring for Neighborhood Environment Walkability Scale (Updated: March 15, 2011) The NEWS is a self-report perceived environment survey originally developed by Saelens
NEWS-CFA: Confirmatory Factor Analysis Scoring for Neighborhood Environment Walkability Scale (Updated: March 15, 2011) The NEWS is a self-report perceived environment survey originally developed by Saelens
Rail Station Fact Sheet DFW Airport North Station* (*station under construction with anticipated start of service in late 2018)
") Rail Station Fact Sheet DFW Airport North Station* (*station under construction with anticipated start of service in late 018) Station Overview DFW Airport North Station will be located on DFW nternational
Rail Station Fact Sheet DFW Airport North Station* (*station under construction with anticipated start of service in late 018) Station Overview DFW Airport North Station will be located on DFW nternational
TOWN OF WILLIAMSTON, SC BICYCLE AND PEDESTRIAN MASTER PLAN TOWN OF WILLIAMSTON, SC BICYCLE AND PEDESTRIAN MASTER PLAN
 TOWN OF WILLIAMSTON, SC BICYCLE AND PEDESTRIAN MASTER PLAN Americans Want Choices 55% of Americans would rather drive less & walk more. Transit use is growing faster than population or highway travel.
Update on Regional Bicycle, Pedestrian, & Trail Planning. Presented to TCC November 21, 2014
 Update on Regional Bicycle, Pedestrian, & Trail Planning Presented to TCC November 21, 2014 Survey Measure Assess Focus Area Performance- Driven Process Policy Policy Implement Plan Criteria Criteria Criteria
Investment in Active Transport Survey
 Investment in Active Transport Survey KEY FINDINGS 3 METHODOLOGY 7 CYCLING INFRASTRUCTURE 8 Riding a bike 9 Reasons for riding a bike 9 Mainly ride on 10 Comfortable riding on 10 Rating of cycling infrastructure
Bike/Multipurpose Trail Study for Glynn County, Georgia MAY 16, 2016
 Bike/Multipurpose Trail Study for Glynn County, Georgia MAY 16, 2016 Agenda» Project Status Update» Draft Recommendations Overview» Next Steps» Questions/Discussion Project Overview» Comprehensive Bikeway
City of Elizabeth City Neighborhood Traffic Calming Policy and Guidelines
 City of Elizabeth City Neighborhood Traffic Calming Policy and Guidelines I. Purpose: The City of Elizabeth City is committed to ensure the overall safety and livability of residential neighborhoods. One
Community & Transportation Preferences Survey
 Community & Transportation Preferences Survey Webinar: August 5, 2015 Hugh Morris, AICP, LEED Realtor.org Jennifer Dill, Ph.D. trec.pdx.edu 1 Introduction National Association of Realtors Over 1,000,000
Sandra Nutter, MPH James Sallis, PhD Gregory J Norman, PhD Sherry Ryan, PhD Kevin Patrick, MD, MS
 Objectively Measured Environmental Correlates of Adolescent Physical Activity Sandra Nutter, MPH James Sallis, PhD Gregory J Norman, PhD Sherry Ryan, PhD Kevin Patrick, MD, MS San Diego State University
COLUMBUS AVENUE NEIGHBORHOOD TRANSPORTATION STUDY
 COLUMBUS AVENUE NEIGHBORHOOD TRANSPORTATION STUDY Pedestrian Survey Findings Survey Main Findings: Transit and walking are the main two modes used by both visitors and residents of the area, regardless
CHAPTER 3: Vision Statement and Goals
 Davidson Walks & Rolls: Active Transportation Master Plan CHAPTER 3 Contents: Overview Vision Statement Measurable Goals Public Outreach CHAPTER 3: Vision Statement and Goals Overview The vision statement
Use this guide to learn more about walkability and how you can make your community safer to walk
 Walkability Guide Do You Enjoy Walking In Your Community? Use this guide to learn more about walkability and how you can make your community safer to walk 2 About This Guide Circulate San Diego believes
Data Analysis February to March Identified safety needs from reported collisions and existing travel patterns.
 Welcome! Thank you for participating in today s Valencia Bikeway Improvements workshop. Data Analysis February to March Identified safety needs from reported collisions and existing travel patterns. Initial
Non-Motorized Transportation 7-1
 Non-Motorized Transportation 7-1 Transportation facilities no longer mean just accommodating a vehicle powered by a combustion engine. Pedestrian and non-motorized facilities are important modes of travel
SAN FRANCISCO MUNICIPAL TRANSPORTATION AGENCY
 THIS PRINT COVERS CALENDAR ITEM NO. : 11 DIVISION: Sustainable Streets BRIEF DESCRIPTION: SAN FRANCISCO MUNICIPAL TRANSPORTATION AGENCY Approving traffic modifications on Twin Peaks Boulevard between Christmas
ABOUT THIS STUDY The Tenderloin-Little Saigon Community-Based Transportation Plan
 ABOUT THIS STUDY The Tenderloin-Little Saigon Community-Based Transportation Plan The Greater Tenderloin Community Study Milestones October Community based organizations (Tenderloin Housing Clinic and
Spatial Analysis of Bicycle and Pedestrian Collisions and Factors Corina Chung, MS Epidemiologist Jessica Garner Community Health Planner
 Spatial Analysis of Bicycle and Pedestrian Collisions and Factors Corina Chung, MS Epidemiologist Jessica Garner Community Health Planner Get Healthy San Mateo County (GHSMC): A Local Collaborative Building
Driverless Vehicles Potential Influence on Bicyclist Facility Preferences
 Driverless Vehicles Potential Influence on Bicyclist Facility Preferences MICHAEL BLAU, MCRP, LCI O T E C O C T O B E R 2 6, 2 0 1 6 S E S S I O N # 8 2 - E V A L U AT I N G T H E P E R F O R M A N C E
Vision Zero Task Force February 28, Collision Landscape Analysis
 Vision Zero Task Force February 28, 2017 Collision Landscape Analysis Welcome! What happened since our last Task Force meeting: City Council adopted the Vision Zero Resolution Applied for an OTS grant
San Mateo County Bicycle and Pedestrian Advisory Committee
 San Mateo County Bicycle and Pedestrian Advisory Committee January 19, 2017 Emma Shlaes, Policy Manager About SVBC Mission Our purpose is to create a healthy community, environment, and economy through
A copy of the draft plan is available at:
 To: From: Re: Mayor and City Council Patricia Nilsson, AICP, Comprehensive Planning Manager Boise Central Bench Neighborhood Pedestrian and Bicycle Plan Date: August 24, 2012 Requested Action Provide comments
Non-motorized Transportation Planning Resource Book Mayor s Task Force on Walking and Bicycling City of Lansing, Michigan Spring 2007 pg.
 Non-motorized Transportation Planning Resource Book pg. 105 of 158 Non-motorized Transportation Planning Resource Book pg. 106 of 158 Non-motorized Transportation Planning Resource Book pg. 107 of 158
Methods and Technologies for Pedestrian and Bicycle Volume Data Collection NCHRP 7-19
 Methods and Technologies for Pedestrian and Bicycle Volume Data Collection NCHRP 7-19 ITS Maryland 2013 Annual Meeting Kelly M. Laustsen October 8, 2013 1 MOVING FORWARD THINKING Presentation Overview
Highway School, Ithaca NY
 Highway School, Ithaca NY June 1, 2009 Michael Ronkin Designing Streets for Pedestrians and Bicyclists 1 We know how to build right 6 Yet many roads are built like this 7 What is a Complete Street?
Planning Guidance in the 2012 AASHTO Bike Guide
 Planning Guidance in the 2012 AASHTO Bike Guide Presentation by: RJ Eldridge Peter Lagerwey August 22, 2012 WEBINAR 2: PLANNING GUIDANCE IN THE 2012 AASHTO BIKE GUIDE Today s Webinar Significant Updates
City Snapshot September 27, 2018
 1 City Snapshot September 27, 2018 Respondent Introduction Thank you for providing data for the PlacesForBikes City Rating program! The information you provide will be used to understand the progress your
Safe Routes to School in New Jersey
 Safe Routes to School in New Jersey The need for Safe Routes to School 1. Fewer kids today walk and bike to school 2. Unintended consequences have resulted 3. SRTS programs can be part of the solution
Bicycle and Pedestrian Plans and Improvements
 Bicycle and Pedestrian Plans and Improvements Presented to the City Council By Randle Harwood, Planning and Development, and Richard Zavala, Parks and Community Services September 24, 2013 Purpose Review
Walkable Communities and Adolescent Weight
 Walkable Communities and Adolescent Weight Sandy Slater, PhD Assistant Professor, University of Illinois at Chicago, School of Public Health Research Scientist, UIC Institute for Health Research and Policy
Transportation 2040 Update: Eudora Public Input As of June 1, 2017
 Transportation 2040 Update: Eudora Public Input As of June 1, 2017 Overview... 1 Survey Responses... 2 Overview The Lawrence Douglas County Metropolitan Planning Organization (MPO) is updating our long
CALIFORNIA STATE UNIVERSITY, NORTHRIDGE
 CALIFORNIA STATE UNIVERSITY, NORTHRIDGE Connecting Reseda Boulevard & CSUN: One Great Street A graduate project submitted in partial fulfillment of the requirements For the degree of Master of Urban Planning
Plant City Walk-Bike Plan
 Plant City Walk-Bike Plan Plant City Commute Mode Share 2.2% 1.4% 2.9% Drove alone 10.2% Carpooled Public transportation (0.1%) Walked Used a Bike (0.4%) 82.9% Taxicab, motorcycle, or other means Worked
Environmental Assessment Findings & Recommendations. Public Hearing November 13, 2014
 Environmental Assessment Findings & Recommendations Public Hearing November 13, 2014 Welcome! Welcome and Introductions Project and Environmental Assessment Overview Public Comments Adjourn Purpose of
Pedestrian injuries in San Francisco: distribution, causes, and solutions
 Pedestrian injuries in San Francisco: distribution, causes, and solutions Presentation to the San Francisco Health Commission RAJIV BHATIA, MD, MPH DIRECTOR OF OCCUPATIONAL AND ENVIRONMENTAL HEALTH, SAN
ITE Northeastern District Meeting
 West Hartford Road Diet and Safety Study ITE Northeastern District Meeting Session 2A Complete Streets May 22, 2018 North Main St. - Classified as a principal arterial But provides high levels of access
Chapter 13 ORANGE COVE
 Chapter 13 ORANGE COVE This chapter describes the current status and future plans for biking and walking in the City of Orange Cove. RELATIONSHIP TO CITY PLANS AND POLICIES The Orange Cove General Plan
Thank you for this opportunity to discuss with you how we can work together to make our streets more complete.
 Thank you for this opportunity to discuss with you how we can work together to make our streets more complete. 1 2 3 Thank you for this opportunity to discuss with you how we can work together to make
U.S. Bicycling Participation Study
 U.S. Bicycling Participation Study Report of findings from the 2016 survey Conducted by Corona Insights Commissioned by PeopleForBikes Released July 2017 Table of Contents Background and Objectives 3 Research
Appendix E: Bike Crash Analysis ( )
") Appendix E: Bike Crash Analysis (2009-2012) Davis Bicycle Crashes Analysis 2009-2012 December 2013 Ride Walk Davis Active Transportation Program City of Davis December 2013 Prepared by: Jimmy Fong Active
Appendix E: Bike Crash Analysis (2009-2012) Davis Bicycle Crashes Analysis 2009-2012 December 2013 Ride Walk Davis Active Transportation Program City of Davis December 2013 Prepared by: Jimmy Fong Active
GIS Based Non-Motorized Transportation Planning APA Ohio Statewide Planning Conference. GIS Assisted Non-Motorized Transportation Planning
 The Purpose of GIS Assisted Network GIS Assisted Non-Motorized Transportation 2011 APA Ohio Statewide Conference Friday, 10:45 AM to Noon Focus on near-term projects wwwgreenwaycollabcom The purpose of
Designing for Pedestrian Safety
 Designing for Pedestrian Safety Road Diets Presented by: Peter Lagerwey Senior Planner, Toole Design Group November 3, 2010 Before After Learning Objectives At the end of this module, you will be able
DO OUR NEIGHBORHOODS REALLY MATTER FOR CHILDREN S HEALTH AND PHYSICAL ACTIVITY?
 DO OUR NEIGHBORHOODS REALLY MATTER FOR CHILDREN S HEALTH AND PHYSICAL ACTIVITY? Brian E. Saelens, Ph.D. Seattle Children s Research Institute, University of Washington Childhood Obesity and Public Health
RURAL HIGHWAY SHOULDERS THAT ACCOMMODATE BICYCLE AND PEDESTRIAN USE (TxDOT Project ) June 7, Presented by: Karen Dixon, Ph.D., P.E.
 June 7, Presented by: Karen Dixon, Ph.D., P.E.") RURAL HIGHWAY SHOULDERS THAT ACCOMMODATE BICYCLE AND PEDESTRIAN USE (TxDOT Project 0-6840) June 7, 2016 Presented by: Karen Dixon, Ph.D., P.E., TTI Team: Kay Fitzpatrick, Raul Avelar, & Subasish Das Project
RURAL HIGHWAY SHOULDERS THAT ACCOMMODATE BICYCLE AND PEDESTRIAN USE (TxDOT Project 0-6840) June 7, 2016 Presented by: Karen Dixon, Ph.D., P.E., TTI Team: Kay Fitzpatrick, Raul Avelar, & Subasish Das Project
Neighborhood Influences on Use of Urban Trails
 Neighborhood Influences on Use of Urban Trails Greg Lindsey, Yuling Han, Jeff Wilson Center for Urban Policy and the Environment Indiana University Purdue University Indianapolis Objectives Present new
ACTIVE TRANSPORTATION
 ACTIVE TRANSPORTATION Mobility 2040 Supported Goals Improve the availability of transportation options for people and goods. Support travel efficiency measures and system enhancements targeted at congestion
Market Factors and Demand Analysis. World Bank
 Market Factors and Demand Analysis Bank Workshop and Training on Urban Transport Planning and Reform. Baku, April 14-16, 2009 Market Factors The market for Public Transport is affected by a variety of
ORDINANCE NO
 1 Sponsored by: Councilmembers Stan Flemming, Connie Ladenburg, and Rick Talbert 2 Requested by: Executive/Public Works and Utilities - Transportation Services 3 4 5 6 7 10 11 ORDINANCE NO. 2014-445 12
Built Environment and Older Adults: Supporting Smooth Transitions Across the Life- Span. Dr. Lawrence Frank, Professor and Bombardier UBC
 Built Environment and Older Adults: Supporting Smooth Transitions Across the Life- Span Dr. Lawrence Frank, Professor and Bombardier Chair @ UBC The Hidden Health Costs of Transportation - Frank et al
Temporal and Spatial Variation in Non-motorized Traffic in Minneapolis: Some Preliminary Analyses
 Temporal and Spatial Variation in Non-motorized Traffic in Minneapolis: Some Preliminary Analyses Spencer Agnew, Jason Borah, Steve Hankey, Kristopher Hoff, Brad Utecht, Zhiyi Xu, Greg Lindsey Thanks to:
Identifying and Prioritizing Biking and Walking Needs
 Identifying and Prioritizing Biking and Walking Needs The 2012 Utah Bicycle and Pedestrian Barriers Survey TRB Planning Applications Conference May 6, 2013 RSG, Inc Chloe Ritter Elizabeth Greene James
Chapter 2. Bellingham Bicycle Master Plan Chapter 2: Policies and Actions
 Chapter 2 Bellingham Bicycle Master Plan Chapter 2: Policies and Actions Chapter 2: Policies and Actions The Bicycle Master Plan provides a road map for making bicycling in Bellingham a viable transportation
Upper Market Street Bike Lane Project
 Upper Market Street Bike Lane Project 17th Street to Octavia Boulevard 6 30 2010 SAN FRANCISCO, CALIFORNIA Agenda San Francisco & Sustainable Transportation Project Goals Outreach & Coordination Project
City of Charlottesville Bicycle and Pedestrian Master Plan Update
 City of Charlottesville Bicycle and Pedestrian Master Plan Update September 17, 2014 I. Welcome and meeting overview II. Project status update III. Network overview IV. Break-out groups Pedestrian Network
Rail Station Fact Sheet UNT Dallas Station
 Rail Station Fact Sheet UNT Dallas Station Station Overview UNT Dallas Station is located on the east side of University Hills Boulevard in Dallas. t is connected by a walking path to the University of
Instructions for Counting Pedestrians at Intersections. September 2014
 Instructions for Counting Pedestrians at Intersections September 2014 Purpose This document introduces the concept of the pedestrian count and provides instructions for performing a manual intersection
SAN FRANCISCO WOMEN AND BIKING A CASE STUDY ON THE USE OF SAN FRANCISCO BIKE LANES SYNTHESIS
 SAN FRANCISCO WOMEN AND BIKING A CASE STUDY ON THE USE OF SAN FRANCISCO BIKE LANES SYNTHESIS WOMEN AND BIKING: A CASE STUDY ON THE USE OF SAN FRANCISCO BIKE LANES 2 TAKEAWAY KEY Increasing biking is a
Safe Routes to School: A Step in the Right Direction
 Safe Routes to School: A Step in the Right Direction Eric Bjorlin Active Transportation Alliance 1 Safe Routes to School Programs Make walking and bicycling safer options for getting to and from school
As a part of the San Mateo Bicycle Master Plan update, Toole Design conducted a needs and demand analysis that included:
 To: Sue-Ellen Atkinson and Henry Choi, City of San Mateo From: Megan Wooley-Ousdahl, Laura Krull, and Jess Zdeb, Toole Design Date: March 1, 2019 Project: San Mateo Bicycle Master Plan Subject: Needs and
The Transit Last-Mile Problem
 The Transit Last-Mile Problem Thus far, we have treated the travel time thresholds as if they were the same in all environments. However, the experience of a short walk to or from a transit stop can be
2018 Transportation Alternatives Program (TAP) Application Presentation to Palm Beach TPA BRANT BRIDGE CONNECTION LOOP EXTENSION ON CARL BOLTER DR
 Application Presentation to Palm Beach TPA BRANT BRIDGE CONNECTION LOOP EXTENSION ON CARL BOLTER DR") 2018 Transportation Alternatives Program (TAP) Application Presentation to Palm Beach TPA BRANT BRIDGE CONNECTION LOOP EXTENSION ON CARL BOLTER DR Project Location N N Connecting South Delray Beach Existing
2018 Transportation Alternatives Program (TAP) Application Presentation to Palm Beach TPA BRANT BRIDGE CONNECTION LOOP EXTENSION ON CARL BOLTER DR Project Location N N Connecting South Delray Beach Existing
FACTS AND FIGURES: MAKING THE CASE FOR COMPLETE STREETS IN LEE COUNTY
 FACTS AND FIGURES: MAKING THE CASE FOR COMPLETE STREETS IN LEE COUNTY Safety: Close to 5,000 pedestrians and bicyclists die each year on U.S. roads, and more than 70,000 are injured. [Mean Streets, Surface
EXECUTIVE SUMMARY. Vision
 Vision Walking and bicycling in Salt Lake City will be safe, convenient, comfortable, and viable transportation options that connect people to places, foster recreational and economic development opportunities,
Complete Streets Policy and Practice
 Complete Streets Policy and Practice presented by Leslie Phemister, Nancy Wagner and Kasey Holloway Active Transportation Alliance 1 Learning Objectives Understand the connection between public health
Background and Goals of SRTS
 Safe Routes to School Background and Goals of SRTS Oklahoma Kick-off May 4, 2011 The Good, the Bad, and the Ugly Fewer kids are biking and walking More parents are driving 1969 2009 48% walked or biked
The Cycling Gender Gap: What Can We Learn From Girls?
 Portland State University PDXScholar TREC Friday Seminar Series Transportation Research and Education Center (TREC) 6-5-2016 The Cycling Gender Gap: What Can We Learn From Girls? Jennifer Dill Portland
Rail Station Fact Sheet Buckner Station
 Rail Station Fact Sheet Buckner Station Station Overview Buckner Station is located at the intersection of Buckner Boulevard and Elam Road in Dallas. The station opened in 2010 and currently serves as
Cities Connect. Cities Connect! How Urbanity Supports Social Inclusion
 Cities Connect! How Urbanity Supports Social Inclusion Todd Litman Victoria Transport Policy Institute Metropolis Toronto, Canada - 14 June 2006 Cities Connect People with people. People with jobs. People