National Safe Routes to School Program: Initial Results
|
|
|
- Dortha Warner
- 5 years ago
- Views:
Transcription


1 National Safe Routes to School Program: Initial Results Lauren Marchetti National Center for Safe Routes to School 9 th Annual New Partners for Smart Growth Thursday, February 4, 2010 Seattle, WA
2 August 2005, SAFETEA-LU was passed. This law designated $612 million in Federal transportation funds, distributed through each State s Department of Transportation to: enable and encourage children to walk and bicycle to school; improve the safety of children walking and bicycling to school; and facilitate projects and activities that will reduce traffic, fuel consumption, and air pollution near schools.

3 Elements of Safe Routes to School programs Education Encouragement Enforcement Engineering Evaluation

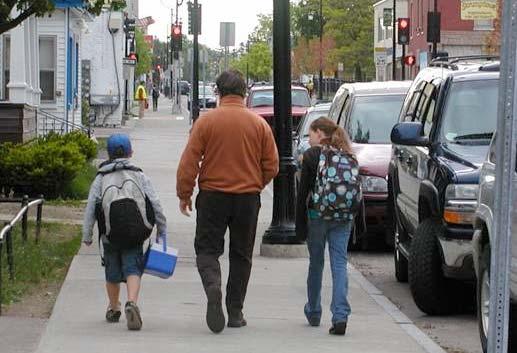
4 Safe Routes to School Programs are part of the solution to improve unsafe walking and biking conditions to increase physical activity to improve poor air quality by reducing vehicle emissions to create walking and bicycling options for an array of needs to reduce transportation costs for schools


5 The Good, the Bad, and the Ugly


6 Fewer kids are biking and walking More parents are driving % walked 16% walked 15% driven 50% driven (U.S. DOT, 2008)

7 Parents driving Parents driving their children to school account for 20%-25% of morning rush hour traffic. (Parisi Associates; Melbourne Department of Infrastructure)
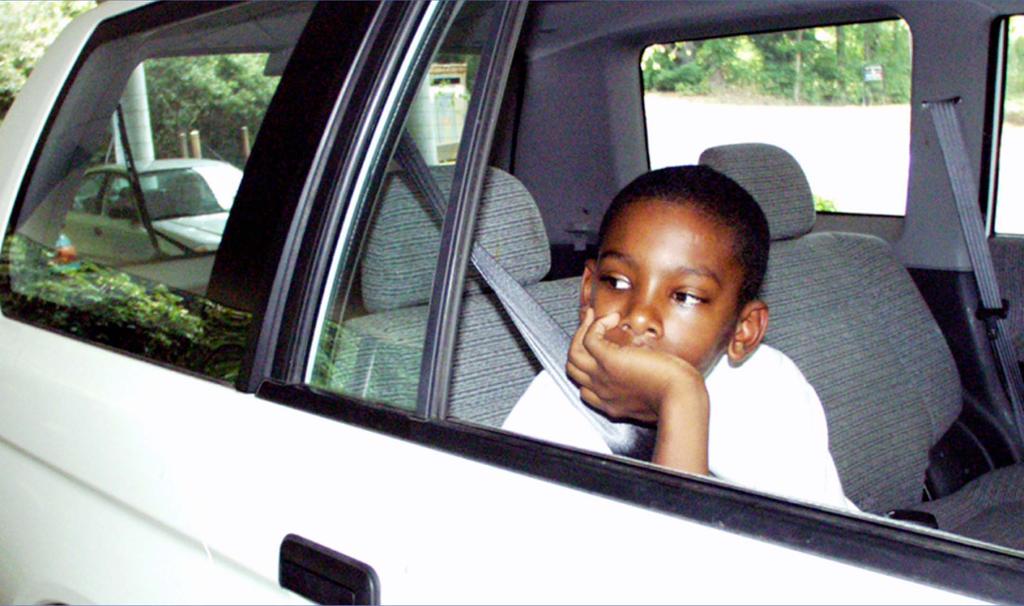
8 The consequences of this

9 instead of this can be alarming.

10 School siting issues: A generation ago Small (average of 127 students)* Located in community centers 42% of kids walked or biked to school** (*EPA, 2003; **1969 Nationwide Personal Transportation Survey)
")
11 School siting issues: Today Mega-schools (average 538 students) 44% of secondary schools have students Schools located on 10 to 30+ acres fringe land Lowest-cost construction (U.S. Department of Education, )
12 Current Status At least 6,489 schools are participating All states and DC have announced funding Approximately $427 million has been announced (72% of apportioned funds available) 54 percent of states had made awards for their third, fourth or fifth funding cycles 39 percent of applications are selected for funding $27.8 million was rescinded September 30, $26.1 million was apportioned through a 79-day Continuing Resolution that expired on December 18, 2009.
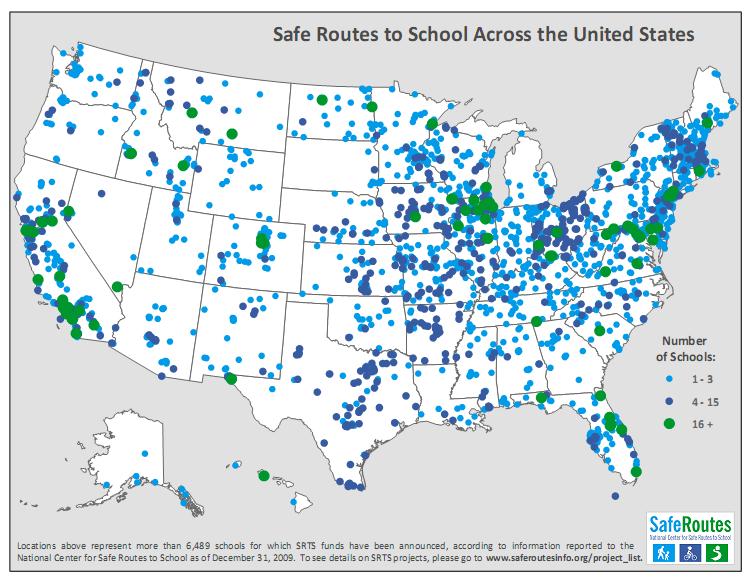
13
14 Start up takes time Cumulative Announced SRTS Funds vs. Obligated Funds $600,000,000 $500,000,000 $400,000,000 Available $300,000,000 Announced - To Date Obligated - To Date $200,000,000 $100,000,000 $ Year (through September 30)
15 Project Type Number % Infrastructure % Non-infrastructure % Combined % Planning/Start-up % Other % Total 5711
16 Key questions for Congress to ask: Is the program working? Was the money well spent? So Congress can decide: Should the program be continued? Are changes needed to improve it?
17 Evaluation and Research Program SRTS Data Reporting System Standardized Data Collection Forms Data Reporting Support Safe Routes to School Program Database A research project to examine safety outcomes at the national level. A research project to identify effectiveness of specific strategies. CDC and EPA expert panel on measuring health and environmental health

18 Data Collected March 2007 to May st submission of data 130,684 Parent Surveys 1,266 schools 47 states 34,546 classrooms 2.4M trips 1,308 schools 46 states

19 Parent Survey Sample Characteristics
20 Distance Child Lives from School 34% 17% 12% 15% 18% 4% < 1/4 mi 1/4-1/2 mi 1/2-1 mi 1-2 mi > 2 mi DK (n = 127,095)
21 School Arrival and Departure Modes 45% 42% 35% 37% Morning (n = 129,424) Afternoon (n = 127,424) 15% 11% 4% 5% 2% 2% 0% 1% 0% 1% Family Vehicle School Bus Walk Carpool Bike Other Transit
22 Walking/Biking by Grade 15% 16% 16% 20% 21% 24% 19% 18% 18% K (n =22,146)
23 Grade When Parent Would Allow Child to Walk/Bike to School Without an Adult 17% 19% 20% 13% 12% 10% 1% 3% 5% K (n = 61,254)
24 Reasons Parents Allow Child to Walk/Bike 52% 42% 41% 38% Distance Crosswalks Weather Sidewalks (n = 23,491)

25 Impact of Distance on Walking and Biking
26 Child s Interest in Walking/Biking by Distance to School 65% 60% 50% 34% 14% < 1/4 mi 1/4-1/2 mi 1/2-1 mi 1-2 mi > 2 mi
27 Morning Travel Mode by Distance 70% Walk Bike School Bus Family Vehicle 60% 50% 40% 30% 20% 10% 0% < 1/4 mi 1/4-1/2 mi 1/2-1 mi 1-2 mi > 2 mi

28 Student Travel Tally
29 School Arrival and Departure Modes 44% 37% 35% 39% Morning (n = 1,225,590) Afternoon (n = 1,149,711) 13% 16% 4% 5% 2% 2% 1% 1% 0% 1% Family Vehicle School Bus Walk Carpool Bike Other Transit
30 Data Collection Method Comparison Student Report Parent Report 44% 37% 39% 35% 45% 35% 37% 42% 16% 13% 15% 11% 4% 5% 2% 2% 4% 5% 2% 2% Family Vehicle School Bus Walk Carpool Bike Family Vehicle School Bus Walk Carpool Bike


31 Take away messages Distance is influential More car trips in AM than PM presents opportunity Parent Survey and Travel Tallies are complementary Future analysis to examine trends and comparisons
32
33

34 Community success stories


35 Every community faces a different challenge

36 Case study: Bear Creek Elementary, Boulder, CO A car-free commute changes habits of entire families
37 Bear Creek Elementary s Car-Free Commute Program Student Population: Original Percentage of walkers/bikers: 365 students 41 percent 70 percent and growing! Current Percentage: Federal funds awarded: $ 36,101 Awarded 2008; Shared among 3 schools $ 73,000 Awarded 2007; Shared among 6 schools (Education & Encouragement) $154,000 Awarded 2009 to City of Boulder to retrofit an intersection Results: school year: 30 percent reduction in cars and corresponding traffic congestion during the school year September 2008: students accrued 4,800 miles from 6,600 Car-Free Commute trips in one month

38 Green Street Elementary School, Brattleboro, VT Many reasons to walk safely snow or shine
39 Green Street Elementary Student Population: 265 students Free/Reduced Lunch students: 48 percent Located in downtown Brattleboro, VT Federal funds awarded: $18,000 Awarded 2006 for education and encouragement $ 6,975 Awarded 2008 for education and encouragement Results: Forty percent reduction in the number of speeding cars in the school zone Education efforts improved walking conditions for adults as well as children Walking school buses have tripled
40 Fatalities based on speed of vehicle A pedestrian s chance of death if hit by a motor vehicle 100% 90% 80% 70% 60% 50% 40% 30% 20% 10% 0% No Injury Injury Death 20 mph 30 mph 40 mph UK Department of Transportation
41 Auburn School District, Auburn, WA Saving in transportation costs
42 Auburn School District, Washington Number of Schools: 22 Student Population: 14,500 Funds awarded: $306,000 total funds awarded 2006 for sidewalks, bike lanes, and other improvements (Federal: $185,000. State: $121,000) Results: $220,000 in annual savings in student transportation costs At one school, walking and bicycling reduced the number of buses needed from six to one. Pioneer Elementary School, where 85 percent of students now walk or bicycle to school, reports higher test scores.

43 Smyrna School District, Smyrna, Del. Safety is for everyone
44 School District of Smyrna, Delaware Number of Schools: Free/Reduced Lunch students: 3 schools percent Federal funds awarded: $523,000 Awarded 2007 to 2008 to be shared among three schools Projects included sidewalks, crosswalks and curb construction, and education programs Results: Collaboration between the school district, Town of Smyrna, and Delaware DOT enabled improvements adjacent to one school to be completed in six weeks. Most of the work was completed before school began in August 2008

45 Ben W. Murch Elementary School, Washington D.C. Building consensus and sidewalks
46 Ben W. Murch Elementary School, Washington D.C. Student Population: 500 students Located in downtown Washington D.C. between two major commuter streets Federal funds awarded: $150,000 Awarded 2008 for infrastructure Results: Reversed school policy that prohibited students from bicycling to school without special permission Built community support for walking and bicycling to school, including neighborhood support for new sidewalk construction Implemented an effective student Safety Patrol program to enforce safe driving behavior around the school

47 Alpine Elementary School, Alpine, Utah Learning to Bee Safe, Bee Fit and Bee Kind
48 Alpine Elementary School, Alpine, Utah Student Population: 780 students Part of the lowest funded school district in the nation Attempted abduction of a 6th-grade student in 2008 Federal funds awarded: $12,000 Awarded 2008 for education and encouragement $50,000 Awarded 2009 for infrastructure, including solar traffic signs and a bike parking pad $9,500 Awarded 2009 for education and encouragement Results: Started a Meals for Miles encouragement program: Reduced traffic congestion by 59 motor vehicles (on average) Increased number of students walking/bicycling to school by 118 students (on average) Students, faculty and staff walked 26,748 miles in 1 year

49 Mansfield City Schools, Mansfield, Ohio Communities Walking and Rolling Together
50 Mansfield City Schools, Mansfield, Ohio Number of Schools: 6 schools Number of Students: 2,009 students Federal funds awarded: $25,000 Awarded 2008 for non-infrastructure, specifically education, encouragement and evaluation, to be shared among the 6 schools Results: 20% participation in Walk or Roll to School contest among the six schools Comprehensive media campaign targeting adults/motorists with safety messages Partnered with Mid Ohio Heart Clinic to reach over 1,185 students with benefits of exercise messages Education for neighborhoods and community members

51 Thank you. Thoughts or questions? saferoutesinfo.org
Background and Goals of SRTS
 Safe Routes to School Background and Goals of SRTS Oklahoma Kick-off May 4, 2011 The Good, the Bad, and the Ugly Fewer kids are biking and walking More parents are driving 1969 2009 48% walked or biked
This is a story of the Ugly, the Bad, and the Good. Fewer kids are biking and walking. More parents are driving.
 Why Safe Routes to School Matters: Safety, Health & Transportation This is a story of the Ugly, the Bad, and the Good. Fewer kids are biking and walking. More parents are driving. 2001: 16% walked Parents
Introduction.
 2307-1.0. Introduction. Delaware s Safe Routes to School (SRTS) Program was established September 10, 2002 when Governor Ruth Ann Minner signed Senate Bill 353 of the 141st General Assembly of Delaware
Safe Routes to School: A Step in the Right Direction
 Safe Routes to School: A Step in the Right Direction Eric Bjorlin Active Transportation Alliance 1 Safe Routes to School Programs Make walking and bicycling safer options for getting to and from school
Safe Routes to School as a Transportation Control Measure: Impacts on the Emission Inventory
 Safe Routes to School as a Transportation Control Measure: Impacts on the Emission Inventory Ignatius Fomunung, Joseph Owino, Mbaki Onyango University of Tennessee Chattanooga August 5, 2015 Outline Introduction
Lawrence Safe Routes to School. Community Meeting January 14, 2015
 Lawrence Safe Routes to School Community Meeting January 14, 2015 Safe Routes to School The 6 E s Education Encouragement Enforcement Engineering Evaluation Equity What are the elements of a SRTS plan?
Parent Survey Report: One School in One Data Collection Period
 Parent Survey Report: One School in One Data Collection Period School Name: Bilquist Elementary School Set ID: 15803 School Group: Clackamas County Month and Year Collected: December 2016 School Enrollment:
2016 APS Go! Surveys Summary Results for Oakridge Elementary School
 2016 APS Go! Surveys Summary Results for Oakridge Elementary School This report summarizes results from the 2016 APS Go! surveys for Oakridge Elementary School. Student, parent/caregiver and staff surveys
Parent Survey Report: One School in One Data Collection Period
 Parent Survey Report: One School in One Data Collection Period School Name: Pinckney Elementary School Set ID: 12170 School Group: Douglas County Month and Year Collected: October 2014 School Enrollment:
WALKSacrame nto. Welcomes you to the 2009 Sacramento County Safe Routes to School Conference
 Sacramento County Department of Transportation Ron Vicari, Principal Civil Engineer In Partnership with: WALKSacrame nto Anne Geraghty, Terry Preston & Staff Welcomes you to the 2009 Sacramento County
Getting Your SRTS Project Funded. Ryan Snyder
 Getting Your SRTS Project Funded Ryan Snyder Steps in Submitting a Successful Application 1. Stakeholder outreach: create a SRTS coalition 2. Develop a comprehensive plan and program with all 5 Es 3. Conceive
Walkable Communities: National Best Practices and Applications in Memphis, TN
 Walkable Communities: National Best Practices and Applications in Memphis, TN Dr. Stephanie Ivey Assistant Professor Herff College of Engineering Department of Civil Engineering Agenda Walkable communities
Get Oregon kids. Walking, biking and rolling to school planning guide
 Get Oregon kids Walking, biking and rolling to school planning guide The Oregon Health Authority produced this guide with assistance from the Oregon Department of Education, Oregon Department of Transportation
S A F E R O U T E S T O S C H O O L H E R M A N TOW N S C H O O L S A N D P R O C TO R S C H O O L S P L A N A P P R OVA L S
 S A F E R O U T E S T O S C H O O L H E R M A N TOW N S C H O O L S A N D P R O C TO R S C H O O L S P L A N A P P R OVA L S WHAT IS SAFE ROUTES TO SCHOOL? In 1969, nearly 50% of children walked or rode
AGENDA. 5. Next Steps a. Survey Distribution b. Draft Action Plan/Recommendations c. Review at next meeting in advance of document preparation
 Congdon Elementary Safe Routes to School Plan Update SRTS Team Meeting #2-Walk Audit March 21, 2018, 3:00 p.m. Congdon Elementary School Art Room-Duluth, MN 1. Welcome and Introductions 2. SRTS Review
Chapter 2. Bellingham Bicycle Master Plan Chapter 2: Policies and Actions
 Chapter 2 Bellingham Bicycle Master Plan Chapter 2: Policies and Actions Chapter 2: Policies and Actions The Bicycle Master Plan provides a road map for making bicycling in Bellingham a viable transportation
2016 APS Go! Surveys Summary Results for Arlington Traditional School
 2016 APS Go! Surveys Summary Results for Arlington Traditional School This report summarizes results from the 2016 APS Go! surveys for Arlington Traditional School. Student, parent/caregiver and staff
Rim Rock Elementary School Walking and Biking Audit
 Rim Rock Elementary School Walking and Biking Audit September 29, 2016 Rim Rock Elementary School Audit for Walking and Biking September 29, 2016 Audit Team Members: Sam Atkins, City Engineer, City of
SRTS Programs That Increase Walking and Bicycling to School
 Getting Results: SRTS Programs That Increase Walking and Bicycling to School SafeRoutes National Center for Safe Routes to School Communities initiate Safe Routes to School (SRTS) programs for a variety
Safe Routes to School in New Jersey
 Safe Routes to School in New Jersey The need for Safe Routes to School 1. Fewer kids today walk and bike to school 2. Unintended consequences have resulted 3. SRTS programs can be part of the solution
Wellington Exempted Village School District SAFE ROUTES TO SCHOOL TRAVEL PLAN January 2014
 Wellington Exempted Village School District SAFE ROUTES TO SCHOOL TRAVEL PLAN January 2014 OHIO SAFE ROUTES TO SCHOOL WELLINGTON EXEMPTED VILLAGE SCHOOL DISTRICT TRAVEL PLAN SECTION 1: WELLINGTON EXEMPTED
Barnum- Safe Routes to School Meeting #2 January 20, 2015
 Barnum- Safe Routes to School Meeting #2 January 20, 2015 1. Introductions 2. SRTS Program Overview 1. Purpose 2. Benefits 3. Background of planning Process 3. Existing Conditions Review and Summary 1.
Vallecito Elementary School. Travel Plan
 Vallecito Elementary School Travel Plan TABLE OF CONTENTS 1. PURPOSE... 1 1.1. SR2S PLANNING, IMPLEMENTATION AND MONITORING... 1 1.2. MARIN COUNTY MEASURE A... 1 2. VALLECITO ELEMENTARY SCHOOL PROFILE...
C/CAG. Sunnybrae Elementary School Walking and Bicycling Audit. San Mateo-Foster City School District JUNE 2013
 Sunnybrae Elementary School Walking and Bicycling Audit JUNE 2013 San Mateo-Foster City School District C/CAG City/County Association of Governments of San Mateo County SUNNYBRAE ELEMENTARY SCHOOL WALKING
Summary Report School Walking & Bicycling Audits. Mesa County Regional Transportation Planning Office
 Summary Report School Walking & Bicycling Audits Mesa County Regional Transportation Planning Office This page left blank intentionally WALKING & BICYCLING AUDIT SUMMARY 2 Executive Summary Background:
Society for Behavioral Medicine, New Orleans, LA. April 12, 2012
 The Impact of the Built Environment and Safe Routes to School-Related Policies on Youth Active Travel in a National Sample of Public Elementary Schools Society for Behavioral Medicine, New Orleans, LA
SAFE ROUTES TO SCHOOL (SR2S)
") SAFE ROUTES TO SCHOOL (SR2S) In partnership with Burbank Unified School District (BUSD) & City of Burbank George Washington Elementary School Thomas Jefferson Elementary School John Muir Middle School
SAFE ROUTES TO SCHOOL (SR2S) In partnership with Burbank Unified School District (BUSD) & City of Burbank George Washington Elementary School Thomas Jefferson Elementary School John Muir Middle School
The DC Pedestrian Master Plan
 The DC Pedestrian Master Plan September 28, 2010 George Branyan Pedestrian Program Coordinator District Department of Transportation Presentation Agenda Scope of the Plan Methodology Recommendations Implementation
Item 7 Enclosure Citizens Advisory Committee March 27, 2013 San Francisco Safe Routes to School Program
 Item 7 Enclosure Citizens Advisory Committee March 27, 2013 1 San Francisco Safe Routes to School Program Ana Validzic, MPH SF Department of Public Health 2 Safe Routes to School Program Need Fewer kids
COMMUNITY SCHOOLS AND TRANSPORTATION
 COMMUNITY SCHOOLS AND TRANSPORTATION Regional Transportation Council Workshop October 8, 2015 Agenda» Existing Conditions and Previous Initiatives (RTC School Policy)» TIGER Grant and the Community Schools
3 Silverton High School Report
 3 Silverton High School Report Principal: Justin Lieuallen Grades: 9-12 Enrollment: 1,277 Address: 1456 Pine Street First bell: 7:55 a.m. Silverton, OR 97381 Last bell: 3:05 p.m. Free & Reduced Lunch:
SUSTAINABILITY, TRANSPORT, & HEALTH. Ralph Buehler, Virginia Tech
 SUSTAINABILITY, TRANSPORT, & HEALTH Ralph Buehler, Virginia Tech Prepared for National Academies Roundtable on Science and Technology for Sustainability 6 December 2013 Overview Trends in Motorization
Why Zone In on Speed Reduction?
 Learn it. Do it. Live it! SPEED REDUCTION IN THE ZONE Why Zone In on Speed Reduction? Speeding is a serious issue that plays a major role in the risk of serious injury and pedestrian fatality in a crash.
A Safe Routes to School Survey in Hillsborough County
 A Safe Routes to School Survey in Hillsborough County Prepared for Florida Department of Transportation, District 7 Project Manager: Peter Hsu, P.E. Prepared by Huaguo Zhou, Ph.D., P.E. Senior Research
How Policy Drives Mode Choice in Children s Transportation to School
 How Policy Drives Mode Choice in Children s Transportation to School Physical Activity through Active Transportation Ruth L. Steiner 2011 Technical Conference and Exhibit Lake Buena Vista, FL April 3-6,
The Walking School Bus Program: A Primer and First Steps
 The Walking School Bus Program: A Primer and First Steps Module 1 (13 minutes): Background Why We Need Walking School Buses, Anyway After completing this module, participants will be able to: Cite data
Safe Routes to School Comprehensive Plan
 Safe Routes to School Comprehensive Plan City of Apple Valley Dakota County, MN May 2010 Prepared by: Project Background The Statewide Health Improvement Program (SHIP) aims to help Minnesotans live longer,
Safe Routes to School Comprehensive Plan
 Safe Routes to School Comprehensive Plan City of Rosemount Dakota County, MN June 2010 Prepared by: Project Background The Statewide Health Improvement Program (SHIP) aims to help Minnesotans live longer,
Trip Generation for an averaged sized elementary school in Provo, Utah
 Trip Generation for an averaged sized elementary school in Provo, Utah Brigham Young University s ITE student chapter conducted a Trip Generation Study to determine the number of trips generated by an
Parent Survey Report: One School in One Data Collection Period
 Parent Survey Report: One School in One Data Collection Period School Name: Broken Arrow Elementary School Set ID: 12172 School Group: Douglas County Month and Year Collected: October 2014 School Enrollment:
Implementing the Three Es of School Zone Traffic Calming
 Implementing the Three Es of School Zone Traffic Calming Use this evaluation tool as a guide to analyze the specific safety needs of your school. SCHOOL PROFILE School Name: School District: Address: Phone
Aitkin School Routing Plan July 2010
 Aitkin School Routing Plan July 2010 Prepared by: Arrowhead Regional Development Commission Regional Planning Division Aitkin School Routing Plan July 2010 Aitkin School Routing Plan July 2010 Prepared
Safe Routes to School Blue Zones Project, City of
 Safe Routes to School Blue Zones Project, City of Fort Worth and FWISD Partnership Introduction to Blue Zones Project Blue ZonesProject is a well-being improvement initiative designed to make healthy choices
Creating Safe Routes to School Programs for Tribal Communities
 Creating Safe Routes to School Programs for Tribal Communities Kristin Haukom, M.P.H. August 24, 2016 1 Background on the Guide Created by the Safe Routes to School Technical Assistance Resource Center
Designing for Pedestrian Safety in Washington, DC
 Designing for Pedestrian Safety in Washington, DC February 25, 2014 George Branyan Pedestrian Program Coordinator District Department of Transportation DC Journey to work mode split: 2012 Means of Transportation
Hermantown Safe Routes to School Kickoff Meeting November 10, 2015
 Hermantown Safe Routes to School Kickoff Meeting November 10, 2015 1. Introductions 2. SRTS Program Overview 1. Purpose 2. Benefits 3. SRTS planning process timeline 4. SRTS Team roles 3. Background on
What is non-infrastructure?
 Non-Infrastructure What is non-infrastructure? Education Encouragement Enforcement Evaluation Education Who needs educational messages? 1. Children 2. Parents 3. Neighbors 1. Educating children Pedestrian
Safe Routes to School Travel Plan 2011 Reading-Fleming Intermediate School (RFIS)
") Safe Routes to School Travel Plan 0 Reading-Fleming Intermediate School (RFIS) Reading Fleming Intermediate School 50 Court Street Flemington, NJ 088 Grades: 5-6 Introduction Reading-Fleming Intermediate
Safe Routes to School Travel Plan 0 Reading-Fleming Intermediate School (RFIS) Reading Fleming Intermediate School 50 Court Street Flemington, NJ 088 Grades: 5-6 Introduction Reading-Fleming Intermediate
Safe Routes to School PLAN
 CONGDON ELEMENTARY Safe Routes to School PLAN SRTS Team Kick-off Meeting February 8, 2018 AGENDA Welcome and Introductions Safe Routes to School Program Overview History of SRTS work at Congdon Elementary
2 Mark Twain Elementary School Report
 2 Mark Twain Elementary School Report Principal: Greg Kaatz Grades: K-2 Enrollment: 323 Address: 425 N. Church Street First bell: 8:10 a.m. Silverton, OR 97381 Last bell: 2:30 p.m. Free & Reduced Lunch:
Safe Routes to School Guide
 Safe Routes to School Guide Steps to Creating a Safe Routes to School Program Created February 2007 SafeRoutes National Center for Safe Routes to School This guide was developed by the Pedestrian and Bicycle
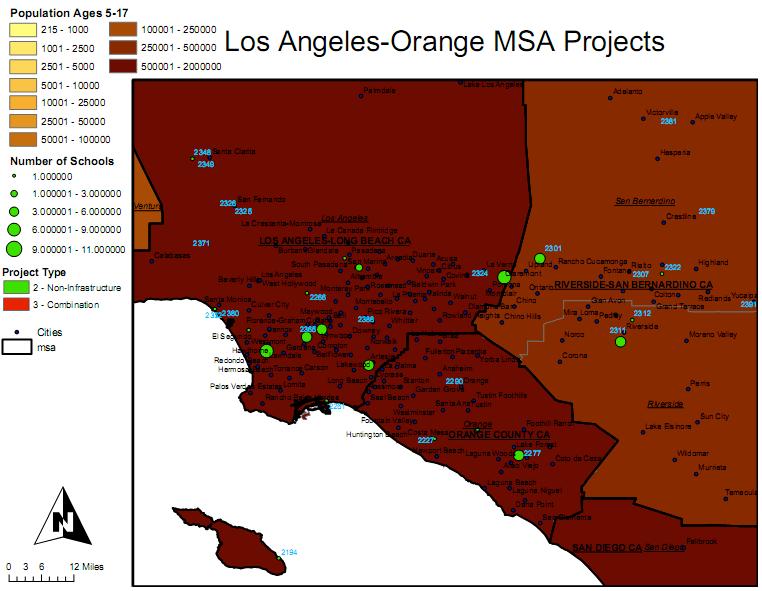
The Miami-Dade Safe Routes to School Initiative
 The Miami-Dade Safe Routes to School Initiative Perla Tabares Hantman School Board Chair Miami-Dade County Public Schools & Governing Board Member of the Miami-Dade Metropolitan Planning Organization August
Complete Streets 101: The Basics
 Complete Streets 101: The Basics Michigan Municipal League - Capital Conference March 21, 2017 Chip Smith, AICP - Senior Planner - Wade Trim Inc. and City Council member City of Ann Arbor 2017 MML Capital
Bringing together community and health. Physical Activity and Nutrition Unit Office of Statewide Health Improvement Initiatives
 Bringing together community and health. Physical Activity and Nutrition Unit Office of Statewide Health Improvement Initiatives Physical Activity and Nutrition Unit Office of Statewide Health Improvement
PROSPECT ELEMENTARY GIRARD INTERMEDIATE GIRARD JUNIOR HIGH
 PROSPECT ELEMENTARY GIRARD INTERMEDIATE GIRARD JUNIOR HIGH SAFE ROUTES TO SCHOOL SCHOOL TRAVEL PLAN January 8, 2014 2 SECTION 1: OUR SCHOOLS School District School Name School Address Grades served Girard
AMHERST EXEMPTED VILLAGE SCHOOLS AND SAINT JOSEPH SCHOOL
 AMHERST EXEMPTED VILLAGE SCHOOLS AND SAINT JOSEPH SCHOOL SAFE ROUTES TO SCHOOL TRAVEL PLAN 12/11/18 DRAFT OHIO SAFE ROUTES TO SCHOOL SCHOOL TRAVEL PLAN Ohio s Safe Routes to School Travel Plan Template
San Ramon Elementary School. Travel Plan
 San Ramon Elementary School Travel Plan TABLE OF CONTENTS 1. PURPOSE... 1 1.1. SR2S PLANNING, IMPLEMENTATION AND MONITORING... 1 1.2. MARIN COUNTY MEASURE A... 1 2. SAN RAMON ELEMENTARY SCHOOL PROFILE...
FREMONT CITY SCHOOLS STP
 FREMONT CITY SCHOOLS STP SAFE ROUTES TO SCHOOL TRAVEL PLAN February 2014 OHIO SAFE ROUTES TO SCHOOL SCHOOL TRAVEL PLAN SECTION 1: OUR SCHOOL(S) 1A. Identify Target Schools School District School Name School
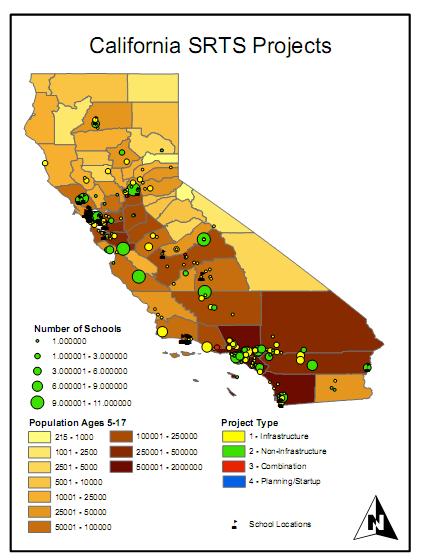
Safe Routes to School Program in California: An Update
 Safe Routes to School Program in California: An Update Claudia Chaufan, MD, PhD Jarmin Yeh, MSSW, MPH Leslie Ross, PhD Pat Fox, PhD, MSW Institute for Health & Aging, Department of Social and Behavioral
School Travel Survey for Principals. 1. How do most of your students get to school in the morning? (Please select only one box)
") School Travel Survey for Principals 1. How do most of your students get to school in the morning? (Please select only one box) by school bus by public transportation (e.g., city bus) by other motor vehicle
School Travel Survey for Principals 1. How do most of your students get to school in the morning? (Please select only one box) by school bus by public transportation (e.g., city bus) by other motor vehicle
MEET IN THE STREET MOVING TO ZERO
 WE MEET IN THE STREET MOVING TO ZERO Tips for sharing the street Traffic deaths are preventable. We need your help getting the message out. 2 A NEW PLAN A NEW PLAN Philadelphia is proud to adopt Vision
Automobile Alternatives. S. Handy TTP282 Transportation Orientation Seminar 10/28/11
 Automobile Alternatives S. Handy TTP282 Transportation Orientation Seminar 10/28/11 Why worry about them? Air quality Climate change Congestion Sprawl Equity Health U.S. Mode Split in 2001 Share of Person
Bicycle and Pedestrian Connectivity Study Phase 2
 Connectivity Study Phase 2 Process PROCESS OUTCOMES Phase Prepared By STEP I Public Participation and Outreach 1. RTP Outreach activities, and development of the Bike and Ped Task Force Phase 1 2011 OCPC
FACTS AND FIGURES: MAKING THE CASE FOR COMPLETE STREETS IN LEE COUNTY
 FACTS AND FIGURES: MAKING THE CASE FOR COMPLETE STREETS IN LEE COUNTY Safety: Close to 5,000 pedestrians and bicyclists die each year on U.S. roads, and more than 70,000 are injured. [Mean Streets, Surface
Speed Limits Study and Proposal. Public Input Session: 8/14/13
 Speed Limits Study and Proposal Public Input Session: 8/14/13 Why is Decatur a unique place for this project? First Community Transportation Plan in the nation with a Health Impact Assessment. Strong sense
CITY OF OAK CREEK SAFE ROUTES TO SCHOOL ACTION PLAN. East Middle School
 CITY OF OAK CREEK SAFE ROUTES TO SCHOOL ACTION PLAN East Middle School CITY OF OAK CREEK SAFE ROUTES TO SCHOOL ACTION PLAN East Middle School Why Safe Routes to School? Safe Routes to School ( SRTS ) is
School Travel Survey for District Superintendents/Board Chairs
 School Travel Survey for District Superintendents/Board Chairs 1. How do most of the elementary and middle school students in your district get to school in the morning? (Please select only one box) by
Sebastopol Charter School Traffic Management Plan
 Sebastopol Charter School The serves as the working document in support of these essential goals: to ensure the safety and efficiency of student arrival to and departure from school to ensure the safety
Carpooling Without the Car: Walking School Bus and Bicycle Train Program
 Carpooling Without the Car: Walking School Bus and Bicycle Train Program Jason Jackman Safe Routes to School Regional Coordinator Center for Urban Transportation Research University of South Florida In
Arlington Public Schools New Elementary School at Thomas Jefferson Site Off-Site Transportation. Thomas Jefferson BLPC / PFRC Meeting July 27, 2016
 Arlington Public Schools New Elementary School at Thomas Jefferson Site Off-Site Transportation Thomas Jefferson BLPC / PFRC Meeting July 27, 2016 1.Review of Analysis 2.Key Transportation Issues 3.Recommendations
Outline. Safe Routes to School and Community Planning. School Basics. School Basics 1/12/2014
 Safe Routes to School and Community Planning Charlotte Claybrooke Safe Routes to School Coordinator Washington State Department of Transportation Seth Schromen-Wawrin Safe Routes to School Program Manager
Lisa Quinn Executive Director
 Transforming Injury and Violence Prevention: Innovations in Policy, Practice, and Partnerships Advocating for Prevention: Enacting and Reacting to Legislation Lisa Quinn Executive Director Feet First works
How-to-Develop a Pedestrian Safety Action Plan. Education Strategies
 How-to-Develop a Pedestrian Safety Action Plan Education Strategies Learning Objectives Gain understanding of pedestrian education needs (what) and strategies (who, when, and how) Learn ways to integrate
Complete Streets: Building Momentum in Connecticut
 Complete Streets: Building Momentum in Connecticut Tri-State Transportation Campaign, 2012 What are Complete Streets? Complete Streets are safe, comfortable, and convenient for travel for everyone, regardless
July 5, Arthur R. Ware, Jr. Elementary School 2017 Safe Routes to School Walkabout Report
 July 5, 2017 Arthur R. Ware, Jr. Elementary School 2017 Safe Routes to School Walkabout Report 1 Walkabout Report Introduction On April 28, 2017, City, School, and SAWMPO staff met to conduct a Safe Routes
Developing an Effective Safe Routes to School Funding Program for Hawai i
 Developing an Effective Safe Routes to School Funding Program for Hawai i The Safe Routes to School Program 1 is a Federal Aid program of the U.S. Department of Transportation's Federal Highway Administration
Active Transportation in Billings Area Schools: A
 Active Transportation in Billings Area Schools: A report on the current practices and policies Prepared by: AmeriCorps VISTA Isaac Mevis and Emily Martin - Billings Metro VISTA Project Prepared for: Billings
About the Active Transportation Alliance
 About the Active Transportation Alliance Chicagoland s voice for better biking, walking and transit Founded 1985 7,000 members, ~33 full time staff Serve Chicago metro region 1 More Cars, More Driving
SAFE ROUTES TO SCHOOL
 SAFE ROUTES TO SCHOOL Forest Ridge Elementary School Existing Conditions and ACTION PLAN > Oak Creek - Franklin Joint School District Table of Contents CONTEXT Enrollment Boundaries
Corpus Christi Metropolitan Transportation Plan Fiscal Year Introduction:
 Introduction: The Safe, Accountable, Flexible, Efficient Transportation Equity Act: A Legacy for Users (SAFETEA-LU) has continued the efforts started through the Intermodal Surface Transportation Efficiency
UNDERSTANDING THE TRIP REDUCTION PROGRAM SURVEY ANALYSIS. March 2014 Transportation Coordinator Webinar
 UNDERSTANDING THE TRIP REDUCTION PROGRAM SURVEY ANALYSIS March 2014 Transportation Coordinator Webinar Tech Tips To hear us, turn up speakers or headset volume. Your microphone is muted. Use the controls
2016 APS Go! Surveys Summary Results for Trades Center
 2016 APS Go! Surveys Summary Results for Trades Center This report summarizes results from the 2016 APS Go! surveys for Trades Center. Staff surveys were conducted at all schools and work sites as part
Arlington Public Schools Thomas Jefferson Site Evaluation Transportation Networks. Thomas Jefferson Working Group Meeting #6 November 10, 2014
 Arlington Public Schools Thomas Jefferson Site Evaluation Transportation Networks Thomas Jefferson Working Group Meeting #6 November 10, 2014 2 3 INTRODUCTION 4 Goal of our work: Identify and assess multi-modal
What s Health Got to Do With It? Health and Land Use Planning
 What s Health Got to Do With It? Health and Land Use Planning CANDACE RUTT, PH.D. EXECUTIVE DIRECTOR APRIL 13 TH, 2016 Planning and Public Health Planning + Public Health Healthy Communities Healthier
Safe and Active Routes to School in Cabarrus County
 Safe and Active Routes to School in Cabarrus County In 2014, Cabarrus Health Alliance became the host agency for the Charlotte region s coordinator in the NC Active Routes to School program. The NC-ARTS
Bremen Elementary. SAFE ROUTES TO SCHOOL TRAVEL PLAN October 9, 2012
 Bremen Elementary SAFE ROUTES TO SCHOOL TRAVEL PLAN October 9, 2012 Introduction The purpose of the Bremen Elementary Safe Route to School (SRTS) Plan is to encourage school age children to travel to school
Transportation-Demand Management Community Presentation
 Transportation-Demand Management Community Presentation American University Office of Risk, Safety and Transportation programs Thursday, June 7, 2018 Program Objectives Improve transportation options for
Safe Routes to School: Creating an Action Plan Template
 odot25m Page 1 4/13/2016-1 - Safe Routes to School: Creating an Action Plan Template Note: This document can be protected to prevent unintended changes to the form. If you wish to protect the template,
April 30 th, Reducing the Risks to Child Pedestrians
 April 30 th, 2018 Reducing the Risks to Child Pedestrians Technical Tips Audio is broadcast through computer speakers Download resources in the File Share pod (above the slides) If you experience audio
Film Guide for Educators. Designing for Safety
 Film Guide for Educators Designing for Safety Designing For Safety Key Concepts Speeding While Driving Speeding is the number one cause of injuries and deaths from driving. The main reasons are because
Effective Pedestrian & Bicycle Safety Enforcement
 Effective Pedestrian & Bicycle Safety Enforcement October 20, 2011 George Branyan Pedestrian Program Coordinator District Department of Transportation Increasingly multi-modal region Change in Daily Trip
Telephone Survey of Washington State Voters June 2014
 Telephone Survey of Washington State Voters June 2014 Methodology Telephone survey of likely November 2014 voters in Washington State May 28 th June 2 nd, 2014 506 total interviews statewide MoE = ± 4.4%
Eastern PA Trail Summit October 1, 2018
 Eastern PA Trail Summit October 1, 2018 WHO WE ARE + WHY + WE RE * HERE * * * * * * Session Goals: Discuss how to coordinate planning and design in small, urbanized towns Consider how to develop alternative
City of Stamford, Vision Zero Planning Study-Education
 City of Stamford, Vision Zero Planning Study-Education Review of National Best Practices Frank Petise (City of Stamford) Sandeep Aysola (Yale School of Forestry & Environmental Studies/ CDM Smith Inc.)
Santa Cruz City Schools Complete Streets Master Plan February 2015
 Prepared for City of Santa Cruz Public Works by Ecology Action Acknowledgements: Alta Planning and Design Brett Hondorp Caltrans Mark McCumsey Ecology Action Jeanne LePage Piet Canin Lore James Parisi
MARKET/JFK VISION ZERO PILOT PROJECT FEBRUARY 2019 EVALUATION REPORT
 MARKET/JFK VISION ZERO PILOT PROJECT FEBRUARY 2019 EVALUATION REPORT WHY IS THIS PROJECT IMPORTANT? Market Street and JFK Boulevard in Center City are key east-west corridors in the core business district.
We believe the following comments and suggestions can help the department meet those goals.
 The Honorable Secretary Anthony Foxx The Secretary of Transportation United States Department of Transportation 1200 New Jersey Avenue, SE Washington, DC 20590 August 30, 2013 Dear Secretary Foxx, Thank
Sardis Elementary School Road Safety Plan. Produced by: Sardis Elementary School - Safer School Travel Team in cooperation with Safer City
 Sardis Elementary Road Safety Plan Produced by: Sardis Elementary - Safer Travel Team in cooperation with Safer City Plan completed in January 2016 1 Acknowledgements It takes commitment and community
School Bicycling and Walking Policies: Addressing Policies that Hinder and Implementing Policies that Help
 School Bicycling and Walking Policies: Addressing Policies that Hinder and Implementing Policies that Help Tip Sheet As key partners in Safe Routes to School (SRTS) programs, schools and school districts
Bikeway action plan. Bicycle Friendly Community Workshop March 5, 2007 Rochester, MN
 Bikeway action plan Summary The was held on March 5, 2007 at the Rochester Mayo Civic Center. The workshop was hosted by Rochester-Olmsted County Planning Department in collaboration with the League of