Motorized Transportation Trips, Employer Sponsored Transit Program and Physical Activity
|
|
|
- Geraldine Benson
- 5 years ago
- Views:
Transcription


1 Motorized Transportation Trips, Employer Sponsored Transit Program and Physical Activity Ugo Lachapelle Msc. Lawrence D. Frank, PhD Active Living Research Washington, DC April 12, 2008
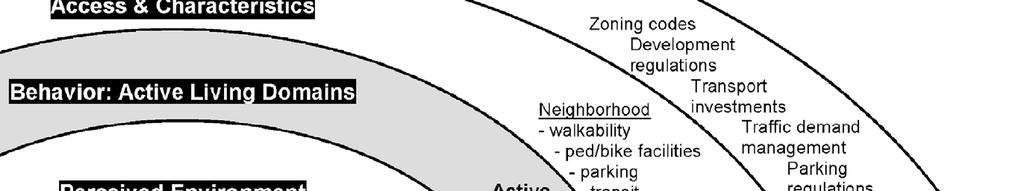
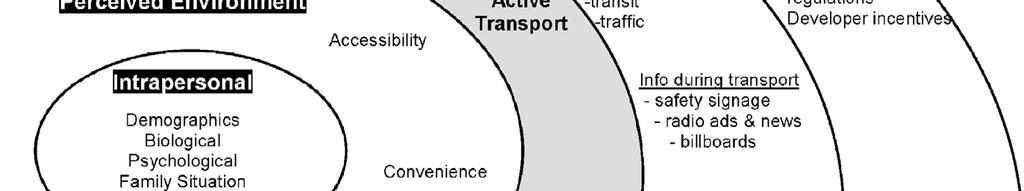
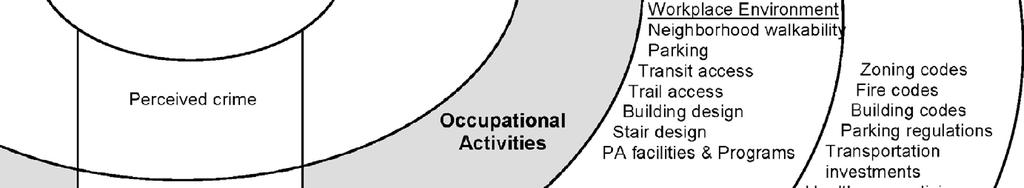
2 Outline Background: Walking and the built environment Theoretical approach: Ecological model Focus on travel behavior and policy level Hypotheses: transit use and transit incentives walking Method: Travel survey TDM incentives Main Results Conclusion and implications
3 Background Public Health - US Surgeon General, 1996 Recommendations for moderate physical activity in daily life 30min. ± 1.5mile = 2.4km : enough to provide health benefits Little research on the relationships between transit use and walking Impact of transportation incentive programs or travel demand management (TDM) on walking for transportation
4 Sallis et al., 2004; Saelens et al., 2003; Frank et al., 2003; Lee and Moudon, 2004 Besser and Dannenberg, 2005 Walking / PA Lucove et al Built environment policies Transit use Frank, 1994; Ewing and Cervero, 2001; Cervero, 2001; Handy et al., 2002 Badoe and Yendeti, 2007
5
6
7 Transit use and physically active lifestyles
8 Transit users walk to transit Besser and Dannenberg, 2005 Methods: 2001 National Household Travel Survey N= 3312 transit users, self-report time to transit Americans who use transit spend a median of 19 minutes daily walking to and from transit 29% achieve 30 minutes of physical activity a day solely by walking to and from transit Rail users, minorities, low income households, and people in high-density areas were more likely to spend 30 minutes walking to and from transit daily
9 Employer sponsored transit pass Transportation Equity Act of the 21st Century (1999) Revised the Internal Revenue Service Code Changed the tax structure to help level the playing field between parking benefits and transit benefits (Surface Transportation Policy Project: )
10 Programs are tax free to employees and tax deductible for the employer Employer Tax Benefit: Employers pay for the benefit (give their employees up to $100/month to commute via transit) Receive an equivalent deduction from business income taxes and save money by providing same value in gross income Employee Tax Benefit: The employee receives up to $100/month tax free Transit agencies benefit from increased ridership (Brown, Hess and Shoup, 2003) (Surface Transportation Policy Project: )
 Employed, 16-70 years, N=4,136 2-day snapshot using travel diaries # Trips per modes")
/destination) Net residential density (census block) Network distance to")
11 Method Metro Atlanta Travel Survey ( ) (8,600 Household, indiv.) Employed, years, N=4,136 2-day snapshot using travel diaries # Trips per modes Socio-demographics TDM work perks Walking distances (network) derived by GIS (origin/(access/egress)/destination) Net residential density (census block) Network distance to nearest transit stop (Other work includes: Frank et al., 2004; 2005; 2008)
12 Central variables Mean trips taken per each mode: an expression of individuals transportation choices and constraints Employer sponsored public transit pass Does your employer offers free or subsidized public transit passes? Yes, no In a typical week, do you use your free or subsidized transit pass? None, Once or more Car availability: vehicles/drivers Hypotheses The likelihood of meeting the PA recommendation solely by walking for transportation would be greater for transit users than for car drivers or passengers. Using an employer sponsored transit pass may also be associated with meeting PA recommendation
13 Individual and household (Income Age Ethnicity Car availability) Neighbourhood Density (5 cat.) Motorized travel Trips per mode (transit, car driver/passenger) Walking distance No walking, Some walking, Meeting Recommendation walking 2.4 km a day, approx. 30 minutes Distance to transit service for users (2 cat.) Employer sponsored transit pass (3 cat.) Retail available 10 min. walk from work?
14 Descriptives 2.6% met PA recommendation solely by walking for transportation, 8.3% recorded some walking 5.4% of the sample used transit 19% of individuals were in areas with a net residential density of 6+ dwelling units per acre 65% of individuals lived in single use low density residential areas 8.7% of our sample had and used an employer sponsored transit pass 11.1% were eligible to such a program but did not use it 1.3% of sampled individuals had no car, and 6% shared a car with other household members
15 Results Table 2: Distance walked and trips per mode by income groups and transit use Transit users Non-users of transit Income Total Less than $30,000 to $60,000 (5.4%) Less than $30,000 to $30,000 $60,000 and more $30,000 $60,000 $60,000 and more Total (94.6%) n (%) 52 (23.2) 92 (41.1) 80 (35.7) 224 (100) 509 (12.9) 1471(37.4) 1952(49.6) 3932(100) Transit trips Driver trips Passenger trips At least one walk trip (%) 59.6% 60.9% 56.3% 58.9% 11.6% 9.0% 8.9% 9.3% Total distance walked No car or no License (%) Shared car (%) Car fully available (%)
16 Multinomial logistic regression A B No walk Some walk Meet Recomm. Only trips by transit are significantly associated with greater odds of meeting PA recommendation (OR=3.35; CI= ) Car availability - negative association with meeting PA recommendation (OR=0.13, CI= ) Both higher and lower income groups had higher OR of meeting PA recommendation than the middle income group C
17 A B C No walk Some walk Meet Recomm. Having and making use of an employer sponsored transit pass was positively associated with meeting PA recommendation (OR=4.96, CI= ) Having access to, but not using an employer sponsored transit pass had a significant OR of 2.2 (CI= ) of meeting PA recommendation When estimating OR of meeting recommendation with moderate walkers as a reference category (C), trips as driver (OR=0.86, CI= ), car availability (OR=0.25, CI= ), and having and using an employer sponsored transit pass (OR=3.6, CI= ) remained significant
18 Limitations Skewed sample distribution Low transit use in Atlanta Low density environment Limited transit coverage Few walkers Self-reported travel data No measure of the speed or intensity of walking Underreporting of walk trips Possible selection bias Quality of transit service?
19 Conclusion Positive association between the number of public transportation trips and meeting PA recommendation Positive association between using an employer sponsored transit pass and meeting PA recommendation More investigation is required to understand the distribution of access to public transit incentives, the factors that support their use, and how such use may translate into a more active lifestyle. Providing transit opportunities can potentially improve physical activity levels
20 Thank you!
Built Environment and Older Adults: Supporting Smooth Transitions Across the Life- Span. Dr. Lawrence Frank, Professor and Bombardier UBC
 Built Environment and Older Adults: Supporting Smooth Transitions Across the Life- Span Dr. Lawrence Frank, Professor and Bombardier Chair @ UBC The Hidden Health Costs of Transportation - Frank et al
Transit and Physical Activity Studies: Design and Measures Considerations From the TRAC Study
 Transit and Physical Activity Studies: Design and Measures Considerations From the TRAC Study Brian E. Saelens, Ph.D. University of Washington Seattle Children s Research Institute Objectives Rationale
Travel Behavior of Baby Boomers in Suburban Age Restricted Communities
 Travel Behavior of Baby Boomers in Suburban Age Restricted Communities TRB Conference Impact of Changing Demographics on the Transportation System 27 October 2008 P. Christopher Zegras Frank Hebbert Eran
Factors influencing choice of commuting mode
 Factors influencing choice of commuting mode Lin Yang J. Aaron Hipp, Deepti Adlakha, Christine Marx, Rachel Tabak, and Ross Brownson Active Living Research February 24, 2015 Active commuting Background
Neighborhood Environment Profiles Related to Physical Activity and Weight Status among Seniors: A Latent Profile Analysis
 Neighborhood Environment Profiles Related to Physical Activity and Weight Status among Seniors: A Latent Profile Analysis Marc A. Adams, Ph.D. University of California, San Diego & Adjunct Assistant Professor
Transport attitudes, residential preferences, and urban form effects on cycling and car use.
 Downloaded from orbit.dtu.dk on: Mar 10, 2019 Transport attitudes, residential preferences, and urban form effects on cycling and car use. Nielsen, Thomas Alexander Sick; Olafsson, Anton Stahl; Carstensen,
Factors Associated with the Bicycle Commute Use of Newcomers: An analysis of the 70 largest U.S. Cities
 : An analysis of the 70 largest U.S. Cities Ryan J. Dann PhD Student, Urban Studies Portland State University May 2014 Newcomers and Bicycles Photo Credit: Daveena Tauber 2 Presentation Outline Introduction
Pedestrian Activity Criteria. PSAC March 8, 2011
 Pedestrian Activity Criteria PSAC March 8, 2011 Contents 1. Project Overview a) Revised schedule of PSAC hearings 2. Pedestrian Activity: Where walking is important a) Existing conditions (revisions based
REGIONAL HOUSEHOLD TRAVEL SURVEY:
 Defining the Vision. Shaping the Future. REGIONAL HOUSEHOLD TRAVEL SURVEY: Profile Why we travel How we travel Who we are and how often we travel When we travel Where we travel How far and how long we travel
Health Impact Analysis for Integrated Regional Land Use and Transportation Plan
 Health Impact Analysis for Integrated Regional Land Use and Transportation Plan Hsi-Hwa Hu, Guoxiong Huang, Frank Wen, Simon Choi (Southern California Association of Governments) Margaret Shih (Los Angeles
City of Davenport CitiBus Public Transportation Study. April 2015
 City of Davenport CitiBus Public Transportation Study April 2015 Overview Project Background Key Findings CitiBus Service Allocation Policy Discussion 2 Project Background 3 About CitiBus Operates 17 routes
Dr. Lawrence Frank, Professor, University of British Columbia & President, Urban Design 4 Health, Inc.
 Dr. Lawrence Frank, Professor, University of British Columbia & President, Urban Design 4 Health, Inc. On 350 calories one apple tart or a special slice of Ray's Pizza a cyclist can travel 10 miles, a
Webinar: Development of a Pedestrian Demand Estimation Tool
 Portland State University PDXScholar TREC Webinar Series Transportation Research and Education Center (TREC) 2-18-2016 Webinar: Development of a Pedestrian Demand Estimation Tool Kelly Clifton Portland
Assessment of socio economic benefits of non-motorized transport (NMT) integration with public transit (PT)
 integration with public transit (PT)") Assessment of socio economic benefits of non-motorized transport (NMT) integration with public transit (PT) Case study of Bike share (BS) system in Pune, India Parvesh Kumar Sharawat Department of Policy
Assessment of socio economic benefits of non-motorized transport (NMT) integration with public transit (PT) Case study of Bike share (BS) system in Pune, India Parvesh Kumar Sharawat Department of Policy
2014 Metro Transit Customer Survey Highlights
 2014 Metro Transit Customer Survey Highlights Metropolitan Council Transportation Committee - April 13, 2015 Presented by: Bruce Howard, Director of Customer Services and Marketing METHODOLOGY : Quantitative
Guidelines for Providing Access to Public Transportation Stations APPENDIX C TRANSIT STATION ACCESS PLANNING TOOL INSTRUCTIONS
 APPENDIX C TRANSIT STATION ACCESS PLANNING TOOL INSTRUCTIONS Transit Station Access Planning Tool Instructions Page C-1 Revised Final Report September 2011 TRANSIT STATION ACCESS PLANNING TOOL INSTRUCTIONS
Central Jersey Transportation Forum. March 2007
 Central Jersey Transportation Forum March 2007 Feasibility Analysis of BRT on Dinky Right of Way from Princeton Station to Alexander Rd. in West Windsor (west of Rt. 1) Study spurred by Princeton University's
Fixed Guideway Transit Outcomes on Rents, Jobs, and People and Housing
 Fixed Guideway Transit Outcomes on Rents, Jobs, and People and Housing Arthur C. Nelson, Ph.D., ASCE, FAICP Professor of Planning and Real Estate Development University of Arizona 1 Changing Transportation
Title VI Fare Change Equity Analysis
 Title VI Fare Change Equity Analysis Evaluation Report Submitted to Dallas Area Rapid Transit Submitted by TranSystems June 2012 Title VI Fare Change Equity Analysis Introduction DART has proposed a schedule
Webinar: The Association Between Light Rail Transit, Streetcars and Bus Rapid Transit on Jobs, People and Rents
 Portland State University PDXScholar TREC Webinar Series Transportation Research and Education Center (TREC) 11-15-2016 Webinar: The Association Between Light Rail Transit, Streetcars and Bus Rapid Transit
RIDERSHIP PREDICTION
 RIDERSHIP PREDICTION Outline 1. Introduction: route ridership prediction needs and issues. 2. Alternative approaches to route ridership prediction. Professional judgement Survey-based methods Cross-sectional
2011 Census Snapshot: Method of Travel to work in London
 CIS 2014-06 2011 Census Snapshot: Method of Travel to work in London March 2014 Introduction On 26 th of March 2014, the Office for National Statistics (ONS) published a series of tables looking at the
TRANSIT RIDERSHIP AND THE BUILT ENVIRONMENT
 TRANSIT RIDERSHIP AND THE BUILT ENVIRONMENT Del Peterson Associate Research Fellow Small Urban & Rural Transit Center Upper Great Plains Transportation Institute North Dakota State University August 2011
Examining the relationship between transit use and active transportation in Canada: a time use approach of the active lifestyle of transit users
 1 2 3 4 5 6 7 8 9 10 11 12 13 14 15 16 17 18 19 20 21 22 23 24 25 26 27 28 29 30 31 32 33 34 35 36 37 38 39 40 41 42 43 Examining the relationship between transit use and active transportation in Canada:
BUILDING THE CASE FOR TRAVEL OPTIONS IN WASHING TON COUNTY. Image: Steve Morgan. Image: Steve Morgan
 BUILDING THE CASE FOR TRAVEL OPTIONS IN WASHING TON COUNTY Image: Steve Morgan Image: Steve Morgan Image: TriMet Image: TriMet WHAT ARE TRAVEL OPTIONS PROGRAMS? Travel options programs encourage residents,
Memorandum. Drive alone
 Memorandum To: Cc: From: Kimberly Kerr, Assistant Chief Administrative Officer Natalie Porter, PE, TE Shawna Purvines Claudia Wade, PE Michael Schmitt, AICP CTP, PTP Re: Technical Memorandum #2: Model
Kevin Manaugh Department of Geography McGill School of Environment
 Kevin Manaugh Department of Geography McGill School of Environment Outline Why do people use active modes? Physical (Built environment) Factors Psychological Factors Empirical Work Neighbourhood Walkability
Attitude towards Walk/Bike Environments and its Influence on Students Travel Behavior: Evidence from NHTS, 2009
 Attitude towards Walk/Bike Environments and its Influence on Students Travel Behavior: Evidence from NHTS, 2009 Dr. Mintesnot Woldeamanuel California State University Northridge The 9 th Active Living
The Ten Toe Express Program
 The Ten Toe Express Program A campaign to promote walking and transit use in St. Louis Rail~Volution Conference November 3, 2007 Jessi Erickson, MPH Purpose of Presentation Background on physical activity
Extracting Maximum Benefit from Parking Policy - 10 Years Experience in Perth, Australia. By Emmerson Richardson Sinclair Knight Merz
 Extracting Maximum Benefit from Parking Policy - 10 Years Experience in Perth, Australia By Emmerson Richardson Sinclair Knight Merz Snapshot of Perth > Metropolitan Area Population 1.7 million > 3.5 million
The Impact of Placemaking Attributes on Home Prices in the Midwest United States
 The Impact of Placemaking Attributes on Home Prices in the Midwest United States 2 0 1 3 C O N S T R U C T E D E N V I R O N M E N T C O N F E R E N C E M A R Y B E T H G R A E B E R T M I C H I G A N
Americans in Transit A Profile of Public Transit Passengers
 Americans in Transit A Profile of Public Transit Passengers published by American Public Transit Association December 1992 Louis J. Gambacclnl, Chairman Rod Diridon, Vice Chairman Fred M. Gilliam, Secretary-Treasurer
Carbonless Footprints: Health and Environmental benefits of Active Transportation
 Carbonless Footprints: Health and Environmental benefits of Active Transportation Dr. Lawrence Frank, Professor and Bombardier Chair in Sustainable Transportation - University of British Columbia Health
Exploring Factors Affecting Metrorail Ridership in Washington D.C.
 Exploring Factors Affecting Metrorail Ridership in Washington D.C. Chao Liu, Ph.D., Hiro Iseki, Ph.D. National Center for Smart Growth University of Maryland, College Park September 2015, GIS in Transit
TRANSIT DEPENDENCE AND CHOICE RIDERS IN THE NHTS 2009: ASSOCIATIONS WITH WALK, BICYCLE AND TRANSIT TRIPS
 TRANSIT DEPENDENCE AND CHOICE RIDERS IN THE NHTS 2009: ASSOCIATIONS WITH WALK, BICYCLE AND TRANSIT TRIPS LACHAPELLE, UGO PHD, DÉPARTEMENT D ÉTUDES URBAINES ET TOURISTIQUES, ÉCOLE DES SCIENCES DE LA GESTION,
Bike Sharing as Active Transportation
 Bike Sharing as Active Transportation February 28, 2013 Nicole Nagaya, P.E. Active Living Research Conference Image credit: Flickr User nycstreets What We Do What We Do Strong & Fearless
Transportation-Demand Management Community Presentation
 Transportation-Demand Management Community Presentation American University Office of Risk, Safety and Transportation programs Thursday, June 7, 2018 Program Objectives Improve transportation options for
El Paso to Las Cruces Proposed Rail Service Estimated Ridership and Proposed Schedule
 to Las Cruces Proposed Rail Service Estimated Ridership and Proposed Schedule Ridership estimation is a central consideration when assessing the feasibility of a proposed transit line. A sketch model is
Life Transitions and Travel Behaviour Study. Job changes and home moves disrupt established commuting patterns
 Life Transitions and Travel Behaviour Study Evidence Summary 2 Drivers of change to commuting mode Job changes and home moves disrupt established commuting patterns This leaflet summarises new analysis
THESE DAYS IT S HARD TO MISS the story that Americans spend
 WHICH COMES FIRST: THE NEIGHBORHOOD OR THE WALKING? BY SUSAN HANDY AND PATRICIA MOKHTARIAN THESE DAYS IT S HARD TO MISS the story that Americans spend more time stuck in traffic than ever, that they re
2014 peterborough city and county. active. transportation. & health. indicators primer
 2014 city and county active transportation & health indicators primer executive summary Walking, cycling and transit are good for our personal health, our local economies, and the environment. Understanding
The Association between Access to Public Transportation and Self-Reported Active Commuting
 Int. J. Environ. Res. Public Health 2014, 11, 12632-12651; doi:10.3390/ijerph111212632 OPEN ACCESS Article International Journal of Environmental Research and Public Health ISSN 1660-4601 www.mdpi.com/journal/ijerph
Community Improvement Plans: Creating walkable and liveable communities that support local business
 Community Improvement Plans: Creating walkable and liveable communities that support local business Kate Hall Program Manager ~ WALK Friendly Ontario Canada Walks, Green Communities Canada khall@greencommunitiescanada.org
92% COMMUTING IN THE METRO. Congested Roadways Mode Share. Roadway Congestion & Mode Share
 COMMUTING IN THE METRO Roadway Congestion & Mode Share The majority of major roadways in Greater Des Moines are without congestion and have underutilized capacity. This surplus capacity could be used for
CPC Parking Lot Riverside Drive. Transportation Rationale
 CPC Parking Lot Transportation Rationale Prepared By: NOVATECH Suite 200, 240 Michael Cowpland Drive Ottawa, Ontario K2M 1P6 September 2015 Novatech File: 114093 Ref: R-2015-153 Table of Contents 1.0 INTRODUCTION...
Congestion Management in Singapore. Assoc Prof Anthony TH CHIN Department of Economics National University of Singapore
 Congestion Management in Singapore Assoc Prof Anthony TH CHIN Department of Economics National University of Singapore anthonychin@nus.edu.sg Introduction 2 Introduction and What is Traffic Congestion?
East London Neighbourhood Profile
 East London Neighbourhood Profile For further information contact: John-Paul Sousa Planning Research Analyst Direct: (519) 661-2500 ext. 5989 I email: jpsousa@london.ca Page 1 Page 2 Population Characteristics
Potential MBTA Fare Changes in SFY 2017
 Potential MBTA Fare Changes in SFY 2017 Option 1 Impact Analysis A report produced for the Massachusetts Bay Transportation Authority by the Central Transportation Planning Staff Potential MBTA Fare Changes
Transportation Research Part D
 Transportation Research Part D 17 (2012) 525 531 Contents lists available at SciVerse ScienceDirect Transportation Research Part D journal homepage: www.elsevier.com/locate/trd Determinants of bicycle
Rochester Area Bike Sharing Program Study
 roc bike share Rochester Area Bike Sharing Program Study Executive Summary ~ January 2015 JANUARY 2015 8484 Georgia Avenue, Suite 800 Silver Spring, MD 20910 3495 Winton Pl., Bldg E, Suite 110 Rochester,
Summary Report: Built Environment, Health and Obesity
 Research and education Built Environment Edmonton Project Summary Report: Built Environment, Health and Obesity Introduction In 2007 the Canadian Institutes of Health Research and the Heart and Stroke
Maurer 1. Feasibility Study for a Bicycle Sharing Program in Sacramento, California
 Maurer 0 0 0 Feasibility Study for a Bicycle Sharing Program in Sacramento, California Lindsay Kathryn Maurer Planner, Planning Communities, LLC Past Affiliation: Masters Candidate at UNC Chapel Hill,
Potential MBTA Fare Changes in SFY 2017
 Potential MBTA Fare Changes in SFY 2017 Modification to Option 2: Impact Analysis A report produced for the Massachusetts Bay Transportation Authority by the Central Transportation Planning Staff Potential
Copyright 2013 Transportation Research Board
 Tilahun, N., Thakuriah, P., and Mallon, Y. (2013) Factors Determining Transit Access by Car Owners: Implications for Intermodal Passenger Transportation Planning. In: Transportation Research Board Annual
Investigating Commute Mode and Route Choice Variability in Jakarta using multi-day GPS Data
 Investigating Commute Mode and Route Choice Variability in Jakarta using multi-day GPS Data Zainal N. Arifin Kay W. Axhausen Conference paper STRC 2011 Investigating Commute Mode and Route Choice Variability
How commuting influences personal wellbeing over time
 Partners: DfT, DoH, DCLG, WWCW How commuting influences personal wellbeing over time Ben Clark, Kiron Chatterjee, Adrian Davis, Adam Martin Centre for Transport & Society Panel data Numerous UK panel datasets
Hamilton Road Neighbourhood Profile
 Hamilton Road Neighbourhood Profile For further information contact: John-Paul Sousa Planning Research Analyst Direct: (519) 661-2500 ext. 5989 I email: jpsousa@london.ca Page 1 Page 2 Population Characteristics
Understanding Travel Modes to Non-work Destinations: Analysis of an Establishment Survey in Portland, Oregon
 Portland State University PDXScholar Dissertations and Theses Dissertations and Theses Spring 6-21-2013 Understanding Travel Modes to Non-work Destinations: Analysis of an Establishment Survey in Portland,
Capital and Strategic Planning Committee. Item III - B. April 12, WMATA s Transit-Oriented Development Objectives
 Capital and Strategic Planning Committee Item III - B April 12, 2018 WMATA s Transit-Oriented Development Objectives Page 24 of 76 Washington Metropolitan Area Transit Authority Board Action/Information
4 Ridership Growth Study
 Clause 4 in Report No. 15 of Committee of the Whole was adopted, without amendment, by the Council of The Regional Municipality of York at its meeting held on November 16, 2017. 4 Ridership Growth Study
MTA Surveys: Facts and Findings. NYMTC Brown Bag March 12, 2014 Julia Seltzer, MTA Planning
 MTA Surveys: Facts and Findings NYMTC Brown Bag March 12, 2014 Julia Seltzer, MTA Planning MTA Planning Survey Program Why survey? Who was surveyed? Challenges Methodologies Findings Uses for data 1 Why
Sandra Nutter, MPH James Sallis, PhD Gregory J Norman, PhD Sherry Ryan, PhD Kevin Patrick, MD, MS
 Objectively Measured Environmental Correlates of Adolescent Physical Activity Sandra Nutter, MPH James Sallis, PhD Gregory J Norman, PhD Sherry Ryan, PhD Kevin Patrick, MD, MS San Diego State University
ED:R:JothiL: PAGN:vs SCAN: ARTICLE IN PRESS
 dcþ model SSM : Prod:Type:FTP pp:2ðcol:fig::þ ED:R:JothiL: PAGN:vs SCAN: Social Science & Medicine ] (]]]]) ]]] ]]] www.elsevier.com/locate/socscimed 2 Q2 Stepping towards causation: Do built environments
I-105 Corridor Sustainability Study (CSS)
") I-105 Corridor Sustainability Study (CSS) Metro Streets and Freeways Subcommittee March 21, 2019 Gary Hamrick Cambridge Systematics, Inc. I-105 CSS Project History & Background Funded by Caltrans Sustainable
I-105 Corridor Sustainability Study (CSS) Metro Streets and Freeways Subcommittee March 21, 2019 Gary Hamrick Cambridge Systematics, Inc. I-105 CSS Project History & Background Funded by Caltrans Sustainable
PHYSICAL ACTIVITY AND TRANSPORTATION BENEFITS OF WALKABLE APPROACHES TO COMMUNITY DESIGN IN BRITISH COLUMBIA
 PHYSICAL ACTIVITY AND TRANSPORTATION BENEFITS OF WALKABLE APPROACHES TO COMMUNITY DESIGN IN BRITISH COLUMBIA Prepared for the British Columbia Recreation and Parks Association 101-4664 Lougheed Highway
Longitudinal analysis of young Danes travel pattern.
 Aalborg trafikdage 24.08.2010 Longitudinal analysis of young Danes travel pattern. Sigrun Birna Sigurdardottir PhD student, DTU Transport. Background Limited literature regarding models or factors influencing
Briefing Paper #1. An Overview of Regional Demand and Mode Share
 2011 Metro Vancouver Regional Trip Diary Survey Briefing Paper #1 An Overview of Regional Demand and Mode Share Introduction The 2011 Metro Vancouver Regional Trip Diary Survey is the latest survey conducted
Fox Hollow Neighbourhood Profile
 Fox Hollow Profile For further information contact: John-Paul Sousa Planning Research Analyst Direct: (519) 661-2500 ext. 5989 I email: jpsousa@london.ca Page 1 Page 2 Population Characteristics & Age
What Are The Benefits? How RIDERSHIP + Can Help You. Select RIDERSHIP + Projects
 Ridership + is a suite of regression-based direct ridership forecasting tools that harness station area built environment variables to estimate ridership on a wide variety of transit modes. What Are The
the 54th Annual Conference of the Association of Collegiate School of Planning (ACSP) in Philadelphia, Pennsylvania November 2 nd, 2014
 in Philadelphia, Pennsylvania November 2 nd, 2014") the 54th Annual Conference of the Association of Collegiate School of Planning (ACSP) in Philadelphia, Pennsylvania November 2 nd, 2014 Hiroyuki Iseki, Ph.D. Assistant Professor Urban Studies and Planning
the 54th Annual Conference of the Association of Collegiate School of Planning (ACSP) in Philadelphia, Pennsylvania November 2 nd, 2014 Hiroyuki Iseki, Ph.D. Assistant Professor Urban Studies and Planning
APPLICATION OVERVIEW APPLICATION FORM OUTLINE
 APPLICATION OVERVIEW 2020 2023 Transportation Improvement Program (TIP) Boulder County Subregional Share Project Application Form The Subregional Share Call for Projects will open on January 2, 2019, with
21/02/2018. How Far is it Acceptable to Walk? Introduction. How Far is it Acceptable to Walk?
 21/2/218 Introduction Walking is an important mode of travel. How far people walk is factor in: Accessibility/ Sustainability. Allocating land in Local Plans. Determining planning applications. Previous
Forecasting High Speed Rail Ridership Using Aggregate Data:
 Transportation Research Board 2015, Washington D.C. Forecasting High Speed Rail Ridership Using Aggregate Data: A Case Revisit of High Speed Rail in Taiwan Yu-Ting Hsu, Wei-Ren Lin, Yung-Cheng (Rex) Lai,
Application of Demographic Analysis to Pedestrian Safety. Center for Urban Transportation Research University of South Florida
 Application of Demographic Analysis to Pedestrian Safety BDV25 TWO 977 30 Pei Sung Lin, Ph.D., P.E., PTOE, FITE Program Director Achilleas Kourtellis, Ph.D. Senior Research Associate CUTR, University of
Estimating Paratransit Demand Forecasting Models Using ACS Disability and Income Data
 Estimating Paratransit Demand Forecasting Models Using ACS Disability and Income Data Presenter: Daniel Rodríguez Román University of Puerto Rico, Mayagüez Co-author: Sarah V. Hernandez University of Arkansas,
CONCEPTUAL MODELS: THE RELATIONSHIP BETWEEN BUILT ENVIRONMENT AND HEALTH
 CONCEPTUAL MODELS: THE RELATIONSHIP BETWEEN BUILT ENVIRONMENT AND HEALTH TABLE OF CONTENTS Acknowledgements 3 Description of Process 4 Overview Model: From Built Environment to Public Health 8 Aggregate
1999 On-Board Sacramento Regional Transit District Survey
 SACOG-00-009 1999 On-Board Sacramento Regional Transit District Survey June 2000 Sacramento Area Council of Governments 1999 On-Board Sacramento Regional Transit District Survey June 2000 Table of Contents
Estimating Ridership of Rural Demand-Response Transit Services for the General Public
 Estimating Ridership of Rural Demand-Response Transit Services for the General Public August 2016 prepared for US DOT prepared by Jeremy Mattson North Dakota State University Upper Great Plains Transportation
Modal Shift in the Boulder Valley 1990 to 2009
 Modal Shift in the Boulder Valley 1990 to 2009 May 2010 Prepared for the City of Boulder by National Research Center, Inc. 3005 30th Street Boulder, CO 80301 (303) 444-7863 www.n-r-c.com Table of Contents
Huron Heights Neighbourhood Profile
 Huron Heights Neighbourhood Profile For further information contact: John-Paul Sousa Planning Research Analyst Direct: (519) 661-2500 ext. 5989 I email: jpsousa@london.ca Page 1 Page 2 Population Characteristics
Built-environment Variables Influencing Aggregate Walking: a Multivariate Analysis of Halifax Neighbourhoods. By Kevin Neatt
 Built-environment Variables Influencing Aggregate Walking: a Multivariate Analysis of Halifax Neighbourhoods By Kevin Neatt A Thesis Submitted to Saint Mary s University, Halifax, Nova Scotia in Partial
What HQ2 Finalist Cities Think about Amazon Moving to Town. Table of Contents
 What HQ2 Finalist Cities Think about Amazon Moving to Town Survey of Adult Residents in U.S. Finalist MSAs In Partnership with the Business Journals March 30 th April 3 rd, 2018 Table of Contents SURVEY
Pedestrian Demand Modeling: Evaluating Pedestrian Risk Exposures
 Pedestrian Demand Modeling: Evaluating Pedestrian Risk Exposures Kelly J. Clifton National Center for Smart Growth University of Maryland May 19, 2008 Study Team University of Maryland National Center
Active Travel and Exposure to Air Pollution: Implications for Transportation and Land Use Planning
 Active Travel and Exposure to Air Pollution: Implications for Transportation and Land Use Planning Steve Hankey School of Public and International Affairs, Virginia Tech, 140 Otey Street, Blacksburg, VA
Active Community Design: Why Here? Why Now?
 Active Community Design: Why Here? Why Now? Chris Holm Development Review Coordinator 20 April, 2015 Sacramento, California Our environment has changed North Natomas We ve rapidly urbanize our open space
Regional Bicycle Barriers Study
 Regional Bicycle Barriers Study Executive Summary Background and Purpose The 2040 Transportation Policy Plan (TPP) sets policies for planning and investment direction in the transportation system in the
Understanding Transit Demand. E. Beimborn, University of Wisconsin-Milwaukee
 Understanding Transit Demand E. Beimborn, University of Wisconsin-Milwaukee 1 Purpose To provide a basic understanding of transit ridership and some common misunderstandings. To explain concepts of choice
Central London Neighbourhood Profile
 Central London Neighbourhood Profile For further information contact: John-Paul Sousa Planning Research Analyst Direct: (519) 661-2500 ext. 5989 I email: jpsousa@london.ca Page 1 Page 2 Population Characteristics
Active Living and Community Design: The Twin Cities Walking Study
 Active Living and Community Design: The Twin Cities Walking Study Ann Forsyth Metropolitan Design Center April 2006 Ann Forsyth, Metropolitan Design Center, University of Minnesota Active Living and Community
Bike Share Social Equity and Inclusion Target Neighborhoods
 Bike Share Social Equity and Inclusion Target Neighborhoods Target Neighborhoods West End/Visitation Park/Academy/Hamilton Heights Wellsgoodfellow/Kingsway West The Ville/Greater Ville Kingsway East/Fountain
Small steps, big differences: Assessing the validity of using home and work locations to estimate walking distances to transit
 Veillette, Deboosere, Wasfi, Ross, & El-Geneidy 0 0 0 0 Small steps, big differences: Assessing the validity of using home and work locations to estimate walking distances to transit Marie-Pier Veillette
Congestion Evaluation Best Practices
 Congestion Evaluation Best Practices Todd Litman Victoria Transport Policy Institute Presented International Transportation and Economic Development Conference 10 April 2014 Congestion Indicators Indicator
Stoney Creek Neighbourhood Profile
 Stoney Creek Profile For further information contact: John-Paul Sousa Planning Research Analyst Direct: (519) 661-2500 ext. 5989 I email: jpsousa@london.ca Page 1 Page 2 Population Characteristics & Age
The Walkability Indicator. The Walkability Indicator: A Case Study of the City of Boulder, CO. College of Architecture and Planning
 1 : A Case Study of the City of Boulder, CO College of Architecture and Planning University of Colorado Author Note: Daryoosh Ardalan, Urban Regional Planning, College of Architecture and Planning, University
STAFF REPORT ACTION REQUIRED
 STAFF REPORT ACTION REQUIRED 2016 Ridership Update Date: March 23, 2016 To: From: TTC Board Chief Executive Officer Summary This report provides an update of TTC ridership results to the end of February
Local environment characteristics associated with walking and taking transit to shopping districts
 THE JOURNAL OF TRANSPORT AND LAND USE http://jtlu.org VOL. 8 NO. 2 [2015] pp. 125 147 Local environment characteristics associated with walking and taking transit to shopping districts Robert James Schneider
Southcrest Neighbourhood Profile
 Southcrest Neighbourhood Profile For further information contact: John-Paul Sousa Planning Research Analyst Direct: (519) 661-2500 ext. 5989 I email: jpsousa@london.ca Page 1 Page 2 Population Characteristics
Engineers and Walkability A match made in heaven or a toxic relationship?
 Engineers and Walkability A match made in heaven or a toxic relationship? The Cleaner, Greener, Leaner Study Lorraine Fitzsimons D Arcy Centre for Preventative Medicine, Dublin City University (PhD Candidate)
VI. Market Factors and Deamnd Analysis
 VI. Market Factors and Deamnd Analysis Introduction to Public Transport Planning and Reform VI-1 Market Factors The market for Public Transport is affected by a variety of factors No two cities or even
Heightening Walking above its Pedestrian Status: Walking and Travel Behavior in California
 University of California Center for Economic Competitiveness in Transportation Heightening Walking above its Pedestrian Status: Walking and Travel Behavior in California Final Report UCCONNECT 2016 - TO