A computer program that improves its performance at some task through experience.
|
|
|
- Franklin George
- 5 years ago
- Views:
Transcription


1 1
2 A computer program that improves its performance at some task through experience. 2

3 Example: Learn to Diagnose Patients T: Diagnose tumors from images P: Percent of patients correctly diagnosed E: Pre diagnosed tumors (supervision) 3

4 Example: Learn to Diagnose Patients T: Diagnose tumors from images P: Percent of patients correctly diagnosed E: Pre diagnosed tumors Example: Learn Activities of Smart Home Residents T: Identify activities of daily living P: Accuracy of activity labels E: Labeled sequences of sensor events 4

5 Example: Learn to Diagnose Patients T: Diagnose tumors from images P: Percent of patients correctly diagnosed E: Pre diagnosed tumors Example: Learn Activities of Smart Home Residents T: Identify activities of daily living P: Accuracy of activity labels E: Labeled sequences of sensor events Example: Epidemic Outbreak Prediction T: Predict malaria outbreads P: #Predicted cases #Actual cases E: Climate, current cases 5
6 Can this be automated? 6
7
8 If (cell# mod 5) = 3 and cell value = 1.0 and All other cell values = 0.0 8
9 If (cell# mod 5) = 3 and cell value = 1.0 and All other cell values = 0.0 9
10 If (cell# mod 5) = 3 and cell value = 1.0 or If (cell# = 7) and cell value = 1.0 and All other cell values =
11 If (cell# mod 5) = 3 and cell value = 1.0 or If (cell# = 7) and cell value = 1.0 and All other cell values =
12 If (cell# mod 5) = 3 and cell value = 1.0 or If (cell# = 7) and cell value = 1.0 or If (cell# = 22) and cell value = 1.0 AND (cell# 23 = 1.0) AND (cell# 24 = 1.0) and All other cell values =
13 If (cell# mod 5) = 3 and cell value = 1.0 or If (cell# = 7) and cell value = 1.0 or If (cell# = 22) and cell value = 1.0 AND (cell# 23 = 1.0) AND (cell# 24 = 1.0) and All other cell values =
14 If (cell# mod 5) = 3 and cell value between 0.7 and 1.0 or If (cell# = 7) and cell value between 0.7 and 1.0 or If (cell# = 22) and cell value between 0.7 and 1.0 AND (cell# 23 between 0.7 and 1.0 AND (cell# 24 between 0.7 and 1.0) and All other cell values between 0.0 and
15 If (cell# mod 5) = 3 and cell value between 0.7 and 1.0 or If (cell# = 7) and cell value between 0.7 and 1.0 or If (cell# = 22) and cell value between 0.7 and 1.0 AND (cell# 23 between 0.7 and 1.0 AND (cell# 24 between 0.7 and 1.0) and All other cell values between 0.0 and ? 0.5? Shorter? Crooked? 15
 some")

16 Too many combinations to consider manually Might forget (not know) some possible combinations Can this be automated? 16
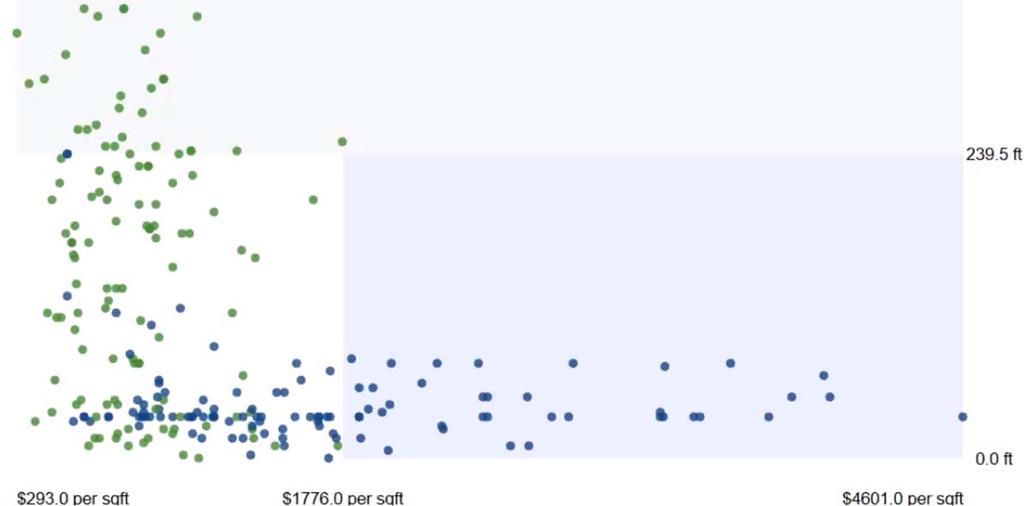
17 Learning task Learn to classify whether a home is in San Francisco or New York Represent each home by elevation 17
18 Learning task Learn to classify whether a home is in San Francisco or New York Represent each home by elevation 18
19 Learning task Learn to classify whether a home is in San Francisco or New York Represent each home by elevation If elevation > 240 then San Francisco 19
20 Add another dimension Home is in San Francisco or New York New feature: price per sq ft If elevation > 240 then San Francisco 20

21 Add another dimension Home is in San Francisco or New York New feature: price per sq ft If elevation > 240 then San Francisco 21
22 Add another dimension Home is in San Francisco or New York New feature: price per sq ft If elevation > 240 then San Francisco else if price >$1777/sqft then New York 22
23 Visualize rule as boundaries of regions in scatterplot If elevation > 240 then San Francisco else if price >$1777/sqft then New York 23
24 Visualize rule as boundaries of regions in scatterplot If elevation > 240 then San Francisco else if price >$1777/sqft then New York 24
25 Seven dimensions 25

26 View elevation histogram 26

27 View elevation histogram 27
28 Decision tree uses ifthen statements to form boundaries If elevation > x then home in San Francisco These statements are forks Forks split the data into branches based feature values Homes to the left of a split point get one label Homes to the right get another label 28
29 If elevation > 240 then home in San Francisco This split incorrectly classifies some San Francisco homes as New York homes Accuracy is 63% correct All the green incorrect labels are false negatives 29
30 If elevation > 0 then home in San Francisco If we try to capture every San Francisco home we will include New York homes These will be false positives 30
31 The best split makes the groups as homogeneous as possible If elevation > 92 then home in San Francisco Entropy 31
32 Assume classes are and Entropy measures the impurity of the dataset Entropy p log 2 p p log 2 p 32
33 Gain(S,F) = expected reduction in entropy due to sorting on feature F Gain( S, F) Entropy( S) v Values( F ) S S v Entropy( S v ) 33
34 Even the best split does not fully separate the classes 34
35 Solution? Add another split point Repeat process on subsets of data Recursion 35
36 Consider distribution for each subset 36
37 Consider distribution for each subset 37
38 Best split varies for each subset Lower elevation homes Best split variable is price per square foot ($1061) Higher elevation homes Best split variable is price of home ($514,500) 38
39 Additional forks add new rule details This can increase the tree s accuracy 39
40 40
41 41
42 42
43 43
44 44
45 45

46 Overfit Noise Not enough features 46
47 47
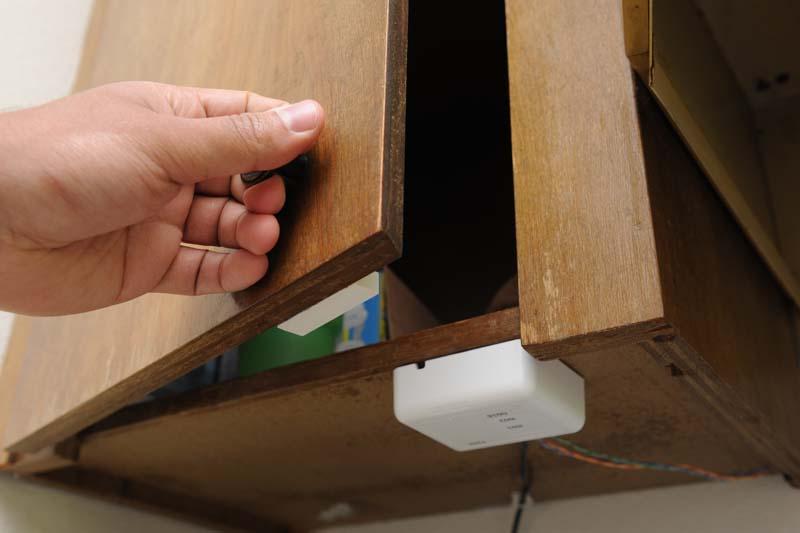
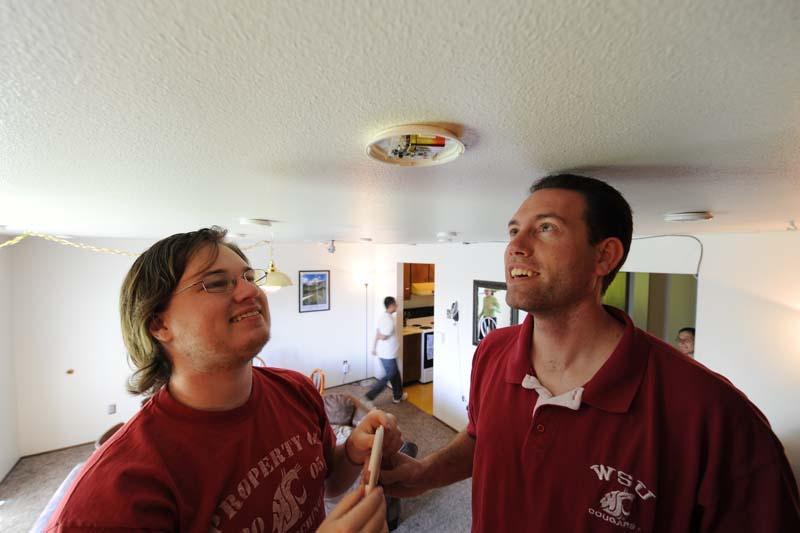
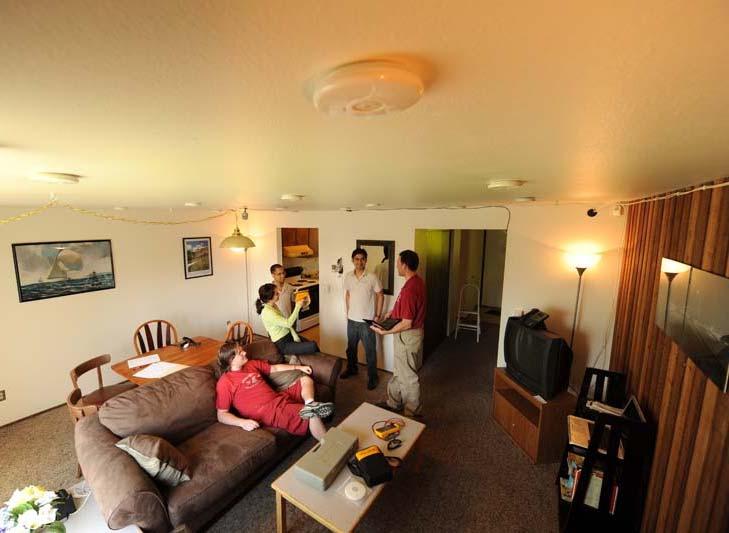
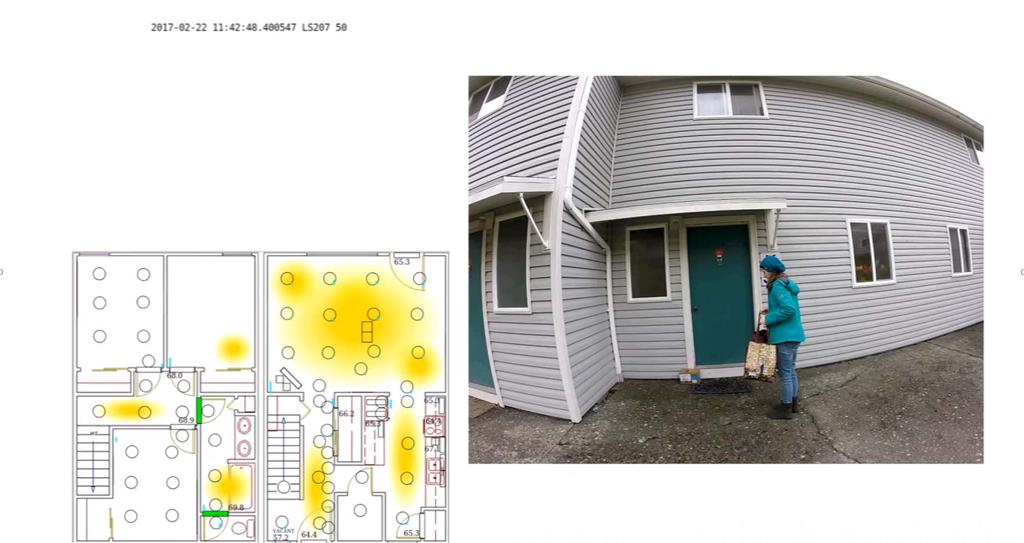
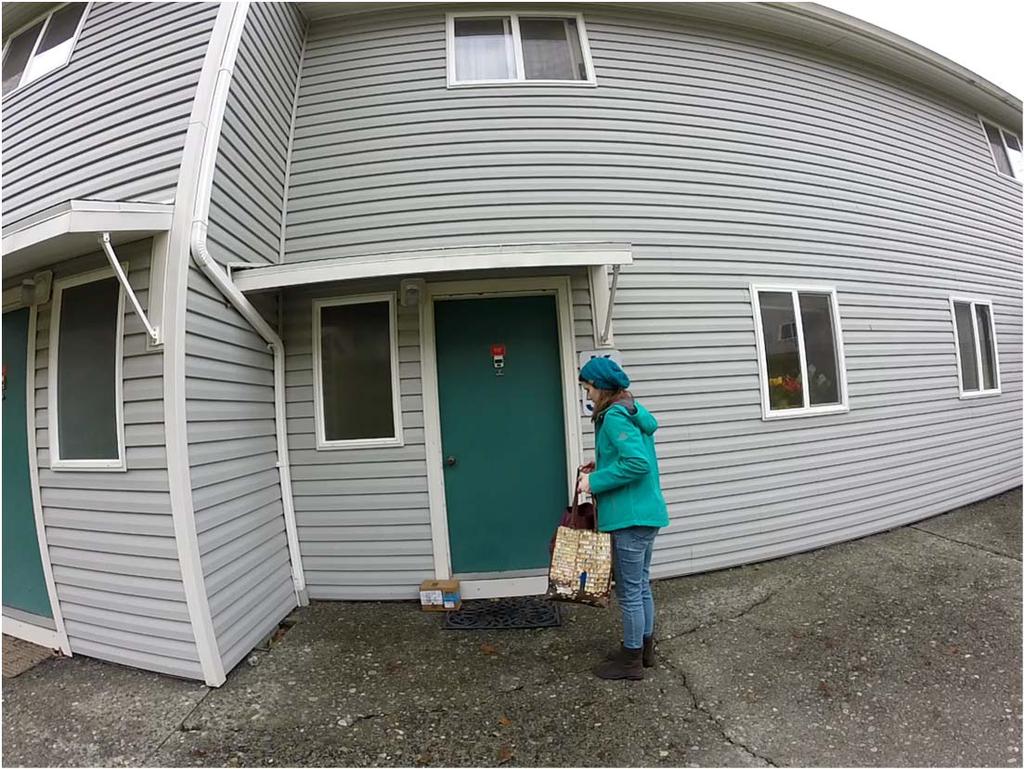
48 Activity recognition 48

49 Understand behavior Correlate with parameters of interest Design activity aware services

50
51
52
53 :42:50.57 FrontDoor :42:51.15 Entry :42:51.57 Hall :42:51.99 Entry :42:53.01 Entry :42:54.82 FrontDoor :42:55.74 Entry :42:56.95 Entry :42:57.18 Entry :42:58.15 Hall :42:59.78 Hall :43:00.22 Kitchen :43:08.21 Kitchen :43:09.47 Kitchen :43:11.02 Kitchen :43:13.84 Kitchen :43:14.91 Kitchen :43:19.27 Kitchen :43:21.71 Kitchen :43:26.15 Kitchen :43:27.44 KitchenCabinet :43:36.90 Kitchen :43:38.03 Kitchen :43:43.40 Kitchen :43:44.67 KitchenCabinet :43:49.21 Kitchen :43:50.95 Kitchen :43:53.96 Kitchen :43:56.01 Kitchen :43:56.64 LivingRoom?
54 More information context than appears on each line :42:50.57 FrontDoor :42:51.15 Entry :42:51.57 Hall :42:51.99 Entry :42:53.01 Entry :42:54.82 FrontDoor :42:55.74 Entry :42:56.95 Entry :42:57.18 Entry :42:58.15 Hall :42:59.78 Hall :43:00.22 Kitchen :43:08.21 Kitchen :43:09.47 Kitchen :43:11.02 Kitchen :43:13.84 Kitchen :43:14.91 Kitchen :43:19.27 Kitchen :43:21.71 Kitchen :43:26.15 Kitchen :43:27.44 KitchenCabinet :43:36.90 Kitchen :43:38.03 Kitchen :43:43.40 Kitchen :43:44.67 KitchenCabinet :43:49.21 Kitchen :43:50.95 Kitchen :43:53.96 Kitchen :43:56.01 Kitchen :43:56.64 LivingRoom
55 Define a context window Data segmented into individual activities Sliding window Based on #sensor events Based on amount of time Overlapping or nonoverlapping :42:50.57 FrontDoor :42:51.15 Entry :42:51.57 Hall :42:51.99 Entry :42:53.01 Entry :42:54.82 FrontDoor :42:55.74 Entry :42:56.95 Entry :42:57.18 Entry :42:58.15 Hall :42:59.78 Hall :43:00.22 Kitchen :43:08.21 Kitchen :43:09.47 Kitchen :43:11.02 Kitchen :43:13.84 Kitchen :43:14.91 Kitchen :43:19.27 Kitchen :43:21.71 Kitchen :43:26.15 Kitchen :43:27.44 KitchenCabinet :43:36.90 Kitchen :43:38.03 Kitchen :43:43.40 Kitchen :43:44.67 KitchenCabinet :43:49.21 Kitchen :43:50.95 Kitchen :43:53.96 Kitchen :43:56.01 Kitchen :43:56.64 LivingRoom
56 Define a context window Data segmented into individual activities Sliding window Based on #sensor events Based on amount of time Overlapping or nonoverlapping :42:50.57 FrontDoor :42:51.15 Entry :42:51.57 Hall :42:51.99 Entry :42:53.01 Entry :42:54.82 FrontDoor :42:55.74 Entry :42:56.95 Entry :42:57.18 Entry :42:58.15 Hall :42:59.78 Hall :43:00.22 Kitchen :43:08.21 Kitchen :43:09.47 Kitchen :43:11.02 Kitchen :43:13.84 Kitchen :43:14.91 Kitchen :43:19.27 Kitchen :43:21.71 Kitchen :43:26.15 Kitchen :43:27.44 KitchenCabinet :43:36.90 Kitchen :43:38.03 Kitchen :43:43.40 Kitchen :43:44.67 KitchenCabinet :43:49.21 Kitchen :43:50.95 Kitchen :43:53.96 Kitchen :43:56.01 Kitchen :43:56.64 LivingRoom
57 Define a context window Data segmented into individual activities Sliding window Based on #sensor events Based on amount of time Overlapping or nonoverlapping :42:50.57 FrontDoor :42:51.15 Entry :42:51.57 Hall :42:51.99 Entry :42:53.01 Entry :42:54.82 FrontDoor :42:55.74 Entry :42:56.95 Entry :42:57.18 Entry :42:58.15 Hall :42:59.78 Hall :43:00.22 Kitchen :43:08.21 Kitchen :43:09.47 Kitchen :43:11.02 Kitchen :43:13.84 Kitchen :43:14.91 Kitchen :43:19.27 Kitchen :43:21.71 Kitchen :43:26.15 Kitchen :43:27.44 KitchenCabinet :43:36.90 Kitchen :43:38.03 Kitchen :43:43.40 Kitchen :43:44.67 KitchenCabinet :43:49.21 Kitchen :43:50.95 Kitchen :43:53.96 Kitchen :43:56.01 Kitchen :43:56.64 LivingRoom
58 Define a context window Data segmented into individual activities Sliding window Based on #sensor events Based on amount of time Overlapping or nonoverlapping :42:50.57 FrontDoor :42:51.15 Entry :42:51.57 Hall :42:51.99 Entry :42:53.01 Entry :42:54.82 FrontDoor :42:55.74 Entry :42:56.95 Entry :42:57.18 Entry :42:58.15 Hall :42:59.78 Hall :43:00.22 Kitchen :43:08.21 Kitchen :43:09.47 Kitchen :43:11.02 Kitchen :43:13.84 Kitchen :43:14.91 Kitchen :43:19.27 Kitchen :43:21.71 Kitchen :43:26.15 Kitchen :43:27.44 KitchenCabinet :43:36.90 Kitchen :43:38.03 Kitchen :43:43.40 Kitchen :43:44.67 KitchenCabinet :43:49.21 Kitchen :43:50.95 Kitchen :43:53.96 Kitchen :43:56.01 Kitchen :43:56.64 LivingRoom
59 Define a context window Data segmented into individual activities Sliding window Based on #sensor events Based on amount of time Overlapping or nonoverlapping :42:50.57 FrontDoor :42:51.15 Entry :42:51.57 Hall :42:51.99 Entry :42:53.01 Entry :42:54.82 FrontDoor :42:55.74 Entry :42:56.95 Entry :42:57.18 Entry :42:58.15 Hall :42:59.78 Hall :43:00.22 Kitchen :43:08.21 Kitchen :43:09.47 Kitchen :43:11.02 Kitchen :43:13.84 Kitchen :43:14.91 Kitchen :43:19.27 Kitchen :43:21.71 Kitchen :43:26.15 Kitchen :43:27.44 KitchenCabinet :43:36.90 Kitchen :43:38.03 Kitchen :43:43.40 Kitchen :43:44.67 KitchenCabinet :43:49.21 Kitchen :43:50.95 Kitchen :43:53.96 Kitchen :43:56.01 Kitchen :43:56.64 LivingRoom
60 Define a context window Data segmented into individual activities Sliding window Based on #sensor events Based on amount of time Overlapping or nonoverlapping :42:50.57 FrontDoor :42:51.15 Entry :42:51.57 Hall :42:51.99 Entry :42:53.01 Entry :42:54.82 FrontDoor :42:55.74 Entry :42:56.95 Entry :42:57.18 Entry :42:58.15 Hall :42:59.78 Hall :43:00.22 Kitchen :43:08.21 Kitchen :43:09.47 Kitchen :43:11.02 Kitchen :43:13.84 Kitchen :43:14.91 Kitchen :43:19.27 Kitchen :43:21.71 Kitchen :43:26.15 Kitchen :43:27.44 KitchenCabinet :43:36.90 Kitchen :43:38.03 Kitchen :43:43.40 Kitchen :43:44.67 KitchenCabinet :43:49.21 Kitchen :43:50.95 Kitchen :43:53.96 Kitchen :43:56.01 Kitchen :43:56.64 LivingRoom
61 Define a context window Data segmented into individual activities Sliding window Based on #sensor events Based on amount of time Overlapping or nonoverlapping :42:50.57 FrontDoor :42:51.15 Entry :42:51.57 Hall :42:51.99 Entry :42:53.01 Entry :42:54.82 FrontDoor :42:55.74 Entry :42:56.95 Entry :42:57.18 Entry :42:58.15 Hall :42:59.78 Hall :43:00.22 Kitchen :43:08.21 Kitchen :43:09.47 Kitchen :43:11.02 Kitchen :43:13.84 Kitchen :43:14.91 Kitchen :43:19.27 Kitchen :43:21.71 Kitchen :43:26.15 Kitchen :43:27.44 KitchenCabinet :43:36.90 Kitchen :43:38.03 Kitchen :43:43.40 Kitchen :43:44.67 KitchenCabinet :43:49.21 Kitchen :43:50.95 Kitchen :43:53.96 Kitchen :43:56.01 Kitchen :43:56.64 LivingRoom
62 :42:50.57 FrontDoor :42:51.15 Entry :42:51.57 Hall :42:51.99 Entry :42:53.01 Entry :42:54.82 FrontDoor :42:55.74 Entry :42:56.95 Entry :42:57.18 Entry :42:58.15 Hall :42:59.78 Hall :43:00.22 Kitchen :43:08.21 Kitchen :43:09.47 Kitchen :43:11.02 Kitchen :43:13.84 Kitchen :43:14.91 Kitchen :43:19.27 Kitchen :43:21.71 Kitchen :43:26.15 Kitchen :43:27.44 KitchenCabinet :43:36.90 Kitchen :43:38.03 Kitchen :43:43.40 Kitchen :43:44.67 KitchenCabinet :43:49.21 Kitchen :43:50.95 Kitchen :43:53.96 Kitchen :43:56.01 Kitchen :43:56.64 LivingRoom
63 Window duration Date (days since 01 01) Day of week Time of day (hours, minutes, seconds past midnight) :42:50.57 FrontDoor :42:51.15 Entry :42:51.57 Hall :42:51.99 Entry :42:53.01 Entry :42:54.82 FrontDoor :42:55.74 Entry :42:56.95 Entry :42:57.18 Entry :42:58.15 Hall :42:59.78 Hall :43:00.22 Kitchen :43:08.21 Kitchen :43:09.47 Kitchen :43:11.02 Kitchen :43:13.84 Kitchen :43:14.91 Kitchen :43:19.27 Kitchen :43:21.71 Kitchen :43:26.15 Kitchen :43:27.44 KitchenCabinet :43:36.90 Kitchen :43:38.03 Kitchen :43:43.40 Kitchen :43:44.67 KitchenCabinet :43:49.21 Kitchen :43:50.95 Kitchen :43:53.96 Kitchen :43:56.01 Kitchen :43:56.64 LivingRoom
64 Window duration Date (days since 01 01) Day of week Time of day (hours, minutes, seconds past midnight) :42:50.57 FrontDoor :42:51.15 Entry :42:51.57 Hall :42:51.99 Entry :42:53.01 Entry :42:54.82 FrontDoor :42:55.74 Entry :42:56.95 Entry :42:57.18 Entry :42:58.15 Hall :42:59.78 Hall :43:00.22 Kitchen :43:08.21 Kitchen :43:09.47 Kitchen :43:11.02 Kitchen :43:13.84 Kitchen :43:14.91 Kitchen :43:19.27 Kitchen :43:21.71 Kitchen :43:26.15 Kitchen :43:27.44 KitchenCabinet :43:36.90 Kitchen :43:38.03 Kitchen :43:43.40 Kitchen :43:44.67 KitchenCabinet :43:49.21 Kitchen :43:50.95 Kitchen :43:53.96 Kitchen :43:56.01 Kitchen :43:56.64 LivingRoom
65 Window duration Date (days since 01 01) Day of week Time of day (hours, minutes, seconds past midnight) , , , :42:50.57 FrontDoor :42:51.15 Entry :42:51.57 Hall :42:51.99 Entry :42:53.01 Entry :42:54.82 FrontDoor :42:55.74 Entry :42:56.95 Entry :42:57.18 Entry :42:58.15 Hall :42:59.78 Hall :43:00.22 Kitchen :43:08.21 Kitchen :43:09.47 Kitchen :43:11.02 Kitchen :43:13.84 Kitchen :43:14.91 Kitchen :43:19.27 Kitchen :43:21.71 Kitchen :43:26.15 Kitchen :43:27.44 KitchenCabinet :43:36.90 Kitchen :43:38.03 Kitchen :43:43.40 Kitchen :43:44.67 KitchenCabinet :43:49.21 Kitchen :43:50.95 Kitchen :43:53.96 Kitchen :43:56.01 Kitchen :43:56.64 LivingRoom
66 :42:50.57 FrontDoor :42:51.15 Entry :42:51.57 Hall :42:51.99 Entry :42:53.01 Entry :42:54.82 FrontDoor :42:55.74 Entry :42:56.95 Entry :42:57.18 Entry :42:58.15 Hall :42:59.78 Hall :43:00.22 Kitchen :43:08.21 Kitchen :43:09.47 Kitchen :43:11.02 Kitchen :43:13.84 Kitchen :43:14.91 Kitchen :43:19.27 Kitchen :43:21.71 Kitchen :43:26.15 Kitchen :43:27.44 KitchenCabinet :43:36.90 Kitchen :43:38.03 Kitchen :43:43.40 Kitchen :43:44.67 KitchenCabinet :43:49.21 Kitchen :43:50.95 Kitchen :43:53.96 Kitchen :43:56.01 Kitchen :43:56.64 LivingRoom
67 Sensor counts (FrontDoor, Entry, Hall, Kitchen, KitchenCabinet, LivingRoom, Bathroom, Bedroom) Sensor elapsed times (FrontDoor, Entry, Hall, Kitchen, KitchenCabinet, LivingRoom, Bathroom, Bedroom) 2,6,2,0,0,0,0,0 0,0,1,9,0,0,0,0 0,0,0,7,2,1,0, :42:50.57 FrontDoor :42:51.15 Entry :42:51.57 Hall :42:51.99 Entry :42:53.01 Entry :42:54.82 FrontDoor :42:55.74 Entry :42:56.95 Entry :42:57.18 Entry :42:58.15 Hall :42:59.78 Hall :43:00.22 Kitchen :43:08.21 Kitchen :43:09.47 Kitchen :43:11.02 Kitchen :43:13.84 Kitchen :43:14.91 Kitchen :43:19.27 Kitchen :43:21.71 Kitchen :43:26.15 Kitchen :43:27.44 KitchenCabinet :43:36.90 Kitchen :43:38.03 Kitchen :43:43.40 Kitchen :43:44.67 KitchenCabinet :43:49.21 Kitchen :43:50.95 Kitchen :43:53.96 Kitchen :43:56.01 Kitchen :43:56.64 LivingRoom
68 Sensor counts 4,1,0,362, 1801,363,372,422 (FrontDoor, Entry, Hall, Kitchen, KitchenCabinet, LivingRoom, Bathroom, Bedroom) Sensor elapsed times (FrontDoor, Entry, Hall, Kitchen, KitchenCabinet, LivingRoom, Bathroom, Bedroom) 32,29,27,0, 1829,391,400,450 62,59,57,0, 12,0,430, :42:50.57 FrontDoor :42:51.15 Entry :42:51.57 Hall :42:51.99 Entry :42:53.01 Entry :42:54.82 FrontDoor :42:55.74 Entry :42:56.95 Entry :42:57.18 Entry :42:58.15 Hall :42:59.78 Hall :43:00.22 Kitchen :43:08.21 Kitchen :43:09.47 Kitchen :43:11.02 Kitchen :43:13.84 Kitchen :43:14.91 Kitchen :43:19.27 Kitchen :43:21.71 Kitchen :43:26.15 Kitchen :43:27.44 KitchenCabinet :43:36.90 Kitchen :43:38.03 Kitchen :43:43.40 Kitchen :43:44.67 KitchenCabinet :43:49.21 Kitchen :43:50.95 Kitchen :43:53.96 Kitchen :43:56.01 Kitchen :43:56.64 LivingRoom
69 Activity labels in previous windows Change in activity level Complexity Statistical features for numeric values :42:50.57 FrontDoor :42:51.15 Entry :42:51.57 Hall :42:51.99 Entry :42:53.01 Entry :42:54.82 FrontDoor :42:55.74 Entry :42:56.95 Entry :42:57.18 Entry :42:58.15 Hall :42:59.78 Hall :43:00.22 Kitchen :43:08.21 Kitchen :43:09.47 Kitchen :43:11.02 Kitchen :43:13.84 Kitchen :43:14.91 Kitchen :43:19.27 Kitchen :43:21.71 Kitchen :43:26.15 Kitchen :43:27.44 KitchenCabinet :43:36.90 Kitchen :43:38.03 Kitchen :43:43.40 Kitchen :43:44.67 KitchenCabinet :43:49.21 Kitchen :43:50.95 Kitchen :43:53.96 Kitchen :43:56.01 Kitchen :43:56.64 LivingRoom
70 8, 53, 4, 11, 702, 42178, 2, 6, 2, 0, 0, 0, 0, 0, 4, 1, 0, 362, 1801, 363, 372, 422, 5, 4, 0.5, 1.72, :42:50.57 FrontDoor :42:51.15 Entry :42:51.57 Hall :42:51.99 Entry :42:53.01 Entry :42:54.82 FrontDoor :42:55.74 Entry :42:56.95 Entry :42:57.18 Entry :42:58.15 Hall :42:59.78 Hall :43:00.22 Kitchen :43:08.21 Kitchen :43:09.47 Kitchen :43:11.02 Kitchen :43:13.84 Kitchen :43:14.91 Kitchen :43:19.27 Kitchen :43:21.71 Kitchen :43:26.15 Kitchen :43:27.44 KitchenCabinet :43:36.90 Kitchen :43:38.03 Kitchen :43:43.40 Kitchen :43:44.67 KitchenCabinet :43:49.21 Kitchen :43:50.95 Kitchen :43:53.96 Kitchen :43:56.01 Kitchen :43:56.64 LivingRoom
71 v = <8, 53, 4, 11, 702, 42178, 2, 6, 2, 0, 0, 0, 0, 0, 4, 1, 0, 362, 1801, 363, 372, 422, 5, 4, 0.5, 1.72> Activity recognition maps the feature vector, v, onto an activity from a set A of possible activity classes AR: v A :42:50.57 FrontDoor :42:51.15 Entry :42:51.57 Hall :42:51.99 Entry :42:53.01 Entry :42:54.82 FrontDoor :42:55.74 Entry :42:56.95 Entry :42:57.18 Entry :42:58.15 Hall :42:59.78 Hall :43:00.22 Kitchen :43:08.21 Kitchen :43:09.47 Kitchen :43:11.02 Kitchen :43:13.84 Kitchen :43:14.91 Kitchen :43:19.27 Kitchen :43:21.71 Kitchen :43:26.15 Kitchen :43:27.44 KitchenCabinet :43:36.90 Kitchen :43:38.03 Kitchen :43:43.40 Kitchen :43:44.67 KitchenCabinet :43:49.21 Kitchen :43:50.95 Kitchen :43:53.96 Kitchen :43:56.01 Kitchen :43:56.64 LivingRoom
72 v = <8, 53, 4, 11, 702, 42178, 2, 6, 2, 0, 0, 0, 0, 0, 4, 1, 0, 362, 1801, 363, 372, 422, 5, 4, 0.5, 1.72> AR: v A A = {Enter Home, Leave Home, Sleep, Bed/Toilet Transition, Relax, Work, Cook, Eat, Wash Dishes, Housekeeping, Laundry, Put Away Groceries,, Other} :42:50.57 FrontDoor :42:51.15 Entry :42:51.57 Hall :42:51.99 Entry :42:53.01 Entry :42:54.82 FrontDoor :42:55.74 Entry :42:56.95 Entry :42:57.18 Entry :42:58.15 Hall :42:59.78 Hall :43:00.22 Kitchen :43:08.21 Kitchen :43:09.47 Kitchen :43:11.02 Kitchen :43:13.84 Kitchen :43:14.91 Kitchen :43:19.27 Kitchen :43:21.71 Kitchen :43:26.15 Kitchen :43:27.44 KitchenCabinet :43:36.90 Kitchen :43:38.03 Kitchen :43:43.40 Kitchen :43:44.67 KitchenCabinet :43:49.21 Kitchen :43:50.95 Kitchen :43:53.96 Kitchen :43:56.01 Kitchen :43:56.64 LivingRoom
73 v1 = <8, 53, 4, 11, 702, 42178, 2, 6, 2, 0, 0, 0, 0, 0, 4, 1, 0, 362, 1801, 363, 372, 422, 5, 4, 0.5, 1.72> AR: v1 Enter Home :42:50.57 FrontDoor :42:51.15 Entry :42:51.57 Hall :42:51.99 Entry :42:53.01 Entry :42:54.82 FrontDoor :42:55.74 Entry :42:56.95 Entry :42:57.18 Entry :42:58.15 Hall :42:59.78 Hall :43:00.22 Kitchen :43:08.21 Kitchen :43:09.47 Kitchen :43:11.02 Kitchen :43:13.84 Kitchen :43:14.91 Kitchen :43:19.27 Kitchen :43:21.71 Kitchen :43:26.15 Kitchen :43:27.44 KitchenCabinet :43:36.90 Kitchen :43:38.03 Kitchen :43:43.40 Kitchen :43:44.67 KitchenCabinet :43:49.21 Kitchen :43:50.95 Kitchen :43:53.96 Kitchen :43:56.01 Kitchen :43:56.64 LivingRoom
74 v2 = <27, 53, 4, 11, 703, 42206, 0, 0, 1, 9, 0, 0, 0, 0, 32, 29, 27, 0, 1829, 391, 400, 425, 5, 4, 0.6, 1.62> AR: v2 Put Away Groceries :42:50.57 FrontDoor :42:51.15 Entry :42:51.57 Hall :42:51.99 Entry :42:53.01 Entry :42:54.82 FrontDoor :42:55.74 Entry :42:56.95 Entry :42:57.18 Entry :42:58.15 Hall :42:59.78 Hall :43:00.22 Kitchen :43:08.21 Kitchen :43:09.47 Kitchen :43:11.02 Kitchen :43:13.84 Kitchen :43:14.91 Kitchen :43:19.27 Kitchen :43:21.71 Kitchen :43:26.15 Kitchen :43:27.44 KitchenCabinet :43:36.90 Kitchen :43:38.03 Kitchen :43:43.40 Kitchen :43:44.67 KitchenCabinet :43:49.21 Kitchen :43:50.95 Kitchen :43:53.96 Kitchen :43:56.01 Kitchen :43:56.64 LivingRoom
75 v3 = <29, 53, 4, 11, 703, 42236, 0, 0, 0, 7, 2, 0, 0, 0, 62, 59, 57, 0, 12, 0, 430, 480, 425, 5, 2, 0.2, 1.51> AR: v3? :42:50.57 FrontDoor :42:51.15 Entry :42:51.57 Hall :42:51.99 Entry :42:53.01 Entry :42:54.82 FrontDoor :42:55.74 Entry :42:56.95 Entry :42:57.18 Entry :42:58.15 Hall :42:59.78 Hall :43:00.22 Kitchen :43:08.21 Kitchen :43:09.47 Kitchen :43:11.02 Kitchen :43:13.84 Kitchen :43:14.91 Kitchen :43:19.27 Kitchen :43:21.71 Kitchen :43:26.15 Kitchen :43:27.44 KitchenCabinet :43:36.90 Kitchen :43:38.03 Kitchen :43:43.40 Kitchen :43:44.67 KitchenCabinet :43:49.21 Kitchen :43:50.95 Kitchen :43:53.96 Kitchen :43:56.01 Kitchen :43:56.64 LivingRoom

76 76
77 True class Predicted class Positive Negative Total Positive TP: true positive FN: false negative P Negative FP: false positive TN: true negative N Total P N M Naïve Bayes True class Predicted class Sleep Eat Total Sleep Eat Total
78 Metric Formula Naïve Bayes Example Accuracy Error Precision Recall, TP Rate F measure
 measure of performance AR: AUC = 1.0 TP rate 1.0 0.")
79 Classify using P(class x) > as varies from 0.0 to 1.0 Plot FP rate and TPrate for each Area under curve (AUC) measure of performance AR: AUC = 1.0 TP rate FP rate Classifier Random
80 What data should to train and test?


81 But what about mobile data?
82 Sensor Data :57:08 Yaw :57:08 Pitch :57:08 Roll :57:08 AccelerationX :57:08 AccelerationY :57:08 AccelerationZ :57:08 Latitude :57:08 Longitude :57:08 Altitude :57:08 Course :57:08 Speed :57:09 Yaw :57:09 Pitch :57:09 Roll :57:09 AccelerationX :57:09 AccelerationY :57:09 AccelerationZ :57:09 Latitude :57:09 Longitude :57:09 Altitude :57:09 Course :57:09 Speed :57:10 Yaw :57:10 Pitch :57:10 Roll :57:10 AccelerationX :57:10 AccelerationY :57:10 AccelerationZ :57:10 Latitude :57:10 Longitude :57:10 Altitude :57:10 Course :57:10 Speed :57:11 Yaw :57:11 Pitch :57:11 Roll :57:11 AccelerationX :57:11 AccelerationY :57:11 AccelerationZ :57:11 Latitude :57:11 Longitude :57:11 Altitude :57:11 Course :57:11 Speed :57:12 Yaw :57:12 Pitch :57:12 Roll :57:12 AccelerationX :57:12 AccelerationY :57:12 AccelerationZ :57:12 Latitude :57:12 Longitude :57:12 Altitude :57:12 Course :57:12 Speed
83 Sensor Data :57:08 Yaw :57:08 Pitch :57:08 Roll :57:08 AccelerationX :57:08 AccelerationY :57:08 AccelerationZ :57:08 Latitude :57:08 Longitude :57:08 Altitude :57:08 Course :57:08 Speed :57:09 Yaw :57:09 Pitch :57:09 Roll :57:09 AccelerationX :57:09 AccelerationY :57:09 AccelerationZ :57:09 Latitude :57:09 Longitude :57:09 Altitude :57:09 Course :57:09 Speed :57:10 Yaw :57:10 Pitch :57:10 Roll :57:10 AccelerationX :57:10 AccelerationY :57:10 AccelerationZ :57:10 Latitude :57:10 Longitude :57:10 Altitude :57:10 Course :57:10 Speed :57:11 Yaw :57:11 Pitch :57:11 Roll :57:11 AccelerationX :57:11 AccelerationY :57:11 AccelerationZ :57:11 Latitude :57:11 Longitude :57:11 Altitude :57:11 Course :57:11 Speed :57:12 Yaw :57:12 Pitch :57:12 Roll :57:12 AccelerationX :57:12 AccelerationY :57:12 AccelerationZ :57:12 Latitude :57:12 Longitude :57:12 Altitude :57:12 Course :57:12 Speed
84 Sensor Data :57:08 Yaw :57:08 Pitch :57:08 Roll :57:08 AccelerationX :57:08 AccelerationY :57:08 AccelerationZ :57:08 Latitude :57:08 Longitude :57:08 Altitude :57:08 Course :57:08 Speed :57:09 Yaw :57:09 Pitch :57:09 Roll :57:09 AccelerationX :57:09 AccelerationY :57:09 AccelerationZ :57:09 Latitude :57:09 Longitude :57:09 Altitude :57:09 Course :57:09 Speed :57:10 Yaw :57:10 Pitch :57:10 Roll :57:10 AccelerationX :57:10 AccelerationY :57:10 AccelerationZ :57:10 Latitude :57:10 Longitude :57:10 Altitude :57:10 Course :57:10 Speed :57:11 Yaw :57:11 Pitch :57:11 Roll :57:11 AccelerationX :57:11 AccelerationY :57:11 AccelerationZ :57:11 Latitude :57:11 Longitude :57:11 Altitude :57:11 Course :57:11 Speed :57:12 Yaw :57:12 Pitch :57:12 Roll :57:12 AccelerationX :57:12 AccelerationY :57:12 AccelerationZ :57:12 Latitude :57:12 Longitude :57:12 Altitude :57:12 Course :57:12 Speed
85 Sensor Data :57:08 Yaw :57:08 Pitch :57:08 Roll :57:08 AccelerationX :57:08 AccelerationY :57:08 AccelerationZ :57:08 Latitude :57:08 Longitude :57:08 Altitude :57:08 Course :57:08 Speed :57:09 Yaw :57:09 Pitch :57:09 Roll :57:09 AccelerationX :57:09 AccelerationY :57:09 AccelerationZ :57:09 Latitude :57:09 Longitude :57:09 Altitude :57:09 Course :57:09 Speed :57:10 Yaw :57:10 Pitch :57:10 Roll :57:10 AccelerationX :57:10 AccelerationY :57:10 AccelerationZ :57:10 Latitude :57:10 Longitude :57:10 Altitude :57:10 Course :57:10 Speed :57:11 Yaw :57:11 Pitch :57:11 Roll :57:11 AccelerationX :57:11 AccelerationY :57:11 AccelerationZ :57:11 Latitude :57:11 Longitude :57:11 Altitude :57:11 Course :57:11 Speed :57:12 Yaw :57:12 Pitch :57:12 Roll :57:12 AccelerationX :57:12 AccelerationY :57:12 AccelerationZ :57:12 Latitude :57:12 Longitude :57:12 Altitude :57:12 Course :57:12 Speed
86 Sensor Data :57:08 Yaw :57:08 Pitch :57:08 Roll :57:08 AccelerationX :57:08 AccelerationY :57:08 AccelerationZ :57:08 Latitude :57:08 Longitude :57:08 Altitude :57:08 Course :57:08 Speed :57:09 Yaw :57:09 Pitch :57:09 Roll :57:09 AccelerationX :57:09 AccelerationY :57:09 AccelerationZ :57:09 Latitude :57:09 Longitude :57:09 Altitude :57:09 Course :57:09 Speed :57:10 Yaw :57:10 Pitch :57:10 Roll :57:10 AccelerationX :57:10 AccelerationY :57:10 AccelerationZ :57:10 Latitude :57:10 Longitude :57:10 Altitude :57:10 Course :57:10 Speed :57:11 Yaw :57:11 Pitch :57:11 Roll :57:11 AccelerationX :57:11 AccelerationY :57:11 AccelerationZ :57:11 Latitude :57:11 Longitude :57:11 Altitude :57:11 Course :57:11 Speed :57:12 Yaw :57:12 Pitch :57:12 Roll :57:12 AccelerationX :57:12 AccelerationY :57:12 AccelerationZ :57:12 Latitude :57:12 Longitude :57:12 Altitude :57:12 Course :57:12 Speed
87 Sensor Data :57:08 Yaw :57:08 Pitch :57:08 Roll :57:08 AccelerationX :57:08 AccelerationY :57:08 AccelerationZ :57:08 Latitude :57:08 Longitude :57:08 Altitude :57:08 Course :57:08 Speed :57:09 Yaw :57:09 Pitch :57:09 Roll :57:09 AccelerationX :57:09 AccelerationY :57:09 AccelerationZ :57:09 Latitude :57:09 Longitude :57:09 Altitude :57:09 Course :57:09 Speed :57:10 Yaw :57:10 Pitch :57:10 Roll :57:10 AccelerationX :57:10 AccelerationY :57:10 AccelerationZ :57:10 Latitude :57:10 Longitude :57:10 Altitude :57:10 Course :57:10 Speed :57:11 Yaw :57:11 Pitch :57:11 Roll :57:11 AccelerationX :57:11 AccelerationY :57:11 AccelerationZ :57:11 Latitude :57:11 Longitude :57:11 Altitude :57:11 Course :57:11 Speed :57:12 Yaw :57:12 Pitch :57:12 Roll :57:12 AccelerationX :57:12 AccelerationY :57:12 AccelerationZ :57:12 Latitude :57:12 Longitude :57:12 Altitude :57:12 Course :57:12 Speed
88 Sensor Data :57:08 Yaw :57:08 Pitch :57:08 Roll :57:08 AccelerationX :57:08 AccelerationY :57:08 AccelerationZ :57:08 Latitude :57:08 Longitude :57:08 Altitude :57:08 Course :57:08 Speed :57:09 Yaw :57:09 Pitch :57:09 Roll :57:09 AccelerationX :57:09 AccelerationY :57:09 AccelerationZ :57:09 Latitude :57:09 Longitude :57:09 Altitude :57:09 Course :57:09 Speed :57:10 Yaw :57:10 Pitch :57:10 Roll :57:10 AccelerationX :57:10 AccelerationY :57:10 AccelerationZ :57:10 Latitude :57:10 Longitude :57:10 Altitude :57:10 Course :57:10 Speed :57:11 Yaw :57:11 Pitch :57:11 Roll :57:11 AccelerationX :57:11 AccelerationY :57:11 AccelerationZ :57:11 Latitude :57:11 Longitude :57:11 Altitude :57:11 Course :57:11 Speed :57:12 Yaw :57:12 Pitch :57:12 Roll :57:12 AccelerationX :57:12 AccelerationY :57:12 AccelerationZ :57:12 Latitude :57:12 Longitude :57:12 Altitude :57:12 Course :57:12 Speed [Wikimedia]
89 Sensor Data :57:08 Yaw :57:08 Pitch :57:08 Roll :57:08 AccelerationX :57:08 AccelerationY :57:08 AccelerationZ :57:08 Latitude :57:08 Longitude :57:08 Altitude :57:08 Course :57:08 Speed :57:09 Yaw :57:09 Pitch :57:09 Roll :57:09 AccelerationX :57:09 AccelerationY :57:09 AccelerationZ :57:09 Latitude :57:09 Longitude :57:09 Altitude :57:09 Course :57:09 Speed :57:10 Yaw :57:10 Pitch :57:10 Roll :57:10 AccelerationX :57:10 AccelerationY :57:10 AccelerationZ :57:10 Latitude :57:10 Longitude :57:10 Altitude :57:10 Course :57:10 Speed :57:11 Yaw :57:11 Pitch :57:11 Roll :57:11 AccelerationX :57:11 AccelerationY :57:11 AccelerationZ :57:11 Latitude :57:11 Longitude :57:11 Altitude :57:11 Course :57:11 Speed :57:12 Yaw :57:12 Pitch :57:12 Roll :57:12 AccelerationX :57:12 AccelerationY :57:12 AccelerationZ :57:12 Latitude :57:12 Longitude :57:12 Altitude :57:12 Course :57:12 Speed [Wikimedia]

90 Sensor Data :57:08 Yaw :57:08 Pitch :57:08 Roll :57:08 AccelerationX :57:08 AccelerationY :57:08 AccelerationZ :57:08 Latitude :57:08 Longitude :57:08 Altitude :57:08 Course :57:08 Speed :57:09 Yaw :57:09 Pitch :57:09 Roll :57:09 AccelerationX :57:09 AccelerationY :57:09 AccelerationZ :57:09 Latitude :57:09 Longitude :57:09 Altitude :57:09 Course :57:09 Speed :57:10 Yaw :57:10 Pitch :57:10 Roll :57:10 AccelerationX :57:10 AccelerationY :57:10 AccelerationZ :57:10 Latitude :57:10 Longitude :57:10 Altitude :57:10 Course :57:10 Speed :57:11 Yaw :57:11 Pitch :57:11 Roll :57:11 AccelerationX :57:11 AccelerationY :57:11 AccelerationZ :57:11 Latitude :57:11 Longitude :57:11 Altitude :57:11 Course :57:11 Speed :57:12 Yaw :57:12 Pitch :57:12 Roll :57:12 AccelerationX :57:12 AccelerationY :57:12 AccelerationZ :57:12 Latitude :57:12 Longitude :57:12 Altitude :57:12 Course :57:12 Speed [Wikimedia]

91 Sensor Data :57:08 Yaw :57:08 Pitch :57:08 Roll :57:08 AccelerationX :57:08 AccelerationY :57:08 AccelerationZ :57:08 Latitude :57:08 Longitude :57:08 Altitude :57:08 Course :57:08 Speed :57:09 Yaw :57:09 Pitch :57:09 Roll :57:09 AccelerationX :57:09 AccelerationY :57:09 AccelerationZ :57:09 Latitude :57:09 Longitude :57:09 Altitude :57:09 Course :57:09 Speed :57:10 Yaw :57:10 Pitch :57:10 Roll :57:10 AccelerationX :57:10 AccelerationY :57:10 AccelerationZ :57:10 Latitude :57:10 Longitude :57:10 Altitude :57:10 Course :57:10 Speed :57:11 Yaw :57:11 Pitch :57:11 Roll :57:11 AccelerationX :57:11 AccelerationY :57:11 AccelerationZ :57:11 Latitude :57:11 Longitude :57:11 Altitude :57:11 Course :57:11 Speed :57:12 Yaw :57:12 Pitch :57:12 Roll :57:12 AccelerationX :57:12 AccelerationY :57:12 AccelerationZ :57:12 Latitude :57:12 Longitude :57:12 Altitude :57:12 Course :57:12 Speed

92 Sensor Data :57:08 Yaw :57:08 Pitch :57:08 Roll :57:08 AccelerationX :57:08 AccelerationY :57:08 AccelerationZ :57:08 Latitude :57:08 Longitude :57:08 Altitude :57:08 Course :57:08 Speed :57:09 Yaw :57:09 Pitch :57:09 Roll :57:09 AccelerationX :57:09 AccelerationY :57:09 AccelerationZ :57:09 Latitude :57:09 Longitude :57:09 Altitude :57:09 Course :57:09 Speed :57:10 Yaw :57:10 Pitch :57:10 Roll :57:10 AccelerationX :57:10 AccelerationY :57:10 AccelerationZ :57:10 Latitude :57:10 Longitude :57:10 Altitude :57:10 Course :57:10 Speed :57:11 Yaw :57:11 Pitch :57:11 Roll :57:11 AccelerationX :57:11 AccelerationY :57:11 AccelerationZ :57:11 Latitude :57:11 Longitude :57:11 Altitude :57:11 Course :57:11 Speed :57:12 Yaw :57:12 Pitch :57:12 Roll :57:12 AccelerationX :57:12 AccelerationY :57:12 AccelerationZ :57:12 Latitude :57:12 Longitude :57:12 Altitude :57:12 Course :57:12 Speed

93 Sensor Data :57:08 Yaw :57:08 Pitch :57:08 Roll :57:08 AccelerationX :57:08 AccelerationY :57:08 AccelerationZ :57:08 Latitude :57:08 Longitude :57:08 Altitude :57:08 Course :57:08 Speed :57:09 Yaw :57:09 Pitch :57:09 Roll :57:09 AccelerationX :57:09 AccelerationY :57:09 AccelerationZ :57:09 Latitude :57:09 Longitude :57:09 Altitude :57:09 Course :57:09 Speed :57:10 Yaw :57:10 Pitch :57:10 Roll :57:10 AccelerationX :57:10 AccelerationY :57:10 AccelerationZ :57:10 Latitude :57:10 Longitude :57:10 Altitude :57:10 Course :57:10 Speed :57:11 Yaw :57:11 Pitch :57:11 Roll :57:11 AccelerationX :57:11 AccelerationY :57:11 AccelerationZ :57:11 Latitude :57:11 Longitude :57:11 Altitude :57:11 Course :57:11 Speed :57:12 Yaw :57:12 Pitch :57:12 Roll :57:12 AccelerationX :57:12 AccelerationY :57:12 AccelerationZ :57:12 Latitude :57:12 Longitude :57:12 Altitude :57:12 Course :57:12 Speed
94 Feature Window :57:08 Yaw :57:08 Pitch :57:08 Roll :57:08 AccelerationX :57:08 AccelerationY :57:08 AccelerationZ :57:08 Latitude :57:08 Longitude :57:08 Altitude :57:08 Course :57:08 Speed :57:09 Yaw :57:09 Pitch :57:09 Roll :57:09 AccelerationX :57:09 AccelerationY :57:09 AccelerationZ :57:09 Latitude :57:09 Longitude :57:09 Altitude :57:09 Course :57:09 Speed :57:10 Yaw :57:10 Pitch :57:10 Roll :57:10 AccelerationX :57:10 AccelerationY :57:10 AccelerationZ :57:10 Latitude :57:10 Longitude :57:10 Altitude :57:10 Course :57:10 Speed Define a context window Data segmented into individual activities Sliding window Based on amount of time Overlapping or nonoverlapping
95 Window Features :57:08 Yaw :57:08 Pitch :57:08 Roll :57:08 AccelerationX :57:08 AccelerationY :57:08 AccelerationZ :57:08 Latitude :57:08 Longitude :57:08 Altitude :57:08 Course :57:08 Speed :57:09 Yaw :57:09 Pitch :57:09 Roll :57:09 AccelerationX :57:09 AccelerationY :57:09 AccelerationZ :57:09 Latitude :57:09 Longitude :57:09 Altitude :57:09 Course :57:09 Speed :57:10 Yaw :57:10 Pitch :57:10 Roll :57:10 AccelerationX :57:10 AccelerationY :57:10 AccelerationZ :57:10 Latitude :57:10 Longitude :57:10 Altitude :57:10 Course :57:10 Speed :57:11 Yaw :57:11 Pitch :57:11 Roll :57:11 AccelerationX :57:11 AccelerationY :57:11 AccelerationZ :57:11 Latitude :57:11 Longitude :57:11 Altitude :57:11 Course :57:11 Speed :57:12 Yaw :57:12 Pitch :57:12 Roll :57:12 AccelerationX :57:12 AccelerationY :57:12 AccelerationZ :57:12 Latitude :57:12 Longitude :57:12 Altitude :57:12 Course :57:12 Speed Date (days since 01-01): 251 Day of week: 3 Time of day (hours, minutes, seconds past midnight): (21, 1260, 75612)
96 StDev (S) = Statistical Features Yaw Pitch Roll AccelerationX AccelerationY AccelerationZ Latitude Longitude Altitude Course Speed Yaw Pitch Roll AccelerationX AccelerationY AccelerationZ Latitude Longitude Altitude Course Speed Yaw Pitch Roll AccelerationX AccelerationY AccelerationZ Latitude Longitude Altitude Course Speed Yaw Pitch Roll AccelerationX AccelerationY AccelerationZ Latitude Longitude Altitude Course Speed Yaw Pitch Roll AccelerationX AccelerationY AccelerationZ Latitude Longitude Altitude Course Speed Yaw values , , , , Max: Min: Sum: Mean: Median: Standard deviation: N StDev (S) = ( s 2 i i s) 1 N Mean absolute deviation: N MeanAbsDev (S) = s i i s 1 N Median absolute deviation: N MedAbsDev (S) = s Median( i i S 1 N )
97 StDev (S) = Statistical Features Yaw Pitch Roll AccelerationX AccelerationY AccelerationZ Latitude Longitude Altitude Course Speed Yaw Pitch Roll AccelerationX AccelerationY AccelerationZ Latitude Longitude Altitude Course Speed Yaw Pitch Roll AccelerationX AccelerationY AccelerationZ Latitude Longitude Altitude Course Speed Yaw Pitch Roll AccelerationX AccelerationY AccelerationZ Latitude Longitude Altitude Course Speed Yaw Pitch Roll AccelerationX AccelerationY AccelerationZ Latitude Longitude Altitude Course Speed Yaw values , , , , Zero crossings: 1 #times cross median Mean crossings: 1 Interquartile range (IQR): Sorted (nondecreasing) , , , , Measures statistical dispersion IQR is difference between 75 th and 25 th percentiles Here, 25 th is , 75 th is IQR is ( ) ( )

98 StDev (S) = Statistical Features Yaw Pitch Roll AccelerationX AccelerationY AccelerationZ Latitude Longitude Altitude Course Speed Yaw Pitch Roll AccelerationX AccelerationY AccelerationZ Latitude Longitude Altitude Course Speed Yaw Pitch Roll AccelerationX AccelerationY AccelerationZ Latitude Longitude Altitude Course Speed Yaw Pitch Roll AccelerationX AccelerationY AccelerationZ Latitude Longitude Altitude Course Speed Yaw Pitch Roll AccelerationX AccelerationY AccelerationZ Latitude Longitude Altitude Course Speed Yaw values , , , , Skewness: Measure asymmetry in distribution of values Kurtosis: Amount of peakedness or flatness in values Skewness(S) = 1 N 1 ( N i 1 N N i 1 3 ( s s) i i 2 ( s s) ) 1 N 4 ( s ) i 1 i s Kurstosis(S) = N 3 1 N 2 3 ( ( s ) ) i 1 i s N 3 2 [Najafi et al.]
Title: 4-Way-Stop Wait-Time Prediction Group members (1): David Held
: David Held") Title: 4-Way-Stop Wait-Time Prediction Group members (1): David Held As part of my research in Sebastian Thrun's autonomous driving team, my goal is to predict the wait-time for a car at a 4-way intersection.
Title: 4-Way-Stop Wait-Time Prediction Group members (1): David Held As part of my research in Sebastian Thrun's autonomous driving team, my goal is to predict the wait-time for a car at a 4-way intersection.
Bayesian Optimized Random Forest for Movement Classification with Smartphones
 Bayesian Optimized Random Forest for Movement Classification with Smartphones 1 2 3 4 Anonymous Author(s) Affiliation Address email 5 6 7 8 9 10 11 12 13 14 15 16 17 18 19 20 21 22 23 24 25 26 27 28 29
DATA MINING SAMPLE RESEARCH: ACTIVITY RECOGNITION CLASSIFICATION IN ACTION
 DATA MINING SAMPLE RESEARCH: ACTIVITY RECOGNITION CLASSIFICATION IN ACTION 1 Mobile Activity Recognition Mobile devices like smartphones and smartwatches have many sensors Some sensors measure motion Tri-axial
Reliable Real-Time Recognition of Motion Related Human Activities using MEMS Inertial Sensors
 Reliable Real-Time Recognition of Motion Related Human Activities using MEMS Inertial Sensors K. Frank,, y; M.J. Vera-Nadales, University of Malaga, Spain; P. Robertson, M. Angermann, v36 Motivation 2
PREDICTING the outcomes of sporting events
 CS 229 FINAL PROJECT, AUTUMN 2014 1 Predicting National Basketball Association Winners Jasper Lin, Logan Short, and Vishnu Sundaresan Abstract We used National Basketball Associations box scores from 1991-1998
INTRODUCTION TO PATTERN RECOGNITION
 INTRODUCTION TO PATTERN RECOGNITION 3 Introduction Our ability to recognize a face, to understand spoken words, to read handwritten characters all these abilities belong to the complex processes of pattern
Tutorial for the. Total Vertical Uncertainty Analysis Tool in NaviModel3
 Tutorial for the Total Vertical Uncertainty Analysis Tool in NaviModel3 May, 2011 1. Introduction The Total Vertical Uncertainty Analysis Tool in NaviModel3 has been designed to facilitate a determination
Human Performance Evaluation
 Human Performance Evaluation Minh Nguyen, Liyue Fan, Luciano Nocera, Cyrus Shahabi minhnngu@usc.edu --O-- Integrated Media Systems Center University of Southern California 1 2 Motivating Application 8.2
Evaluating and Classifying NBA Free Agents
 Evaluating and Classifying NBA Free Agents Shanwei Yan In this project, I applied machine learning techniques to perform multiclass classification on free agents by using game statistics, which is useful
Decision Trees. an Introduction
 Decision Trees an Introduction Outline Top-Down Decision Tree Construction Choosing the Splitting Attribute Information Gain and Gain Ratio Decision Tree An internal node is a test on an attribute A branch
Performance of Fully Automated 3D Cracking Survey with Pixel Accuracy based on Deep Learning
 Performance of Fully Automated 3D Cracking Survey with Pixel Accuracy based on Deep Learning Kelvin C.P. Wang Oklahoma State University and WayLink Systems Corp. 2017-10-19, Copenhagen, Denmark European
Navigate to the golf data folder and make it your working directory. Load the data by typing
 Golf Analysis 1.1 Introduction In a round, golfers have a number of choices to make. For a particular shot, is it better to use the longest club available to try to reach the green, or would it be better
BASKETBALL PREDICTION ANALYSIS OF MARCH MADNESS GAMES CHRIS TSENG YIBO WANG
 BASKETBALL PREDICTION ANALYSIS OF MARCH MADNESS GAMES CHRIS TSENG YIBO WANG GOAL OF PROJECT The goal is to predict the winners between college men s basketball teams competing in the 2018 (NCAA) s March
CS 528 Mobile and Ubiquitous Computing Lecture 7a: Applications of Activity Recognition + Machine Learning for Ubiquitous Computing.
 CS 528 Mobile and Ubiquitous Computing Lecture 7a: Applications of Activity Recognition + Machine Learning for Ubiquitous Computing Emmanuel Agu Applications of Activity Recognition Recall: Activity Recognition
Section I: Multiple Choice Select the best answer for each problem.
 Inference for Linear Regression Review Section I: Multiple Choice Select the best answer for each problem. 1. Which of the following is NOT one of the conditions that must be satisfied in order to perform
7500 W 29th Ave, Wheat Ridge, CO Report Dated: 7/21/2017. Precise Aerial Measurement Report
 7500 W 29th Ave, Wheat Ridge, CO 80033 Report Dated: Precise Aerial Measurement Report TABL OF CONTNTS Images...1 Length Diagram...4 Pitch Diagram...5 Area Diagram...6 Notes Diagram...7 Penetrations Diagram...8
Chapter 12 Practice Test
 Chapter 12 Practice Test 1. Which of the following is not one of the conditions that must be satisfied in order to perform inference about the slope of a least-squares regression line? (a) For each value
A history-based estimation for LHCb job requirements
 A history-based estimation for LHCb job requirements Nathalie Rauschmayr on behalf of LHCb Computing 13th April 2015 Introduction N. Rauschmayr 2 How long will a job run and how much memory might it need?
Decision Trees. Nicholas Ruozzi University of Texas at Dallas. Based on the slides of Vibhav Gogate and David Sontag
 Decision Trees Nicholas Ruozzi University of Texas at Dallas Based on the slides of Vibhav Gogate and David Sontag Announcements Course TA: Hao Xiong Office hours: Friday 2pm-4pm in ECSS2.104A1 First homework
knn & Naïve Bayes Hongning Wang
 knn & Naïve Bayes Hongning Wang CS@UVa Today s lecture Instance-based classifiers k nearest neighbors Non-parametric learning algorithm Model-based classifiers Naïve Bayes classifier A generative model
Cricket umpire assistance and ball tracking system using a single smartphone camera
 1 2 3 4 5 6 7 8 9 10 11 12 13 14 15 16 17 18 19 20 21 22 23 24 25 26 27 28 29 30 31 32 33 34 35 36 37 38 39 Cricket umpire assistance and ball tracking system using a single smartphone camera Udit Arora
CS145: INTRODUCTION TO DATA MINING
 CS145: INTRODUCTION TO DATA MINING 3: Vector Data: Logistic Regression Instructor: Yizhou Sun yzsun@cs.ucla.edu October 9, 2017 Methods to Learn Vector Data Set Data Sequence Data Text Data Classification
DATA MINING ON CRICKET DATA SET FOR PREDICTING THE RESULTS. Sushant Murdeshwar
 DATA MINING ON CRICKET DATA SET FOR PREDICTING THE RESULTS by Sushant Murdeshwar A Project Report Submitted in Partial Fulfillment of the Requirements for the Degree of Master of Science in Computer Science
Electromyographic (EMG) Decomposition. Tutorial. Hamid R. Marateb, PhD; Kevin C. McGill, PhD
 Decomposition. Tutorial. Hamid R. Marateb, PhD; Kevin C. McGill, PhD") Electromyographic (EMG) Decomposition Tutorial Hamid R. Marateb, PhD; Kevin C. McGill, PhD H. Marateb is with the Biomedical Engineering Department, Faculty of Engineering, the University of Isfahan, Isfahan,
Electromyographic (EMG) Decomposition Tutorial Hamid R. Marateb, PhD; Kevin C. McGill, PhD H. Marateb is with the Biomedical Engineering Department, Faculty of Engineering, the University of Isfahan, Isfahan,
Naïve Bayes. Robot Image Credit: Viktoriya Sukhanova 123RF.com
 Naïve Bayes These slides were assembled by Byron Boots, with only minor modifications from Eric Eaton s slides and grateful acknowledgement to the many others who made their course materials freely available
2 When Some or All Labels are Missing: The EM Algorithm
 CS769 Spring Advanced Natural Language Processing The EM Algorithm Lecturer: Xiaojin Zhu jerryzhu@cs.wisc.edu Given labeled examples (x, y ),..., (x l, y l ), one can build a classifier. If in addition
Estimating the Probability of Winning an NFL Game Using Random Forests
 Estimating the Probability of Winning an NFL Game Using Random Forests Dale Zimmerman February 17, 2017 2 Brian Burke s NFL win probability metric May be found at www.advancednflstats.com, but the site
EEC 686/785 Modeling & Performance Evaluation of Computer Systems. Lecture 6. Wenbing Zhao. Department of Electrical and Computer Engineering
 EEC 686/785 Modeling & Performance Evaluation of Computer Systems Lecture 6 Department of Electrical and Computer Engineering Cleveland State University wenbing@ieee.org Outline 2 Review of lecture 5 The
Naïve Bayes. Robot Image Credit: Viktoriya Sukhanova 123RF.com
 Naïve Bayes These slides were assembled by Eric Eaton, with grateful acknowledgement of the many others who made their course materials freely available online. Feel free to reuse or adapt these slides
Outline. Terminology. EEC 686/785 Modeling & Performance Evaluation of Computer Systems. Lecture 6. Steps in Capacity Planning and Management
 EEC 686/785 Modeling & Performance Evaluation of Computer Systems Lecture 6 Department of Electrical and Computer Engineering Cleveland State University wenbing@ieee.org Outline Review of lecture 5 The
POKEMON HACKS. Jodie Ashford Josh Baggott Chloe Barnes Jordan bird
 POKEMON HACKS Jodie Ashford Josh Baggott Chloe Barnes Jordan bird Why pokemon? 1997 The Pokemon Problem an episode of the anime caused 685 children to have seizures Professor Graham Harding from Aston
Introduction to Pattern Recognition
 Introduction to Pattern Recognition Jason Corso SUNY at Buffalo 12 January 2009 J. Corso (SUNY at Buffalo) Introduction to Pattern Recognition 12 January 2009 1 / 28 Pattern Recognition By Example Example:
Building an NFL performance metric
 Building an NFL performance metric Seonghyun Paik (spaik1@stanford.edu) December 16, 2016 I. Introduction In current pro sports, many statistical methods are applied to evaluate player s performance and
FIG: 27.1 Tool String
 Bring up Radioactive Tracer service. Click Acquisition Box - Edit - Tool String Edit the tool string as necessary to reflect the tool string being run. This is important to insure proper offsets, filters,
Machine Learning an American Pastime
 Nikhil Bhargava, Andy Fang, Peter Tseng CS 229 Paper Machine Learning an American Pastime I. Introduction Baseball has been a popular American sport that has steadily gained worldwide appreciation in the
wesport: Utilising Wrist-Band Sensing to Detect Player Activities in Basketball Games
 The Second IEEE International Workshop on Sensing Systems and Applications Using Wrist Worn Smart Devices, 2016 wesport: Utilising Wrist-Band Sensing to Detect Player Activities in Basketball Games Lu
Spatial Methods for Road Course Measurement
 Page 1 of 10 CurtinSearch Curtin Site Index Contact Details Links LASCAN Spatial Sciences WA Centre for Geodesy COURSE MEASUREMENT This page is a summary of results of some of the research we have recently
NBA Plays. Mitchell Kates. at the. September 2014
 Player Motion Analysis: Automatically Classifying NBA Plays by Mitchell Kates Submitted to the Department of Electrical Engineering and Computer Science in partial fulfillment of the requirements for the
Biostatistics & SAS programming
 Biostatistics & SAS programming Kevin Zhang March 6, 2017 ANOVA 1 Two groups only Independent groups T test Comparison One subject belongs to only one groups and observed only once Thus the observations
BIOL 101L: Principles of Biology Laboratory
 BIOL 101L: Principles of Biology Laboratory Sampling populations To understand how the world works, scientists collect, record, and analyze data. In this lab, you will learn concepts that pertain to these
Calculation of Trail Usage from Counter Data
 1. Introduction 1 Calculation of Trail Usage from Counter Data 1/17/17 Stephen Martin, Ph.D. Automatic counters are used on trails to measure how many people are using the trail. A fundamental question
DDR Dive Data Recorder Manual - Rel /12
 DDR Dive Data Recorder Manual - Rel. 1.1 2/12 TABLE OF CONTENTS 1. WHAT IS THE DDR? 4 2. TECHNICAL CHARACTERISTICS 5 3. DOWNLOADING DATA TO A PC 6 4. DDR MANAGER 7 5. CONFIGURE DEVICE BUTTON 9 6. READ
Chapter 6. Analysis of the framework with FARS Dataset
 Chapter 6 Analysis of the framework with FARS Dataset. Having represented each phase of the structure with the aid of different data sets at each stage, to support the efficacy of the proposed framework
Deconstructing Data Science
 Deconstructing Data Science David Bamman, UC Berkele Info 29 Lecture 4: Regression overview Feb 1, 216 Regression A mapping from input data (drawn from instance space ) to a point in R (R = the set of
WMS 8.4 Tutorial Hydraulics and Floodplain Modeling HY-8 Modeling Wizard Learn how to model a culvert using HY-8 and WMS
 v. 8.4 WMS 8.4 Tutorial Hydraulics and Floodplain Modeling HY-8 Modeling Wizard Learn how to model a culvert using HY-8 and WMS Objectives Define a conceptual schematic of the roadway, invert, and downstream
THE 2018 ROSENTHAL PRIZE for Innovation in Math Teaching. Geometry Project: DARTBOARD
 THE 2018 ROSENTHAL PRIZE for Innovation in Math Teaching Geometry Project: DARTBOARD Geometric Probability Theoretical Probability and Experimental Probability Elizabeth Masslich Geometry grades 6-12 Table
CS 7641 A (Machine Learning) Sethuraman K, Parameswaran Raman, Vijay Ramakrishnan
 Sethuraman K, Parameswaran Raman, Vijay Ramakrishnan") CS 7641 A (Machine Learning) Sethuraman K, Parameswaran Raman, Vijay Ramakrishnan Scenario 1: Team 1 scored 200 runs from their 50 overs, and then Team 2 reaches 146 for the loss of two wickets from their
CS 7641 A (Machine Learning) Sethuraman K, Parameswaran Raman, Vijay Ramakrishnan Scenario 1: Team 1 scored 200 runs from their 50 overs, and then Team 2 reaches 146 for the loss of two wickets from their
Premium Report 14/07/2017
 TABL OF COTT Images...1 Length Diagram...4 Pitch Diagram...5 Area Diagram...6 otes Diagram...7 Penetrations Diagram...8 Report ummary...9 MAURMT In this 3D model, facets appear as semi-transparent to reveal
Walkthrough. ( AM) doing
 doing") Walkthrough (7.30AM) breakfast talk with mom, for earn some points. (8.30AM) Talk with Sis (Ashley) twice, and open new option. For now MC only need talk with Veronica in the Kitchen (9.00(9.00 10.00AM)
Walkthrough (7.30AM) breakfast talk with mom, for earn some points. (8.30AM) Talk with Sis (Ashley) twice, and open new option. For now MC only need talk with Veronica in the Kitchen (9.00(9.00 10.00AM)
Inferring land use from mobile phone activity
 Inferring land use from mobile phone activity Jameson L. Toole (MIT) Michael Ulm (AIT) Dietmar Bauer (AIT) Marta C. Gonzalez (MIT) UrbComp 2012 Beijing, China 1 The Big Questions Can land use be predicted
DATA SCIENCE SUMMER UNI VIENNA
 Prerequisites - You have installed Tableau Desktop on your computer. Available here: http://www.tableau.com/academic/students - You have downloaded the data (athlete_events.csv) available here: https://www.kaggle.com/heesoo37/120-years-of-olympic-historyathletes-and-results
(Refer Slide Time: 0:36)
") Port and Harbour Structures. Professor R. Sundaradivelu. Department of Ocean Engineering. Indian Institute of Technology, Madras. Module-2. Lecture-8B. Wave Rose Diagram. (Refer Slide Time: 0:36) We will
Port and Harbour Structures. Professor R. Sundaradivelu. Department of Ocean Engineering. Indian Institute of Technology, Madras. Module-2. Lecture-8B. Wave Rose Diagram. (Refer Slide Time: 0:36) We will
Walk-O-Meter User Manual
 Walk-O-Meter User Manual For BlackBerry Z10 and Q10 Version 2 Date 2013-09-26 1 Thank you for purchasing the Walk-O-Meter App from Cellimagine LLC. Walk-O-Meter pedometer app for your Z10 is the ultimate
Cumulative Frequency Diagrams
 Save My Exams! The Home of Revision For more awesome GCSE and A level resources, visit us at www.savemyexams.co.uk/ Cumulative Frequency Diagrams Mark Scheme Level Subject Exam Board Topic Sub Topic Booklet
Classification of Game Events in Ice Hockey Game Film. Phil Cohn
 Classification of Game Events in Ice Hockey Game Film Phil Cohn March 15, 2013 Abstract We ve designed an approach to use player attributes derived from ice hockey game film with simple classification
Study Guide and Intervention
 Study Guide and Intervention Normal and Skewed Distributions A continuous probability distribution is represented by a curve. Types of Continuous Distributions Normal Positively Skewed Negatively Skewed
Using an Adaptive Thresholding Algorithm to Detect CA1 Hippocampal Sharp Wave Ripples. Jay Patel. Michigan State University
 Using an Adaptive Thresholding Algorithm to Detect CA1 Hippocampal Sharp Wave Ripples Jay Patel Michigan State University Department of Physics and Astronomy, University of California, Los Angeles 2013
Two Machine Learning Approaches to Understand the NBA Data
 Two Machine Learning Approaches to Understand the NBA Data Panagiotis Lolas December 14, 2017 1 Introduction In this project, I consider applications of machine learning in the analysis of nba data. To
DEPARTMENT OF THE NAVY DIVISION NEWPORT OFFICE OF COUNSEL PHONE: FAX: DSN:
 IMAVSBA WARFARE CENTERS NEWPORT DEPARTMENT OF THE NAVY NAVAL UNDERSEA WARFARE CENTER DIVISION NEWPORT OFFICE OF COUNSEL PHONE: 401 832-3653 FAX: 401 832-4432 DSN: 432-3653 Attorney Docket No. 85031 Date:
DATA HANDLING EXAM QUESTIONS
 DATA HANDLING EXAM QUESTIONS MARK SCHEME 1. (a) Reason 1 B1 Makes some mention of bias either directly or making reference to an insufficient or biased range of responses (b) Reason 1 B1 (a) an insufficient
SFM mapping of coastal erosion at Point Woronzof. Gennady Gienko, PhD Department of Geomatics, UAA
 SFM mapping of coastal erosion at Point Woronzof Gennady Gienko, PhD Department of Geomatics, UAA ggienko@alaska.edu POINT WORONZOF Point Woronzof bluff 135 ft elevation Point Woronzof bluff Pt. Woronzof
TPM TIP. Oil Viscosity
 TPM TIP Oil Viscosity TIP #1 Classification according to viscosity is the most prevalent method of describing oils, and the most common classification systems are those of the SAE, AGMA, and ISO. Each
Anatomy of a Homer. Purpose. Required Equipment/Supplies. Optional Equipment/Supplies. Discussion
 Chapter 5: Projectile Motion Projectile Motion 17 Anatomy of a Homer Purpose To understand the principles of projectile motion by analyzing the physics of home runs Required Equipment/Supplies graph paper,
Chapter 2: Visual Description of Data
 Chapter 2: Visual Description of Data El Mechry El Koudous Fordham University January 24, 2018 Meshry (Fordham University) Chapter 2 January 24, 2018 1 / 35 Introduction In this chapter we will cover:
Measurement LESSON ONE - Metric and Imperial Lesson Notes
 0 1 2 Measurement Introduction Introduction to Measurement a) Complete the following table: Unit Length Multiplying (in metres) Factor Referent mm cm dm m dam hm km b) Indicate which measuring tool is
Lecture 5. Optimisation. Regularisation
 Lecture 5. Optimisation. Regularisation COMP90051 Statistical Machine Learning Semester 2, 2017 Lecturer: Andrey Kan Copyright: University of Melbourne Iterative optimisation Loss functions Coordinate
Deconstructing Data Science
 Deconstructing Data Science David Bamman, UC Berkele Info 29 Lecture 4: Regression overview Jan 26, 217 Regression A mapping from input data (drawn from instance space ) to a point in R (R = the set of
Predicting NBA Shots
 Predicting NBA Shots Brett Meehan Stanford University https://github.com/brettmeehan/cs229 Final Project bmeehan2@stanford.edu Abstract This paper examines the application of various machine learning algorithms
Using Spatio-Temporal Data To Create A Shot Probability Model
 Using Spatio-Temporal Data To Create A Shot Probability Model Eli Shayer, Ankit Goyal, Younes Bensouda Mourri June 2, 2016 1 Introduction Basketball is an invasion sport, which means that players move
Reading Time: 15 minutes Writing Time: 1 hour 30 minutes. Structure of Book. Number of questions to be answered. Number of modules to be answered
 Reading Time: 15 minutes Writing Time: 1 hour 30 minutes Letter Student Number: Structure of Book Section A - Core Section B - Modules Number of questions Number of questions to be answered Number of marks
Projecting Three-Point Percentages for the NBA Draft
 Projecting Three-Point Percentages for the NBA Draft Hilary Sun hsun3@stanford.edu Jerold Yu jeroldyu@stanford.edu December 16, 2017 Roland Centeno rcenteno@stanford.edu 1 Introduction As NBA teams have
City and County of San Francisco APS Safety & Access Tool. Cover Sheet. Total score = crosswalk worksheet score + intersection worksheet score
 City and County of San Francisco APS Safety & Access Tool Location of Intersection or Crosswalk: Cover Sheet Evaluator Name: Date Evaluation Completed: Total score = crosswalk worksheet score + intersection
Accuracy and Precision of High-Speed Field Measurements of Pavement Surface Rutting and Cracking
 Accuracy and Precision of High-Speed Field Measurements of Pavement Surface Rutting and Cracking Pedro A. Serigos, MSE, MSStat - serigosp@utexas.edu Jorge A. Prozzi, PhD Andre de Fortier Smit, PhD Mike
Preparation for Salinity Control ME 121
 Preparation for Salinity Control ME 121 This document describes a set of measurements and analyses that will help you to write an Arduino program to control the salinity of water in your fish tank. The
Modeling Salmon Behavior on the Umpqua River. By Scott Jordan 6/2/2015
 Modeling Salmon Behavior on the Umpqua River By Scott Jordan 6/2/2015 1 Importance of Salmon Delicious Recreation 631,000 people in Oregon went fishing in 2008 spent $264.6 Million on fishing trips Commercial
Smoothing the histogram: The Normal Curve (Chapter 8)
") Sept. 3 Statistic for the day: Compared to same month the previous year, average monthly drop in U.S. traffic fatalities from May 27 to Feb. 28:.2% Drop in March 28: 22.1% Drop in April 28: 17.9% Smoothing
Sept. 3 Statistic for the day: Compared to same month the previous year, average monthly drop in U.S. traffic fatalities from May 27 to Feb. 28:.2% Drop in March 28: 22.1% Drop in April 28: 17.9% Smoothing
Software Reliability 1
 Software Reliability 1 Software Reliability What is software reliability? the probability of failure-free software operation for a specified period of time in a specified environment input sw output We
Using Machine Learning for Real-time Activity Recognition and Estimation of Energy Expenditure
 Using Machine Learning for Real-time Activity Recognition and Estimation of Energy Expenditure Emmanuel Munguia Tapia PhD Thesis Defense House_n Massachusetts Institute of Technology Do you know How many
Regional Analysis of Extremal Wave Height Variability Oregon Coast, USA. Heidi P. Moritz and Hans R. Moritz
 Regional Analysis of Extremal Wave Height Variability Oregon Coast, USA Heidi P. Moritz and Hans R. Moritz U. S. Army Corps of Engineers, Portland District Portland, Oregon, USA 1. INTRODUCTION This extremal
Gabe represents his mystery number with the variable f.
 Mystery Numbers Home Link 7- Gabe and Aurelia play Number Squeeze. Gabe represents his mystery number with the variable f. - a. Represent each of the two Number Squeeze clues with an inequality. Describe
Using Perceptual Context to Ground Language
 Using Perceptual Context to Ground Language David Chen Joint work with Joohyun Kim, Raymond Mooney Department of Computer Sciences, University of Texas at Austin 2009 IBM Statistical Machine Learning and
This file is part of the following reference:
 This file is part of the following reference: Hancock, Timothy Peter (2006) Multivariate consensus trees: tree-based clustering and profiling for mixed data types. PhD thesis, James Cook University. Access
Planning and Acting in Partially Observable Stochastic Domains
 Planning and Acting in Partially Observable Stochastic Domains Leslie Pack Kaelbling and Michael L. Littman and Anthony R. Cassandra (1998). Planning and Acting in Partially Observable Stochastic Domains,
VIROLOGY QUALITY ASSURANCE PROGRAM STATISTICAL CENTER
 TO: CC: Members of the VQA Advisory Board (VQAAB) Bill Meyer Bob Coombs/Ming Chang Nicole Tobin Belinda Yen-Lieberman Joan Dragavon Urvi Parikh Jessica Fogel James Bremer Cheryl Jennings Carolyn Yanavich/Diane
Pitching Performance and Age
 Pitching Performance and Age Jaime Craig, Avery Heilbron, Kasey Kirschner, Luke Rector and Will Kunin Introduction April 13, 2016 Many of the oldest and most long- term players of the game are pitchers.
(Lab Interface BLM) Acceleration
 Acceleration") Purpose In this activity, you will study the concepts of acceleration and velocity. To carry out this investigation, you will use a motion sensor and a cart on a track (or a ball on a track, if a cart
Purpose In this activity, you will study the concepts of acceleration and velocity. To carry out this investigation, you will use a motion sensor and a cart on a track (or a ball on a track, if a cart
Do craters at higher elevations have larger wind streaks than craters at lower elevations?
 Team Epsilon Do craters at higher elevations have larger wind streaks than craters at lower elevations? If a crater is at a higher elevation, then the wind streak will be longer because wind on Earth is
1 PIPESYS Application
 PIPESYS Application 1-1 1 PIPESYS Application 1.1 Gas Condensate Gathering System In this PIPESYS Application, the performance of a small gascondensate gathering system is modelled. Figure 1.1 shows the
Spatial Patterns / relationships. Model / Predict
 Human Environment Spatial Patterns / relationships Model / Predict 2 3 4 5 6 Comparing Neighborhoods with high Quality of Life & health Overlap matrix NPUs with high NH & NQoL SEC High QoL High Health
VIROLOGY QUALITY ASSURANCE PROGRAM STATISTICAL CENTER
 TO: CC: Members of the VQA Advisory Board (VQAAB) Bill Meyer Bob Coombs/Ming Chang Nicole Tobin Belinda Yen-Lieberman Joan Dragavon Urvi Parikh Jessica Fogel James Bremer Cheryl Jennings Carolyn Yanavich/Diane
Pitching Performance and Age
 Pitching Performance and Age By: Jaime Craig, Avery Heilbron, Kasey Kirschner, Luke Rector, Will Kunin Introduction April 13, 2016 Many of the oldest players and players with the most longevity of the
The PASCAL Visual Object Classes Challenge 2010 (VOC2010)
") The PASCAL Visual Object Classes Challenge 2010 (VOC2010) Part 4 Action Classification Taster Challenge Mark Everingham Luc Van Gool Ivan Laptev Chris Williams John Winn Andrew Zisserman Motivation I:
The PASCAL Visual Object Classes Challenge 2010 (VOC2010) Part 4 Action Classification Taster Challenge Mark Everingham Luc Van Gool Ivan Laptev Chris Williams John Winn Andrew Zisserman Motivation I:
Feature Extraction for Musical Genre Classification MUS15
 Feature Extraction for Musical Genre Classification MUS15 Feature Extraction for Musical Genre Classification MUS15 Kilian Merkelbach June 22, 2015 Kilian Merkelbach June 21, 22, 2015 0/26 1/26 Intro -
Object Recognition. Selim Aksoy. Bilkent University
 Image Classification and Object Recognition Selim Aksoy Department of Computer Engineering Bilkent University saksoy@cs.bilkent.edu.tr Image classification Image (scene) classification is a fundamental
PUV Wave Directional Spectra How PUV Wave Analysis Works
 PUV Wave Directional Spectra How PUV Wave Analysis Works Introduction The PUV method works by comparing velocity and pressure time series. Figure 1 shows that pressure and velocity (in the direction of
P.O.Box 43 Blindern, 0313 Oslo, Norway Tel.: , Fax: Statkraft,Postboks 200 Lilleaker, 0216 Oslo, Norway ABSTRACT
 A NEW TESTSITE FOR WIND CORRECTION OF PRECIPITATION MEASUREMENTS AT A MOUNTAIN PLATEAU IN SOUTHERN NORWAY Mareile Wolff 1, Ragnar Brækkan 1, Ketil Isaaksen 1, Erik Ruud 2 1 Norwegian Meteorological Institute,
Failure Detection in an Autonomous Underwater Vehicle
 Failure Detection in an Autonomous Underwater Vehicle Alec Orrick, Make McDermott, Department of Mechanical Engineering David M. Barnett, Eric L. Nelson, Glen N. Williams, Department of Computer Science
sulting NOAA Richmond NOAA Richmond Station
 NOAA Richmond NOAA Richmond Station This station is located at the Chevron pier and is operated by the NOAA. It provides wind data as well as tide data. The winds never reached 40 knots The winds did not
Introduction to Pattern Recognition
 Introduction to Pattern Recognition Jason Corso SUNY at Buffalo 19 January 2011 J. Corso (SUNY at Buffalo) Introduction to Pattern Recognition 19 January 2011 1 / 32 Examples of Pattern Recognition in
Predictive Analysis of Football Matches using In-play Data
 Department of AI, Faculty of ICT, University of Malta Predictive Analysis of Football Matches using In-play Data Matthew J. Zammit matthew.zammit.09@um.edu.mt September 11, 2018 It s the 2 nd of January