Highlights Introduction in the International Transfer Matching System Geographical distribution...9
|
|
|
- Winifred Bradford
- 6 years ago
- Views:
Transcription


1
2 Highlights... 3 Introduction in the International Transfer Matching System Geographical distribution Club involvement in international transfers Figures Transfer fees and intermediary commissions A glance beyond the big spenders Figures Player characteristics...26 South American players around the world Figures Minors..32 Movement of underage players Figures...35 Disclaimer...36
3 Out of contract 66 On loan 13 Permanent* 13 Return from loan 8 No transfer fees 84 < USD 1, 5 USD 1, - USD 1 million 6 USD 1 million - USD 1 million 4 > USD 1 million 1 Within UEFA 45 Across confederations 34 Within CONMEBOL 7 Within CAF 6 Within AFC 5 Within CONCACAF 3 Within OFC *An international permanent transfer with a transfer agreement between the two clubs
4 < 18 years old years old years old years old years old 1 6 months months months months 19 > 48 months 5 Transfers with player intermediary 14 Transfers without player intermediary 86

5


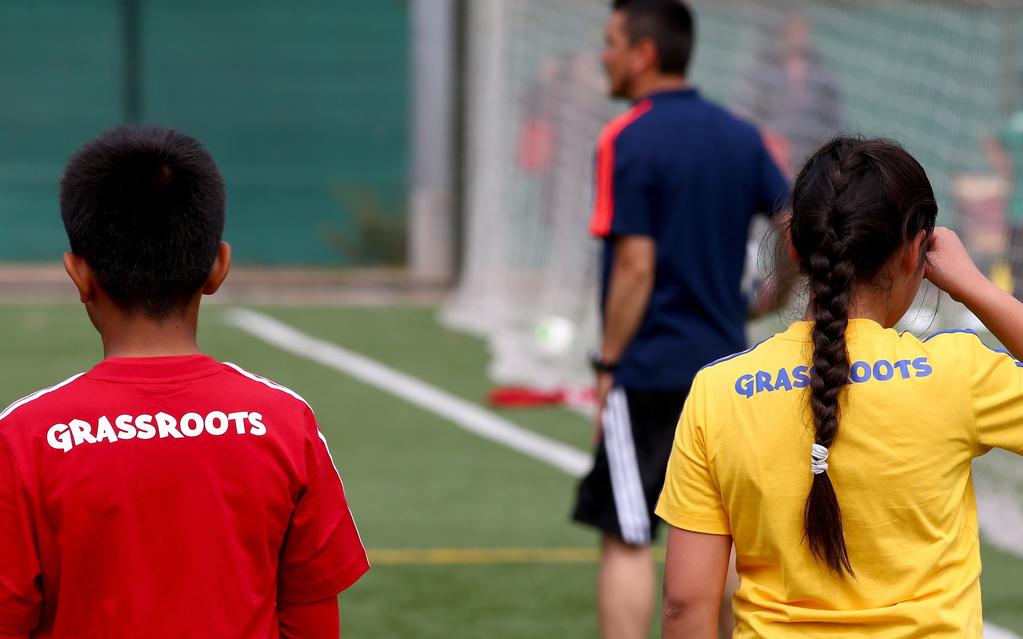
6 Jan Feb Mar Apr May Jun Jul Aug Sep Oct Nov Dec ,68 1,887 3,259 3,69 3,245 Number of transfers Since the International Transfer Matching System (ITMS) became mandatory in October 21, clubs from all over the world have completed 94, international 1 transfers of professional players. A new record was set in 217 with 15,624 international transfers, 6.8% more than in 216. These transfers involved 13,415 professional players representing 181 different nationalities. Types of transfers The most common transfer type was that of players out of contract, accounting for 65.5% of all international transfers in 217. The remaining transfers were either loans (13.1%), permanent 2 transfers (13.%) or transfers of players returning from a loan (8.4%). Timing of transfers As shown in figure 3, transfers occur at all times throughout the year. Most transfers are completed in January, July and August, as these months correspond to when the majority of associations have their registration periods open. Fig. 1: Total number of international transfers by year Fig. 2: International transfers in 217 by type Fig. 3: International transfers in 217 by month 11,882 12,5 12,733 13,158 13,66 14,631 15, % Out of contract 13.1% On loan 13.% Permanent 8.4% Return from loan Between clubs of two different associations 2 An international permanent transfer with a transfer agreement between the two clubs

 fees 3, 1.% as solidarity contribution and.3% as training compensation.")
 Fig. 5: Spending on transfer fees in 217 by type of fee 3.98 4.8 4.19 4.8 6.")
 fees were included in fixed transfer fees.")
7 Spending on transfer fees Since October 21, USD 29.3 billion were spent on transfer fees. Like the number of transfers, spending has also reached a new high in 217: USD 6.37 billion, 32.7% more than the previous year. Types of transfer fee Of the total USD 6.37 billion, clubs declared 75.7% as fixed transfer fees, 16.3% as conditional fees, 6.7% as release (buy-out) fees 3, 1.% as solidarity contribution and.3% as training compensation. The vast majority of transfers were free of payments (84.2%), and only about one in every six was with fees (15.8%). Fig. 4: Spending on transfer fees by year (USD billion) Fig. 5: Spending on transfer fees in 217 by type of fee % Fixed Conditional Release (buy-out) 16.3% Solidarity contr. 6.7% Training comp % 1.% 3 In previous reports, release (buy-out) fees were included in fixed transfer fees. From this edition the two are shown separately, in order to more accurately reflect the information declared by clubs in ITMS.
8 Fig. 6: Example of an international permanent transfer with a transfer agreement THE PLAYER CAN NOW PLAY FOR HIS NEW CLUB PAYMENTS ARE MADE DIRECTLY TO THE FORMER CLUB NEW CLUB NEW ASSOCIATION NEW ASSOCIATION NEW CLUB Enters a transfer instruction with the player s details and the relevant transfer details 1 Requests the International Transfer Certificate (ITC) 3 Confirms the receipt of the ITC and enters the player registration date in ITMS 5 Uploads proofs of payment onto ITMS (where relevant and applicable) MATCH Only when all details of the two instructions are identical, will ITMS allow the process to continue TRANSFER IS CLOSED FORMER CLUB Enters a transfer instruction with the relevant transfer details 1 FORMER ASSOCIATION If the player is not already in the ITMS database, the former association shall confirm or reject his identity 2 FORMER ASSOCIATION Within 7 days of the ITC request, the player s former association shall (subject to certain conditions): - deliver the ITC or - reject the ITC request 4 Disclaimer: The above illustration is for information purposes only and is not an exhaustive description of either the transfer process or the steps to be followed in a particular transfer. The illustration is not to be relied upon when processing a transfer. Each particular transfer is subject to and must be completed in accordance with the FIFA Regulations on the Status and Transfer of Players (RSTP) 1 See FIFA RSTP Annexe 3, art. 4, par. 2 and Annexe 3, art. 8.2, par. 1 2 See FIFA RSTP Annexe 3, art. 5.2, par. 1 3 See FIFA RSTP Annexe 3, art. 5.2, par. 2; Annexe 3, art. 8.1, par. 2 and Annexe 3, art. 8.2, par. 2 4 See FIFA RSTP Annexe 3, art. 8.2, par. 3, 4 and 7 5 See FIFA RSTP Annexe 3, art. 8.2, par. 5


9
10 Every year, more and more clubs are involved in cross-border transfers During the course of 217, 15,624 international transfers were completed worldwide. In total, 3,831 clubs and 179 of the 211 FIFA member associations were actively involved 1 in these transfers, meaning they engaged or released at least one player from/to a different association. Confederations Of the 3,831 clubs involved in transfers last year, 1,815 (47.4%) were from UEFA - almost three times more than any other confederation. This may not come as a surprise, as the European confederation is the largest of the six with its 55 member associations, and all but one of them - Liechtenstein - were involved in international transfers. CONMEBOL, despite being the confederation with the fewest number of member associations (1, all of which were involved in transfers in 217), had the second highest number of clubs involved in transfers, 611 in total. Fig. 8: Number of member associations and clubs involved in international transfers in 217 by confederation 2 Fig. 7: Number of member associations and clubs involved in international transfers by year UEFA s involved Clubs involved 54 of s involved Clubs involved , , , , ,522 CONCACAF s involved Clubs involved 22 of AFC s involved Clubs involved OFC s involved Clubs involved 42 of of , ,831 CONM EBOL s involved Clubs involved 1 of CAF s involved Clubs involved 48 of A previous version of this report defined "clubs involved in a transfer" including the player s former club in the case of transfers out of contract. In the present report, the choice was not to consider these clubs as involved in the transfer, with few exceptions. For example, when the engaging club pays a release (buy-out) fee, the player is released and transfers out of contract, but the releasing club is involved nonetheless. 2 In the context of a transfer of a player out of contract, the involved club is only one but the member associations are two, as they are active in the exchange of the International Transfer Certificate (ITC)
11 Member associations In 217, Brazil was the member association with the most clubs involved in transfers (254). In the top ten member associations involved in transfers the Big 5 are also present, as are Portugal, Argentina, Sweden and Mexico. Transfers per club Of the 3,831 clubs involved in international transfers, 57.6% completed incoming transfers only, 5.1% outgoing transfers only and 37.2% were involved in both types of transfer. year most of the clubs involved in international transfers completed between 2 and 5 transfers. At the two extremes, there were 969 clubs that were involved in only one transfer and 135 clubs that were involved in more than 2 transfers each. Fig. 9: Top 1 member associations by number of clubs involved in international transfers in 217 Clubs involved Brazil 254 Germany 143 England 132 Argentina 111 On average, each of the involved clubs completed 5.5 international transfers (incoming plus outgoing), a number that has been growing slowly but steadily. In 211, this number was 4.8. As shown in figure 1, last Fig. 1: Frequency distribution of international transfers (incoming + outgoing) per club in 217 Spain France 93 Portugal Italy 77 Sweden Mexico 67 1 transfer 2-5 transfers 6-1 transfers 11-2 transfers 2+ transfers
12 Releasing Fig. 11: Number of international transfers by confederation in 217 and percentage change from 216 Transfers Engaging AFC CAF CONCACAF CONMEBOL OFC UEFA AFC 756 (+7.4%) 97 (-24.8%) 39 (+5.4%) 25 (+13.1%) 7 (.%) 488 (+3.6%) CAF 248 (+2.5%) 867 (+28.3%) 33 (+83.3%) 15 (+7.1%) (.%) 487 (+15.7%) CONCACAF 41 (+7.8%) 6 (+2.%) 492 (+1.7%) 335 (+18.%) (.%) 198 (+7.%) CONMEBOL 251 (-1.7%) 23 (+19.1%) 474 (+3.3%) 1,18 (-.5%) (.%) 79 (+3.5%) OFC 1 (+42.9%) (.%) 1 (-75.%) 1 (.%) (.%) 9 (+8.%) UEFA 62 (+8.8%) 174 (+6.1%) 262 (-.4%) 548 (-1.3%) 1 (.%) 7,74 (+7.3%)
13 Fig. 12: Top 15 member associations by incoming transfers in 217 and percentage change from 216 Top 15 engaging associations Fig. 13: Top 15 member associations by outgoing transfers in 217 and percentage change from 216 Top 15 releasing associations Fig. 14: Top 15 transfer streams by transfers in 217 and percentage change from 216 Top 15 transfer streams Incoming transfers Outgoing transfers From To Transfers Brazil 748 (+1.2%) England 732 (+11.1%) Portugal 58 (+4.1%) Spain 471 (+.6%) Germany 41 (-.7%) Italy 352 (-9.3%) Argentina 338 (-25.1%) France 336 (+17.1%) Turkey 329 (+9.7%) USA 321 (-1.3%) Mexico 321 (+9.9%) Belgium 39 (+8.8%) Greece 269 (+29.3%) Cyprus 249 (-8.8%) Sweden 245 (+12.4%) Brazil 821 (+1.7%) England 767 (+4.8%) Spain 565 (+5.4%) Portugal 537 (+12.1%) Argentina 486 (-5.1%) Germany 424 (+14.%) France 422 (+3.4%) Italy 415 (+7.2%) Colombia 352 (+9.7%) Belgium 323 (+6.3%) Netherlands 35 (+42.5%) USA 3 (-.7%) Greece 268 (-.4%) Mexico 268 (+35.4%) Uruguay 25 (-5.7%) Brazil Portugal 169 (+.6%) England Scotland 13 (-9.7%) Portugal Brazil 121 (+17.5%) England Wales 114 (-7.3%) Scotland England 11 (+23.6%) Wales England 19 (+2.8%) England Spain 71 (+29.1%) Colombia Venezuela 71 (+77.5%) Spain England 63 (+21.2%) Argentina Chile 62 (-1.6%) Netherlands England 62 (+93.8%) Uruguay Argentina 59 (-21.3%) Argentina Uruguay 56 (+14.3%) France England 49 (+4.3%) England Netherlands 48 (+2.1%)
14 Fig. 15: Top 5 member associations of each confederation by incoming transfers in 217 AFC CAF CONCACAF Incoming transfers Incoming transfers Incoming transfers India 158 (+32.8%) Japan 152 (+18.8%) China PR 143 (-1.1%) Thailand 124 (+26.5%) Saudi Arabia 113 (+32.9%) Others 1,236 Total 1,926 (+5.4%) Zambia 138 (+762.5%) Egypt 92 (+27.8%) Morocco 73 (-3.9%) South Africa 72 (+9.1%) Tunisia 57 (-23.%) Others 735 Total 1,167 (+18.8%) USA 321 (-1.3%) Mexico 321 (+9.9%) Guatemala 13 (+3.%) Honduras 95 (+75.9%) Panama 94 (+22.1%) Others 367 Total 1,31 (+2.8%) CONMEBOL OFC UEFA Incoming transfers Incoming transfers Incoming transfers Brazil 748 (+1.2%) Argentina 338 (-25.1%) Uruguay 214 (+.5%) Colombia 26 (+25.6%) Chile 153 (+15.%) Others 598 Total 2,257 (+3.1%) New Zealand 8 (.%) Total 8 (.%) England 732 (+11.1%) Portugal 58 (+4.1%) Spain 471 (+.6%) Germany 41 (-.7%) Italy 352 (-9.3%) Others 6,429 Total 8,965 (+7.2%)
15 Fig. 16: Top 5 member associations of each confederation by outgoing transfers in 217 AFC CAF CONCACAF Outgoing transfers Outgoing transfers Outgoing transfers China PR 152 (-.7%) Japan 146 (+11.5%) Korea Republic 125 (-1.6%) Thailand 112 (.%) Australia 97 (+3.2%) Others 1,5 Total 1,637 (+4.3%) Nigeria 214 (+21.6%) Ghana 2 (+38.9%) Cameroon 15 (+38.2%) Ivory Coast 99 (+13.8%) South Africa 83 (+1.7%) Others 949 Total 1,65 (+2.4%) USA 3 (-.7%) Mexico 268 (+35.4%) Canada 79 (-8.1%) Costa Rica 76 (+26.7%) Guatemala 62 (-7.5%) Others 287 Total 1,72 (+9.5%) CONMEBOL OFC UEFA Outgoing transfers Outgoing transfers Outgoing transfers Brazil 821 (+1.7%) New Zealand 19 (+11.8%) England 767 (+4.8%) Argentina 486 (-5.1%) Samoa 1 (n/a) Spain 565 (+5.4%) Colombia 352 (+9.7%) Tahiti 1 (n/a) Portugal 537 (+12.1%) Uruguay 25 (-5.7%) Germany 424 (+14.%) Paraguay 153 (.%) France 422 (+3.4%) Others 53 Others 5,964 Total 2,565 (+.6%) Total 21 (+23.5%) Total 8,679 (+6.6%)


16
17 Spending growth is driven by a relatively small group of clubs of handful of member associations, but there is more to it than just the usual suspects As shown in the introduction, global spending on transfer fees reached a new high in 217. A new record has been set every year since 212, but the magnitude of last year s increase is unprecedented. Spending in 216 reached USD Fig. 17: Number of international transfers with fees by year Transfers with fees # % 211 1, % 212 1, % 213 1, % 214 1, % 215 1, % 216 2, % 217 2, % 4.8 billion and appeared to be on pace to break the USD 5 billion mark in 217. Expectations were quickly surpassed, with global spending rising to a record-breaking USD 6.37 billion. Figures 17 and 18 shed light on the forces driving this increase. Firstly, there have never been so many transfers with fees, both in absolute terms and as percentage of all transfers. Secondly, 217 witnessed a significant increase in the average transfer fee 1 paid to engage players, especially for the largest transfers. Fig. 18: Average transfer fee by year Average transfer fee (USD million) Worldwide Top 5 transfers Transfers with high fees contribute directly to the increase in global spending, but the effect of each dollar spent is not limited to that transfer alone. Clubs that receive large transfer fees for their players often reinvest part of the money into more transfers. In turn, clubs receiving this money will do the same, and so on. This creates a multiplier effect, the result of which is an even larger increase in global spending. But spending records are only one side of the story. The overwhelming majority of transfers (84.2%) did not involve fees. Of the total number of transfers (15,624), only 773 transfers were for fees exceeding USD 1 million. Most of the increase in global spending is accounted for by the few at the top: about two thirds (67.4%) of the USD 6.37 billion spent came from only 5 clubs of 13 member associations. Arguably, the big spenders are spending more, but is this also true of other associations? In 217, expenditure records were broken in 35 member associations by virtue of their clubs spending more on international transfers than 1 Total spending divided by the total number of international transfers with fees
18 they had ever done before. On a global scale, the impact of some of these associations may be less influential than that of the bigger markets, but, relative to their context, some of these increases have proven to be very significant. In this chapter, we take a closer look at three member associations where spending on transfers has risen considerably in 217: Japan, Czech Republic and Hungary. Japan (AFC) Japanese clubs ranked 19th worldwide in terms of transfer expenditure in 217, spending a total of USD 37.6 million to engage players internationally. Their expenditure levels have seen a steady increase over the past three years, having grown from USD 4.5 million in 214. In addition, there were also notable increments in the number of incoming transfers (11 in 214 vs. 152 in 217), the number of transfers with fees (18 in 214 vs. 48 in 217) and the number of clubs that engaged at least one player for a fee (12 in 214 vs. 23 in 217). Fig. 19: Number and value of international transfers by Japanese clubs, by year m 3m 15m m Number of transfers Value of transfers Outgoing Incoming In 217, for the first time, Japanese clubs engaged more players than they released and, for the second year in a row, they spent more than what they received. While future developments remain difficult to predict, it is clear that there has been a shift in Japan s transfer market activity. Spending Receipts Czech Republic (UEFA) In 217, Czech clubs spent USD 18.7 million to engage players internationally, making Czech Republic the 25th-highest member association worldwide in terms of clubs spending during the year. Fig. 2: Number and value of international transfers by Czech clubs, by year m 3m 15m m Number of transfers Outgoing Incoming Value of transfers Receipts Spending
19 Spending almost doubled compared with 216 (USD 9.5 million) and was more than seven times larger than in 215 (USD 2.6 million). While the total number of incoming transfers (117 in 217) remained in line with the average of previous years, 35 of these transfers involved transfer fees: almost twice as many as the 19 in 216. Receipts have also continued to grow in recent years, and are notably higher than spending: in 217, Czech clubs released players for a total of USD 36.2 million. Hungary (UEFA) Hungarian clubs spent USD 7.1 million in 217, meaning Hungary ranks 35th in clubs spending worldwide. Unlike in Japan and Czech Republic, spending in Hungary only took off last year, with a 414% increase from USD 1.4 million in 216. The number of incoming transfers in remained relatively in line with that of the previous three years, but the number of those transfers which involved a transfer fee saw a significant jump from 13 in 216 to 31 in 217. Prior to last year, transfers to Hungary for fees above USD Fig. 21: Number and value of international transfers by Hungarian clubs, by year m 1m 5m m Number of transfers Incoming Outgoing Value of transfers Receipts Spending , were extremely rare; in 217 alone, there were nine such transfers. It is too early to tell whether these developments represent the early stages of a period of bolstered transfer activity by Hungarian clubs, or whether spending will quickly retreat to its previous levels, but there are two indications that suggest the former rather than the latter. Firstly, the spending increase was driven by the activity of almost a dozen different clubs, rather than - as is often the case - by a small concentration of clubs completing a few lucrative transfers. Secondly, transfer fee receipts by Hungarian clubs have also grown continuously and are still higher than spending: an indication, perhaps, that clubs are reinvesting the money they received from their outgoing transfers in the past, making further sustainable growth a distinct possibility. There is no doubt that the proportional impact of these three member associations on global spending is limited when compared with those associations at the top of the ladder. However, all three appear to have kickstarted a process of growth in terms of their presence in the international transfer market, and it is possible that some of them may take a more significant role in the future.
20 Releasing Fig. 22: Club spending on transfer fees by confederation in 217 and percentage change from 216 In USD million Engaging AFC CAF CONCACAF CONMEBOL OFC UEFA AFC 35.3 (-5.9%).4 (+258.5%).3 (n/a) 8.8 (-4.8%) (.%) 75.3 (+82.3%) CAF 11.4 (-44.8%) 1.5 (-36.1%) 1.8 (+235.9%) (.%) (.%) 34.2 (-13.7%) CONCACAF 3.6 (-9.3%) (.%) 11.8 (+12.2%) 19.3 (-1.1%) (.%) 5.2 (+192.4%) CONMEBOL 55.1 (-33.4%) 3.9 (+19,51.%) 75.7 (+25.5%) 71.5 (-29.5%) (.%) (+22.8%) OFC (.%) (.%) (.%) (.%) (.%) (.%) UEFA (-22.%) 1.4 (-32.%) 63.7 (+51.8%) 8.2 (+59.%) (.%) 4,958.6 (+43.6%)
21 Fig. 23: Top 15 member associations by club spending on incoming transfers in 217 and change from 216 Top 15 associations by spending Fig. 24: Top 15 member associations by club receipts from outgoing transfers in 217 and change from 216 Top 15 associations by receipts Fig. 25: Top 15 transfer streams by value in 217 and change from 216 Top 15 transfer streams by value Spending (USD million) Receipts (USD million) Releasing association Engaging association Spending (USD million) England 1,643.6 (+19.7%) France (+314.%) Spain 73.3 (+43.2%) Germany (+25.2%) Italy 654. (+28.6%) China PR (-36.7%) Turkey (+141.5%) Russia 15. (+3.7%) Belgium 128. (+28.3%) Netherlands 96.7 (+187.6%) Portugal 95.8 (-46.2%) Wales 89.8 (+51.2%) Mexico 83.7 (+7.4%) Brazil 71.9 (-15.7%) USA 68.7 (+156.5%) Spain 84.4 (+51.6%) Portugal 83.3 (+91.7%) England (+19.5%) France (+41.4%) Italy 58.3 (+4.5%) Germany (+34.9%) Brazil (+12.6%) Netherlands (+96.1%) Belgium (+92.%) Argentina 24. (+33.2%) Turkey 12.2 (+17.8%) Wales 11. (+15.4%) Russia 88. (-52.3%) Greece 85.1 (+81.%) Austria 77.1 (+33.3%) France England (+47.8%) Portugal England (+316.3%) Spain France (+443.%) Italy England (+2.9%) Germany Spain (+819.5%) Spain England (-12.9%) Portugal Spain (+138.2%) Netherlands England 13.4 (+272.7%) Spain Germany (+15.2%) England Italy (+12.2%) France Germany 112. (+2.3%) England Spain 11.5 (+399.2%) England France 12.6 (+746.4%) France Italy 97.3 (+726.3%) England China PR 94.3 (+74.3%)
22 Fig. 26: Top 15 member associations by net club spending in 217 Top 15 associations by net club spending* Net spending (USD million) England Germany China PR 227. France Italy USA 66.3 Russia 61.9 Turkey 57.1 India 36.3 Japan 3.5 Saudia Arabia 24.1 Scotland 12.9 Mexico 7.7 Azerbaijan 4.7 Angola 3.9 *Spending > receipts Fig. 27: Top 15 member associations by net club receipts in 217 Top 15 associations by net club receipts* Net receipts (USD million) Portugal 77.5 Brazil Netherlands Argentina Spain 11. Belgium 87.9 Austria 62.6 Ukraine 59.3 Croatia 51.8 Sweden 37.5 Greece 36.8 Switzerland 36. Uruguay 35.1 Poland 25.6 Serbia 23.6 *Receipts > spending Fig. 28: Spending by type of fee in 217 Spending by type of fee (USD million) Fixed fees 4,817.3 Conditional fees 1,35.5 Release (buy-out) fee Solidarity contribution 63.8 Training compensation 2.3 Total 6,366.
23 Fig. 29: Top 5 member associations of each confederation by club spending on transfer fees in 217 AFC CAF CONCACAF Spending (USD mill.) Spending (USD mill.) Spending (USD mill.) China PR (-36.7%) Japan 37.6 (+42.7%) India 36.3 (+41,153.2%) Saudi Arabia 31.9 (+52.7%) Egypt 4.9 (+5.6%) Angola 3.9 (+1,359.4%) South Africa 3.9 (+239.5%) Tunisia 1.5 (-27.%) Mexico 83.7 (+7.4%) USA 68.7 (+156.5%) Canada.9 (-89.6%) Costa Rica <.1 (-47.6%) United Arab Emirates 18.4 (-38.4%) Algeria.5 (n/a) Guatemala <.1(n/a) Others 15.2 Total (-23.4%) Others 1.5 Total 16.3 (+63.5%) Others <.1 Total (+35.3%) CONMEBOL OFC UEFA Spending (USD mill.) Spending (USD mill.) Spending (USD mill.) Brazil 71.9 (-15.7%) Colombia 44.3 (+1,59.7%) Argentina 41.9 (-31.7%) Paraguay 8.6 (+653.9%) Ecuador 3.2 (+127.1%) Others 9.9 Total (-1.5%) Total. (.%) England 1,643.6 (+19.7%) France (+314.%) Spain 73.3 (+43.2%) Germany (+25.2%) Italy 654. (+28.6%) Others 982. Total 5,591.4 (+42.%)
24 Fig. 3: Top 5 member associations of each confederation by club receipts from transfer fees in 217 AFC CAF CONCACAF Receipts (USD mill.) Receipts (USD mill.) Receipts (USD mill.) China PR 58.9 (+463.6%) United Arab Emirates 22.7 (+19.4%) Korea Republic 13.5 (-8.8%) Saudi Arabia 7.9 (+62.5%) Japan 7. (-62.%) Others 1. Total 12. (+36.2%) Egypt 11.6 (-45.7%) South Africa 8.2 (+311.3%) Morocco 6.8 (+115.8%) Ghana 4.7 (-3.9%) Nigeria 4.2 (-5.7%) Others 22.6 Total 58. (-15.5%) Mexico 75.9 (+192.9%) Honduras 3.4 (-7.9%) USA 2.4 (-85.2%) Costa Rica 1.4 (-41.2%) Panama 1. (-62.%) Others.7 Total 84.8 (+59.8%) CONMEBOL OFC UEFA Receipts (USD mill.) Receipts (USD mill.) Receipts (USD mill.) Brazil (+12.6%) Argentina 24. (+33.2%) Colombia 64.7 (-4.%) Uruguay 38.1 (-51.3%) Chile 25.8 (+79.3%) Others 48.1 Total (+7.9%) Total. (.%) Spain 84.4 (+51.6%) Portugal 83.3 (+91.7%) England (+19.5%) France (+41.4%) Italy 58.3 (+4.5%) Others 1,972.3 Total 5,423.6 (+37.%)
25 Fig. 31: Transfers involving intermediaries representing the engaging club Engaging club intermediaries Worldwide by year Fig. 32: Transfers involving intermediaries representing the releasing club Releasing club intermediaries Worldwide by year Fig. 33: Intermediary commissions paid by clubs in the context of international transfers Club intermediary commissions Worldwide by year Transfers As % of incoming transfers Transfers As % of outgoing transfers* Commissions (USD million) % % % 216 1, % 217 1, % Top 5 countries in 217* % % % % % Top 5 countries in 217** Top 5 countries in 217* Transfers As % of incoming transfers Transfers As % of outgoing transfers* Commissions (USD million) Italy % Indonesia 34 4.% England % Denmark % Myanmar % China PR % Germany % Russia % France % Turkey % England Italy 76.5 Germany 48.8 France 42. Spain 41. *Minimum 5 transfers with intermediaries *Excluding transfers out of contract, as there is no releasing club involved **Minimum 5 transfers with intermediaries


26
27 One in every five international transfers involve players from Brazil, Argentina or Colombia. In total, 13,415 professional players from across the world were involved in the 15,624 international transfers completed in 217. They ranged from 15 to 44 years old and represented 181 different nationalities 1. As in previous years, players from South America played a decisive role in the transfer market: Brazilians, Argentinians and Colombians are, respectively, the first, second and fourth most transferred nationalities (see figure 42 for a ranking of the top 15). In 217, there were 3,173 international transfers of players of these three nationalities combined, which corresponds to 2.3% of all transfers completed during the year. In this section we analyse and compare last year s transfer patterns of players from each of these three countries. While they are similar in certain aspects, a closer look reveals some interesting differences. Brazilians Brazilians are by far the most represented nationality in the transfer market. Players from Brazil were involved in 1,755 transfers in more than a tenth of the total worldwide - and generated USD 1.6 billion in transfer fees. Of these transfers, 719 were Brazilians transferring out of Brazil, 616 transferring into Brazil, and 42 were transfers of Brazilians between clubs of other member associations. Players with Brazilian passport appear to be widely dispersed all over the globe. In 217 alone, clubs in 93 of the 211 FIFA member associations engaged at least one Brazilian. Those that welcomed the most Brazilian players - excluding Brazil itself - are Portugal (213 incoming transfers), Japan (57) and Thailand (44). As shown in figure 34, more than eight of every ten Brazilians who left Brazil in 217 moved to clubs in either UEFA (57.4%) or the AFC (26.8%), while comparatively few remained within CONMEBOL (4.6%). Those who transferred to UEFA clubs were on average younger and moved out of contract less Fig. 34: Transfers of Brazilian players out of Brazil in 217 % of transfers out of contract 1% 9% 8% 7% 6% 5% Brazilians leaving Brazil To CAF To CONCACAF To UEFA To CONMEBOL To AFC 4% Average player age 1 The player s first nationality as declared in ITMS
28 frequently (the global average is 65.5%), tending to be more the subject of loans and permanent transfers instead. Argentinians Players holding an Argentinian passport were the second most transferred nationality in 217. They were involved in 853 transfers generating spending for a grand total of USD 33. million. Of these transfers, 225 were out of Argentina, 368 into Argentina, and 26 between clubs of other member associations. In total, clubs from 64 of the 211 FIFA member associations engaged at least one player of Argentinian nationality. The associations with the most incoming transfers involving Argentinians - aside from Argentina - were Chile (67 incoming transfers), Mexico (67), Ecuador (37) and Spain (37). Figure 35 helps identify some of the transfer patterns of players from Argentina in 217, and Fig. 35: Transfers of Argentinian players out of Argentina in 217 % of transfers out of contract 1% 9% 8% 7% 6% 5% Argentinians leaving Argentina To CAF To CONMEBOL To UEFA sheds light on a few similarities and differences with those of players from Brazil. Like Brazilians, Argentinians who left their country of origin for European clubs tended to be younger than their compatriots who transferred to other confederations. Also, a relatively lower To AFC To CONCACAF 4% Average player age percentage of those transfers to Europe was out of contract. Another similarity is that players who moved to Asian clubs were on average older. However, unlike Brazilians, relatively few Argentinians moved to the AFC (5.2%), with most of them opting to remain within CONMEBOL (53.5%). Colombians Colombian players rank fourth by involvement in international transfers in 217. They were the subject of 565 transfers (+2.5% vs. 216), generating spending for a total USD 39.5 million. Of these transfers, 289 were out of Colombia, 124 into Colombia, and 152 between clubs of other associations. Clubs from 55 of the 211 FIFA member associations engaged at least one Colombian player in 217. The most common destinations - excluding Colombia - were Venezuela (74 incoming transfers), Panama (37) and Brazil (3).
29 As shown in figure 36, transfer patterns of Colombian players leaving Colombia are perhaps more similar to those of Argentinians. For instance, most Colombian players leaving their home country in 217 remained within CONMEBOL (43.3%). Perhaps the main difference, however, is that CONCACAF Fig. 36: Transfers of Colombian players out of Colombia in 217 % of transfers out of contract 1% 9% 8% 7% 6% Colombians leaving Colombia To CONCACAF To CONMEBOL To AFC (37.4%) was almost as common a destination, meaning only a small proportion of outgoing transfers involving Colombian players were overseas. The data demonstrates that players from Brazil, Argentina and Colombia have an undeniably strong presence in the international transfer market. What emerges from this brief analysis is that while their transfer patterns share many common traits - for example, those who leave their home country to transfer to European clubs tend to be younger and those who transfer to Asian clubs tend to be older - there also are some key differences, especially when it comes to their destinations. 5% To UEFA 4% Average player age
30 Fig. 37: Number of international transfers in 217 by player age Number of transfers Fig. 38: Type of international transfers in 217 by player age Type of transfer Player age Transfers Player age Out of contract Permanent Loans Returns from loan <18 years old* years old 6, years old 6, years old 2, years old 127 <18 years old* years old 3,331 1,45 1, years old 4, years old 1, years old Fig. 39: Percentage of international transfers with fees in 217 by player age Percentage of transfers with fees Fig. 4: Spending on transfer fees in 217 by player age Spending on transfer fees Fig. 41: New contract duration in 217 by player age New contract duration Player age % Player age USD million Player age Average duration <18 years old* 59.8% years old 19.3% years old 14.3% 3-35 years old 7.% <18 years old* years old 2, years old 2, years old <18 years old* 27 months years old 25 months years old 18 months 3-35 years old 14 months 35 years old 3.1% 35 years old years old 1 months *Transfers only occur after approval of the respective minor application by a single judge of the FIFA Players Status Sub-committee
31 Fig. 42: Top 15 most internationally transferred nationalities in 217 and percentage change from 216 Top 15 nationalities by number Nationality Transfers Brazilian 1,755 (+6.6%) Argentinian 853 (-7.4%) British 695 (+3.6%) Colombian 565 (+2.5%) French 555 (+4.1%) Spanish 454 (+.9%) Fig. 43: Top 15 nationalities by value in 217 and percentage change from 216 Top 15 nationalities by value Nationality Spending (USD million) Brazilian 1,55. (+77.1%) French 93.4 (+73.2%) Portuguese (+65.6%) Spanish (+1.5%) Dutch (+143.5%) Colombian 39.5 (+58.9%) Fig. 44: International transfers involving intermediaries representing the player Player intermediaries Worldwide by year Transfers Top 5 player nationalities in 217 As % of transfers 213 1, % 214 2,5 15.6% 215 1, % 216 2, % 217 2, % Nigerian 431 (+3.4%) Argentinian 33. (-5.1%) Transfers As % of transfers Uruguayan 48 (-1.9%) Serbian 389 (+1.%) Ghanaian 375 (+35.4%) Dutch 327 (+39.1%) Croatian 323 (+5.2%) Portuguese 294 (+1.9%) Ukranian 294 (+8.5%) German 238 (+17.9%) Italian (+32.6%) Belgian (+8.7%) German (-31.5%) Swedish (+267.1%) British (+36.7%) Nigerian 15.6 (+6.4%) Swiss 86.9 (-33.6%) Danish 85.7 (+27.2%) Danish % Norwegian % Dutch % Czech % USA %

32

33 Introduction Article 1 of Annexe 2 of the FIFA Regulations on the Status and Transfer of Players (RSTP) requires that the International Transfer Matching System (ITMS) must also be used in the context of so-called minor applications. The term minor indicates a player - female or male - who has not yet reached the age of 18, while application refers to the submission of a request through ITMS by the engaging member association for one of two instances: 1. International transfer: a minor of any nationality who has previously been registered with a club at one association is registered with a club at a new association. 2. First registration: a minor who has never previously been registered with a club and is not a national of the country in which he/she wishes to be registered for the first time. As a general rule, international transfers and first registrations of foreign players are only permitted if the player is over the age of 18. However, there are exceptions to this rule. The first three exceptions and the so-called 5- year-rule are outlined in the FIFA RSTP 1, and can be summarised as follows: a) the parents of the player moved to the new country for reasons not linked to football; b) the player is aged between 16 and 18 and is moving within the territory of the EU/EEA; c) both the player s domicile and the new club are within 5km of their common borders and the distance between the two is under 1km; d) the player has lived continuously for at least the last five years in the country of intended first registration prior to the request. Fig. 45: Minor applications decided upon, by year of creation Approved 1,5 1,747 1,845 12% 14% 2,189 1% Rejected 13% 11% 9% 87% 89% 88% 2,743 15% 85% 2,917 3,312 12% 88% 12% 88% With high reservation and under very specific circumstances only, two additional exceptions are recognised by FIFA 2 for certain groups of minor players based on jurisprudence, and can be summarised as follows: e) the player moving due to humanitarian reasons without his/her parents could not be expected to return to his/her country of origin ( unaccompanied refugee player ); f) the player's education was clearly the primary reason for the move without his/her parents and the duration did not exceed one year ( exchange student player ). Number of minor applications Of all minor applications created in 217, 3,312 have been decided upon to date, meaning they were either approved or rejected by a single judge of the FIFA Players Status Sub- Committee. It is important to note that this number is subject to change, based on the daily decisions of the Sub-Committee which reviews each application individually, and taking into account that certain cases may require more 1 See FIFA RSTP, art. 19, par. 2, 3 and 4 and FIFA Circular letter # See FIFA Minor player application guide (

 Humanitarian reasons (without parents)")
34 time than others. Therefore, some applications that are submitted in a given year may be approved or rejected in the following year. Reasons Of the 3,312 applications created in 217 and decided upon, 52.1% were for international Fig. 46: Minor applications submitted in 217 and decided upon, by reason 47.6% 1.4% 2.8% 2.9% 1.4% 17.2% 17.7% Parents moved Over 16 moving within EU/EEA Player and club within 5km of border Five years rule Exchange students Humanitarian reasons (with parents) Humanitarian reasons (without parents) transfers and 47.9% for first registrations. Figure 46 breaks them down according to the reason selected by the engaging member association in its minor application in ITMS. In total, there are seven possible reasons: five correspond to points b) c) d) e) and f) in the previous page, and two differentiate whether or not the move described in exception a) was for humanitarian reasons. Player age As players get closer to the age of 18, there are more minor applications. The peak is for 16- year old players, which may be linked to two factors. Firstly, once a player turns 16, the exception in article 19, par. 2b of the FIFA RSTP can be applied, allowing minor players to move within the EU/EEA subject to certain conditions. Secondly, 16 is often the age when players can sign their first professional contract. Indeed, over a quarter of the applications for 16-yearolds are for players who transfer to play as professionals, a much higher rate than at any other age. Fig. 47: Minor applications submitted in 217 and decided upon, by player age Player sex 217 of the 3,288 minor applications (6.6%) concerned the movement of female players. Player status The overwhelming majority of minor applications concerned minors moving to play as amateurs (92.5%), while in only 7.5% of applications the minor was transferring as a professional 3. Player age 3 Due to the high numbers of first registrations and international transfers of minors at amateur level, the Players Status Committee may grant member associations the possibility of a «limited exemption» from the obligation to request authorisation via ITMS. By reducing the number of minor applications, the limited exemption facilitates the participation of minors in amateur football while maintaining transparency (cf. FIFA Circular letter #129)
35 Fig. 48: Top 15 member associations by number of minor applications submitted in 217 and decided upon Top 15 instructing associations Fig. 49: Top 15 player nationalities by number of minor applications submitted in 217 and decided upon Top 15 nationalities Minor applications % approved Nationality Minor applications % approved USA % England % Portugal % Hungary % Italy % Luxembourg % Germany % Netherlands % Slovenia % Spain % Cyprus % Qatar 87 1% Belgium % Wales % United Arab Em % British % French % Portuguese % Ukranian % USA % Brazilian % German % Dutch % Spanish % Italian % Romanian % Canadian % Belgian % Croatian % Greek %
36 General disclaimer The information contained in this report is based on individual transaction data provided directly by football clubs in ITMS. FIFA assumes no responsibility for the accuracy, completeness and reliability of the information provided by the clubs. With regards to technical references possibly included in the present report, please be advised that in the event of any contradiction between the contents of this report and the actual text of the relevant regulations, the latter shall always prevail. Equally, the contents of this report may not alter existing jurisprudence of the competent decisionmaking bodies and is without prejudice to any decision which the said bodies might be called upon to pass in the future. Due to the nature of the TMS database, the presence of pending transfers, the potential cancellation of transfers, and data correction, numbers may differ from one report to another. In the event of any contradiction between the content of this report and other publications by FIFA and/or FIFA TMS, the most recent shall always prevail. All information contained herein is exclusively owned by FIFA, except as otherwise provided herein. The reproduction of any such images, trademarks, text or any and all content (even partially) is strictly prohibited unless express prior approval is obtained from FIFA and/or the author of such works (as the case may be). Any views expressed in this report do not necessarily reflect those of FIFA. Source of data The source of all data and information (unless explicitly indicated differently) is: FIFA TMS Global Transfers & Compliance Zollikerstrasse 226, 88 Zurich, Switzerland Methodological approach Data provided in the report only concern international transfers of professional male football players within the scope of 11-a-side football. Transfer data has been analysed for all completed transfers between 1 October 21 and 31 December 217. All data has been extracted from TMS on 29 January 218. All information on transfer fees and intermediary commissions is automatically converted into US dollars on the basis of conversion rates as of the day of the transfer s first registration in ITMS. Spending/receipts by association refers to spending or receipts on transfer fees by clubs belonging to a specific association. Numbers in the report are rounded. Transfers are allocated to a certain calendar year according to the date when they reach the status of ITC request in ITMS, irrespective of the date of their first entry. Data protection The data contained in TMS and in this review is covered by Swiss data protection law. Those associations whose names appear in this report have expressly authorised FIFA to disclose information concerning their transfers for reporting purposes.

37
251 engaging and releasing club. 625 only releasing club. 236 all sides. 9,757 only player. 12,604 transfers
 1 This report offers a summary of the involvement of intermediaries in international 1 transfers completed in FIFA s International Transfer Matching System (ITMS) since 1 January 2013. Typically, three
Engaging. 503 transfers. 1,263 transfers. Big 5. USD 2,550 million. USD 461 million. Releasing. 1,126 transfers. 5,509 transfers. RoW.
 Releasing Introduction Since October 2010, all transfers of professional players in eleven-a-side football between clubs of different FIFA member associations must be processed via FIFA s International
195 engaging and releasing club. 479 only releasing club. 166 all sides. 8,025 only player 10,282
 1 Introduction This report offers an extensive overview of the involvement of intermediaries in all international transfers 1 completed in FIFA s International Transfer Matching System (ITMS) since 1 January
Although only 15.0% of the transfers involved a fee, global spending on transfer fees 2 during this one month period was USD 1.28 billion.
 Releasing Receiving Introduction Since October 2010, all transfers of professional football players between clubs of different FIFA member associations must be processed via FIFA s International Transfer
Total transfers: 577. Total spending: USD 493,235. Transfers and spending. Introduction
 Introduction The International Transfer Matching System (ITMS) is a mandatory platform designed exclusively for member associations and their affiliated professional football clubs to conduct international
Portuguese, English, and. Bulgarian, English, French, or
 Country Language Fiber Content Algeria Arabic Angola Portuguese, English, and French (optional) Optional Argentina Spanish Armenia Armenian Optional Australia English Austria German Bahrain Arabic or English
Commemorative Books Coverage List
 Commemorative Books Coverage List England International Football 2018 Date of Paper Pages Event Covered (Daily Mirror ) 3 Apr 1905 Pages 8 and 14 England 1 Scotland 0 (Home Championship) 5 Apr 1909 Page
IBSA Goalball World Rankings 31 December 2017 Men's Division
 IBSA Goalball World Rankings 31 December 2017 Men's Division Rank No v Oc t Se p Au g Ju l Team Region Score Goal Diff Results Gol p Gme Last Plyd Weight 1st 5 6 6 1 2 Brazil Americas 661.802 4.564 0.872
USTA Player Development 2017 Excellence Grant Criteria Jr Girls, Collegiate & Professional Players
 USTA Player Development 2017 Excellence Grant Criteria Jr Girls, Collegiate & Professional Players In order to encourage the development of U.S. players we have designed USTA Player Development Excellence
I. World trade in Overview
 I. Table I.1 Growth in the volume of world merchandise exports and production by major product group, 1995-3 ( change) 1995-21 22 23 World merchandise exports 7. -.5 3. 4.5 Agricultural products 3.5 2.5
January Deadline Analysis: Domicile
 January Deadline Analysis: Domicile Applicants by domicile at the 15 January deadline D.1.1 Applicants by domicile group UK EU (excluding UK) Not EU All domiciles 20% 10% -0% -10% -20% -30% -40% -50% 2009
June Deadline Analysis: Domicile
 June Deadline Analysis: Domicile Applicants by domicile at the 30 June deadline I.1.1 Applicants by domicile group Difference between cycle and 2017 cycle UK EU (excluding UK) Not EU All domiciles 10%
GLOBAL TRANSFER MARKET REPORT
 201515 GLOBAL TRANSFER MARKET REPORT 1 FOREWORD Welcome to the Global Transfer Market 2015 (GTM15) report, the fourth edition of the FIFA Transfer Matching System GmbH (FIFA TMS) annual review of the
WORLD CUP DATA ANALYSIS:
 WORLD CUP DATA ANALYSIS: A COMPREHENSIVE EVALUATION OF RESULTS FROM 1990 2014 Kyle Williams 3.5.2018 Kyle Williams @k2thedubs Page 1 Table of Contents the93rdminute.net Part I: Introduction & Evaluation
CIES Football Observatory Monthly Report Issue 31 - January The transfer of footballers: a network analysis. 1. Introduction
 CIES Football Observatory Monthly Report Issue 31 - January 2018 The transfer of footballers: a network analysis Drs Raffaele Poli, Loïc Ravenel and Roger Besson 1. Introduction Football offers a wide
Bisnode predicts the winner of the world cup 2018 will be...
 Bisnode predicts the winner of the world cup 2018 will be... The challenge 5 confederations 32 countries 8 groups 1 winner METHODOLOGY Predicting football results with machine learning We used machine
World Cup draw: quantifying (un)fairness and (im)balance
fairness and (im)balance") Bloomberg L.P., Quantitative Research Columbia University, Department of Mathematics NYU, Courant Institute of Mathematical Sciences Workshop on Fairness in Sports Ghent University, April 12, 2018 jguyon2@bloomberg.net,
Bloomberg L.P., Quantitative Research Columbia University, Department of Mathematics NYU, Courant Institute of Mathematical Sciences Workshop on Fairness in Sports Ghent University, April 12, 2018 jguyon2@bloomberg.net,
AREA TOTALS OECD Composite Leading Indicators. OECD Total. OECD + Major 6 Non Member Countries. Major Five Asia. Major Seven.
 Reference series Composite leading indicators OECD Composite Leading Indicators AREA TOTALS 7-03- 19 OECD Total 19 OECD + Major 6 Non Member Countries 19 Major Seven 19 Major Five Asia 19 Euro area 19
KINGDOM OF CAMBODIA NATION RELIGION KING 3
 KINGDOM OF CAMBODIA NATION RELIGION KING 3 TOURISM STATISTICS REPORT February 2018 MINISTRY OF TOURISM Statistics and Tourism Information Department No. A3, Street 169, Sangkat Veal Vong, Khan 7 Makara,
Student Nationality Mix for BAT Bath
 Student Nationality Mix for BAT Bath Country Total Saudi Arabia 16. Oman 11.8% Spain 10. China 10. Libya 7. Thailand 6. Korea (South) 6. France 3.9% Venezuela 3. Italy 2.9% Brazil 2. Turkey 2. Switzerland
IR-Pay Go Rates. There are three pricing groups for Pay Go rates for International Roaming as follows:
 IR-Pay Go Rates A. IR Pay Go Rate Summary There are three pricing groups for Pay Go rates for International Roaming as follows: Sr IR Pay Go Rate Group 1 Rs 2 2 2 2 Rs 10 10 10 3 Rs 50 600 25 Applicable
Relative age effect: a serious problem in football
 CIES Football Observatory Monthly Report Issue no. 10 - December 2015 Relative age effect: a serious problem in football Drs Raffaele Poli, Loïc Ravenel and Roger Besson 1. Introduction Numerous studies
European Values Study & World Values Study - Participating Countries ( )
") GESIS Data Archive for the Social Sciences http://www.gesis.org/en/home/ ASEP/JD Data Archive http://www.jdsurvey.net/jds/jdsurvey.jsp European Values Study & World Values Study - Participating Countries
GESIS Data Archive for the Social Sciences http://www.gesis.org/en/home/ ASEP/JD Data Archive http://www.jdsurvey.net/jds/jdsurvey.jsp European Values Study & World Values Study - Participating Countries
2018 Hearthstone Wild Open. Official Competition Rules
 2018 Hearthstone Wild Official Competition Rules 1 TABLE OF CONTENTS INTRODUCTION 3 APPLICABILITY OF RULES 3 PLAYER ELIGIBILITY 4 TOURNAMENT STRUCTURE 4 PRIZING 9 PLAYER CONDUCT 9 MISCELLANEOUS 9 2 1.
World Cup Trumps. Talk through the meaning of each piece of information displayed on the cards:
 World Cup Trumps Talk through the meaning of each piece of information displayed on the cards: Oxfam Education FIFA rankings How well FIFA rate the team depending on past performance. A low number means
Composition of the UNICEF Executive Board
 The dates reflect years of membership in the Executive Board and not necessarily terms of office. 1 Afghanistan 1960 1963; 1965 1967; 1977 1980 Albania 2012 2014 Algeria 1971 1974; 1982 1985; 2004 2006
THE WORLD COMPETITIVENESS SCOREBOARD 2011
 THE WORLD COMPETITIVENESS SCOREBOARD 2011 98.557 94.063 92.588 92.011 90.782 90.219 89.259 87.824 86.475 86.418 86.313 85.707 84.380 84.120 81.629 81.619 81.100 80.278 79.799 78.499 77.599 77.101 76.827
INTERNATIONAL STUDENT STATISTICAL SUMMARY Spring 2017 (Final)
") INTERNATIONAL STUDENT STATISTICAL SUMMARY Spring 2017 (Final) Prepared By: Mr. Jay Ward, Associate Director Office of International Programs San Francisco State University Non-Matriculated SP 17 SP 16
INTERNATIONAL STUDENT STATISTICAL SUMMARY Spring 2017 (Final) Prepared By: Mr. Jay Ward, Associate Director Office of International Programs San Francisco State University Non-Matriculated SP 17 SP 16
How predictable are the FIFA worldcup football outcomes? An empirical analysis
 Applied Economics Letters, 2008, 15, 1171 1176 How predictable are the FIFA worldcup football outcomes? An empirical analysis Saumik Paul* and Ronita Mitra Department of Economics, Claremont Graduate University,
Global Construction Outlook: Laura Hanlon Product Manager, Global Construction Outlook May 21, 2009
 Global Construction Outlook: Short-term term Pain, Long-term Gain Laura Hanlon Product Manager, Global Construction Outlook May 21, 2009 What This Means for You The world is set to be hit this year with
LOOKING AT THE PAST TO SCORE IN THE FUTURE
 SECTOR RESEARCH 2018 FIFA WORLD CUP: FRANCOPHONE TEAMS ARE THE FAVOURITES ACCORDING TO THE CRIF WORLD CUP SCORE CONTACTS Borja Monforte, Director- Head of International Operations Tel.: +34 93 122 36 90
CMMI Maturity Profile Report. 30 June 2017
 CMMI Maturity Profile Report 30 June 2017 Executive Summary Appraisals increased 14% 1 Jan 30 Jun 17 Companies who reappraise continue to increase, currently at 74% 10% of reported appraisals are high
Production, trade and supply of natural gas Terajoules
 Terajoules Table Notes Production includes quantities from other sources, which would include any quantities of biogas, LPG or manufactured gas blended with natural gas. Please refer to the Definitions
IFCPF Strategic Plan
 IFCPF Strategic Plan 2017-2020 IFCPF General Assembly 11 th November 2016 Sant Cugat History The sport of CP Football (formerly known as Football 7-aside) was created in 1978 in Edinburgh and has been
DEVELOPMENT AID AT A GLANCE
 DEVELOPMENT AID AT A GLANCE STATISTICS BY REGION 5. EUROPE 2018 edition All the data in this report are available at: http://www.oecd.org/dac/financing-sustainable-development/ 5.1. ODA TO EUROPE - SUMMARY
ESSA 2018 ANNUAL INTEGRITY REPORT
 ESSA 208 ANNUAL INTEGRITY REPORT EDITORIAL In 208, ESSA s monitoring and alert platform reported 267 alerts to the relevant sporting and/or regulatory authorities for investigation. As has been the trend
Foreign overnights in the Nordic countries 2015
 Foreign overnights in the Nordic countries 2015 Sources: Statistics Statistics Statistics Statistics July 2016 VISIT FINLAND STATISTICS Contents Foreign overnights in the Nordic countries.4 Overnights
FACT Sheet. FIFA Competition winners at a glance. Men s Competitions. FIFA World Cup (staged every four years)
") FIFA Competition winners at a glance Men s Competitions FIFA World Cup (staged every four years) 2022 Qatar 2018 Russia 2014 Brazil 32/64 2010 South Africa, Johannesburg 32/64 Netherlands Spain 0:1 AET
FIFA Competition winners at a glance Men s Competitions FIFA World Cup (staged every four years) 2022 Qatar 2018 Russia 2014 Brazil 32/64 2010 South Africa, Johannesburg 32/64 Netherlands Spain 0:1 AET
FIL Qualifying Event Proposal. Problem Statement. Proposal for voting at GA
 Problem Statement FIL World Events The FIL currently holds five World Events which take place in a 4-year cycle: Men s Lacrosse o Under-19 World Championship o World Championship o World Indoor Championship
Office of Institutional Research
 ri a l C ty Consistency Sim p li c it y Office of Institutional Research Place of Residence for International Students by Gender: Published October 2012 OIR Staff: Peggy Johnson - Associate Director Miriam
Full-Time Visa Enrolment by Countries
 Page 1 of 32 All Students Afghanistan Albania Algeria Andorra Antigua Argentina Armenia Australia Austria Azerbaidjan Bahamas Bahrain Bangladesh Barbados Belarus Belgium Belize Benin (Dahomey) Bermuda
Spain the FIFA World Cup s super team ; South America home of the 2014 superfan
 Cup-o-nomics JUNE 2014 Spain the FIFA World Cup s super team ; South America home of the 2014 superfan 1 EXECUTIVE SUMMARY Cup-o-nomics Super teams and superfans passion high ahead of World Cup Fans showing
Global Cable: Market trends & business models
 Global Cable: Market trends & business models Guy Bisson, Ampere Analysis January 2018 1 Cable TV penetration 2005: Cable TV drove market with multiple high penetration/low ARPU markets 90 80 70 Netherlands
Demography Series: China
 Demography Series: China April 9, 212 Dr. Edward Yardeni 16-972-7683 eyardeni@ Sailesh S Radha 83-786-1368 sradha@ Please visit our sites at www. blog. thinking outside the box Table Of Contents Table
Confidence through experience. Track record as of 30 June 2012
 Confidence through experience Track record as of 30 June 2012 Harvesting the full potential of wind Confidence is built through experience. During more than 30 years in the wind industry we have installed
Fact sheet on elections and membership
 Commission on Narcotic Drugs Commission on Crime Prevention and Criminal Justice Fact sheet on elections and membership States members of the CCPCJ and CND (and other functional commissions of the Economic
2018 FIFA World Cup Russia
 2018 FIFA World Cup Russia Global broadcast and audience summary Continue 2018 FIFA World Cup Russia Global broadcast and audience summary Click to select Methodology Match audience Global overview Consumption
DG AGRI DASHBOARD: CITRUS FRUIT Last update:
 8.000 7.000 6.000 5.000 4.000 3.000 2.000 1.000 0 1996 1997 1998 1999 2000 2001 2002 2003 2004 2005 2006 2007 2008 2009 2010 2011 2012 2013 2014 2015 2016 2017 Small citrus (group mandarines): clementines,
Max Sort Sortation Option - Letters
 Max Sort Sortation Option - Letters Western Europe Prices Product Code PS5 PS6 Austria* 0.330 7.550 0.330 7.400 Belgium* 0.370 3.700 0.370 3.540 Denmark* 0.620 5.350 0.620 4.215 Finland* 0.385 4.400 0.385
THE SPORTS POLITICAL POWER INDEX
 THE SPORTS POLITICAL POWER INDEX 2015 2017 Poul Broberg, pbr@dif.dk, Director of Public Affairs Mikkel Larsen, mla@dif.dk, Senior Policy Advisor, International Relations Lars Hestbech, lhe@dif.dk, Communications
Desalination From theory to practice People, Papers, Publications. Miriam Balaban EDS Secretary General
 Desalination From theory to practice People, Papers, Publications Gulf WSTA Europe EDS Miriam Balaban EDS Secretary General Europe and the Gulf Region The collaboration between our regions has had significant
October 23, 2015 FINAL STATISTICAL REPORT 2014/15
 C A L I F O R N I A D R I E D P L U M B O A R D 3840 Rosin Court Phone (916) 565-6232 Suite 170 Fax (916) 565-6237 Sacramento, CA 95834 www.californiadriedplums.org October 23, 2015 FINAL STATISTICAL REPORT
The 11th Korea Prime Minister Cup International Amateur Baduk Championship
 The 11th Korea Prime Minister Cup International Amateur Baduk Championship Buan County, South Korea We are pleased to announce that the 11 th Korea Prime Minister Cup (KPMC) will be held on the 3rd-9th
TABLE 1: NET OFFICIAL DEVELOPMENT ASSISTANCE FROM DAC AND OTHER DONORS IN 2012 Preliminary data for 2012
 TABLE 1: NET OFFICIAL DEVELOPMENT ASSISTANCE FROM DAC AND OTHER DONORS IN 2012 DAC countries: 2012 2011 2012 ODA ODA/GNI ODA ODA/GNI ODA Percent change USD million % USD million % USD million (1) 2011
FIFA Foe Fun! Mark Kozek! Whittier College. Tim Chartier! Davidson College. Michael Mossinghoff! Davidson College
 FIFA Foe Fun! Tim Chartier! Davidson College Mark Kozek! Whittier College Michael Mossinghoff! Davidson College Group E: Switzerland, Ecuador, France, Honduras. Switzerland is the top seed, based on FIFA
INVITATION WORLD 9 BALL CHAMPIONSHIP 2017 (W9BC)
") INVITATION WORLD 9 BALL CHAMPIONSHIP 2017 (W9BC) 5 th 14 th December 2017 We are pleased to inform you that the Qatar Billiards & Snooker Federation in Cooperation with the Qatar Olympic Committee, is
INVITATION WORLD 9 BALL CHAMPIONSHIP 2017 (W9BC) 5 th 14 th December 2017 We are pleased to inform you that the Qatar Billiards & Snooker Federation in Cooperation with the Qatar Olympic Committee, is
Worst economic crisis since WWII and lack of funds posing internal and external barriers to internationalisation
 Hot Topics Dr Janet Ilieva International Education Intelligence Unit Setting the context Worst economic crisis since WWII and lack of funds posing internal and external barriers to internationalisation
FACT Sheet. FIFA Competition winners at a glance. FIFA Men s Competitions. FIFA World Cup (staged every four years)
") FIFA Competition winners at a glance FIFA Men s Competitions FIFA World Cup (staged every four years) 2022 Qatar 32/64 2018 Russia 32/64 2014 Brazil, Rio de Janeiro 32/64 Germany Argentina 1-0 AET 2010
FIFA Competition winners at a glance FIFA Men s Competitions FIFA World Cup (staged every four years) 2022 Qatar 32/64 2018 Russia 32/64 2014 Brazil, Rio de Janeiro 32/64 Germany Argentina 1-0 AET 2010
Invitation to. The 36th World Amateur Go Championship in Bangkok. Outline
 Invitation to The 36th World Amateur Go Championship in Bangkok Outline 1. Tournament name : The 36th World Amateur Go Championship in Bangkok 2. Main Sponsor : CP ALL PUBLIC COMPANY LIMITED 3. Co-organizers
Chart Collection for Morning Briefing
 Chart Collection for Morning Briefing September 11, 2017 Dr. Edward Yardeni 516-972-7683 eyardeni@ Mali Quintana 4-664-1333 aquintana@ Please visit our sites at blog. thinking outside the box 4.6 4.4 4.2
CONTRIBUTING OIL RECEIVED IN THE CALENDAR YEAR 2016
 CONTRIBUTING OIL RECEIVED IN THE CALENDAR YEAR 2016 (as reported by ) INTRODUCTION The 1992 Fund Convention and the Supplementary Fund Protocol require that all s report each year to the Director of the
NairaBET.com s FIFA 2014 World Cup Markets
 NairaBET.com s FIFA 2014 World Cup Markets It s the world cup year once again and this summer would have football s most prestigious event unfolding in Brazil. The 20th edition of the FIFA world Cup, an
CIES Football Observatory Monthly Report Issue 33 - March A comparative analysis of club-trained players in Europe. 1.
 CIES Football Observatory Monthly Report Issue 33 - March 2018 A comparative analysis of club-trained players in Europe Drs Raffaele Poli, Loïc Ravenel and Roger Besson 1. Introduction The analysis of
2018 FIFA World Cup Schedule
 2018 FIFA World Cup Schedule All times and dates are in Australian Eastern Standard Time (AEST). While we at The Roar go to every effort to ensure this information is correct, you should always consult
New rules, new opportunities: a potential for growth
 #TV year New rules, new opportunities: a potential for growth June 19th, 2015 Jacques Balducci Eurodata TV Worldwide Deputy Sales Director Worldwide TV viewing remains strong World daily viewing time Average
NITROGEN CHARGING KIT type PC 11.1 E 04-11
 NITROGEN CHARGING KIT type PC 11.1 E 04-11 11.1.1 TECHNICAL DATA MAX OPERATING PRESSURE (PS): 600 BAR PRESSURE TEST (PT): 1.43 PS SCALE OF PRESSURE GAUGE: 4-10 - 16-25 - 60-100 - 250 (std.) - 400-600 bar
NITROGEN CHARGING KIT type PC 11.1 E 01-12
 NITROGEN CHARGING KIT type PC 11.1 E 01-12 11.1.1 TECHNICAL DATA MAX OPERATING PRESSURE (PS): 600 BAR PRESSURE TEST (PT): 1.43 PS SCALE OF PRESSURE GAUGE: 4-10 - 16-25 - 60-100 - 250 (std.) - 400-600 bar
2016 River Use Statistics -by Steve Sullivan
 Grand Canyon River Office 2016 River Use Statistics -by Steve Sullivan Topics River Use Statistics Overview Commercial River Use Statistics Noncommercial River Use Statistics Noncommercial River Lottery
OCEAN2012 Fish Dependence Day - UK
 OCEAN2012 Fish Dependence Day - UK Europeans are now so dependent on fish products originating from external waters that half the fish they consume are sourced outside the EU Fish dependence: The EU s
DEVELOPMENT AID AT A GLANCE
 DEVELOPMENT AID AT A GLANCE STATISTICS BY REGION 6. OCEANIA 2018 edition All the data in this report are available at: http://www.oecd.org/dac/financing-sustainable-development/ 6.1. ODA TO OCEANIA - SUMMARY
Global Economic Indicators: Global Growth Barometer
 Global Economic Indicators: Global Growth Barometer May 9, 2018 Dr. Edward Yardeni 516-972-7683 eyardeni@ Debbie Johnson 4-664-1333 djohnson@ Mali Quintana 4-664-1333 aquintana@ Please visit our sites
SA economic review Kevin Lings. August 2018
 SA economic review Kevin Lings August 2018 South Africa real GDP growth year-on-year %y/y 8 7 6 5 Ave 4.3% 4 Ave 2.5% 3 2 Ave 0.9% 1 0-1 -2-3 00 01 02 03 04 05 06 07 08 09 10 11 12 13 14 15 16 17 18 2
DG AGRI DASHBOARD: CITRUS FRUIT Last update:
 14 000 12 000 10 000 8 000 6 000 4 000 2 000 0 1996 1997 1998 1999 2000 2001 2002 2003 2004 2005 2006 2007 2008 2009 2010 2011 2012 2013 2014 2015 2016 Small citrus (group mandarines): clementines, satsumas
2018 FIFA World Cup Your advertising opportunities
 2018 FIFA World Cup Your advertising opportunities 1 13.12.2017 Facts about 2018 FIFA World Cup 2 13.12.2017 The most important facts on the road to Russia The 2018 FIFA World Cup will be held in Russia.
Market Correlations: Copper
 Market Correlations: Copper January 19, 2018 Dr. Edward Yardeni 516-972-7683 eyardeni@ Debbie Johnson 480-664-1333 djohnson@ Mali Quintana 480-664-1333 aquintana@ Please visit our sites at www. blog. thinking
Stockholm s tourism industry. November 2016
 Stockholm s tourism dustry. November 2016 Durg the month of November ca 1.1 million guest were recorded at commercial accommodations the county of Stockholm. This was an crease of 5 compared to November
The globalisation of sporting events: Myth or reality?
 Khalifa Stadium, Qatar. Photo: Igor Magic The globalisation of sporting events: Myth or reality? Søren Bang, Play the Game 203, 30 October 203 The globalisation of sporting events: Myth or reality? Photo:
GLOBAL BAROMETER OF HOPE AND DESPAIR FOR 2011
 GLOBAL BAROMETER OF HOPE AND DESPAIR FOR 2011 Volume 1: Statistical Report Findings based on responses from more than 64,000 scientifically selected cross-section of Men and Women from all socioeconomic
Stockholm s tourism industry. December 2016
 Stockholm s tourism dustry. December 2016 Durg the month of December ca 0.9 million guest were recorded at commercial accommodations the county of Stockholm. This was an crease of 12 compared to December
2019 Hearthstone Wild Open Official Competition Rules
 2019 Hearthstone Wild Open Official Competition Rules Version 1.2 1 Introduction 3 2019 Hearthstone Wild Open 3 Player Eligibility Requirements 3 Tournament Structure 4 Prizes 7 Player Conduct 8 Rule Infractions
Big data analytics for enrichment of rural area content tourism in Okhotsk sub-prefecture of Japan
 Big data analytics for enrichment of rural area content tourism in Okhotsk sub-prefecture of Japan Ali Bakdur, Fumito Masui, Michal Ptaszynski Kitami Institute of Technology, Dept. of Computer Science,
UEFA Nations League 2018/19 League Phase Draw Procedure
 Date and time: Wednesday, 24 January 2018 Place: Duration: Regulations: Participants: Objective: Seeding: Lausanne, Switzerland approx. 40 minutes for technical part Art. 12-13 of the competition regulations
III Jornada: Seminario de Derecho del Fútbol Nacional e Internacional. Universidad Rey Juan Carlos
 III Jornada: Seminario de Derecho del Fútbol Nacional e Internacional Universidad Rey Juan Carlos Madrid, 22 de febrero de 2014 FIFA Regulations on the Status and Transfer of Players Omar Ongaro, Head
Guy Bisson, Ampere Analysis
 Global Cable Trends: Poland s place in the world of cable Guy Bisson, Ampere Analysis October 2017 1 Multi-play RGUs (m) Globally, cable leads in multi-play subscriptions with over 800m multi-play RGUs
STATISTICAL INFORMATION BOOKLET 2017 As compiled by the Secretariat to the International Stud Book Committee
 isbc stat booklet _42833_Layout 1 21/09/2017 12:09 Page 1 THE INTERNATIONAL STUD BOOK COMMITTEE STATISTICAL INFORMATION BOOKLET 2017 As compiled by the Secretariat to the International Stud Book Committee
FINAL REPORT for Sports Tourism Report For the Year 2013
 FINAL REPORT for Sports Tourism Report For the Year 2013 Prepared for The Cyprus Tourism Orgaization September 201 CONTENTS Page 1. Main Findings 2 2. Appointment and Methodology 3. General Indicators:
Introductions, Middle East, Israel, Jordan, Yemen, Oman Week 1: Aug Sept. 1
 Introductions, Middle East, Israel, Jordan, Yemen, Oman Week 1: Aug. 28 - Sept. 1 ASSIGNMENT Monday Tuesday Wednesday Thursday Friday Due Wednesday pgs. 6-11 Do not start the workbook or study sheet assignments
AWARDED PROJECTS 2015, 2016, 2017, Countries awarded through the Sport Grant Programme
 AWARDED PROJECTS,,, Countries awarded through the Sport Grant Programme AWARDED PROJECTS BARBADOS Improving rally safety BELGIUM Purchase of officials safety equipment COLOMBIA Officials and drivers safety
Predicting the Markets: Chapter 15 Charts: Predicting Currencies
 Predicting the Markets: Chapter 15 Charts: March 3, 217 Dr. Edward Yardeni 516-972-7683 eyardeni@ Mali Quintana 48-664-1333 aquintana@ Please visit our sites at www. blog. thinking outside the box Table
24 November 2017, Nyon, Switzerland. 2017/18 UEFA European Women s Under-17 and Women s Under-19 Championships. Elite round draws
 November 07, Nyon, Switzerland 07/8 UEFA European Women s Under-7 and Women s Under-9 Championships Elite round draws DRAW PROCEDURE Elite rounds th UEFA European Women s Under-7 and 7th UEFA Women s Under-9
CIES Football Observatory Monthly Report Issue 20 - December The international mobility of minors in football. 1.
 CIES Football Observatory Monthly Report Issue 20 - December 2016 The international mobility of minors in football Drs Raffaele Poli, Loïc Ravenel and Roger Besson 1. Introduction Figure 1: leagues surveyed
OECD employment rate increases to 68.4% in the third quarter of 2018
 Paris, 17th January 2019 News Release: 3rd Quarter 2018 OECD employment rate increases to 68.4% in the third quarter of 2018 The OECD area employment rate the share of the working-age population with jobs
41th meeting of the Advisory Committee
 41th meeting of the Advisory Committee Marseille, France 8 July 213 OLIVE OIL BALANCES 211/12-212/13 OLIVE OIL 211/12 (final) (thousand tonnes) 212/13 (prov.) Starting stocks 773. 1.5 Production 3377.5
NEW COMMERCIAL VEHICLE REGISTRATIONS EUROPEAN UNION 1. July and August 2017
 PRESS EMBARGO: NEW COMMERCIAL VEHICLE REGISTRATIONS EUROPEAN UNION 1 July and August 2017 Next press release: Tuesday 24 October 2017 1 Data for Malta unavailable Page 1 of 12 Commercial vehicle registrations:
GRUPO CORTEFIEL is one of Europe s top fashion
 GRUPO CORTEFIEL is one of Europe s top fashion names operating in the specialised chain sector. Founded in Madrid in 1880, today it is present in 89* countries and has 1,982* points of sale. Cortefiel,
Update of trade weights data underlying the EERs and HCIs
 August 2017 Update of trade weights data underlying the EERs and HCIs The trade weights underlying the calculation of the effective exchange rates (EERs) of the euro and the harmonised competitiveness
Reality Math Dot Sulock, University of North Carolina at Asheville
 Reality Math Dot Sulock, University of North Carolina at Asheville Firearm Deaths 1. Making an Excel Pie Graph Firearm Deaths in US 2000 2011 suicides 16,586 19,766 homicides 10,801 11,101 unintentional
FACT Sheet. FIFA World Cup : seeded teams South Africa Germany Korea/Japan 2002
 FIFA World Cup : seeded teams 1930-2010 South Africa 2010 For sporting reasons the FIFA Organising Committee based the criteria to determine the seeding on the October 2009 FIFA/Coca-Cola World Ranking
2016/17 UEFA European Under-17 and Under-19 Championships Qualifying round draws. 3 December 2015, Nyon, Switzerland
 2016/17 UEFA European Under-17 and Under-19 Championships Qualifying round draws 3 December 2015, Nyon, Switzerland DRAW PROCEDURE Qualifying rounds 16th UEFA European Under-17 and Under-19 Championships,
2018 Daily Prayer for Peace Country Cycle
 2018 Daily Prayer for Peace Country Cycle Monday January 1, 2018 All Nations Tuesday January 2, 2018 Ghana Wednesday January 3, 2018 Nigeria Thursday January 4, 2018 Costa Rica Friday January 5, 2018 Turkmenistan