Community of Practice on Traumatic Brain Injury
|
|
|
- Karen York
- 5 years ago
- Views:
Transcription


1 Community of Practice on Traumatic Brain Injury Second Meeting October 15, 2013, 3:00-4:00 PM ET For audio, please call Your phone line is currently muted.

2 Today s Agenda Overview of TBI Data Systems & Components TBI Surveillance TBI Registry Discussion 2
3 Meeting Orientation Slide If you are having any technical problems joining the webinar please contact the Adobe Connect hotline at or Type any additional questions or comments into the Chat box on the left. 3
4 TBI Data Systems Why is data so important? Identify target populations Support Policy and Legislative Decision Measure the impact of programs and strategies Sustainability 4
5 TBI Data Systems: Components 1. Emergency Department Visit Data 2. Hospitalization Data 3. Death Data 5
6 National Average 2010 Emergency Department Visits: 681/100,000 Hospitalizations: 96.6/100,000 Fatal Traumatic Brain Injuries: 16.84/100,000 Source: 6
7 Fatal TBI By State ( ) Alabama Alaska Connecticut Delaware Iowa Kentucky Minnesota Missouri Nebraska New Jersey New Mexico New York North Carolina North Dakota Tennessee Source: 080/cdcMapFramework/ 7
8 TBI Data Systems: Gaps Existing TBIs are not captured TBI not resulting in ED visits are not captured TBI presenting at Indian Health Services, Veteran Health Services or other agencies, may not be captured 8
9 National TBI Data Sources CDC Fatal Injury Mapping Cost of Injury Reports Healthy People 2020 Indicators IVP HealthIndicators.gov 9
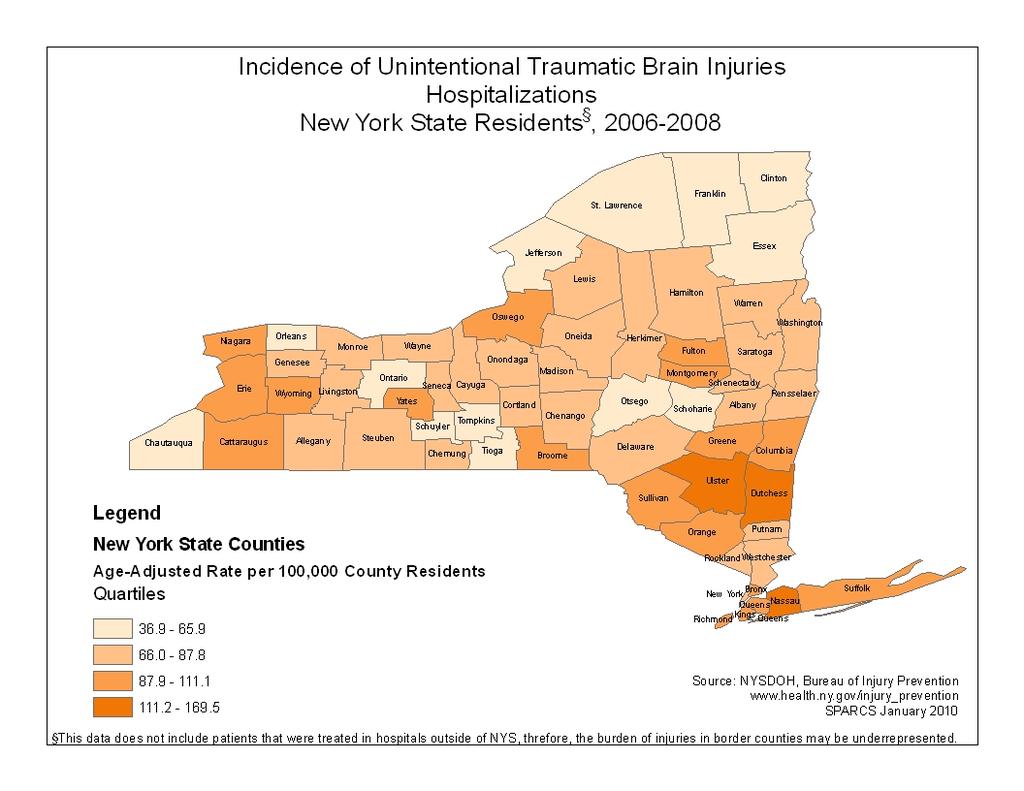
10 TBI Data Systems Registry v.s. Surveillance 10
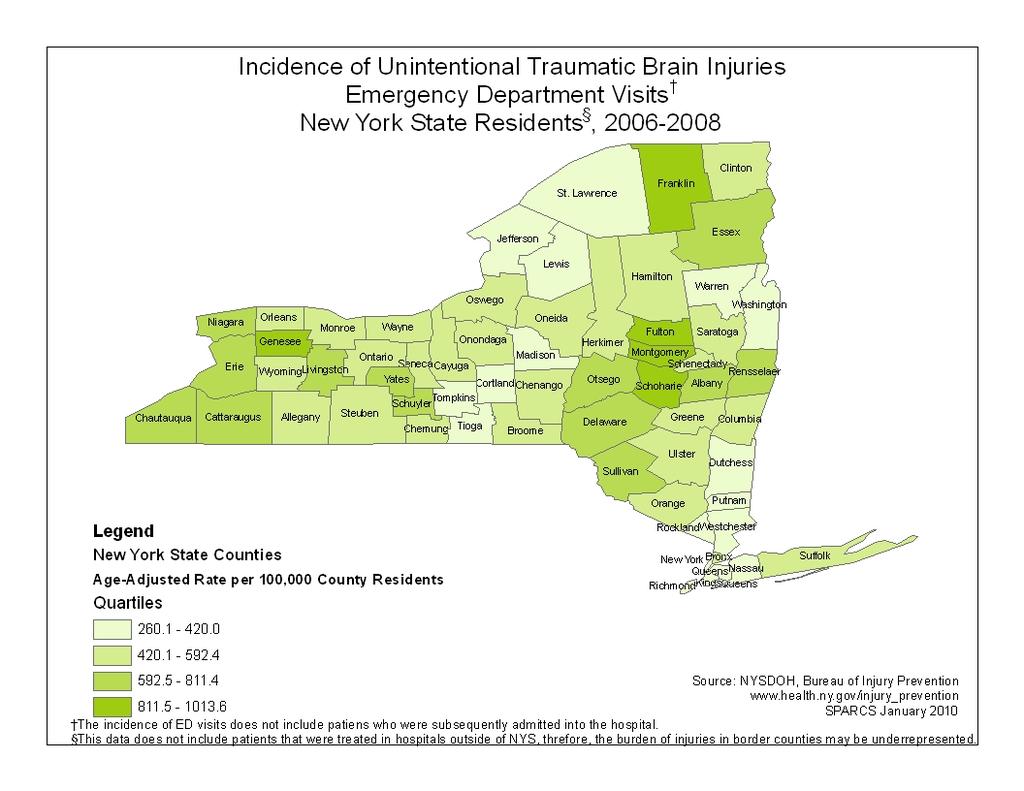
11 TBI Data Systems: Surveillance Definition: routine, ongoing collection of data about people who sustained a TBI Components: Data Collection Data Analysis Cost: In 2005 CDC provided $80,000 per year for TBI surveillance in 11 states Source: Traumatic Brain Injury in the United States: The Future of Registries and Data Systems 11
12 TBI Data Systems: Registry Definition: A collection of data about a particular group of people who share a common personal characteristic, for example, development of the same disease. (Feinstein 1998, p. 475) Components: Data collection Identification Linkage to Services Follow-up data collection Cost: Depends on the state and services. Ranges from estimates of $75,000 (Florida- just data collection), to $125,000 (Virginia) 12
13 TBI Data Systems: Surveillance New York Michael Bauer 13
14 THE EPIDEMIOLOGY OF TRAUMATIC BRAIN INJURIES IN NEW YORK STATE Michael Bauer, Sarah Sperry New York State Department of Health, Bureau of Occupational Health and Injury Prevention
15 Injuries are not Accidents Traumatic Brain Injuries are not random, uncontrollable acts of fate but rather occur: In highly predictable patterns With recognizable risk factors Among identifiable populations A TBI is a predictable and preventable event! This presentation will demonstrate some of these patterns in NYS.
16 Traumatic Brain Injury TBI data is like an iceberg. Death data is just the tip of the problem Hospitalization Discharge Data Emergency Department (ED) Visit Data Other medical treatment, or Untreated?


17 Traumatic Brain Injury - Hospitalizations New York State Residents, The rate of TBI hospitalizations have been increasing over time.


18 Traumatic Brain Injury - ED Visits New York State Residents, The rate of TBI ED Visits have increased each year since the data has been collected.
19 Gender Differences with TBI 73% of deaths were males Mean annual frequency male = 1,569 (16.7 per 100,000) Mean annual frequency female = 585 (5.9 per 100,000) 62% of hospitalized TBI patients were male Mean annual frequency male = 11,526 (122.7 per 100,000) Mean annual frequency female = 7,103 (71.2 per 100,000) 55% of ED Visits TBI patients were male Mean annual frequency male = 45,190 (481.1 per 100,000) Mean annual frequency female = 37,192 (373.0 per 100,000)
20
21
22 Traumatic Brain Injury- Charge Information New York State, Mean charge for hospitalizations = $37,839 Mean charge for non-tbi hospitalizations = $28,502 Mean length of stay = 7 days Yearly average hospitalization charges = $700 Million Mean charge for ED Visits = $1,909 Mean charge for non-tbi ED Visit = $1,044 Yearly average ED charges = $160 Million


23 Traumatic Brain Injury - Deaths New York State Residents, Early twenties and adults older than 65 have the highest rates.

24 Traumatic Brain Injury - Hospitalizations New York State Residents, Children less than one and adults older than 65 have the highest rates.


25 Traumatic Brain Injury - ED Visits New York State Residents, Children 0-4 and have the highest rates.
26 Deaths Due to Traumatic Brain Injury Leading Causes by Age Group New York State Residents, µ = Mean Annual Frequency Rank < Homicide µ=9 Homicide µ=9 * Homicide µ=3 Homicide µ=30 Homicide µ=54 Suicide µ=146 Suicide µ=152 Fall µ=504 2 * Pedestrian µ=3 * * Unspecified µ=20 Unspecified µ=34 Homicide µ=126 Fall µ=118 Suicide µ=98 3 * * * * Occupant µ=19 Suicide µ=31 Unspecified µ=45 Homicide µ=51 Pedestrian µ=53 4 * * * * Suicide µ=16 Occupant µ=21 Fall µ=43 Pedestrian µ=40 Unspecified µ=22 5 * * * * Fall µ=6 Fall µ=9 Motorcyclist µ=38 Unspecified µ=25 Occupant µ=21 6 * * * * Pedestrian µ=4 Pedestrian µ=8 Occupant µ=31 Occupant µ=24 Homicide µ=17 7 * * * * Pedestrian µ=3 Motorcyclist µ=7 Pedestrian µ=25 Motorcyclist µ=18 Pedestrian µ=6 8 * * * * * Transport, µ=3 Transport, µ=8 Pedestrian µ=12 Struck by / Against µ=3 9 * * * * * * Pedestrian µ=6 Poisoning µ=10 * 10 * * * * * * Unintentional MVT Other Unintentional Intentional Pedal Cyclists µ=6 Transport, µ=8 MVT^ = Motor Vehicle Traffic * Means less than 3 are not reported Source: NYSDOH, Bureau of Injury Prevention Vital Statistics Death Files May 2010 *
27 Hospitalizations Due to Traumatic Brain Injury Leading Causes by Age Group New York State Residents, µ = Mean Annual Frequency Rank < Fall µ=316 Fall µ=282 Fall µ=149 Fall µ=161 Occupant µ=435 Occupant µ=432 Fall µ=862 Fall µ=1,879 Fall µ=5,762 2 Assault µ=59 Struck By, Against µ=52 Pedestrian µ=67 Pedestrian µ=120 Assault µ=306 Assault µ=307 Occupant µ=830 Occupant µ=597 Occupant µ=407 3 Struck By, Against µ=22 Pedestrian µ=29 Struck By, Against µ=42 Struck By, Against µ=75 Fall µ=179 Fall µ=181 Assault µ=760 Assault µ=399 Pedestrian µ=224 4 Unspecified µ=22 Occupant µ=26 Occupant µ=35 Assault µ=67 Pedestrian µ=120 Pedestrian µ=99 Pedestrian µ=263 Pedestrian µ=299 Struck By, Against µ=93 5 Occupant µ=9 Assault µ=15 Pedal Cyclist, µ=25 Occupant µ=56 Struck By, Against µ=96 Motorcyclist µ=74 Motorcyclist µ=186 Motorcyclist µ=133 Unspecified µ=74 6 * Unspecified µ=9 Pedal Cyclist µ=14 Pedal Cyclist, µ=54 Transport, µ=72 Transport, µ=41 Struck By, Against µ=114 Struck By, Against µ=106 Assault µ=70 7 * Transport, µ=5 Transport, µ=13 Pedal Cyclist µ=51 Pedal Cyclist µ=42 Struck By, Against µ=35 Transport, µ=106 Pedal Cyclist, µ=72 Transport, µ=37 8 * Pedestrian, µ=3 Assault µ=8 Transport, µ=26 Motorcyclist µ=37 Pedal Cyclist µ=28 Pedal Cyclist µ=73 Transport, µ=69 Unspecified µ=25 9 * Pedal Cyclist, µ=2 Pedestrian, µ=3 Unspecified µ=6 Pedal Cyclist, µ=36 Pedal Cyclist, µ=18 Pedal Cyclists, µ=52 Pedal Cyclist µ=69 Pedal Cyclist, µ=17 10 * Natural, Environmental µ=2 * Motorcyclist µ=5 Unspecified µ=14 Unintentional MVT Other Unintentional Intentional Unspecified µ=12 Unspecified µ=43 Unspecified µ=66 Pedal Cyclist µ=15 MVT^ = Motor Vehicle Traffic *Means less than 2 are not reported Source: NYSDOH, Bureau of Injury Prevention SPARCS January 2010
28 ED Visits Due to Traumatic Brain Injury Leading Causes by Age Group New York State Residents, µ = Annual Frequency Rank < Fall µ=2,998 Fall µ=6,762 Fall µ=2,749 Struck By, Against µ=2,486 Struck By, Against µ=2,893 Assault µ=1,899 Fall µ=4,463 Fall µ=5,791 Fall µ=10,529 2 Struck By, Against µ=394 Struck By, Against µ=1,897 Struck By, Against µ=1,737 Fall µ=2,357 Assault µ=2,151 Fall µ=1,438 Assault µ=3,751 Struck By, Against µ=1,848 Struck By, Against µ=755 3 Unspecified µ=80 Unspecified µ=192 Occupant µ=272 Assault µ=793 Fall µ=2,147 Occupant µ=1,336 Struck By, Against µ=3,127 Occupant µ=1,464 Occupant µ=517 4 Occupant µ=35 Occupant µ=150 Pedal Cyclist, µ=216 Pedal Cyclist, µ=351 Occupant µ=1,467 Struck By, Against µ=1,233 Occupant µ=2,597 Assault µ=1,370 Unspecified µ=301 5 Assault µ=18 Pedal Cyclist, µ=80 Unspecified µ=108 Occupant µ=293 Transport, µ=235 Unspecified µ=165 Unspecified µ=491 Unspecified µ=371 Assault µ=151 6 Transport, µ=6 Pedestrian µ=46 Assault µ=102 Transport, µ=147 Pedal Cyclist, µ=212 Transport, µ=140 Transport, µ=286 Pedestrian µ=181 Pedestrian µ=108 7 Pedestrian µ=4 Transport, µ=30 Pedestrian µ=69 Unspecified µ=130 Unspecified µ=196 Pedestrian µ=81 Pedestrian µ=211 Transport, µ=180 Transport, µ=51 8 Natural, Environmental µ=2 Cut/Pierce µ=29 Transport, µ=68 Pedestrian µ=90 Pedestrian µ=101 Pedal Cyclist, µ=76 Pedal Cyclist, µ=190 Pedal Cyclist, µ=164 Unspecified µ=37 9 Overexertion µ=2 Assault µ=26 Cut/Pierce µ=21 Pedal Cyclist µ=45 Unspecified µ=68 Unspecified µ=73 Unspecified µ=182 Unspecified µ=104 Pedal Cyclist, µ=29 10 Pedal Cyclist, µ=2 Pedestrian, µ=16 Pedal Cyclist µ=19 Overexertion µ=18 Pedal Cyclist µ=57 Motorcyclist µ=56 Motorcyclist µ=124 Motorcyclist µ=77 Cut/Pierce µ=23 The incidence of Emergency Department visits does not include patients that were subsequently admitted into the hospital. Unintentional MVT Other Unintentional Intentional MVT^ = Motor Vehicle Traffic *Means less than 2 are not reported Source: NYSDOH, Bureau of Injury Prevention SPARCS January 2010

29 Percent of Deaths by Intent with Traumatic Brain Injury New York State Residents, All Ages,

30 Percent of Hospitalizations by Intent with Traumatic Brain Injury New York State Residents, All Ages,

31 Percent of ED Visits* by Intent with Traumatic Brain Injury New York State Residents, All Ages, *Does not include patients admitted into hospital
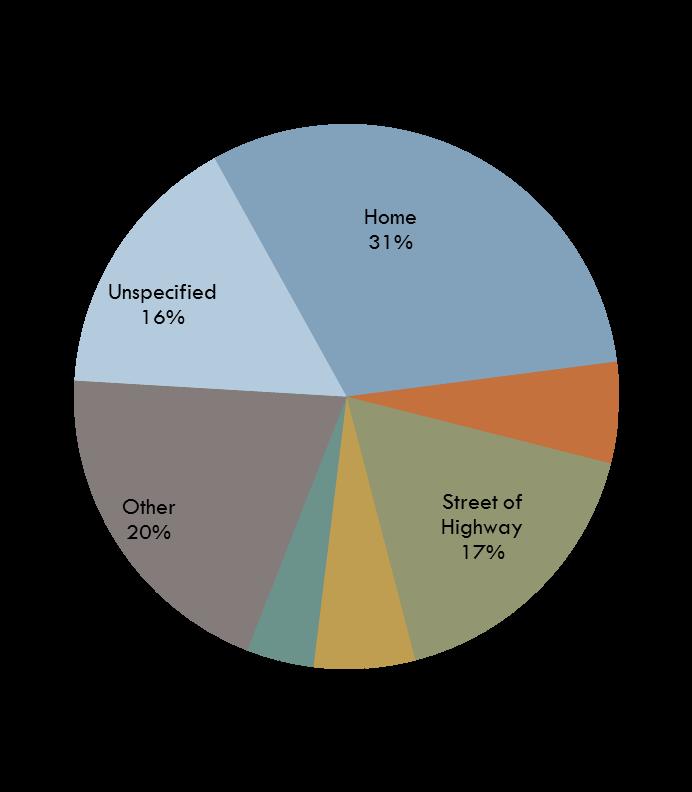
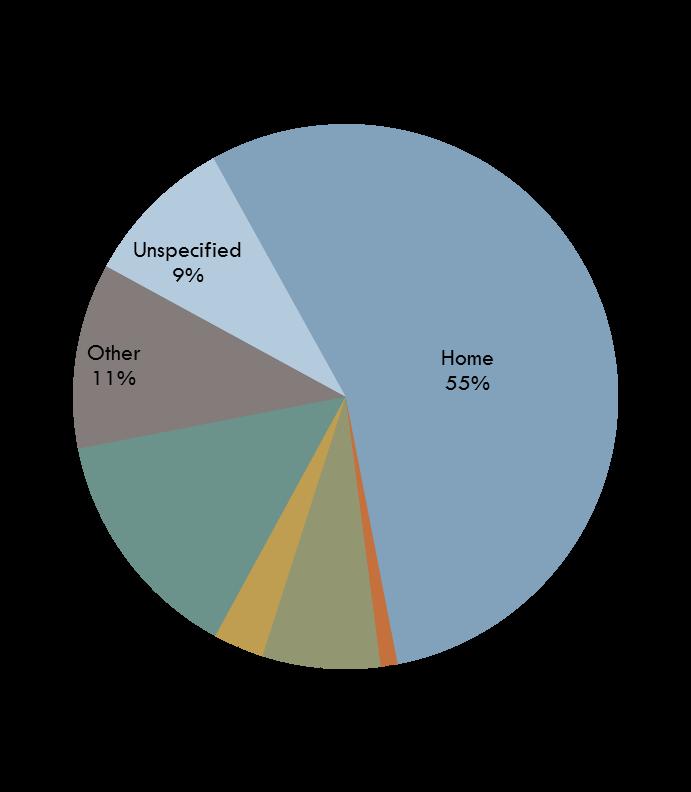
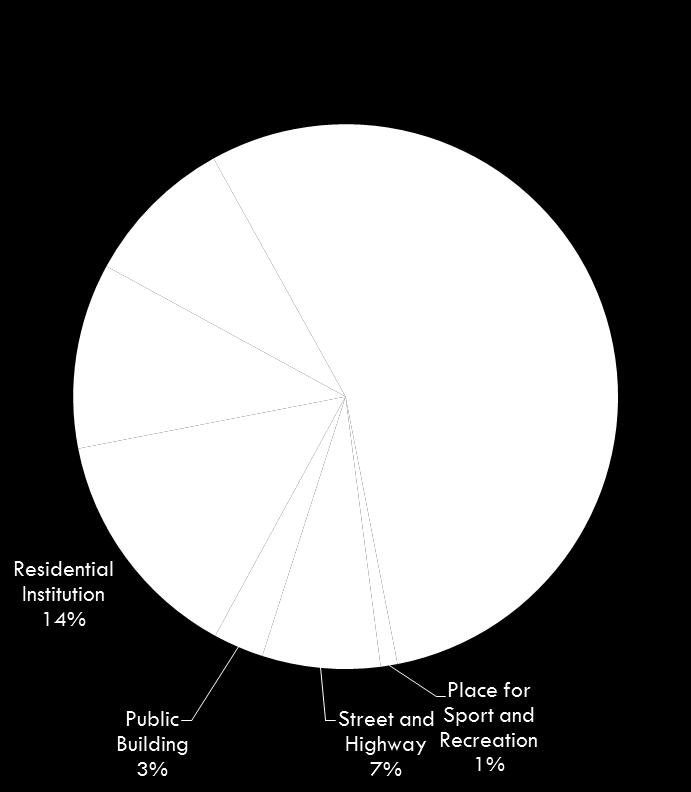
32 TBI Hospitalizations - Place of Injury NYS Residents, Ages 0-64 Years Ages 65+ Years
33 TBI Patient Hospital Discharge Location NYS Residents, Ages 0-64 Years Ages 65+ Years
34 NYS DOH, BOHIP Injury Surveillance System Crash Outcome Data Evaluation System (CODES) is a linked database Matches individual records from Accident Information System data to Pre-Hospital Care Report data Matches individual records from Accident Information System data to Hospital Discharge and Emergency Department data
35 Selected Risk Factors Crash Types and Contributing Factors Type of Crash or Contributing Factor Total Number of People Involved Number of People Hospitalized TBI (Percent of Hospitalizations) Alcohol-Related 20,255 1, % Speed-Related 68,762 2, % Driver Distraction 132,251 1, % Failure to Yield 106,273 1, % Following Too Closely Passing / Lane Violations Traffic Control Disregarded 116, % 51, % 31, %
36 Selected Risk Factors Traffic Injuries Role Types Type of Crash or Contributing Factor Total Number of People Involved Number of People Hospitalized TBI (Percent of Hospitalizations) Bicyclists 5, % Motorcyclists 5,845 1, % Motor Vehicle Occupants 719,548 8, % Pedestrians 16,415 1, % Other 35, % NYS Helmet Laws: Bicyclists under the age 14 must wear an approved helmet All motorcycle riders (drivers and passengers) must wear a DOTapproved helmet
37 Selected Risk Factors Traffic Injuries Restraint Use Type of Crash or Contributing Factor Total Number of People Involved Number of People Hospitalized TBI (Percent of Hospitalizations) No Restraint Used 24,357 1, % Restraint Used 563,621 6, % Unknown 131,570 1, % Occupants that did not use restraints: Were almost 4 times more likely to require hospitalization The average hospital charge was over $20,000 higher! Were almost 3 times more likely to be diagnosed with a TBI NYS seat belt law: Every occupant in the front seats, the driver and each passenger must wear a seat belt. Every occupant of a motor vehicle being operated by the holder of a Learner Permit, or Junior Driver License must be restrained by a safety restraint. Each passenger under age 16 must wear a seat belt or use an appropriate child safety restraint system.
38 Conclusions We look at: Extent Patterns Risk Factors Populations at greatest risk Time Trends
39 Conclusions While it is difficult to grasp the extent of TBI incidence and prevalence (NYS does not have a TBI registry), the data does show patterns in the occurrence of TBI. Continued surveillance efforts will increase our knowledge of TBI occurrence. Prevention programs focused on evidence-based strategies and best practices will help to prevent traumatic brain injuries among New Yorkers!
40 Questions? For additional questions please contact me: Michael Bauer, M.S. Bureau of Occupational Health and Injury Prevention Section Chief, Epidemiology and Surveillance (518)
41 TBI Data Systems: Registry Minnesota Mark Kinde 41
42 Minnesota s TBI Registry TBI Community of Practice Webinar Leslie Seymour, MD, MPH, Mark Kinde, MPH & the Minnesota CoP Team October 15, 2013
43 Registry Purposes Provide timely service information Describe the epidemiology of TBI in Minnesota and do prevention Redefine the unacceptable
44
45 Registry Function Who reports? How do they report? What do they report? How are the data used? How is data quality addressed?
46 Brain Injury Epidemiology, MN When & where do brain injuries happen? To whom? What are the leading causes? What other illnesses or injuries occur in conjunction with brain injury? What do we know about outcomes? How much do brain injuries cost? Who pays?
47 Resource Facilitation (RF) for Brain Injury
48 Resource Facilitation Resource facilitation is a partnership that helps people and communities choose, get and keep information, services and supports to make informed choices and meet their goals. Info & Resources Resource Facilitation Case Management Connect survivors with services
49 Resource Facilitation Introduced to Minnesota, 1989 Mailing to Registry Cases, 1993 Strengthened and expanded, 1997 Telephone Outreach, 2004 Purpose: To link individuals with traumatic brain injury to information about available services Connection strategies: mail, hospital referral, telephone, and Web
50 Who s Doing RF?
51 How Does RF Work? RF Activities Assess Plan Identify Negotiate Monitor Reassess Outreach Educate & Train RF Costs ~ $1M/yr in Minnesota Persons Served ~1000+/yr in Minnesota 16+ States

52 Resource Facilitation: 2011: 13, : 14, : 13,633 All persons served: 2011: 27, : 23, : 21,568 Persons served

53 More than 10,000 Minnesotans receive hospital care each year due to TBI TBI Causes Overall Falls (Most Common) (unintentional) Motor vehicle traffic Sports & recreation Assaults By Age group 0-4: Falls/assaults 15-29: Motor vehicle traffic/sports & recreation 65+: Falls (unintentional)

54 Is income related to brain injury? TBI Rate Median Income by Zip
55 TBI Mortality by year, Minnesota, 55+ Centers for Disease Control and Prevention, National Center for Health Statistics. Multiple Cause of Death on CDC WONDER Online Database, released Data are from the Multiple Cause of Death Files, , as compiled from data provided by the 57 vital statistics jurisdictions through the Vital Statistics Cooperative Program. Accessed at on Feb 13, :58:52 PM
56 Malec Model for TBI Prevalence Do you use services? Do you need services? Have you been told you need services?
57 Thanks! And the whole Team!
58 Thank you for your participation Please take a moment to complete our short evaluation Questions or Comments? Contact: Rhunt@edc.org
THE EPIDEMIOLOGY OF TRAUMATIC BRAIN INJURIES IN NEW YORK STATE
 THE EPIDEMIOLOGY OF TRAUMATIC BRAIN INJURIES IN NEW YORK STATE Michael Bauer, Sarah Sperry, Kainan Sun, Susan Hardman New York State Department of Health, Bureau of Injury Prevention What is Traumatic
Community of Practice on Traumatic Brain Injury
 Community of Practice on Traumatic Brain Injury First Meeting September 18 th, 2013 For audio, please call: 866-835-7973 Your phone lines are currently muted. Today s Agenda Overview of the CoP Hear about
Traffic Safety Facts. State Traffic Data Data. Overview
 Traffic Safety Facts 2015 Data June 2017 DOT HS 812 412 State Traffic Data Key Findings Traffic fatalities increased by 7 percent from 2014 to 2015 (32,744 to 35,092) for the United States. The fatality
Traffic Safety Facts 2007 Data
 Traffic Safety Facts 2007 Data Bicyclists and Other Cyclists DOT HS 810 986 Bicyclists and other cyclists include riders of two-wheel nonmotorized vehicles, tricycles, and unicycles powered solely by pedals.
MTCF. Michigan Traffic Crash Facts FACT SHEETS
 FACT SHEETS This page left intentionally blank GENERAL FACTS The driver, the roadway, and the motor vehicle contribute in some measure to every crash. A preponderance of evidence, however, points to driver
MTCF. Michigan Traffic Crash Facts FACT SHEETS
 FACT SHEETS This page left intentionally blank GENERAL FACTS The driver, the roadway, and the motor vehicle contribute in some measure to every crash. A preponderance of evidence, however, points to driver
Toward Zero Deaths: Proactive Steps for Your Community
 Est. Dec. 2014 Toward Zero Deaths: Proactive Steps for Your Community Presented by: Brian Roberts, P.E., National Association of County Engineers Marie Walsh, Ph.D., Louisiana Local Technical Assistance
2015 Victorian Road Trauma. Analysis of Fatalities and Serious Injuries. Updated 5 May Page 1 of 28. Commercial in Confidence
 2015 Victorian Road Trauma Analysis of Fatalities and Serious Injuries Updated 5 May 2016 Page 1 of 28 Commercial in Confidence VICROADS_n3445896_2015_Victorian_Trauma_Report_- _updated_may_2016.docx 2015
2014 QUICK FACTS ILLINOIS CRASH INFORMATION. Illinois Emergency Medical Services for Children February 2016 Edition
 2014 QUICK FACTS ILLINOIS CRASH INFORMATION February 2016 Edition Illinois Emergency Medical Services for Children www.luhs.org/emsc Illinois Emergency Medical Services for Children TABLE OF CONTENTS
2012 QUICK FACTS ILLINOIS CRASH INFORMATION. Illinois Emergency Medical Services for Children September 2014 Edition
 2012 QUICK FACTS ILLINOIS CRASH INFORMATION September 2014 Edition Illinois Emergency Medical Services for Children www.luhs.org/emsc Illinois Emergency Medical Services for Children TABLE OF CONTENTS
MEMORANDUM. City Constituents. Leilani Schwarcz, Vision Zero Surveillance Epidemiologist, SFDPH
 MEMORANDUM TO: FROM: CC: City Constituents Leilani Schwarcz, Vision Zero Surveillance Epidemiologist, SFDPH Megan Wier, Co-Chair, San Francisco Vision Zero Task Force, SFDPH Commander Ann Mannix, Traffic
CDRT. Child Death Review Team Dallas County. Brief Report Traffic-related Child Deaths OVERVIEW
 Dallas County CDRT Child Death Review Team 2013 Brief Report Traffic-related Child Deaths 2006-2011 OVERVIEW In Dallas County, traffic-related injury death rates among children are typically less than
CHAPTER NINE SELECTED INDIANA LAWS
 CHAPTER NINE SELECTED INDIANA LAWS Child Safety Restraint Laws Motorcycle Helmet Laws Indiana Speed Limit Laws Indiana Safety Belt Laws Safety Belt Laws by State Indiana s Comparative Negligence Law Indiana
Pedestrian Fatalities on Interstate Highways, United States, Saving lives through research and education.
 Saving lives through research and education Pedestrian Fatalities on Interstate Highways, United States, 1993-2012 September 2014 607 14th Street, NW, Suite 201 Washington, DC 20005 AAAFoundation.org 202-638-5944
People killed and injured per million hours spent travelling, Motorcyclist Cyclist Driver Car / van passenger
 Cyclists CRASH FACTSHEET 27 CRASH STATISTICS FOR THE YEAR ENDED 31 DEC 26 Prepared by Strategy and Sustainability, Ministry of Transport Cyclists have a number of risk factors that do not affect car drivers.
Occupant Protection Laws
 Occupant Protection s Alabama Alaska Arizona Under 1 yr. or
 Alabama Alaska Arizona Under 1 yr. or
 Figure 1. Indiana fatal collisions by young driver involvement,
 INDIANA TRAFFIC SAFETY FACTS YOUNG DRIVERS 2016 MAY 2017 ISSUE 17-C06 IN 2016: In 2016, 13.4 percent of all drivers involved in Indiana collisions were young drivers. Young drivers were involved in 105
Occupant Protection Laws
 Occupant rotection Laws tate Must Be in Child Restraint* Additional eat Belt Coverage* Who is Covered & Where rimary or econdary Alabama Under 6 yrs.** 6 until 15 yrs. 15+ yrs. in Alaska Under 4 yrs.**
Retrospective Study of Juvenile Motor Vehicle Deaths
 Retrospective Study of Juvenile Motor Vehicle Deaths Karin Wells, BA Michelle A. Jorden, MD Santa Clara County Medical Examiner-Coroner s Office Why this study? Dr. Jorden is Chair of the Child Death Review
Injury Mortality in Ireland, Northern Ireland and Britain
 Injury Mortality in Ireland, Northern Ireland and Britain INIsPHO Lunchtime Seminar December 2007 Steve Barron Research Analyst INIsPHO@IPH Injury mortality in Ireland, Northern Ireland and Britain Method
Alberta. Traffic Collision Statistics. Office of Traffic Safety Transportation Services Division May 2017
 Traffic Collision Statistics Office of Traffic Safety Transportation Services Division May 217 This page was intentionally left blank. 2 Table of Contents Traffic Collisions... 4 Traffic Collision Rates...
Occupant Protection Laws
 Alabama Alaska Arizona ; under 5 yrs. and 20 lbs. forward-facing ; 4-8 yrs.,
Road safety status in the WHO South-East Asia Region, 2013
 Road safety status in the WHO South-East Asia Region, 2013 2013 (1) (2) (3) Key facts at a glance Road traffic crashes accounted for 334 815 deaths in the South-East Asia Region during 2010, with the rate
Cambridgeshire and Peterborough Road Safety Partnership Handbook
 and Peterborough Road Safety Partnership Handbook ANNUAL STATISTICS SUMMARY 2015 3941 CCC_Road Safety HBook.indd 1 19/08/2016 14:59 Contents Introduction 2 Key points 3 Summary table 4 Overall trends 4
Sydney, AUSTRALIA Beijing, CHINA Hyderabad, INDIA London, UK. Affiliated with the University of Sydney
 Sydney, AUSTRALIA Beijing, CHINA Hyderabad, INDIA London, UK Affiliated with the University of Sydney Road Traffic Injuries in Asia Professor Rebecca Ivers 2 Major causes of death 3 Million people 2 1.8
Motor Vehicle Related Fatalities 10-year Statistics for British Columbia Research and Data Unit Policy and Strategic Initiatives Branch
 Motor Vehicle Related Fatalities 1-year Statistics for British Columbia 27-216 Research and Data Unit Website: www.gov.bc.ca/roadsafetybc Twitter: http://twitter.com/ Contents Contents... 2 Introduction
BIA INDIAN HIGHWAY SAFETY PROGRAM FY2016 LAW ENFORCEMENT OVERTIME GRANT
 SECTION A: General Information. This section must be completed for all applicants. Name of Tribe: Click here to enter text. Address : Click here to enter text. City: Click here to enter text. State: Click
Transportation and Health Tool
 Working together to evolve the Transportation and Health Tool APHA Webinar March 22, 2016 Ann Steedly, PE Overview THT Development Context Development of Indicators Strategies, Interventions & Policies
SECTION 1. The current state of global road safety
 SECTION 1 The current state of global road safety The number of road traffic deaths each year has not increased but remains unacceptably high at 1.24 million per year. Many countries have successfully
There are three major federal data sources that we evaluate in our Bicycle Friendly States ranking:
 Since the landmark Intermodal Surface Transportation Efficiency Act (ISTEA) created the Transportation Enhancements program in 1991 bicycle and pedestrian projects have been eligible for programmatic federal
BIA INDIAN HIGHWAY SAFETY PROGRAM FY2016 TRAFFIC RECORDS GRANT. SECTION A: General Information. This section must be completed for all applicants.
 SECTION A: General Information. This section must be completed for all applicants. Name of Tribe: Click here to enter text. Address : Click here to enter text. City: Click here to enter text. State: Click
Occ c u c pa p n a t pro r t O ec e t c i t O i n
 Occupant Protection Occupant Protection Introduction Buckling up or being buckled in is the most effective protection during a car crash. The simple truth is that the great majority of people ejected from
Mission: The mission of FARS is to make vehicle crash information accessible and useful so that traffic safety can be improved
 Mission: The mission of FARS is to make vehicle crash information accessible and useful so that traffic safety can be improved NHTSA created FARS in 1975 National Center for Statistics and Analysis (NCSA)
Safety and Active Transport. Dr. Maureen Carew, Medical Officer of Health Renfrew County and District Health Unit May 30, 2014
 Safety and Active Transport Dr. Maureen Carew, Medical Officer of Health Renfrew County and District Health Unit May 30, 2014 Active Transport Vision Increase levels of walking and cycling Reduce vehicle
ROAD SAFETY ANNUAL REPORT 2018 ISRAEL
 ROAD SAFETY ANNUAL REPORT 2018 ISRAEL ISRAEL Israel recorded 321 road fatalities in 2017, representing a 3.9% decrease when compared to 2016. The mortality rate is 3.6 deaths per 100 000 population. Since
the Ministry of Transport is attributed as the source of the material
 Cyclists 2015 Disclaimer All reasonable endeavours are made to ensure the accuracy of the information in this report. However, the information is provided without warranties of any kind including accuracy,
road safety issues 2001 road toll for Gisborne district July 2002 Road user casualties Estimated social cost of crashes*
 GISBORNE DISTRICT road safety issues July 22 The Land Transport Safety Authority (LTSA) has prepared this Road Safety Issues Report. It is based on reported crash data and trends for the 1997 21 period.
A review of 2015 fatal collision statistics as of 31 December 2015
 A review of fatal collision statistics as of 31 December This report summarises the main trends in road fatalities that have emerged in. This has been prepared by the Road Safety Authority following analysis
Deaths/injuries in motor vehicle crashes per million hours spent travelling, July 2007 June 2011 (All ages) Mode of travel
 Mode of travel") Cyclists CRASH STATISTICS FOR THE YEAR ENDED 31 DECEMBER 211 Prepared by the Ministry of Transport CRASH FACTSHEET 212 Cyclists have a number of risk factors that do not affect car drivers. The main risk
Cyclists CRASH STATISTICS FOR THE YEAR ENDED 31 DECEMBER 211 Prepared by the Ministry of Transport CRASH FACTSHEET 212 Cyclists have a number of risk factors that do not affect car drivers. The main risk
Partners for Child Passenger Safety Fact and Trend Report October 2006
 Partners for Child Passenger Safety Fact and Trend Report October In this report: Background: Child Restraint Laws in PCPS States Page 3 Restraint Use and Seating Page 3 Vehicles Page People and Injuries
Implementation of a Drowning Surveillance System for Ohio Public Pools
 Implementation of a Drowning Surveillance System for Ohio Public Pools Amanda M. Zabala, MPH CDC/CSTE Applied Epidemiology Fellow Waterborne Ohio Department of Health Bureau of Environmental Health & Radiation
Lane Area Transportation Safety and Security Plan Vulnerable Users Focus Group
 Lane Area Transportation Safety and Security Plan Vulnerable Users Focus Group Agenda 1. Planning Process Review 2. What are Emphasis Areas? 3. Your Role Today 4. Data Review 5. Small group discussion
European facts and Global Status Report on Road Safety 2013
 European facts and Global Status Report on Road Safety 2013 Francesco Mitis WHO Regional Office for Europe Rome, 20 December 2013 mit@euro.who.int Monitoring a Decade UN GA resolution 54/255 in 2010 called
POLICY AGENDA For Elder Pedestrian Safety
 POLICY AGENDA For Elder Pedestrian Safety Older adults and people with disabilities often have mobility, cognitive, and sensory limitations that affect their behavior as pedestrians and place them at risk
The Demographics of US Drowning & Data on Guarded Pool Deaths Julie Gilchrist, M.D.
 The Demographics of US Drowning & Data on Guarded Pool Deaths Julie Gilchrist, M.D. Dr. Julie Gilchrist is a Pediatrician and Medical Epidemiologist with the National Center for Injury Prevention and Control
Georgia Annual Health Status Measures 2018
 Georgia Annual Health Status Measures 2018 with comparisons to the U.S. and Healthy People 2000, 2010 & 2020 objectives Prepared by the Office of Health Indicators for Planning (OHIP), Georgia Department
Road safety. REGIONAL COMMITTEE Provisional Agenda item 8.5. SEA/RC70/11 Malé, Maldives 6 10 September July Seventieth Session
 REGIONAL COMMITTEE Provisional Agenda item 8.5 Seventieth Session SEA/RC70/11 Malé, Maldives 6 10 September 2017 21 July 2017 Road safety Road traffic injuries constitute a major public health burden with
The burden of road crashes on the health system in Asia Pacific
 The burden of road crashes on the health system in Asia Pacific Professor Peter F.M. Choong Sir Hugh Devine Professor of Surgery, University of Melbourne Department of Surgery Director of Orthopaedics,
Addressing the challenges of road safety in India: Are there lessons from Australia?
 Addressing the challenges of road safety in India: Are there lessons from Australia? Mark King Workshop panel presentation: Road safety challenges and way outsa 3rd Conference of Transportation Research
Road Safety Partnership
 Cambridgeshire and Peterborough Road Safety Partnership Cambridgeshire and Peterborough Road Safety Partnership Introduction Road accidents can have a devastating impact not only for the people directly
Maine Highway Safety Facts 2016
 Maine Highway Safety Facts 216 216 MAINE HIGHWAY SAFETY FACTS The Bureau of Highway Safety and the Maine Department of Transportation are pleased to present the 216 edition of Maine Highway Safety Facts.
2011 National Survey of Fishing, Hunting, and Wildlife-Associated Recreation
 U.S. Fish & Wildlife Service 2011 National Survey of Fishing, Hunting, and Wildlife-Associated Recreation State Overview Issued September 2012 Preliminary Estimates 2 2011 National Survey of Fishing, Hunting,
BIA INDIAN HIGHWAY SAFETY PROGRAM FY2016 LAW ENFORCEMENT GRANT. SECTION A: General Information. This section must be completed for all applicants.
 SECTION A: General Information. This section must be completed for all applicants. Name of Tribe: Click here to enter text. Address : Click here to enter text. City: Click here to enter text. State: Click
Factors Leading to Older Drivers Intersection Crashes
 Factors Leading to Older Drivers Intersection Crashes APHA Annual Meeting 2007 Washington, DC November 7, 2007 Keli A. Braitman Bevan B. Kirley Neil K. Chaudhary Projections of population and licensure
EGYPT: a national decade of action for road safety
 EGYPT: a national decade of action for road safety 2011 2020 Egypt EGYPT Population: 75 497 913 Income group: Middle Gross national income per capita: $1 580 INSTITUTIONAL FRAMEWORK Lead agency Funded
Louisiana Traffic Records Data Report 2017
 Louisiana Traffic Records Data Report 2017 crashdata.lsu.edu Dr. Helmut Schneider September 2018 Overview Trends in crashes, fatalities & injuries Findings from the Occupant Protection Survey of 2018 Driving
Cambridgeshire and Peterborough Road Safety Partnership Handbook
 and Peterborough Road Safety Partnership Handbook ANNUAL STATISTICS SUMMARY- 2016 Contents Introductions 1 Key points 2 Summary table 3 Overall trends 3 Casualties by prevailing speed limit 4 Casualties
9/17/2014. Accessing and Using Data for Planning Complete Streets Projects. Welcome! Webinar Guidelines
 Accessing and Using Data for Planning Complete Streets Projects NYS Prevention Agenda Webinar Series September 19, 2014 Welcome! Today you will hear a presentation and have the opportunity to ask questions
Review of Fatal Collisions
 Review of Fatal Collisions January to July 1 st 16 Review of 16 fatal collision statistics as of 1st July 16 Overview This report summarises the main trends in road fatalities that have emerged up to the
Chapter PERFORMANCE MEASURES AND ACCOUNTABILITY. Introduction
 PERFORMANCE MEASURES AND ACCOUNTABILITY Introduction Performance measures are helpful in evaluating the progress being made toward achieving the goals and objectives of the Gateway Bicycle Plan. The Plan
DOT HS November 2009 Geospatial Analysis of Rural Motor Vehicle Traffic Fatalities
 DOT HS 811 196 November 2009 Geospatial Analysis of Rural Motor Vehicle Traffic Fatalities This document is available to the public from the National Technical Information Service, Springfield, Virginia
INFORMATION TOOL KIT
 CANADA ROAD SAFETY WEEK 2017 INFORMATION TOOL KIT Thank you for being involved in Canada Road Safety Week. With your participation, we can spread the word about this special week and why it is an important
Pedestrian Safety Initiatives National Highway Traffic Safety Administration (NHTSA)
") Pedestrian Safety Initiatives National Highway Traffic Safety Administration (NHTSA) Report to the Transportation Research Board Pedestrian Safety Committee January 2010 Leah Walton Safety Countermeasures
Pedestrian Safety Initiatives National Highway Traffic Safety Administration (NHTSA) Report to the Transportation Research Board Pedestrian Safety Committee January 2010 Leah Walton Safety Countermeasures
Officer Safety on our Roadways
 Lifesavers 30th National Conference on Highway Safety Priorities Officer Safety on our Roadways June 15, 2012 Craig W. Floyd Chairman & CEO National Law Enforcement Officers Memorial Fund Memorial Fund
Target Shooting by Hunters and Their Use of Shooting Ranges: 1975, 1991, and 2011
 U.S. Fish & Wildlife Service Target Shooting by Hunters and Their Use of Shooting Ranges: 1975, 1991, and 2011 Addendum to the 2011 National Survey of Fishing, Hunting, and Wildlife-Associated Recreation
officer Traffic Safety National Law Enforcement Officers Memorial Fund September 2012
 officer Traffic Safety National Law Enforcement Officers Memorial Fund September 2012 Did you know? On average, a law enforcement officer is killed somewhere in the U.S. every 54 hours There are some 60,000
NEW JERSEY LAW ENFORCEMENT LIAISON NEWSLETTER
 NEW JERSEY LAW ENFORCEMENT LIAISON NEWSLETTER SEPTEMBER 2017/12 WWW.NJSACOP.ORG DRIVE SOBER OR GET PULLED OVER NJ DIVISION OF HIGHWAY TRAFFIC SAFETY The mission of the Division of Highway Traffic Safety
Analysis of Pennsylvania Crash Statistics Data
 Analysis of Pennsylvania Crash Statistics Data By: Louis Pesci, Ph.D., Jeffrey Grim, P.T.P, Lucas Tatarko and Joseph Franze Indiana University of Pennsylvania May 2017 Executive Summary In 2015, 1,200
This Workbook has been developed to help aid in organizing notes and references while working on the Traffic Safety Merit Badge Requirements.
 This Workbook has been developed to help aid in organizing notes and references while working on the Traffic Safety Merit Badge Requirements. Visit www.scoutmasterbucky.com for more information SCOUT S
Napier City road trauma for Napier City. Road casualties Estimated social cost of crashes* Major road safety issues.
 ISSN 1176-841X July 25 Land Transport New Zealand has prepared this road safety issues report. It is based on reported crash data and trends for the 2 24 period. The intent of the report is to highlight
Introduction. 2
 Introduction In 2010, the United Nations General Assembly adopted Resolution 64/255 proclaiming 2011 2020 to be a Decade of Action for Road Safety. 1 In order to establish a baseline for the road safety
For further information contact: Alberta Infrastructure and Transportation Office of Traffic Safety Main Floor, Twin Atria Building Avenue
 Alberta Traffic Collision Statistics 2006 Alberta Traffic Collision Statistics 2006 For further information contact: Alberta Infrastructure and Transportation Office of Traffic Safety Main Floor, Twin
COLLISION STATISTICS May Engineering Services Box 5008, th Avenue Red Deer, AB T4N 3T4
 COLLISION STATISTICS 2016 2016 Red Deer Annual Motor Vehicle Collision Report May 2017 Engineering Services Box 5008, 4914 48th Avenue Red Deer, AB T4N 3T4 engineering@reddeer.ca RCMP GRC Red Deer City
A Critical Review of International Road Safety Databases
 A Critical Review of International Road Safety Databases George Yannis, Eleonora Papadimitriou, Katerina Folla National Technical University of Athens, Greece, Department of Transportation Planning and
Post-neonatal mortality (28 days to 1 year)
") Figure A1: Infant, neonatal and post-neonatal mortality rate (per 1000 live births), 1979 2003 14 12 10 Deaths per 1000 live births 8 6 4! N ZHIS CYMRC # 2 0 1979 1980 1981 1982 1983 1984 1985 1986 1987
Figure A1: Infant, neonatal and post-neonatal mortality rate (per 1000 live births), 1979 2003 14 12 10 Deaths per 1000 live births 8 6 4! N ZHIS CYMRC # 2 0 1979 1980 1981 1982 1983 1984 1985 1986 1987
Road Safety Annual Report 2016 OECD/ITF Chapter 26. Morocco
 Road Safety Annual Report 2016 OECD/ITF 2016 Chapter 26 Morocco This chapter presents 2014 road safety data for Morocco along with provisional data from 2015. It looks at trends in traffic and road safety
Draft Report: Traffic Crashes in the Denver Region
 Click to edit Master title style Click to edit Master title style Draft Report: Traffic Crashes in the Denver Region Presented by: Steve Cook Board Nov. 16, 2016 Click Report Click to to edit on edit Master
The Statistics. Tips for Parents
 The Statistics In 2001, the most recent statistics for Texas, 985 children, age 0-14, were injured in crashes with motor vehicles. For that same period of time and age range, 9 children died and 66 percent
Traffic Safety Basic Facts Main Figures. Traffic Safety Basic Facts Traffic Safety. Main Figures Basic Facts 2015.
 Traffic Safety Basic Facts 2013 - Main Figures Traffic Safety Basic Facts 2015 Traffic Safety Main Figures Basic Facts 2015 Main Figures EU road safety targets The European Commission set the ambitious
Northland Region road trauma for Northland Region. Road casualties Estimated social cost of crashes* Major road safety issues
 ISSN 1176-841X July 26 Land Transport has prepared this road safety issues report. It is based on reported crash data and trends for the 21 25 period. The intent of the report is to highlight key road
Cyclist Safety in Australia
 Cyclist Safety in Australia From BITRE Trauma Statistical Summary, August 218 http://www.bitre.gov.au/publications/ongoing/road_deaths_australia_annual_summaries.aspx Trends in cyclist trauma numbers These
For further information contact: Alberta Transportation Office of Traffic Safety Main Floor, Twin Atria Building Avenue Edmonton, Alberta T6B
 Alberta Traffic Collision Statistics 2009 Alberta Traffic Collision Statistics 2009 For further information contact: Alberta Transportation Office of Traffic Safety Main Floor, Twin Atria Building 4999
Alberta. Traffic Collision Statistics
 Alberta Traffic Collision Statistics 2015 Alberta Traffic Collision Statistics 2015 For further information contact: Alberta Transportation Office of Traffic Safety Main Floor, Twin Atria Building 4999
Dangerous Underwater Breath-holding Behavior-Related Drownings in New York State,
 Dangerous Underwater Breath-holding Behavior-Related Drownings in New York State, 1988-2011 Amanda Levy, MS, MPH New York City Department of Health and Mental Hygiene Bureau of Environmental Science and
Strategies for Sharing the Road with Other Users
 Idaho Driver Education and Training Strategies for Sharing the Road with Other Users M15-1 Sharing the Road Introduction Idaho law requires motorists to operate their vehicles in a careful and prudent
2003 road trauma for. Wairoa District. Road casualties Estimated social cost of crashes* Major road safety issues WAIROA DISTRICT JULY 2004
 WAIROA DISTRICT JULY 24 T he Land Transport Safety Authority (LTSA) has prepared this road safety issues report. It is based on reported crash data and trends for the 1999 23 period. The intent of the
Grade 2-3 MATH Traffic Safety Cross-Curriculum Activity Workbook
 Grade 2-3 MATH Tra fic Safety Cross-Curriculum Activity Workbook Note to Teachers The AAA Traffic Safety Education Materials present essential safety concepts to students in Kindergarten through fifth
Alberta. Traffic Collision Statistics
 Alberta Traffic Collision Statistics 2002 Alberta Traffic Collision Statistics 2002 For further information contact: Alberta Transportation Driver Safety, Research and Traffic Safety Initiative 1st Floor,
FHWA-SA September 2004 Technical Report. Pedestrian Safety in Native America
 FHWA-SA-04-007 September 2004 Technical Report Pedestrian Safety in Native America This publication is distributed by the U.S. Department of Transportation, Federal Highway Administration. The opinions,
WEEK 3 DRIVING SAFETY
 WEEK 3 DRIVING SAFETY Driving Safe starts before the engine. Most drivers are aware of the affect that things like drinking and cell phone use have on their driving safety, while giving little consideration
Alabama Observational Survey of Occupant and Child Restraint Use 2010
 Alabama Observational Survey of Occupant and Child Restraint Use 21 Contact Information: Alabama Department of Public Health Bureau of Health Promotion & Chronic Disease Injury Prevention Branch RSA Tower,
Canadian Association of Chiefs of Police Association canadienne des chefs de police
 WHAT S IN THE KIT? Media Advisory Template To be used to invite the media to an event during Operation Impact. We suggest you reproduce this on your own police agency letterhead. News Release Template
Working for a world free of road crash death and injury
 Working for a world free of road crash death and injury Presentation Outline What makes a road user vulnerable? Who is a Vulnerable Road User? What can be done to protect Vulnerable Road Users? Goal 3:
Pedestrian Safety Campaign
 Pedestrian Safety Campaign 2017-18 Traffic Safety Plan PART OF THE DRIVE FOCUS LIVE TRAFFIC SAFETY PLAN Table of Contents Background. 1 Pedestrian Collision Stats.... 2-3 Goals.. 4 Objectives.. 5 Implementation
Pedestrian injuries in San Francisco: distribution, causes, and solutions
 Pedestrian injuries in San Francisco: distribution, causes, and solutions Presentation to the San Francisco Health Commission RAJIV BHATIA, MD, MPH DIRECTOR OF OCCUPATIONAL AND ENVIRONMENTAL HEALTH, SAN
Street Smart - Regional Pedestrian Safety Campaign. Hopkins Grand Rounds July 16, 2014
 Street Smart - Regional Pedestrian Safety Campaign Hopkins Grand Rounds July 16, 2014 Baltimore Metropolitan Council (BMC) Who We Are The organization of the Baltimore region s elected executives, representing
Road safety in the Eastern Mediterranean Region
 Road safety in the Eastern Mediterranean Region Facts from the Global Status Report on Road Safety 2013 Road safety in the Eastern Mediterranean Region Introduction In 2004, the World Health Organization
State Level Firearm Ownership and Storage Information Informs Risk, Benefit and Public Health and Public Safety Programming
 State Level Firearm Ownership and Storage Information Informs Risk, Benefit and Public Health and Public Safety Programming Why More States Should Consider This on the 2017 Behavioral Risk Factor Surveillance
Part 1 Road Transport
 Part 1 Road Transport Chapter 1 Road Traffic Accident Trends I Outline of Present Situation Title 1 Land Transport 1 Long-Term Transition of Road Traffic Accidents Traffic fatalities are reduced in 1 consecutive