Lesson Title: Micro-directions for Buds, Leaves, Global Warming Related Activities
|
|
|
- Russell O’Neal’
- 5 years ago
- Views:
Transcription

1 Harvard LTER Schoolyard Program Teacher Developed Lessons and Documents that integrate Harvard Forest Schoolyard Ecology Themes into curriculum. Lesson Title: Micro-directions for Buds, Leaves, Global Warming Related Activities Project: Buds, Leaves, Global Warming Teacher: Louise Levy School: Belchertown H.S. Level: High School Date: April 9, 2015
2 Following directions Working around inertia with microdirections Louise Levy, BHS Science
3
4

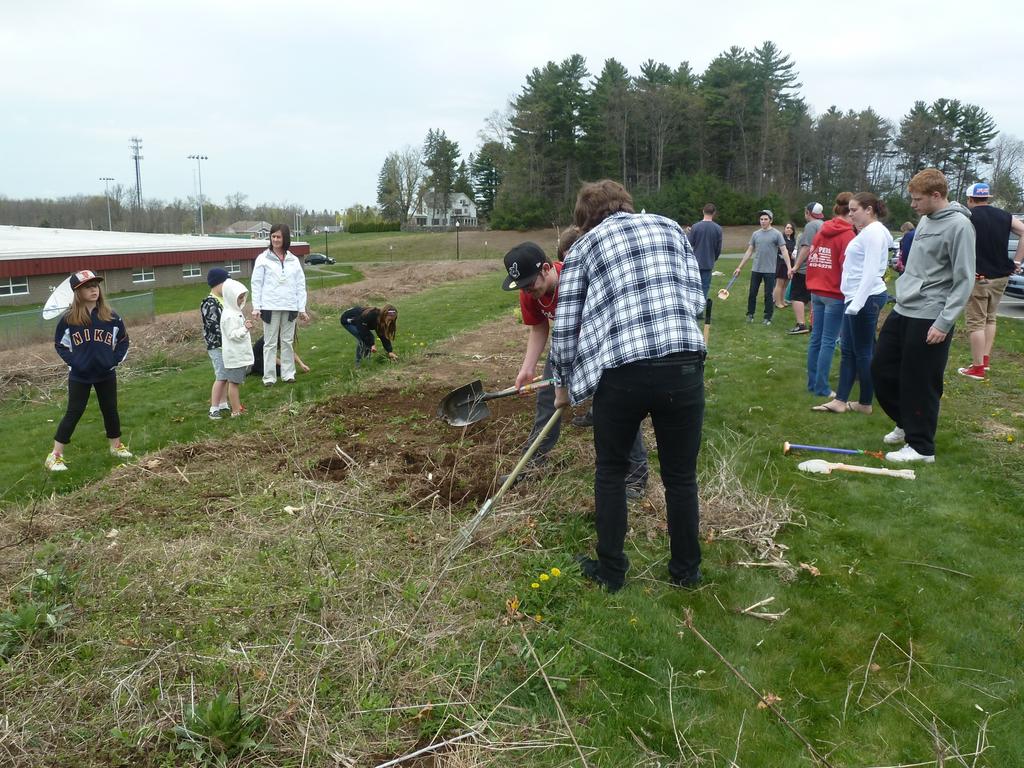
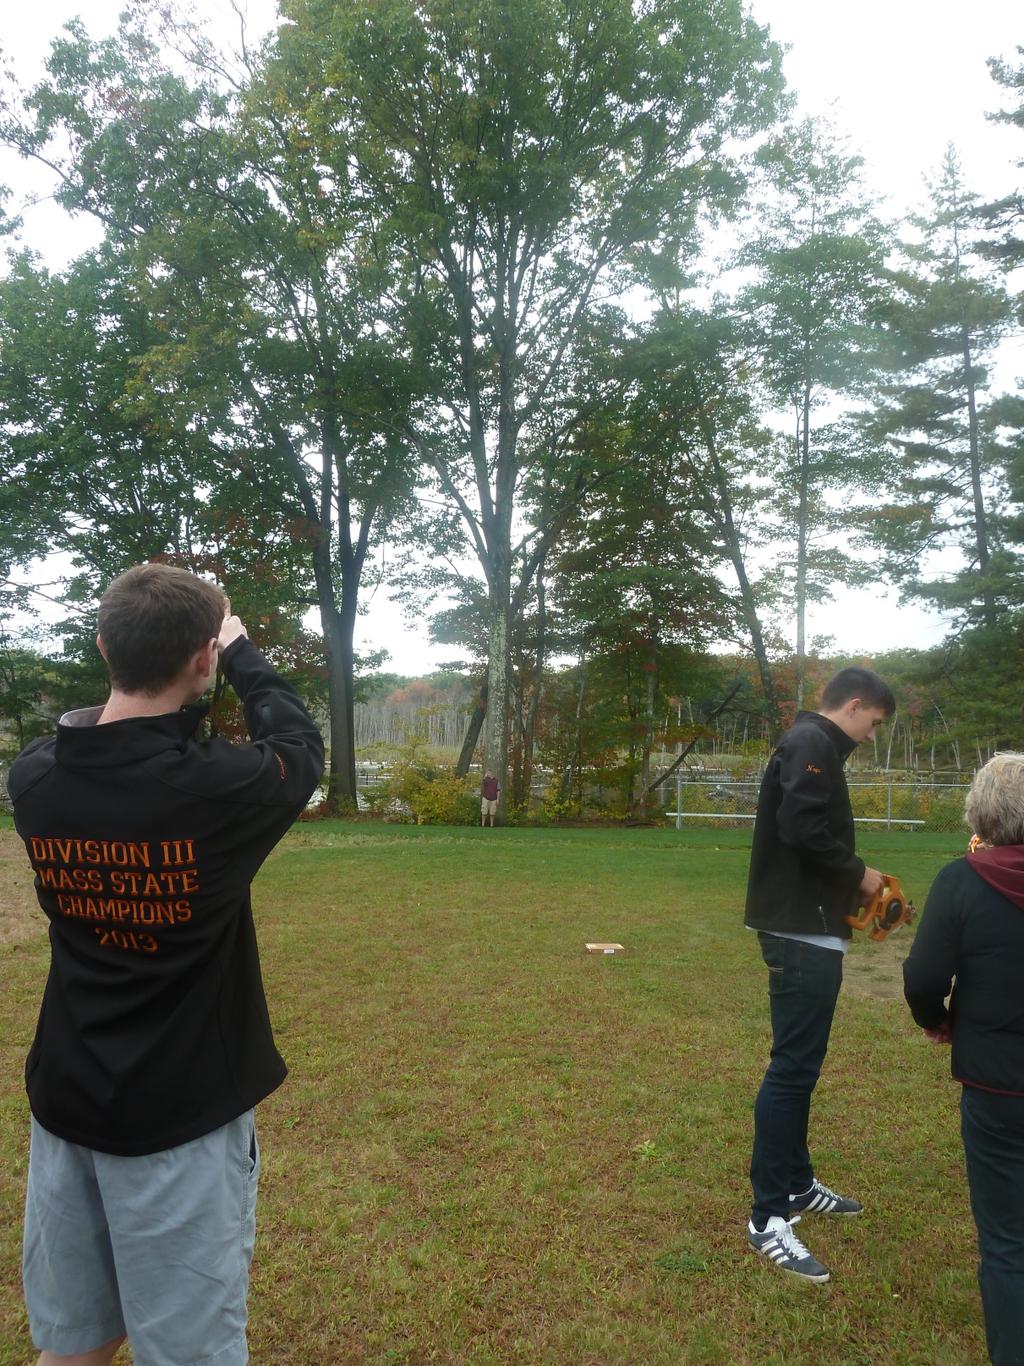
5 Estimating Tree Height
6 Artists Thumb Directions, delivered verbally With a partner standing at the base of your tree, walk backwards until your thumb is the same size as your partner Measure the height of trees in thumbs Multiply by the height of your partner

7 Model and practice Artists Thumb

8 Now, let them know they ll have to teach this method to a group of 20 7 year olds
9 Same instructions in microdirections form Artists Thumb (or pencil) method choose a volunteer, The Thumb, and have them stand at the base of your tree move back into the field & deliver these instructions: extend your arm (elbow locked) with thumb up looking with one eye, walk back or forwards until the volunteer standing at the base of the tree is the same height as your thumb Count how many Thumbs it takes to match the size of the tree Average the thumbs reports, measure the height of the volunteer (in inches), multiply the average thumbs by the volunteer s height, then divide by 12 to convert to feet. Repeat with another volunteer of a different height
10
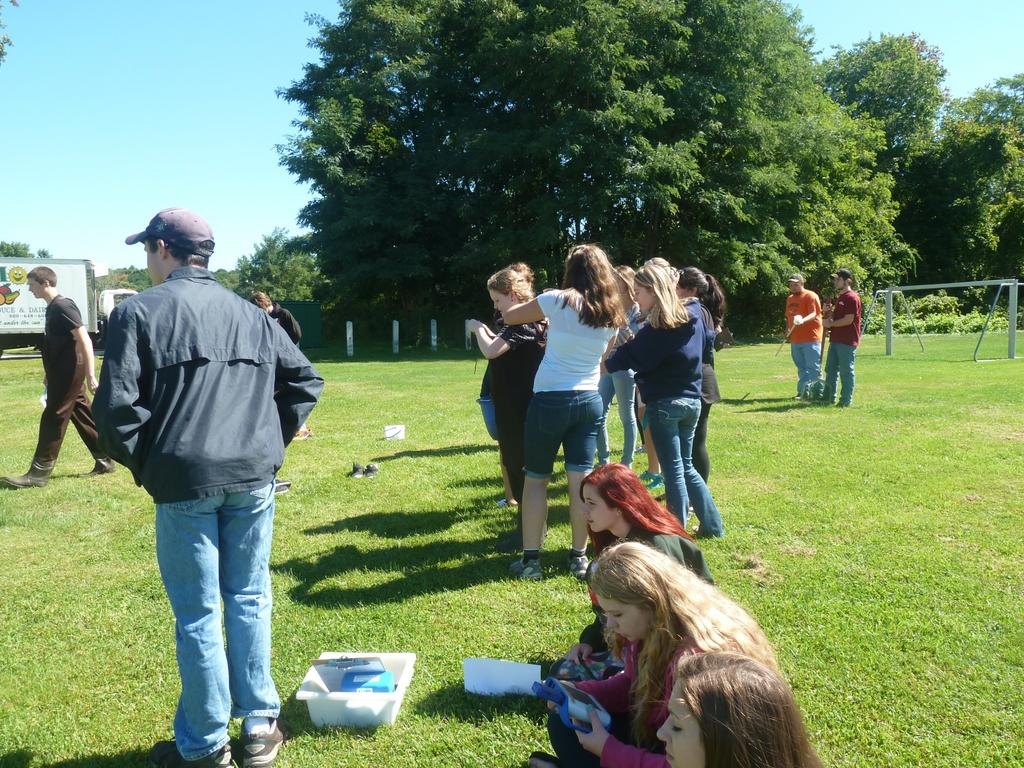
11 BHS BLG Quadrat Study Tree # Recorder(s) Group Leader Study Plot duty roster names Task Results Species observed list Mark the plot perimeter Plot map/overhead sketch Vertical map/landscape sketch Age (dbh) class analysis sap pol e saw Air and soil temperatures air soil Relative humidity Canopy cover Light intensity Wind speed Ground cover density Sawtimber dbh and height
12 Prepping a large group for different tasks Study Plot duty roster names Task Results Measure plot perimeter
13 Mark the plot perimeter: sticks, flagging Set sticks - 10 to a side - around your plot area by attaching a short piece of flagging to sticks with your tree close to the corner, and being sure to include the grassy/bare edge of the wooded area Measure plot perimeter: sticks, string Set the sticks 10 apart in the area marked off in the classroom, tie the string to your sticks, leaving one corner open. Set up your plot area by inserting the sticks into the ground, with your study tree no closer than 3 feet from one corner (3 feet from that one stick), and being sure to include the edge of the wooded area
14 Turning all data (Red Maple #2) Percent Leaf Drop Julian Date
15 Directions for Excel Graphs HvSS for Excel 1. Open an excel workbook 2. Label the first column Height (inches) and the second Shoe Size (mens or womens, as appropriate) an initials column is optional 3. Convert the heights to inches by multiplying the feet by 12 and adding the inches. Convert any fractions to decimals ¼ =.25 ½ =.50 ¾ =.75 Enter the data, one person to one line. 4. Enter the shoe sizes, double-checking to be sure that you ve matched up the height and shoe size correctly for each person 5. Select highlight - all of the height and shoe size data 6. On the top menu bar, select Insert 7. Choose Scatter a graph with the data points should appear on your screen. 8. Is the graph big enough? If not, grab the corner and make it bigger. 9. Go to Insert again and choose Text box (just right of center). Enter the data ranges for the y and x axes. Ex: y-range 0-16, x-range = In Chart Tools, choose Layout
16 11. Choose Chart Title, and type in Height vs Shoe Size and your names 12. Choose Axis Titles, choose Primary Horizontal Axis Title and enter Height (inches) 13. Choose Axis Titles again, choose Primary Vertical Axis Title and enter Shoe size (womens or mens, whichever your class used to collect the data) 14. Still in Chart Tools, choose Trendline and choose Linear Trendline 15. Again in Trendline, choose More Trendline Options and select both Display Equation on Chart and Display R-squared value on chart. If it shows up in the middle of your data, pick it up and move it off the graph area, to the right side of the graph window. 16. If you re super-fancy and know this program well, feel free to change colors, insert vertical gridlines, or even go the beginning to sort males and females to separate data sets and graph 2 separate series 17. it to MsLevy llevy@belchertown.org Feedback: How well did these instructions work for you and your partner(s)? How many times did you find yourself asking MsLevy for clarification? On which steps/procedure(s)? Comments:
17 into trend data Series1 Average
18 Branch (circle) - A B Names - BLG Data analysis - (tree sp) # Fall (year) ended on (date) 14 Number of Leaves Fallen Julian Date BLG Fall data analysis - mule Cal-date J-date Lfallen Given the trend in the data above, we estimate that 1-Sep % Leaf Fall happened on Julian date, 31-Dec marking the end of the growing season for Tree #
19 Hand Graph Instructions 1-Using your Tree level data table, Record the Calendar dates of our BLG observations in the data table below 2-Convert the Calendar(Cal) dates to Julian(J) dates 3-Add the number of leaves fallen from both the A and B branches and record below 4-Graph Julian date vs Leaves fallen, connect the data points 5- Mark the point on the graph where the line crosses 6 (=50%) 6-Check with the other branch team to confirm 7- Convert to Calendar date and record in the title of your graph Cal-date J-date L-fallen
20
Lab 4: Transpiration
 Lab 4: Transpiration Water is transported in plants, from the roots to the leaves, following a decreasing water potential gradient. Transpiration, or loss of water from the leaves, helps to create a lower
Deer Population Student Guide
 Deer Population Student Guide In many places, deer have become nuisance animals because they are so numerous. In some areas, a hunting season has been introduced or lengthened to reduce the number of deer.
Fun with M&M s. By: Cassandra Gucciardo. Sorting
 Fun with M&M s Sorting Fractions Objectives: The students will be able to review the measures of central tendency by determining mean, median, mode and range. They will review their understanding of estimation,
Background Information. Project Instructions. Problem Statement. EXAM REVIEW PROJECT Microsoft Excel Review Baseball Hall of Fame Problem
 Background Information Every year, the National Baseball Hall of Fame conducts an election to select new inductees from candidates nationally recognized for their talent or association with the sport of
Black Sea Bass Encounter
 Black Sea Bass Encounter Below is an adaptation of the Shark Encounter (Lawrence Hall of Science: MARE 2002) lesson plan to be about Black Sea Bass and to incorporate information learned from Dr. Jensen
Hitting Your Marks on the Drag Strip
 By Ten80 Education Hitting Your Marks on the Drag Strip STEM Lesson for TI-Nspire Technology Objective: Collect data, analyze the data using graphs, and use the results to determine the best driver. Frameworks:
Mini-Golf Course Description. 1. You must draw your design on a piece of graph paper so that it will cover all four quadrants.
 Algebra 1 Mrs. Blake B256 Mini-Golf Course Description Guidelines for your creation: 1. You must draw your design on a piece of graph paper so that it will cover all four quadrants. 2. On the graph paper
Measuring Length. Goals. You will be able to
 Measuring Length Goals You will be able to choose, use, and rename metric length measurements measure perimeters of polygons solve problems using diagrams and graphs Running in a Triathlon Racing Snails
Mathematics Assessment Program. Middle School Mathematics. Time Allowed Section A - 40 minutes; Section B - 40 minutes
 Mathematics Assessment Program MS - 3 Middle School Mathematics Time Allowed Section A - 40 minutes; Section B - 40 minutes These tasks give you a chance to show what you know and how you reason, and to
Boyle s Law: Pressure-Volume. Relationship in Gases
 Boyle s Law: Pressure-Volume Relationship in Gases The primary objective of this experiment is to determine the relationship between the pressure and volume of a confined gas. The gas we use will be air,
Boyle s Law: Pressure-Volume Relationship in Gases
 Boyle s Law: Pressure-Volume Relationship in Gases Computer 6 The primary objective of this experiment is to determine the relationship between the pressure and volume of a confined gas. The gas we use
Conversion: Feet, Metres, Paces, Chains
 Conversion: Feet, Metres, Paces, Chains Example: 1 inch = 2.54 cm 1. In our examples: 1 inch = 2.54 cm. To use algebra to find how many inches are in 140 cm: 1. Write the equivalency ratio 2. Write each
3. Answer the following questions with your group. How high do you think he was at the top of the stairs? How did you estimate that elevation?
 Classwork Exploratory Challenge 1. Watch the first 1:08 minutes of the video below and describe in words the motion of the man. Elevation vs. Time #2 [http://www.mrmeyer.com/graphingstories1/graphingstories2.mov.
The Bruins I.C.E. School
 The Bruins I.C.E. School Lesson 1: Decimal Place Value Lesson 2: Measurement and Data Lesson 3: Coordinate Graphing Lesson 4: Adding and Subtracting Fractions Lesson 5: Order of Operations Worksheets Included:
2nd Grade Quarter Four Assessment Guide
 nd Grade Quarter Four Assessment Guide Measurement Data Geometry Essential Questions How can you select an appropriate measurement tool? How can you compare measurement lengths in different units? Can
Prerequisite skills: The students need have a basic understanding of scatter plots.
 Objective: Students will investigate the g-forces. Students will then create scatter plots given data in a table. Students will then use the graphs to analyze the data and make predictions about who will
The Five Magic Numbers
 The Five Magic Numbers Objective: Students will review the five numbers needed to construct a box and whisker plot. Students will also answer questions using a box and whisker plot they created. Background
3. Answer the following questions with your group. How high do you think he was at the top of the stairs? How did you estimate that elevation?
 J Hart Interactive Algebra 1 Classwork Exploratory Challenge 1. Watch the first 1:08 minutes of the video below and describe in words the motion of the man. Elevation vs. Time #2 [http://www.mrmeyer.com/graphingstories1/graphingstories2.mov.
8th Grade. Data.
 1 8th Grade Data 2015 11 20 www.njctl.org 2 Table of Contents click on the topic to go to that section Two Variable Data Line of Best Fit Determining the Prediction Equation Two Way Table Glossary Teacher
Year 10 Mathematics, 2009
 Student s Name: Teacher s Name: 10 Year 10 Mathematics, 2009 Algebra Use straightforward algebraic methods and sketch and interpret features of linear graphs Time: 20 minutes. Check that you have entered
Grade: 8. Author(s): Hope Phillips
: Hope Phillips") Title: Tying Knots: An Introductory Activity for Writing Equations in Slope-Intercept Form Prior Knowledge Needed: Grade: 8 Author(s): Hope Phillips BIG Idea: Linear Equations how to analyze data from
Title: Tying Knots: An Introductory Activity for Writing Equations in Slope-Intercept Form Prior Knowledge Needed: Grade: 8 Author(s): Hope Phillips BIG Idea: Linear Equations how to analyze data from
Lesson 1: Decimal Place Value. Concept/Topic to Teach: Students use Bruins statistical data to order and compare decimals to the thousandths.
 Math Lesson 1: Decimal Place Value Concept/Topic to Teach: Students use Bruins statistical data to order and compare decimals to the thousandths. Standards Addressed: Standard 1: 5.NBT.3 Read, write, and
The Ordinary Man. Activity Begin with a discussion about estimation.
 Overview Activity ID: 8935 Math Concepts Materials Students will estimate the heights of various celebrities in feet and. They will use the TI-34 MultiView scientific calculator to convert actual heights
Comparing U.S. Elevation to the Population Density. Each block/lego equals 500 feet in elevation above sea level.
 Name Date Comparing U.S. Elevation to the Population Density In this lesson, you will make a double-bar graph which will compare U.S. population density to the elevation of physical regions of the United
Objectives. Materials
 . Objectives Activity 1 To investigate the relationship between temperature and the number of cricket chirps To find the x value of a function, given the y value To find the y value of a function, given
Chapter 0 Pretest = 4
 Determine whether you need an estimate or an exact answer. Then solve. 1. SHOPPING Addison paid $1.29 for gum and $0.89 for a package of notebook paper. She gave the cashier a $5 bill. If the tax was $0.14,
Practice Test Unit 06B 11A: Probability, Permutations and Combinations. Practice Test Unit 11B: Data Analysis
 Note to CCSD HS Pre-Algebra Teachers: 3 rd quarter benchmarks begin with the last 2 sections of Chapter 6 (probability, which we will refer to as 6B), and then address Chapter 11 benchmarks (which will
THE 2018 ROSENTHAL PRIZE for Innovation in Math Teaching. Geometry Project: DARTBOARD
 THE 2018 ROSENTHAL PRIZE for Innovation in Math Teaching Geometry Project: DARTBOARD Geometric Probability Theoretical Probability and Experimental Probability Elizabeth Masslich Geometry grades 6-12 Table
Pacific Charter Institute Pacing Guide Grade(s): _5 Subject Area: _Math in Focus grade 5 CP: yes _X no
: _5 Subject Area: _Math in Focus grade 5 CP: yes _X no") Week 1 Pre-requisite skills review Chapter 1 pre-test Assessment 5 chapter pre-test pp. 1-4 or MIF Student book 5A pp. 1-4 Reteach 4A (1.1, 1.2, 2.1, 3.2, 3.4) NWEA Kids start Wed. Week 2 1.1 Writing numbers
Week 1 Pre-requisite skills review Chapter 1 pre-test Assessment 5 chapter pre-test pp. 1-4 or MIF Student book 5A pp. 1-4 Reteach 4A (1.1, 1.2, 2.1, 3.2, 3.4) NWEA Kids start Wed. Week 2 1.1 Writing numbers
Lesson 14: Modeling Relationships with a Line
 Exploratory Activity: Line of Best Fit Revisited 1. Use the link http://illuminations.nctm.org/activity.aspx?id=4186 to explore how the line of best fit changes depending on your data set. A. Enter any
Bouncing Ball A C T I V I T Y 8. Objectives. You ll Need. Name Date
 . Name Date A C T I V I T Y 8 Objectives In this activity you will: Create a Height-Time plot for a bouncing ball. Explain how the ball s height changes mathematically from one bounce to the next. You
2.5. All games and sports have specific rules and regulations. There are rules about. Play Ball! Absolute Value Equations and Inequalities
 Play Ball! Absolute Value Equations and Inequalities.5 LEARNING GOALS In this lesson, you will: Understand and solve absolute values. Solve linear absolute value equations. Solve and graph linear absolute
USING A CALCULATOR TO INVESTIGATE WHETHER A LINEAR, QUADRATIC OR EXPONENTIAL FUNCTION BEST FITS A SET OF BIVARIATE NUMERICAL DATA
 USING A CALCULATOR TO INVESTIGATE WHETHER A LINEAR, QUADRATIC OR EXPONENTIAL FUNCTION BEST FITS A SET OF BIVARIATE NUMERICAL DATA Jackie Scheiber RADMASTE, Wits University Jackie.scheiber@wits.ac.za Target
Name Student Activity
 Open the TI-Nspire document Boyles_Law.tns. In this activity, you will use a Gas Pressure Sensor to measure the pressure of an air sample inside a syringe. Using graphs, you will apply your results to
! Problem Solving Students will use past Olympic statistics and mathematics to predict the most recent Olympic statistics.
 Title: Running Into Statistics Brief Overview: Since the 1996 Olympics took place close to home, they were a major topic of discussion all over the region. Students have traditionally been interested in
Mark Scheme (Results) Summer 2009
 Summer 2009") Mark Scheme (Results) Summer 2009 GCSE GCSE Mathematics (Linear) - 1380 Paper: 1380_2F 2 NOTES ON MARKING PRINCIPLES 1 Types of mark M marks: method marks A marks: accuracy marks B marks: unconditional
Mark Scheme (Results) Summer 2009 GCSE GCSE Mathematics (Linear) - 1380 Paper: 1380_2F 2 NOTES ON MARKING PRINCIPLES 1 Types of mark M marks: method marks A marks: accuracy marks B marks: unconditional
Using Darts to Simulate the Distribution of Electrons in a 1s Orbital
 NAME: Using Darts to Simulate the Distribution of Electrons in a 1s Orbital Introduction: The quantum theory is based on the mathematical probability of finding an electron in a given three dimensional
CONCEPTUAL PHYSICS LAB
 PURPOSE The purpose of this lab is to determine the density of an unknown solid by direct calculation and by graphing mass vs. volume for several samples of the solid. INTRODUCTION Which is heavier, a
Unit 6, Lesson 1: Organizing Data
 Unit 6, Lesson 1: Organizing Data 1. Here is data on the number of cases of whooping cough from 1939 to 1955. a. Make a new table that orders the data by year. year number of cases 1941 222,202 1950 120,718
APPROVED FACILITY SCHOOLS CURRICULUM DOCUMENT SUBJECT: Mathematics GRADE: 6. TIMELINE: Quarter 1. Student Friendly Learning Objective
 TIMELINE: Quarter 1 i-ready lesson: Rational Numbers and Absolute Value i-ready lesson: Numerical Expressions and Order of Operations 6/16/15 1 i-ready lesson (2a, 2b and 2c): Algebraic Expressions 6/16/15
CHAPTER 8 (SECTIONS 8.1 AND 8.2) WAVE PROPERTIES, SOUND
 WAVE PROPERTIES, SOUND") Name Period CHAPTER 8 (SECTIONS 8.1 AND 8.2) WAVE PROPERTIES, SOUND 1 ACTIVITY LESSON DESCRIPTION SCORE/POINTS 1. NT NOTES PACKET (notes and study questions ) _ /50 NT NOTES PACKET (vocab definitions &
Name Period CHAPTER 8 (SECTIONS 8.1 AND 8.2) WAVE PROPERTIES, SOUND 1 ACTIVITY LESSON DESCRIPTION SCORE/POINTS 1. NT NOTES PACKET (notes and study questions ) _ /50 NT NOTES PACKET (vocab definitions &
Life Support Team Mission Day Instructions
 Life Support Team Mission Day Instructions Overview The Environmental Control and Life Support System (ECLS) on the space station maintains the astronauts' environment. It makes sure that the atmospheric
Walk - Run Activity --An S and P Wave Travel Time Simulation ( S minus P Earthquake Location Method)
") Walk - Run Activity --An S and P Wave Travel Time Simulation ( S minus P Earthquake Location Method) L. W. Braile and S. J. Braile (June, 2000) braile@purdue.edu http://web.ics.purdue.edu/~braile Walk
Walk - Run Activity --An S and P Wave Travel Time Simulation ( S minus P Earthquake Location Method) L. W. Braile and S. J. Braile (June, 2000) braile@purdue.edu http://web.ics.purdue.edu/~braile Walk
Practice Test Unit 6B/11A/11B: Probability and Logic
 Note to CCSD Pre-Algebra Teachers: 3 rd quarter benchmarks begin with the last 2 sections of Chapter 6, and then address Chapter 11 benchmarks; logic concepts are also included. We have combined probability
5.1. Data Displays Batter Up. My Notes ACTIVITY
 SUGGESTED LEARNING STRATEGIES: Activating Prior Knowledge, Marking the Text, Group Presentation, Interactive Word Wall Henry Hank Aaron and Harmon Killebrew are among the alltime leaders in home runs in
Transpiration. DataQuest OBJECTIVES MATERIALS
 Transpiration DataQuest 13 Water is transported in plants, from the roots to the leaves, following a decreasing water potential gradient. Transpiration, or loss of water from the leaves, helps to create
% per year Age (years)
") Stat 1001 Winter 1998 Geyer Homework 2 Problem 3.1 66 inches and 72 inches. Problem 3.2 % per year 0.0 0.5 1.0 1.5 0 20 40 60 80 Age (years) (a) Age 1. (b) More 31-year olds (c) More people age 35{44,
Stat 1001 Winter 1998 Geyer Homework 2 Problem 3.1 66 inches and 72 inches. Problem 3.2 % per year 0.0 0.5 1.0 1.5 0 20 40 60 80 Age (years) (a) Age 1. (b) More 31-year olds (c) More people age 35{44,
PART 3 MODULE 6 GEOMETRY: UNITS OF GEOMETRIC MEASURE
 PART 3 MODULE 6 GEOMETRY: UNITS OF GEOMETRIC MEASURE LINEAR MEASURE In geometry, linear measure is the measure of distance. For instance, lengths, heights, and widths of geometric figures are distances,
Equilibrium. Observations
 Equilibrium Observations When you look closely at a rope you will see that it consists of several strands of twine. If you tried to hang a heavy (or massive) object on a single strand of twine it would
Algebra I: A Fresh Approach. By Christy Walters
 Algebra I: A Fresh Approach By Christy Walters 2005 A+ Education Services All rights reserved. No part of this publication may be reproduced, distributed, stored in a retrieval system, or transmitted,
Introduction to Waves. If you do not have access to equipment, the following experiments can be observed here:
 Introduction to Waves If you do not have access to equipment, the following experiments can be observed here: http://tinyurl.com/lupz3dh 1.1 There is a tray with water in it. This can model throwing a
Trial # # of F.T. Made:
 OPEN SPINNER APPLICATION APPS Prob Sim ENTER (Spin Spinner) SET UP SPINNER. TABL (graph) the blank graph disappears & will later become a table. SET (zoom) Change Sections to ENTER. ADV (window) Change
BEFORE YOU OPEN ANY FILES:
 Dive Analysis Lab *If you are using a school computer bring a USB drive to class to save your work and the files for the lab. *If you are using your own computer, make sure to download the data and files
Boyle s Law: Pressure-Volume Relationship in Gases
 Boyle s Law: Pressure-Volume Relationship in Gases The primary objective of this experiment is to determine the relationship between the pressure and volume of a confined gas. The gas we will use is air,
Tying Knots. Approximate time: 1-2 days depending on time spent on calculator instructions.
 Tying Knots Objective: Students will find a linear model to fit data. Students will compare and interpret different slopes and intercepts in a context. Students will discuss domain and range: as discrete
BEFORE YOU OPEN ANY FILES:
 Dive Analysis Lab * Make sure to download all the data files for the lab onto your computer. * Bring your computer to lab. * Bring a blank disk or memory stick to class to save your work and files. The
Listening and Following Directions
 Listening and Following Directions An Activity That Challenges Students To Pay Attention To Details Listening and Following Directions An Activity That Challenges Students To Pay Attention To Details Teacher
Applications of Culture in Mathematics NCCTM 2008
 Matthew Smith Wake Forest University TOPIC: Soccer, Currency, and a Global Market. NCTM STANDARDS: Numbers and Operations, Algebra, Measurements, Data Analysis & Probability, Problem Solving, Reasoning,
Lesson 1.1 Imperial Measures of Length Exercises (pages 11 12) a) Foot; because my desk is higher than 1 ft., but not as high as 1 yd.
 a) Foot; because my desk is higher than 1 ft., but not as high as 1 yd.") Lesson 1.1 Imperial Measures of Length Exercises (pages 11 1) A 3. Answers may vary. For example: a) Foot; because my desk is higher than 1 ft., but not as high as 1 yd. b) Inch; because a mattress is
Lesson 1.1 Imperial Measures of Length Exercises (pages 11 1) A 3. Answers may vary. For example: a) Foot; because my desk is higher than 1 ft., but not as high as 1 yd. b) Inch; because a mattress is
In this assignment, students will analyze statistics from the U.S. Department of Transportation to determine the safest means of travel.
 Background Information In the United States, we often are told that commercial airlines are statistically the safest mode of travel. Yet, many people do not believe this due to the fact that plane crashes
Chapter 11 Waves. Waves transport energy without transporting matter. The intensity is the average power per unit area. It is measured in W/m 2.
 Chapter 11 Waves Energy can be transported by particles or waves A wave is characterized as some sort of disturbance that travels away from a source. The key difference between particles and waves is a
Boyle s Law. Pressure-Volume Relationship in Gases. Figure 1
 Boyle s Law Pressure-Volume Relationship in Gases The primary objective of this experiment is to determine the relationship between the pressure and volume of a confined gas. The gas we use will be air,
COMMUNITY RELATIONS DEPARTMENT
 Warm Ups OVERVIEW It is important that athletes do warm up exercises before they play a game or begin a practice session. Likewise, it is important that students do warm up exercises before the day s lesson
LESSON 5: THE BOUNCING BALL
 352 - LINEAR B EHAVIOR LESSON 5: THE BOUNCING BALL y Notes to the Instructor Time: This lesson should take one class session. Materials: Two meter sticks or one tape measure per group, masking tape, balls
8.5 Training Day Part II
 26 8.5 Training Day Part II A Solidify Understanding Task Fernando and Mariah continued training in preparation for the half marathon. For the remaining weeks of training, they each separately kept track
Agile Manager widget descriptions
 Agile Manager widget descriptions This document provides details about commonly used Agile Manager dashboard widgets. Note: All widgets in the Dashboard are configurable, and the following descriptions
Lab 13: Hydrostatic Force Dam It
 Activity Overview: Students will use pressure probes to model the hydrostatic force on a dam and calculate the total force exerted on it. Materials TI-Nspire CAS handheld Vernier Gas Pressure Sensor 1.5
Common Core State Standards
 0 03 Pacing Guide for Sixth Grade Common Core State Standards Math Content Standards Ratios and Proportional Relationships RP Understand ratio concepts and use ratio reasoning to solve problems. The Number
INTRODUCTION TO THE SPECTROPHOTOMETER AND PIPETTING SKILLS
 INTRODUCTION TO THE SPECTROPHOTOMETER AND PIPETTING SKILLS Section A: Intro to the spectrophotometer A commonly used instrument in the analysis of cellular extracts is the Spectrophotometer. Today you
GCSE Mathematics Calculator Foundation Tier Free Practice Set 5 1 hour 30 minutes ANSWERS. Marks shown in brackets for each question (2)
") MathsMadeEasy 3 GCSE Mathematics Calculator Foundation Tier Free Practice Set 5 1 hour 30 minutes ANSWERS Marks shown in brackets for each question Typical Grade Boundaries C D E F G 76 60 47 33 20 Legend
MathsMadeEasy 3 GCSE Mathematics Calculator Foundation Tier Free Practice Set 5 1 hour 30 minutes ANSWERS Marks shown in brackets for each question Typical Grade Boundaries C D E F G 76 60 47 33 20 Legend
Chapter : Linear Motion 2
 Text: Chapter 2.5-2.9 Think and Explain: 4-8 Think and Solve: 2-4 Chapter 2.5-2.9: Linear Motion 2 NAME: Vocabulary: constant acceleration, acceleration due to gravity, free fall Equations: s = d t v =
Algebra I: A Fresh Approach. By Christy Walters
 Algebra I: A Fresh Approach By Christy Walters 2016 A+ Education Services All rights reserved. No part of this publication may be reproduced, distributed, stored in a retrieval system, or transmitted,
Shedding Light on the Weather
 Introduction There are many factors that contribute to our weather. You will be looking at hourly data for Time, Temperature, and Relative Humidity over 24-hours from different locations in the U.S. As
NYC Marathon Quarter 1 Review Task. The New York City Marathon was last weekend. Over 50,000 people ran 26.2 miles around the city!
 NYC Marathon Quarter 1 Review Task Name: Alg: The New York City Marathon was last weekend. Over 50,000 people ran 26.2 miles around the city! 1. The 2015 male winner was Stanely Biwott, his time was 2
Multiplying Decimal Numbers
 LESSON 09 Multiplying Decimal Numbers Power Up facts mental math Power Up J a. Estimation: Choose the more reasonable estimate for the weight of a pencil: 8 grams or 8 kilograms. 8 grams b. Fractional
MTB 02 Intermediate Minitab
 MTB 02 Intermediate Minitab This module will cover: Advanced graphing Changing data types Value Order Making similar graphs Zooming worksheet Brushing Multi-graphs: By variables Interactively upgrading
Core practical 14: Investigate the relationship between the pressure and volume of a gas at fixed temperature
 Core practical 14 Teacher sheet pressure To measure the volume of a gas at constant temperature but varying pressure Specification links Students should carry out this work with due attention to safety
Teacher s Resource Pack
 Teacher s Resource Pack Stage 4 & Stage 5 Mathematics Book your excursion today! Call (02) 8251 7801 Welcome to SEA LIFE Sydney Aquarium s Mathematics Student Resources Teacher Notes A trip to SEA LIFE
Ozobot Bit Classroom Application: Boyle s Law Simulation
 OZO AP P EAM TR T S BO RO VE D Ozobot Bit Classroom Application: Boyle s Law Simulation Created by Richard Born Associate Professor Emeritus Northern Illinois University richb@rborn.org Topics Chemistry,
LABORATORY INVESTIGATION
 LABORATORY INVESTIGATION MEASURING THE RATE OF PHOTOSYNTHESIS Light and Photosynthesis About 2.5-3 billion years ago a new chemical process, photosynthesis, was evolved by a unicellular life form. This
Piecewise Functions. Updated: 05/15/10
 Connecting Algebra 1 to Advanced Placement* Mathematics A Resource and Strategy Guide Updated: 05/15/ Objectives: Students will review linear functions and their properties and be introduced to piecewise
MATHEMATICAL LITERACY: PAPER II MARKING GUIDELINES
 NATIONAL SENIOR CERTIFICATE EXAMINATION EXEMPLAR 2014 MATHEMATICAL LITERACY: PAPER II Time: 3 hours 150 marks Key AT = Application Topic F Finance M Measurement R Maps, Plans and Other Representations
Part 1: Decimals. The decimal point separates the whole numbers from the fractional part of a
 Part 1: Decimals Decimal Place Values The decimal point separates the whole numbers from the fractional part of a number. 1328. 1095 In a whole number the decimal point is all the way to the right, even
Cambridge International Examinations Cambridge International General Certificate of Secondary Education
 www.xtremepapers.com Cambridge International Examinations Cambridge International General Certificate of Secondary Education *2215383014* CAMBRIGE INTERNATIONAL MATHEMATICS 0607/62 Paper 6 (Extended) October/November
Boyle s Law: Pressure-Volume Relationship in Gases. PRELAB QUESTIONS (Answer on your own notebook paper)
") Boyle s Law: Pressure-Volume Relationship in Gases Experiment 18 GRADE LEVEL INDICATORS Construct, interpret and apply physical and conceptual models that represent or explain systems, objects, events
Boyle s Law: Pressure-Volume Relationship in Gases Experiment 18 GRADE LEVEL INDICATORS Construct, interpret and apply physical and conceptual models that represent or explain systems, objects, events
SOLUBILITY OF A SOLID IN WATER
 1516L Experiment 2 SOLUBILITY OF A SOLID IN WATER Objectives In this experiment you will determine the solubility of potassium nitrate (KNO 3 ) in water at various temperatures. You will prepare a plot
ETA Cuisenaire The Super Source Grades: 7, 8 States: Texas Essential Knowledge and Skills (TEKS) Subjects: Mathematics
 Subjects: Mathematics") ETA Cuisenaire The Super Source Grades: 7, 8 States: Texas Essential Knowledge and Skills () Subjects: Mathematics TX.111.23 (7.1) Texas Essential Knowledge and Skills () Mathematics Grade 7 Number, operation,
ETA Cuisenaire The Super Source Grades: 7, 8 States: Texas Essential Knowledge and Skills () Subjects: Mathematics TX.111.23 (7.1) Texas Essential Knowledge and Skills () Mathematics Grade 7 Number, operation,
BIOMECHANICAL MOVEMENT
 SECTION PART 5 5 CHAPTER 12 13 CHAPTER 12: Biomechanical movement Practice questions - text book pages 169-172 1) For which of the following is the athlete s centre of mass most likely to lie outside of
Grade 7 & 8 Math Circles Pair-O -Dice: The Game April 2/3, 2013
 Faculty of Mathematics Waterloo, Ontario N2L 3G1 Instructions Set Up Grade 7 & 8 Math Circles Pair-O -Dice: The Game April 2/3, 2013 Get into a group of 3 to 5 players. Each group needs 2 different dice
1. Five more than three times a number x. 3. Seventeen percent of a number x.
 Pre-Calculus: 1.7.1 Mastery Practice Name: Date Period Write a mathematical expression for the quantity described verbally: 1. Five more than three times a number x. 3. Seventeen percent of a number x.
BIOL 101L: Principles of Biology Laboratory
 BIOL 101L: Principles of Biology Laboratory Sampling populations To understand how the world works, scientists collect, record, and analyze data. In this lab, you will learn concepts that pertain to these
Coimisiún na Scrúduithe Stáit State Examinations Commission. Junior Certificate Examination Mathematics
 2018. S34 Coimisiún na Scrúduithe Stáit State Examinations Commission Junior Certificate Examination 2018 Mathematics Paper 1 Higher Level Friday 8 June Afternoon 2:00 to 4:30 300 marks Examination Number
McKnight Hockey Association
 McKnight Hockey Association Electronic Evaluation Tool Manual 2013-2014 Table of Contents Introduction...3 Evaluation Tool...3 Login to OneClickIce...3 Evaluations...4 PROCESS...4 Evaluation Procedure...5
Math A Regents Exam 0806 Page 1
 Math A Regents Exam 0806 Page 1 1. 080601a, P.I. A.N.1 While solving the equation 4( x + 2) = 28, Becca wrote 4x + 8= 28. Which property did she use? [A] associative [B] commutative [C] identity [D] distributive
FUNCTIONAL SKILLS MATHEMATICS (level 1)
") FUNCTIONAL SKILLS MATHEMATICS (level 1) Detailed Marking Instructions Version: May 2011 Question Marking Scheme Illustrations of evidence No Give for each for awarding a mark 1 (a) Ans: 675 represent:
FUNCTIONAL SKILLS MATHEMATICS (level 1) Detailed Marking Instructions Version: May 2011 Question Marking Scheme Illustrations of evidence No Give for each for awarding a mark 1 (a) Ans: 675 represent:
Organizing Quantitative Data
 Organizing Quantitative Data MATH 130, Elements of Statistics I J. Robert Buchanan Department of Mathematics Fall 2018 Objectives At the end of this lesson we will be able to: organize discrete data in
DATA SCIENCE SUMMER UNI VIENNA
 Prerequisites - You have installed Tableau Desktop on your computer. Available here: http://www.tableau.com/academic/students - You have downloaded the data (athlete_events.csv) available here: https://www.kaggle.com/heesoo37/120-years-of-olympic-historyathletes-and-results
Kinetic & Potential. Energy lab. GREAT FOR: introducing energy + hands on learning. A Middle School Survival Guide s
 A Middle School Survival Guide s Kinetic & Potential Energy lab GREAT FOR: introducing energy + hands on learning Includes 2 versions and tips for recording data with technology! About This Lab in the
Lab #12:Boyle s Law, Dec. 20, 2016 Pressure-Volume Relationship in Gases
 Chemistry Unit 6:States of Matter & Basic Gas Laws Name Lab Partner Lab #12:Boyle s Law, Dec. 20, 2016 Pressure-Volume Relationship in Gases Purpose: The primary objective of this experiment is to determine
Game SD1: Recognising and interpreting data
 Game SD1: Recognising and interpreting data Strand: Data Strand Unit: Recognising and interpreting data Curriculum Objectives Covered: Sort and classify sets of objects by one and two criteria Represent