CARBON EMISSIONS FROM CAR TRANSPORT UNDERMINE SUSTAINABILITY A PRICKLY PROBLEM
|
|
|
- Erin Skinner
- 5 years ago
- Views:
Transcription
1 CARBON EMISSIONS FROM CAR TRANSPORT UNDERMINE SUSTAINABILITY A PRICKLY PROBLEM Russell Harris RPS, Innishmore, Ballincollig, co.cork, Ireland; russell.harris@rpsgroup.com ABSTRACT The need to reduce greenhouse gas emissions from human activity is now widely recognised. Internationally, a system of targets has been agreed. But everyday life seems to be carrying on much as before. In the field of transport, Government rhetoric exhorts us to travel smarter but the complex set of reasons why we travel as we do does not seem to be being addressed. Government appears to lack a sound mechanism for identifying a set of policies that are necessary and sufficient for ensuring that emissions targets are met. Focussing on car transport, various policies to reduce carbon emissions are possible, including: Land use measures to reduce the need to travel by co-location of dwellings, employment, retail, education etc in compact areas Measures to encourage modal shift by improvement of public transport and increasing the costs of car use Technological measures to reduce emissions by improving the efficiency of vehicles Measures to encourage the spread of newer and smaller-engined vehicles through the fleet Measures to reduce the proportion of driving in high-fuel-use conditions (sitting in queues, rapid acceleration, high speeds) Arguably progress is being made separately in all these areas. What s missing is a realistic perspective on how these combine to give overall carbon savings. Which would allow political decisions that more needs to be done in some areas, or that conversely the price of a particular form of carbon saving whether money cost or political cost - is too high. This paper sketches out a systematic modelling framework for estimating national carbon emissions from car transport. Such a model needs to: estimate the total national impact of very localised measures being put in place in different sizes of settlement across the country strongly reflect the differences between the very urbanised and very rural locations, and everywhere in between reflect the underlying multiplicative structure (journeys x car share x length x emissions per veh-km) and generate appropriate sensitivities to policy action in each element incorporate significant feedback loops (eg. lower-fuel-use vehicles have lower running costs, so car journeys are cheaper, so other things being equal car mode share will rise.) The process of putting together such a modelling framework would bring into sharp focus the limitations of present understanding and modelling tools, and should be setting the research agenda for the future. Keywords: Emissions, modelling, national Page 1 of 8
2 1 THE GOVERNMENT FRAMEWORK The need to reduce greenhouse gas emissions from human activity is now widely recognised. At the level of inter-governmental agreements, a significant response has been put in place. Some sectors of the economy are covered by the Emissions Trading Scheme (ETS), whereby a number of carbon credits emissions permits - are allocated to firms operating major plants within the EU. Those firms whose emissions exceed their permit have to purchase credits to cover the difference; firms whose emissions are below target can sell their excess credits. The theory is that as demand for credits gradually exceeds supply, the price will rise, making emissions reduction more attractive, until an equilibrium price is reached. The ETS initially included only the energy (power generation) and industrial sectors of the economy, although there are plans to extend it to include emissions from aviation. For non-ets sectors of the economy, nationallevel targets have been agreed. The logic of the process is that within this overall target, the Irish government has to take decisions about sector-level targets for limiting carbon emissions. Then the Government Department that deals with each sector of the economy has to decide what measures to put in place in order to achieve these targets. Such central government action might be direct measures, or include setting sub-targets for local authorities or delivery agencies, or campaigns to exhort individuals to reduce their own emissions by various means. However, at the level of individual actions, there seems little sign of any major step-change in travel behaviour. Everyday life seems to be carrying on much as before. The outcome of these international agreements has yet to percolate down through the different layers of government to reach the ordinary citizen. The whole top-down system is not yet connected up - targets have not yet led government agencies to put in place systems of incentives for rational individuals to change travel behaviour. 2 THE TRANSPORT ISSUE The Environment Protection Agency (EPA) has published sector-level projections [1] of emissions to Figure 1 shows the published historic data that forms the basis of these projections. It can immediately be seen that emissions from transport are growing rapidly, while all other sectors are relatively static by comparison. If Ireland has an emissions problem, it is primarily a transport problem. Transport as a sector is outside the ETS. The relevant national target is that the non-ets sectors as a group should reduce their carbon emissions to 20% below the 2005 baseline, by 2020, with linear progress towards that point from 2013 onwards. The graph suggests that if that target were to be met by each sector individually, then emissions from transport would have to be more than cut in half in order to meet the national target. The trend is based on pre-2008 data, and therefore does not allow for the effects of the recession. Whilst this may give Ireland a breathing space in which to decide what to do, it is clearly undesirable that a state of recession should continue. Once economic growth resumes, it seems likely that transport emissions will resume the observed upward trend, unless substantial policies are put in place to suppress this. Figure 2 shows the contribution to the transport total from different modes and fuels [2]. (Energy use can be taken as a proxy for carbon emissions for this purpose). The dominant element is the private car, although road freight and aviation also form a substantial part. Public transport makes a negligible contribution to the total. Note that these figures are from 2006, when apparently fuel in the Republic was significantly cheaper than in the North, leading many drivers to cross the border to obtain cheaper fuel so-called fuel tourism. This is less of an issue at present, and it may disappear altogether if prices and exchange rates converge. It is clear from this figure that while air travel may be an issue, making any significant inroads into transport emissions means tackling our use of cars and lorries. Page 2 of 8
 0.")
3 EPA historic emissions data indexed to Energy Residential Industry & Commercial Agriculture Transport Waste transport trend Linear (transport trend) Figure 1: Emissions trends by sector (source: EPA) Figure 2: Summary of transport energy consumption (source: SEAI) Page 3 of 8
4 3 POLICY OPTIONS The number of things that government could do which will have some impact on emissions from cars and lorries turns out to be quite large [3]. A sample of such policies is shown in Table 1 below although not exhaustive, it illustrates the range of policy action available. It is convenient to classify these policies into three main groups. The first group aim to influence mode choice, by reducing the cost or time or psychological barriers to using lesspolluting modes, or by increasing the cost or time of owning or using cars. The second group aim to reduce the emissions resulting from our current travel patterns, by encouraging improvements to vehicle technology and the rapid adoption of these, and by addressing the manner in which we drive. The third group aim to change the context in which we take travel decisions, reducing the need for us to travel or the distance that we travel, by promoting alternatives to travelling at all, or promoting land use patterns which lead to shorter journeys. Table 1: Summary of policy options Encourage use of alternative modes by Travel planning & information Marketing PT pricing & infrastructure Walking & cycling infrastructure Encouraging bicycle ownership Discourage car use by Fuel taxes Road pricing Road capacity reductions HOV lanes Parking policy Reduce car ownership by Regulating licence-holding Supporting car clubs Higher car taxes Improve vehicle technology by Support for development of low-emission vehicles Encourage uptake of such vehicles by Regulating or taxing higher-emission vehicles Changes to NCT rules Information & advertising Scrappage scheme Low-emission zones Eco-driving Speed enforcement Improved traffic management Change Land Use Patterns Urban concentration Urban design Freight logistics Promote non-travel alternatives Teleworking / teleconferencing Internet shopping & deliveries A case could be made for any of these. The challenge facing Ireland plc is what mix of such policies to adopt, so as to meet national targets at a minimum cost. 4 NEED FOR QUANTIFICATION For costs there will be. Economists by tradition assume rational man that if people are behaving in a particular way then they are getting something out of it. So that to bring about change, you have to make the undesirable behaviour less attractive and/or the alternatives more attractive. Carrot policies cost money that the government doesn t have, and stick policies can be very unpopular. The issue known as the tragedy of the commons can apply at many levels, from nations seeking to gain economic advantage by not trying too hard to reduce their own emissions, to politicians not wanting to alienate supporters by backing unpopular policies. We re all in this together we have only one planet. If we don t act collectively to reduce emissions, all our grandchildren lose. But selfinterest impels us at many levels not to do more than we absolutely have to in order to remove the environmental threat. What we need is a realistic quantified perspective on how the impacts of different policy options would combine to give overall carbon savings. Which would allow informed evidence-based political decisions as to how much needs to be done in order to meet agreed targets. Put another way, climate change from carbon emissions belongs to a category of problems of success. Since man first discovered fire, he has been causing increased carbon emissions; it could be argued that the whole of our civilisation is built on exploiting this particular chemistry. So it is not that carbon emissions are an evil in themselves. It is simply a matter of how much is too much. Quantification is of the essence. What is needed is neither moral effort by individuals, nor campaigns to raise the consciousness of the uninformed, but rather identification by government of a set of policies that are necessary and sufficient to bring about the required reduction, and then the political will for implementation. Page 4 of 8
5 5 MODELLING FRAMEWORK In other words, we need a National Transport Model that is designed to assess the combined impact of a wide range of policies to reduce carbon emissions from transport. Such a framework would draw on Ireland s considerable experience of transport modelling for other purposes town-level traffic management studies, modelling for major interurban road schemes, multi-modal models of cities to inform city-wide public transport planning - but would face significant challenges. Such a model may be thought of as having a number of components: A database of some sort that represents the totality of travel that is within the model scope A means of projecting this representation forward, taking account of both trends and feedback effects Mechanisms to represent the response of this travel to policy levers Emissions models that relate outcomes in terms of travel to emissions of atmospheric carbon (and any other pollutants that are within scope). The level of detail of the representation (which includes dimensions of time, space, mode, personal characteristics / socio-economic variables, and trip purpose) will be determined by the requirements of all three of the subsequent steps. For example, a focus on emissions modelling may require the database to distinguish numbers of cold starts which would not normally be a feature of transport models. Sensitivity to policy levers (such as School Travel Plans) may require detail distinguishing school travel as a separate purpose, disaggregated by local authority, by distance to school, etc. If there is a trend towards ownership of larger-engined vehicles, then in order to include the effects of this adequately, substantial disaggregation by vehicle type may be needed. 6 SOME MODELLING CHALLENGES Taking full account of all relevant trends, all policy levers that may be relevant and the data requirement for appropriate state-of-the-art emissions models could therefore result in a model that attempts an unmanageably-detailed representation of travel. A key aspect of any such model will therefore be the trade-off between the adequacy of the level of detail in the model and aspirations for the model to be simple to use and quick to run. 6.1 Computational feasibility The extent of modelling all of Ireland does not of itself pose undue concerns - models of this size and greater are now quite widespread. However, computational effort can be considered as a product of geographical extent, geographical detail, market disaggregation and number of choice processes. Pushing the boundaries in too many dimensions at once very quickly gets to a point where the model is cumbersome and less useful than intended. For example, the existing NTA model covers around one-third of the population of the State, and takes around 20 hours to run. A national model at similar level of detail might have three times as many zones. Such a model might take around nine times as long to run, since many of the operations within a conventional transport model are matrix-based and therefore their execution time goes up with the square of the number of zones. One early challenge is to consider the hardware and software platforms on which such a model might be run. A model that runs on a high street PC may require substantial compromises in terms of detail. Investment in high-end industrial computing power may or may not be more cost-effective than development of algorithms to carry out particular calculations as efficiently as possible with limited processing power. Transport modelling methods are increasingly reflecting opportunities for large-scale parallelized models that modern computing technologies support, and this may be an appropriate approach. 6.2 Data The high-quality Census data and related POWCAR journey to work data that was collected in 2006 and is due for update in 2011 provides an important basis for establishing travel demand for some purposes. In the Dublin area the 2006 Census was complemented by a Household Travel Survey and a Travel to Page 5 of 8
6 Education Survey that provided the basis for developing an all-day picture of travel demand in the Dublin area. This approach could feasibly be extended across Ireland to serve the NTM in describing personal travel. Similarly, the existing NRA highway model and digital network data provide the basis for a national highway network. Establishing public transport network descriptions is less straightforward, except that the information for key areas, notably Dublin and Cork, already exists for the present day case. Extending and updating this information at a national scale is thus viable. Information on freight, aviation, and shipping may be largely insufficient and of poor quality. As these modes are responsible for significant levels of emissions, there is a requirement to improve the provision of data. Aggregate statistics on sale of fuel may provide a useful top-down control total for bottom-up estimates of the amount of fuel burned and thus carbon emitted; similar issues may arise in terms of other items of data. The factor having the largest single impact on emissions may well turn out to be the rate at which improvements to vehicle technology can be brought on-stream. The rate of uptake of available higher-technology vehicles (and the impact of measures such as scrappage schemes which seek to accelerate such uptake) can be modelled using various techniques. But there is likely to be no sound evidence base for assumptions on the likely (exogeneous) rate of such technological development, and the best available data may be some form of a consensus of informed stakeholders. 6.3 Cross-Border issues The natural geographical scope seems to be an all-island model, but there are several issues around this, including: o Issues of data consistency o The likely inability of synthetic or extrapolated models to replicate patterns of movement across the border o The sensitivity of cross-border shopping and other trips to relative prices and taxes within the two administrations o The allocation for accounting purposes of emissions from fuel which is purchased in one administrative area and used in the other. Whether or not an all-island model turns out to be politically feasible, it will be important to be clear on how emissions connected with international journeys are to be dealt with defining precisely the scope of the modelled journeys and corresponding emissions. 6.4 Modelling Methodologies Existing national transport models in other countries tend to be based on a disaggregate choice modelling approach to demand, coupled with multi-modal network models that calculate travel costs and network loadings, iterated to a user equilibrium in which no traveller can increase their utility by choosing a different route, mode or destination. This provides a general default methodology. A typical multi-modal choice structure might be as shown in figure 3. However, extending this to all relevant lifestyle choices (including age and type of vehicle to own) and interactions between trips (trip chaining, cold starts) may lead to significant problems in achieving convergence to equilibrium. Arguably, much of the time our lives are not in equilibrium transaction costs mean that we hang onto the house and car that were appropriate a few years ago. Other styles of modelling, notably those involving a greater degree of simulation (agentbased, and the like), provide means to address issues ignored or inaccessible to more established approaches. Alternatively, of particular interest may be various metamodelling approaches, where a series of detailed models feed information on policy sensitivities up to an overarching less-detailed higher-level model. At the very least, it may be necessary to take full account of those very short car journeys which in most models would be intra-zonal and thus ignored; these may be the trips where there is most scope for switching to more sustainable modes of travel. 6.5 Changing Behaviour One methodological challenge lies in the assessment of measures which aim to change behaviour in favour of more sustainable modes of travel. Any forecast involves some form of extrapolation from past to future; if such Page 6 of 8
7 hearts and minds measures were successful in causing a genuine paradigm shift, the outcome would almost by definition be unforecastable. Thus whatever the rhetoric, for forecasting purposes it will be necessary to construct a framework for extrapolating impacts from existing case studies (in Ireland where possible, but otherwise from other countries). 7 CONCLUSION If such a model is to be developed in time to influence the achievement of Ireland s 2020 emission target, it will need to be assembled on a modular basis in an initial version that represents the current state of knowledge using existing off-the-shelf tools. And then refined over time, as our understanding improves and better data sources become available. The model then becomes a sort of repository of our collective knowledge; correcting its most obvious shortcomings may (perhaps should) determine the agenda for applied transport research over the next few years. REFERENCES [1] Environmental Protection Agency, Ireland s Greenhouse Gas Emissions - Projections , April 2010 [2] Energy Policy Statistical Support Unit, Sustainable Energy Authority of Ireland, Energy in Transport Report, December 2007 [3] UK Energy Research Centre, What policies are effective at reducing carbon emissions from surface passenger transport? A review of interventions to encourage behavioural and technological change, March 2009 ACKNOWLEDGEMENTS With thanks to Conall MacAongusa at RPS and Miles Logie of Imperial College London for various contributory ideas and discussions. All mistakes and misplaced emphases are however the responsibility of the author. Travel Not Travel This destination Other destination Other destination Car PT Walk/cycle Network model for car route choice Network model for PT route choice Figure 3: Typical multi-modal structure for city-level modelling Page 7 of 8


8 Figure 4: Possible Outline Structure Page 8 of 8
9 WALKABILITY MEANS WHAT, TO WHOM? DIFFICULTIES AND CHALLENGES IN DEFINING WALKABILITY L. Fitzsimons 1, N. Nelson 2, K. Leyden 3, J. Wickham 4 and C.B. Woods 1 1. School of Health and Human Performance, Dublin City University, Ireland; lfitzsimonsdcu@gmail.com, catherine.woods@dcu.ie 2. Department of Sport, Culture and the Arts, Strathclyde University, Glasgow, Scotland; norah.nelson@strath.ac.uk 3. Department of Political Science, West Virginia University, USA; kevin.leyden@mail.wvu.edu 4. Department of Sociology, Trinity College Dublin, Ireland; jwickham@tcd.ie ABSTRACT There has been considerable growth in public health research investigating the influence of the built environment on physical activity. Simultaneously, transport and planning professionals have been promoting a change from inactive to active transport modes to reduce traffic congestion and air pollution. A core concept in both areas of research is walkability. Walkable areas are varied and professional opinion on the level of walkability of an area can be contradictory. This study used a researcher-developed questionnaire to assess the environmental factors that influence walking behaviour. Professionals working within the areas of planning, architecture, politics, advocacy, public health and engineering were invited to complete the online questionnaire. All professions agreed that the presence of local quality functional walking routes, the availability of numerous destinations within walking distance and the perception of safety were all key factors that influence the walkability of an area. However, professions disagreed on the role of aesthetic factors; visual interest along a route was given a higher priority by some professions than others. It was concluded that different professions have different understandings of the concept of walkability, and future research should employ qualitative methodologies to investigate these differences further. Keywords: Walking, Walkability, Smarter travel, Urban environment 1 INTRODUCTION In recent years there has been considerable growth in public health research investigating the influence of the built environment on physical activity [1-5]. Simultaneously, transport and planning professionals have been promoting a modal change to active transport modes to reduce traffic congestion and air pollution [6-8]. A core factor in both areas of research is the concept of the walkability of an area. International literature suggests that walkable areas are favourable to good health and sustainable transport [2-9]. The factors used to identify or define an area as walkable are varied and often contradictory. This is due, in part, to the different opinions held by those responsible for designing and building theses walkable areas [10-14]. 2 WALKABILITY Words commonly used to describe how conducive an area is to walking are walkable or it s walkability. An area which is pedestrian friendly can be deemed to be more walkable than one which is not. Walkability is a multidisciplinary concept which means different things to many different people depending on the context in which it is being investigated. Lo [14] notes that considering the question of what is walkability? it seems that who you are asking is as important as the question. 2.1 Walkability stakeholders Previous research on walkability and the determinants of walking behaviour has included the views of architects, landscape architects, urban planners, urban designers, transport planners, academics, government decision makers, social ecologists, public health professionals and user advocacy groups [4,12,15]. This multidisciplinary expert opinion was sought in order to develop an understanding of the built environment factors which influence walking. Allender [15] found that public health research relating to walking determinants was reflected in the accepted wisdom of those involved in the design process. Lee [16], a Page 1 of 9
10 spatial planner, found that research in the urban/ Architects and Designers transportation fields was complementary to Professionals involved in the design of the public health research and he recommended streetscapes are primarily urban designers, that future multidisciplinary research is likely architects and landscape architects. Urban to promise a better understanding of both the designers have been advocating walkable behavioural and environmental aspects of communities for decades [21]. Lynch [22], physical activity and physically active Gehl [23] and Cullen [24] suggest that travel (pp167). However, no research was successful, comfortable and safe places identified that compared how the concept of encourage people to walk and explore on foot. walkability differed between professionals from Similar to spatial and transport planners, urban various fields of expertise. These professional designers emphasise nearby destinations with groups include planners, architects and quality routes to access them as factors to designers, public health and advocacy encourage walking trips. However, they go a professionals, public representatives and step further than the planers and highlight the engineers. The purpose of this research was to need for routes to offer comfort and visual explore the multidisciplinary nature of delight in order to make the trip enjoyable walkability that exists among these groups [10,24,25]. Architects and landscape architects and to examine any common ground or design for comfort and visual delight. contradictory practices that might exist. Planners In relation to walkability planners can be divided into two categories, spatial planners and transport planners. Spatial planners are concerned with land uses, they ensure that new developments have access to services, they plan and enforce sustainable development, urban renewal and the diversity of destinations. Spatial planning has two primary functions, forward planning and development control. Forward planners plan for future growth and decide the variety of land uses. Development control planners manage physical development by processing planning applications and enforcing planning law [17,18]. Transport planners provide for the movement of people including the design, routing and provision of roads, public transport, footpaths and bicycle lanes. They measure and project the demand for transport modes and design systems to suit and inform decisions on transportation investment [19]. Their role is fundamental in generating trips. The built environment factors which planners and transport planners consider as tools to encouraging walking are densities, land use mix and the formation of the street network [2,20]. Transport for London has a walkability index [11] which treats walkability solely as a framework for walking. It outlines factors and instructions for the provision of pedestrian infrastructure in a format similar to motorised transport design manuals. Public Health and Advocacy Professionals Advocates can be divided into two groups, those whose main purpose is to promote health through walking, and those who want to promote walking for its own sake as a pleasurable activity. Studies from public health researchers include those to determine the hierarchy of factors that influence walking [4], differentiate between perceptions, and actual measures of neighbourhoods [26], and those that determine how different cohorts of society are influenced [2,27]. Walking advocate Les Burden defines Walkability as the extent to which the built environment is friendly to the presence of people walking, living, shopping, visiting, enjoying or spending time in an area [28]. Community based walkability advocates produce a more holistic definition of walkability as they are not confined to a particular research areas or limitations determined by their professional training. Public Representatives In Ireland, local government planning, engineering and transportation planning departments oversee urban and rural development, the design of which is sometimes undertaken by private design consultancies. Local governments are advised and informed by national policies and strategies developed by government departments and agencies such as the Department of Transport; the Department of the Environment, Heritage and Local Page 2 of 9
11 Government; the Department of Community, Factors Rural and Gaeltacht affairs; and the National This list of environmental (physical and social) Transportation Authority. The policies, plans factors (47 items) was converted into a webbased and budgetary spending proposals of these questionnaire. The questionnaire used a government agencies or departments are 5-point Likert scale from 1 very bad for approved by elected national or local walkability to 5 very good for walkability for government officials. In this role they have the items like Cul-de-sacs or Poor air quality/ potential to influence the financial resources presence of air pollution. Negatively worded allocated to walkable environments. factors were reverse coded to allow for comparative analysis on a continuous scale. Engineers Whilst the transport planners decide the routes, engineers are tasked with designing, building and maintaining of the pedestrian infrastructure and road crossings along the route. In the absence of street design standards, the design of such infrastructure is guided by standards such as the Design Manual for Roads and Bridges (DMRB) written for large highways. In the DMRB priority is given to motorised vehicles and infrastructure for pedestrians is often only considered where the perceived level of usage by pedestrians justifies their inclusion [29] (pp. 4/1). 2.2 Summary In summary, walkability is a complex issue. Many descriptions or definitions are used by individuals, professionals or groups to articulate what they mean by the concept of walkability. Evidence suggests that walkability definitions to date are a combination of the hierarchy of factors relevant to the person defining, and reflecting the needs of their target group. It was also noted that some factors can be more or less influential on walking behaviours depending on climate and cultural factors. The purpose of this research was to explore the multidisciplinary nature of walkability that exists among these professional groups. 3 METHODOLOGY 3.1 Questionnaire development The international research team consisted of individuals qualified in the areas of public health, exercise science, transport planning, sociology and political science. A review of literature on walkability and on the built environment determinates of walking was undertaken by the research team, and over a 9- month period a list of factors known to influence the walkability of an area was generated. An additional number of exploratory items were also included in the final list. Study hypotheses Respondents were asked to what extent do you agree with the following statement, each statement reflected a study hypothesis. Statement 1: Human health is affected by the way we plan and design our communities and transport systems and Statement 2: Carbon emissions are effected by the way we plan and design our communities and transport systems. Responses were measured on a 5-point Likert scale from 1 Strongly Disagree to 5 Strongly Agree. 3.2 Validity testing Nine researchers evaluated the validity of the questionnaire, by completing it and then discussing the validity of each question and its corresponding responses. These discussions were facilitated by a single researcher (Leyden) and took place in face-to-face meetings or on the telephone. All of the validity testers, worked in relevant areas (universities or government), had PhDs and were based in Ireland (n=6), the United States (n=2), or Spain (but from France) (n=1). Most had considerable experience with questionnaire design and analysis and most had conducted research related to walkability or the built environment. All input was discussed and recorded and used to improve the design, validity and quality of the instrument used in this study. 3.3 Reliability testing A 7-day test - retest reliability analysis was carried out on the questionnaire with exercise science, transportation planning and spatial planning students (N=66, 58% male, average age 21.2yrs ). Level of agreement at time one in comparison to time two was assessed using Statistical Package for Social Sciences (SPSS) statistics software, version Level of agreement was acceptable ranging from 40% Page 3 of 9
12 to 74% for built environment factors and 52% to 84% for demographical factors. 3.4 Recruitment and distribution The stakeholders identified for this study were professionals and academics from the areas outlined in section 2.1. The questionnaire was hosted on and the survey link was distributed by . Lists of potential research participants were generated from a number of strategies. The entire population of elected public representatives for urban regions of the Greater Dublin Area were targeted. The delegates attending relevant conferences hosted by the Department of Transport, the Irish Sports Council, the Health Service Executive and the Engineers Ireland were selected. A systematic identification of relevant third level courses was undertaken to identify academics. Individuals from the identified stakeholder fields were contacted from listings from the golden pages telephone directory and from an internet search using the google search engine. Once this list of potential participants was generated, two recruitment methods were employed. Firstly, s with the survey web link were sent directly to individuals and secondly s were sent to companies and institutions for wider distribution. 3.5 Ethics Ethical approval for this study was obtained from the Dublin City University Research Ethics Committee. 3.6 Data Analysis All data were stored, cleaned and analysed using Statistical Package for Social Sciences (SPSS) version 17. Means, standard deviations and proportions were used to describe the data where appropriate. For each professional group, variations in data on level of agreement with study hypotheses and on factors influencing walkability were examined using a one-way independent ANOVA, with Games- Howell post hoc tests. Only factors found to be significantly different between groups are reported in the results. 4 RESULTS AND FINDINGS 4.1 Response rate A response rate of 28% (N=173 out of 609) was obtained from the individual s recruitment method. An additional 46 surveys were completed by the second recruitment method, giving a total of 216 responses. Independent samples distribution analysis was carried out to assess differences in the age, gender, profession or level of streetscape design experience between respondents recruited from both survey links. No significant differences were found between the samples on any of these variables, and so both datasets were combined for full analysis. Area of work Respondent numbers, grouped by area of work are shown on Table 1. Geographers were grouped with spatial planners and environmental policy professionals were grouped with public health and advocacy professionals. Table 1: Survey response distribution by professional group Professional Group Number % Spatial Planning (SP) Transport Planning (TP) Architecture & Design (AD) Public Health & Advocacy (PHA) Public Representative (PR) Engineering (E) Total Agreement with hypothesis The mean and standard deviation score for agreement with the study hypotheses were for human health, and for carbon emissions. The group statistics are presented on Table 2. Table 2: Agreement with hypothesis statements Human Health (p<0.05) Carbon Emissions (p<0.05) Profession Group Spatial Planning (SP) 4.64 (.5) 4.70 (.5) Transport Planning (TP) 4.62 (.7) 4.64 (.5) Architecture & Design (A&D) 4.83 (.6) (6) Public Health & Advocacy (PHA) 4.89 (.3) (.5) Public Representative (PR) 4.68 (.7) 4.68 (.5) Engineering (E) 4.38 (.8) 1, (.8) Note: Values are means (standard deviations). ANOVA p<0.05. Games-Howell post hoc, 1 E vs A&D, p<0.05, 2 E vs PH&A, p<0.01. Page 4 of 9
13 A significant difference was recorded between professional groups on their level of agreement with the human health hypothesis (F(df)=3.04(5), p<0.011), and post-hoc tests revealed that this difference was due to the mean score of engineer group being significantly lower than either public health and advocacy, or architecture and design groups (Table 2). A borderline between group difference was found on the carbon emissions hypothesis (F(df)=2.3, p<0.046), however this difference was not substantiated in the post hoc analyses. Factors influencing walkability The top five environmental factors that influence the walkability of an area according to the respondents were i) well maintained footpaths, ii) services (e.g. shops, schools) within walking distance of peoples homes, iii) well designed pedestrian crossings, iv) crime rate, and v) access to parks or other green spaces (Figure 1). The factors with the least influence were building height, residential density and pedestrian bridges. Mean scores of top five factors Access to parks and other green spaces (Above average crime rate) Many well designed pedestrian crossings Schools, shops, transport stops, recreation facilities Well maintained footpaths Mean score Figure 1: Mean scores of top five most influential factors A significant difference was recorded between professional groups on the contribution of seventeen of the forty seven factors to the walkability of an area. These factors are shown on Table 3. Spatial planners rated destinations, pedestrian crossings and well maintained footpaths as their top three influential factors. They rated attractive gardens, people begging and footpath congestion significantly lower in their influence on walkability than architects and designers, engineers and public representatives respectively. Transport planners rated well maintained footpaths, destinations and cul-de-sacs as their top three influential factors. They rated seven factors significantly lower than architects and designers; these included overlooked routes, unique characteristics of the area, attractive Page 5 of 9 gardens and mixed age profile of people living in the area. They rated four factors lower than public health and advocacy professionals; these included the presence of benches and mixed age profile of people living in the area. They rated the influence of pedestrian bridges significantly lower than either public representatives or engineers. Architects and designers rated walkability factors higher, on average, than all other professional groups. Specifically, they rated destinations, well maintained footpaths and green spaces as their top three most influential factors. On only one factor, the presence of pedestrian bridges over roads, did they rate its influence significantly lower than any other professional groups (these were public representatives, public health and advocacy professionals). Public health and advocacy professionals and public representatives rated well maintained footpaths and destinations as their top two, while public health placed proximity to green spaces as number three and crime rate was the third influential factor for public representatives. Both groups rated the overlapping functions of an area and if walking routes were overlooked significantly lower than architects and designers Engineers rated walkability factors lower, on average, than all other professional groups. They ranked the crime rate of an area ahead of well maintained footpaths and pedestrian crossings in their top three factors. They rated eight factors significantly lower than architects and designers, and four significantly lower than spatial planners. These factors included proximity to services, proximity to friends and family homes, availability of public spaces for people to gather and residential density. 5 DISCUSSION 5.1 Findings on Study Hypotheses This study represents the views of numerous stakeholders from different professional groups involved in designing and building walking environments or promoting walking behaviour. This group agreed that the way we plan and design our communities and transport systems affects human health. The level of endorsement was significantly lower among engineers than other professionals, indicating a potential lower
14 Table 3: Mean scores and standard deviations for factors by area of work Professional Groups Walkability Factors Schools, shops, transport stops, recreation facilities and other services within walking distance from people's homes SP TP AD PHA PR E 4.85 (.4) 4.59 (.8) 4.92 (.3) 4.75 (.4) 4.68 (.6) 4.45 (.6) Games Howell Post Hoc E<AD 2 E<SP 1 Friends/ family's homes within walking distance 4.52 (.5) 4.32 (.6) 4.63 (.5) 4.46 ( (.6) 4.24 (.5) E<AD 1 Public spaces where people can gather 4.18 (.5) 4.00 (.6) 4.31 (.8) 3.88 (.8) 4.11 (.7) 3.59 (.8) E<AD, SP 2 Mixed land use (variety of shops, residences, amenities and other uses) 4.31 (.6) 4.14 (.7) 4.33 (.5) 4.23 (.7) 4.07 (.6) 3.95 (.5) E<AD 2 (Low residential density) 3.38 (.8) 3.27 (1.0) 3.59 (.8) 3.12 (.9) 3.03 (.8) 2.80 (.9) Over lapping day and night functions in an area Route overlooked by occupied buildings, shops and residences 4.34 (.5) 4.11 (.7) 4.67 (.5) 4.04 (.6) 4.18 (.5) 4.20 (.6) 4.42 (.6) 4.16 (.7) 4.64 (.6) 3.70 (.9) 3.84 (1.0) 3.66 (.9) E<AD 2 E<SP 1 E, PHA, PR, TP< AD 2 E<SP 2 E, PHA, PR <AD 2 TP < AD 1 PHA < SP 2 (High walls surrounding properties) 4.09 (.7) 3.94 (.7) 4.42 (.7) 3.89 (.8) 4.03 (.7) 3.83 (.7) TP<AD 1 E<AD 2 Unique areas with personality and character 4.24 (.7) 3.92 (.6) 4.51 (.6) 4.48 (.6) 4.19 (.7) 4.27 (.5) TP<AD 2 TP<PHA 1 (Cul de Sac's) 4.25 (1.0) 4.54 (.7) 4.50 (.6) 3.96 (1.0) 3.89 (.9) 4.17 (.9) PR<AD, TP 1 Attractive gardens & trees along route 4.09 (.6) 3.95 (.6) 4.50 (.5) 4.25 (.6) 4.38 (.6) 4.17 (.7) SP<AD 1 TP<PR 1 TP<AD 2 Benches to stop and rest 4.24 (.7) 3.92 (.5) 4.39 (.6) 4.33 (.5) 4.25 (.6) 4.15 (.6) TP<AD, PHA 1 (People begging) 3.72 (.7) 4.19 (.7) 3.72 (.8) 4.00 (.8) 4.17 (.8) 4.20 (.7) SP<E 1 (Congestion on footpaths) 3.67 (.8) 3.89 (.6) 3.81 (.7) 4.08 (.6) 4.29 (.7) 4.00 (.8) SP<PR 1 (Large flat carparks) 3.91 (.7) 3.74 (.8) 4.19 (.8) 3.41 (.8) 3.91 (.8) 3.90 (.7) PHA < AD 2 Mixed age profile of people living in the TP<AD (.9) 3.47 (.6) 4.03 (.8) 4.08 (.6) 3.61 (.6) 3.70 (.7) area TP<PHA 2 TP<PHA, PR 2 Pedestrian bridges over roads 3.52 (1.1) 2.94 (1.1) 3.25 (1.1) 4.04 (.8) 4.04 (.9) 3.73 (.9) TP<E 1 AD<PHA, PR 1 Note: Values are means (standard deviations). 1 p<0.05, 2 p<0.01. Due to reverse coding range of scale 3-5, where 3 = no influence and 5 = influential. Reverse coded items are in parenthesis Page 6 of 9
15 priority of this area. No group differences were recorded on the level of agreement on how the way we design our communities and transport systems affects carbon emissions. All groups strongly agreed with this hypothesis. 5.2 Findings on walkability factors Respondents indicated that a common understanding exists on the importance of well maintained footpaths which is consistent with the literature across disciplines [1-5,10-12,14,20-28]. Analysis of data revealed that beyond the functional path professional groups think differently about walkability. Strategic planners and architects and designers rate the proximity to services/destinations top of their list of influential factors consistent with their professional descriptions [10,18]. Architects and designers rate significantly higher on more factors than any other profession and gave the highest mean score to the majority of factors suggesting a greater understanding of walkability consistent with statements by Forsyth and Southworth (2008) [21]. Engineers display a functional perspective on walkability which lends support to Lo (2009) [14] who highlighted the tendency of engineers and traffic planners to treat pedestrians like motorised vehicles with little consideration for factors not relating to the functional route. Engineers generally rate walkability factors lower than other professions. This would suggest that engineers are less aware of the impact that the built environment can have on an individual s decision to walk. Consideration of the fact that engineers and public representatives rated overlapping day and night functions of an area, overlooked routes and the influence of high walls significantly lower than architects and designers and rated crime in their top three factors influencing walkability would imply a lack of understanding of the functional purpose of these factors on the safety of an area. Traffic planners were high on connectivity factors (the influence of cul-de-sacs) and proximity to destinations, but significantly lower than architects and designers on aesthetics (unique areas, gardens and trees) which supports the methods recommended by Frank and colleagues (2008) [2] and Cervero and Kockelman (1997) [22] to measure walkability. Page 7 of 9 This study found that residential density rated second lowest on influence on walkability out of forty seven factors. This is contradictory to many studies [1-5,20,26,27]. These studies suggest that higher densities result in closer proximities to services. The high ranking of proximity to destinations and the low ranking of residential density would suggest that density itself is not an issue provided services are nearby. The results also highlighted potential differences between the ideal theoretical perspectives and the actualities that exist. Public representatives and public health and advocacy professionals rated the influence of pedestrian bridges significantly higher than transport planners and architects and designers. There is an accepted understanding among designers that pedestrian bridges do not always function as intended, as outlined in Räsänen and colleagues (2007) [30], this research suggests that this may not be apparent to public representatives and public health and advocacy professionals. Similarly, public representatives rated the influence of cul-de-sacs significantly lower than transport planners and designers; this highlights a potential conflict of understanding of the influence of cul-de-sacs/ closed off estates, which have been popular in recent years, on the walkability of the area. Public health and advocacy professionals rate green spaces as the third most influential factor on the walkability of the area. The also rated unique areas with personality and character, benches to stop and rest and a mixed age profile recognising the recreational and social aspects to walkability. 6 CONCLUSIONS The findings suggest that all professions agree that the presence of quality functional routes, destinations within walking distance and perceptions of safety on the walkability of an area. However the importance of aesthetic factors, the visual interest along a route, the presence of cul-de-sacs, the availability of benches, and having people of mixed age profile in an area received a higher priority for some professions than others. Ultimately, this difference in opinion could affect what is included in an area or what is excluded. Our challenge is how to communicate the key factors influencing walkability to the key
16 decision makers who design and build our environments. 7 ACKNOWLEDGEMENTS The Cleaner, Greener, Leaner Study is funded by the Environmental Protection Agency s STRIVE programme. 8 REFERENCES [1] Brownson, R. C., Hoehner, C. M., Day, K Measuring the Built Environment for Physical Activity: State of the Science. American Journal of Preventive Medicine. 36 (4, Supplement 1), pps99-s123.e12. [2] Frank, L., Kerr, J., Sallis, J., Miles, R. and Chapman, J A hierarchy of sociodemographic and environmental correlates of walking and obesity. Preventive Medicine. 47 pp [3] Owen, N., Humpel, N., Leslie, E Understanding environmental influences on walking: Review and research agenda. American Journal of Preventive Medicine. 27 (1), pp [4] Pikora, T., Giles-Corti, B., Bull, F Developing a framework for assessment of the environmental determinants of walking and cycling. Social science & medicine. 56 (8), pp [5] Handy, S.L., Boarnet, M.G., Ewing, R., Killingsworth, R.E How the Built Environment Affects Physical Activity, Views from Urban Planning. American Journal of Preventative Medicine. 23 (S2) pp64-73 [6] Department of Transport SmarterTravel, A Sustainable Transport Future. [7] Department of Environment, Heritage and Local Government Guidelines for Planning Authorities on Sustainable Residential Development in Urban Areas (Cities, Towns & Villages). Practice. Available from: < B6VG7-4WD10W4-1/2/34b395edfd0f7786d12ee5251c4c69cd> [Accessed 19 February 2010] [9] Frank LD, Engelke PO, Schmid TL. Health and community design: The impact of the built environment on physical activity. Washington DC, USA: Island Press, [10] Southworth, M Designing the Walkable City. American Society of Civil Engineers Journal of Urban Planning and Development. 131 (4), pp [11] Stoner, T., Beatriz de Arruda Campos, Maria., Chiaradia, A., Takamatsu, S. and Smith, A Towards a 'walkability index'. European Transport Conference Strasbourg, France Available from:< wards-a-walkability-index> [Accessed 29 January 2010] [12] Ewing and Handy Measuring the Unmeasurable: Urban Design Qualities Related to Walkability. Journal of Urban Design. 14 (1), pp [13] Foster, S. and Giles-Corti, B The built environment, neighborhood crime and constrained physical activity: An exploration of inconsistent findings. Preventive medicine. 47 (3), pp [14] Lo, R. H Walkability: what is it? Journal of Urbanism: International Research on Placemaking and Urban Sustainability. 2 (2), pp [15] Allender, S., Cavill, N., Parker, M. and Foster, C Tell us something we don't already know or do! The response of planning and transport professionals to public health guidance on the built environment and physical activity. Journal of public health policy. 30 (1), pp [8] Stanley, J. K., Hensher, D. A. and Loader, C Road transport and climate change: Stepping off the greenhouse gas. Transportation Research Part A: Policy and [16] Lee, C. and Moudon, A. V Physical activity and environment research in the health field: Implications for urban and transportation Page 8 of 9
17 planning practice and research\. Journal of Planning Literature. 19 (2), pp [17] Irish Planning Institute. (no date) [Internet]. Available from: < [Accessed 1 June 2010]. [18] American Planning Association. What do planners do? (no date) [Internet]. Available from: < splanning.htm#2> [Accessed 17 May 2010]. Chapman, J.E., Kerr, J Neighborhood built environment and income: Examining multiple health outcomes. Social Science & Medicine. 68 (7) pp [28] Burden, L.(2010), Walkability, [Internet] Available from: < [Accessed 29 January 2010]. [29] The Highways Agency Design Manual for Roads and Bridges, Volume 6: Road Geometry. Section 2: Junctions, pg 4/1 [19] Amekudzi, A. and Meyer, M. M Considering the Environment in Transportation Planning: Review of Emerging Paradigms and Practice in the United States.. Journal of Urban Planning & Development. 132 (1), pp [30] Räsänen, M., Lajunen, T., Alticafarbay, F. and Aydin, C Pedestrian self-reports of factors influencing the use of pedestrian bridges. Accident Analysis & Prevention. 39 (5), pp [20] Cervero, R. and Kockelman, K Travel demand and the 3Ds: Density, diversity, and design. Transportation Research Part D: Transport and Environment. 2 (3), pp [21] Forsyth, A. and Southworth, M Cities Afoot Pedestrians, Walkability and Urban Design. Journal of Urban Design. 13 (1), pp 1-3 [22] Lynch, K Image of the city. 2nd ed. Cambridge, Mass: M.I.T. Press. [23] Gehl, J Life between buildings: using public space. 6th ed. Copenhagen: Arkitektens Forlag : Danish Architectural Press. [24] Cullen, G The Concise Townscape. Oxford: The Architectural Press. [25] Lyewelyn-Davies Urban Design Compendium [26] Hoehner, C. M., Brennan Ramirez, L. K., Elliott, M. B Perceived and objective environmental measures and physical activity among urban adults. American Journal of Preventive Medicine. 28 (2, Supplement 2), pp [27] Sallis, J.F., Saelens, B.E., Frank, L.D., Conway, T.L., Slymen, D.J., Cain, K.L., Page 9 of 9
18 CYCLING PROMOTION IN A UNIVERSITY CONTEXT EXPERIENCES AND OPPORTUNITIES Stephan Koch Commuter Plan Manager, Buildings and Estates Office, University College Cork, s.koch@ucc.ie ABSTRACT Cycling as a sustainable mode of transport has significantly gained momentum in Ireland within the recent past, not least through the Government s Smarter Travel initiative and the publication of its first National Cycling Policy Framework. The DublinBikes rental scheme has proven to be far more popular than anticipated, and there are increasing numbers of cyclists on the roads of Irish cities. Large employers and educational institutions, especially universities that combine both functions, can play a major role in promoting bicycles for everyday use at local level. University College Cork has committed itself to persistently promoting cycling among its staff and students, totalling a college population of c. 19,000. This paper shall show from a practical perspective what can be done to promote cycling in a university context, beyond the obvious such as the provision of high quality bicycle racks and the adoption of the Government s Employer Bicycle Scheme. In this regard the paper will for instance present a small scale bicycle rental scheme, which UCC presently is preparing for its campus. But as the Universities immediate influence is limited to the campus boundaries, it will further be shown what needs to be done in terms of safe and comfortable access routes for cyclists to campus, in particular by the local authorities. Cycle lanes and tracks will come to people s minds first. However, there is much more that can and needs to be done in addition to red paint on the tarmac of existing urban main roads. Here, a closer look will be taken at the aspect of a more sustainable layout of the (sub)urban built environment, where the Government and the local authorities are in charge in terms of planning guidelines and practices, emphasising on permeability of the urban fabric for non motorised modes of transport. A significant long term modal shift to non motorised modes of transport, apart from enhanced public transport, will be critical for meeting long term reduction targets for carbon emissions, as it can be assumed that an increased efficiency of car engines alone will not suffice. Keywords: Cycling, University, Workplace, Road Infrastructure, Urban Planning, Sustainable Travel 1 INTRODUCTION In small- and medium-sized towns and cities, where many everyday journeys only cover a few kilometres, cycling can be an ideal means of transport. For distances between one and five kilometres, cycling can often be quicker than driving, given inner city road networks that usually are clogged during the morning and evening rush hours. University cities happen to be an ideal case for cycling. A mostly young student population can avail of a cost-effective means to fulfil their mobility needs, a university staff body is deemed to be open minded for sustainable travel options at a more than average scale, and many members of the university community have international biographies, so they might have had positive experiences living in countries where cycling is very popular despite mass motorisation. Using the example of University College Cork (UCC), where the author has been working as Commuter Plan Manger for the last four years, this paper will not only describe ways to facilitate and promote cycling as a sustainable means of everyday Page 1 of 7

19 mobility but also discuss the limitations and difficulties in doing so both in and outside the campus boundaries. This case study is primarily based on personal experiences from daily work at UCC and from collaboration with many people in Cork, who are in one way or the other involved in cycling (e.g. members of the Cork Cycling Campaign, the City Council Traffic Division and others). Cork City has a population of c. 120,000 with another 70,000 in the immediately adjoining suburbs (e.g. Douglas, Ballincollig, etc.). UCC is situated in an inner city location, about one to two kilometres southwest from the city centre. With staff of c. 2,500 and about 16,000 students, UCC is one of Cork s biggest employers and Munster s largest educational institution. It has a very compact campus that in its main parts stretches over half a kilometre, with some outlying parts at c. 1-2 km off the Main Campus. Its major part is along the banks of the River Lee and on a slope up to Cork s south side. 2 UCC S COMMITMENT TO A GREEN TRAVEL POLICY The University has committed itself to an active green travel policy. This process started in the late 1990s, when along with substantial expansions and increased traffic to and from UCC that followed a rise in student and staff numbers, the issue of commuting needed to be addressed. A Commuter Plan has formally been in place since 2005, aiming at a modal shift from the single occupancy private car towards alternative modes of transport: walking, cycling, public transport, car pooling, Park+Ride, Park+Cycle. Further, UCC has been offering its staff members access to car sharing since 2008 [1], as the first university in Ireland. A full time Commuter Plan Manager was appointed in 2006 to manage and coordinate all different aspects of physical access, transport and commuting to UCC, to promote the various options of sustainable travel inside the University and to liaise with all parties involved in and outside the campus, with Cork City Council s Traffic Division being the foremost important partner. Further, UCC was awarded the status of Green Flag Campus by An Taisce and the Foundation for Environmental Education (FEE) in February 2010, being the first third level institution worldwide to have achieved this status. This both student and administration based initiative focuses on various aspects, travel being one of them along with energy, waste and water. 3 FACILITATING CYCLING ON CAMPUS 3.1 On-campus infrastructure A university seems to be the ideal place to promote cycling. An open minded and presumably more than average environmentally aware staff body meets a young student population with its traditional budgetary constraints. So what can a university do to actively encourage its population to cycle? The very obvious is the provision of sufficient, fitfor-purpose and secure bicycle parking facilities on site. Today UCC provides bicycle stands for c. 850 bicycles around all parts of its campus. The majority of them are Sheffield type or similar hoops to lean a bike against from either side, letting the cyclists comfortably lock their bikes with the frame to the rack (figure 1). Figure 1. UCC standard bicycle rack When opening two new building complexes in recent years, UCC took the opportunity to provide room for ample bicycle parking from the start. In the older parts of the campus, however, the limited availability of space and other constraints sometimes still make it harder to identify suitable locations for additional racks. The cyclists wish to park their bikes closest to the building where they work or study often leads to a parking demand Page 2 of 7
20 exceeding capacity in some locations, while many racks remain vacant in others. The provision of covered bicycle racks is not only a question of extra funding, but can often mean a challenge to the aesthetic appearance of the campus in places, and adequate design solutions might collide with budgetary constraints. Apart from high quality parking, changing facilities for cyclists have become increasingly important, especially for cycling members of staff. While in the Brookfield Health Science Complex, which opened in 2003, existing showers may be used by cyclists, the opening of the new Western Gateway Building (home to up to 400 staff) in 2009 saw the installation of dedicated shower / locker facilities for cyclists from day one. Recently a set of five shower cubicles was retrofitted in an older building on the Main Campus. Along with large lockers, they will give staff members a chance to refresh and change clothing after cycling into work and before starting the working day. 3.2 Cycle-to-Work Scheme Supporting staff members in the acquisition of a good bicycle is one of the clearest incentives that an employer can offer to encourage staff to cycle to work. As such, the Government s Cycle to Work tax incentive scheme, initiated in 2009, provides employers with an ideal tool for doing so. UCC adopted the scheme in September To date, hardly one year later, almost 200 staff members (meaning c. 8% of the staff body) acquired a new bicycle through UCC under this scheme. In terms of providing the student body with a similar opportunity, UCC together with the Students Union is exploring the option of getting bicycle packages set up in a bulk order so as to realise substantial discounts. There are also attempts to facilitate a second hand bicycle market. 3.3 Information Information about all means that are available to travel to UCC is provided on a comprehensive website section of the University s homepage ( Commuting, Access and Parking, Among other topics, information about cycling related events in Cork is disseminated to staff and students, and through various promotion activities awareness is raised for cycling. 4 BEYOND THE CAMPUS FENCE CYCLING TO UCC ON CORK ROADS Although the University s immediate influence finds its limits at the college gates, it is outside the campus where the real challenges start. Before parking their bikes on the campus, people need to cycle to UCC on Cork roads. Feedback about the general condition of cyclists in Cork s road traffic is ambiguous. Experienced cyclists usually seem to get along with road traffic conditions quite well in general, and only tend to complain about specific danger spots. However, a common attitude among the general population is: I will be taking my life in my hands when I start cycling in road traffic. As a result many people refrain from doing so. 4.1 Challenges in Road Traffic It might be interesting here to ask the reasons why. Is it because of drivers inconsiderate behaviour? A lack of cycling skills and education or forgotten cycling habits and a lack of confidence? A road side cycling infrastructure which still holds lots of room for improvement or the multitude of dangerous surprises that road surface conditions might have in stock? A fair mix of everything with a varying emphasis on one or the other aspect will come closest to the truth. Inconsiderate Drivers Regarding inconsiderate behaviour by many drivers towards cyclists, there is a somewhat simple and banal rule of thumb that gets quoted every now and again when getting reports from cycling countries abroad (e.g. The Netherlands, Denmark, Germany etc.): Safety in numbers! The more cyclists that drivers come across on the roads, the more aware of cyclists the driving population will become. And even better, the more that drivers also tend to cycle every now and again, the more aware they will be of cyclists needs in road traffic. Cyclists Skills Many people willing to cycle express their discomfort with cycling in road traffic. They might not have cycled in city traffic for years or decades, with the volumes of car traffic having dramatically risen since. Over the past two years, Cork City Council have offered free cycling training courses for adults to the general public on various occasions, which were widely advertised in UCC. These (usually one-afternoon) courses were given Page 3 of 7
21 by experienced cycling instructors and started in a park and on a quiet road nearby and ended with a guided cycle through busier city road traffic. The feedback used to be very positive throughout and will serve for more and more people taking the step and go out on the roads on their bike with more confidence. The more people can attend such training courses, especially at an early age (e.g. when courses are offered in secondary schools), the more people will feel confident enough to use the bicycle in road traffic on a regular basis. 4.2 Cycling Infrastructure Regarding road side cycling infrastructure, there is one general concession to be mentioned at the start: Yes, streets in Irish cities are often narrow, available space is limited and in many cases the roads cross sections do not provide the space for additional cycle lanes along with two way car traffic. But even though many people would call for more cycle lanes, this should be translated to: Have a cycling infrastructure, as part of a hierarchic road network for all different road users. Catering for cyclists is not all about putting red paint on the ground. There is a comprehensive bundle of measures that can make city streets more pleasant and safe to cycle on. In the case of Cork City and the surroundings of UCC in particular, the road network has a number of constraints deriving from the city s topography. Western Road right outside UCC is the major trunk road towards the West, with hardly any alternative. Slopes between the River Lee and the hilly south side can be quite steep in places, still less however than on the city s north side, and a multitude of one way streets (either because of narrow cross sections or as a means of traffic management) very often impose major detours on motorists and cyclists alike with no distinction. While the former might be valid and intended for means of traffic management and calming for motorised traffic, the latter is a huge deterrent for promoting cycling as a fast and green alternative. 4.3 Opportunities in Cork for a network of cycling routes But despite these constraints, there is tremendous potential in Cork to create a network of cycling routes combining all of the elements mentioned above. With the combination of (in major parts existing) more quiet residential roads, off-road greenways and short stretches of contra flow cycle lanes in one-way streets along with adequate sign-posting there are good opportunities to create a skeleton cycling route network. Reducing the speed difference between a cyclist and motorised traffic by means of traffic calming (e.g. 30 km/h speed limits) will lead to higher safety and comfort. This will typically apply to residential roads that are part of a cycling route and cater for motorised traffic only locally, but may also be used in city centre streets to make High Street locations more accessible for cyclists (as planned for Cork City). Other measures include: Provision of direct enough alternatives to major thoroughfares through quiet parallel streets Combination of residential streets and wide footpaths offside roads to cycling routes Opening of suburban cul-de-sacs (where physically possible) for cyclists and pedestrians Opening of one-way streets to cyclists in the opposite direction, by means of a physically separated track, marked contra-flow cycle lane or by specific traffic signage ( no entry, except cyclists ). Allowing contra flow cycling in wide enough one-way streets in some few key locations (e.g. Pope s Quay) can provide a fast, direct (and legal) link from UCC to the city centre and to Kent Train Station. This route would mostly run along the river banks and quays, so there would be no significant slopes involved Paving along with sign-posting of a (quite hidden) footpath along side a stream can provide the missing link for a south-western cycling route to UCC (Glasheen River between Glasheen Road and Magazine / College Road) Some improved road surface, a stretch of contra flow lane and some ramps to an existing footpath on a former railway track, along with adequate sign-posting, can create an excellent 5km high quality cycling route linking highly populated housing areas, an office and retail park (Mahon Point / City Gate office park) to city centre on a greenway (former Blackrock Railway line, Marina, Centre Park Road) Page 4 of 7

22 A small number of short links for cyclists and pedestrians between crescent shape or cul-desac residential roads may provide a cycling route from highly populated Douglas into the city centre or when cutting across the south side, to UCC, avoiding the very busy and narrow thoroughfare of Douglas Road. These are only very few examples where small scale adjustments to the layout of existing roads and paths could make a difference for creating a more cycling friendly environment in Cork. 4.4 Suburban Road and Path Layout The typical road layout in Irish suburbs usually does not favour cycling (and walking) over longer distances while avoiding busy main roads, as will be shown in the following example. The Ballincollig Example Situated about 5km west of UCC, Ballincollig (c.17,000 population) has become an important commuting town over the last couple of years and is home to a considerable number of UCC staff members and students. It basically stretches some three kilometres along an east-west main road, with lots of housing estates built in the recent past. Many of these estates follow the same principle as regards their footprint: Starting from the town s main road, one access road serves a large number of cul-desacs not allowing any traffic other than for local access to pass through, which is for a worthy cause. But at the same time, often the complete absence of any additional links for pedestrians or cyclists between these estates can be observed. In many cases, walls completely separate one estate from the other. This forms a number of isolated islands within the suburban fabric, only connected to the outside world at one single access point. While this tree shape road layout serves the positive principle of (motorised) traffic calming, it forces pedestrians and cyclists to end up on the main road sooner rather than later, where they will often find themselves in an uncomfortable environment, primarily designed for high volume car traffic. This lack of permeability, which also imposes significant detours, denies cyclists and pedestrians the opportunity to travel longer distances away from main roads with significant volumes of motorised traffic on them. Figure 2 shows a part of Ballincollig, with the added lines highlighting the separation of neighbouring estates. Ballincollig is linked to Cork by two cyclable roads: While the one can be characterised as a suburban thoroughfare, lit all the way but with a number of climbs and dips, the other is a 2km long straight, flat country road, with a 100 km/h speed limit and no lighting in parts (to date). It can be assumed that a safe and comfortable link to Cork together with an improved permeability of the town fabric can mobilise a huge potential for bicycle commuting to UCC. Figure 2. Estates footprint in Ballincollig West This pattern of a non permeable layout of towns and estates can often be observed in the Irish suburban context, and must be regarded as one major impediment to cycling, leading to a high degree of car dependency at the very start of the journey. Another paper in this conference will examine the walkability of Irish suburbs in further detail. The knock on effects of such town layouts on the travel behaviour especially of children and the subsequent health effects have recently been described and criticised in a position paper published by the Irish Heart Foundation [2]. The Role of Local Authorities, Businesses and Developers The local authorities (city, county and town councils) can and must play an important role in good and fit-for-purpose planning as well as for rectifying less fortunate results of same in the past. Local businesses as a major and influential stakeholder group must be taken on board as well as developers of housing estates and business or Page 5 of 7
23 retail complexes. Businesses will typically fear a loss of accessibility for their car driving customers in connection with traffic calming measures. But they must also be shown the opportunities that accompany an improved shopping experience, including a greater pleasure for shoppers of being in a less car dominated town or city centre. Studies have proven that local businesses benefit from a more pleasant shopping environment and tend to over estimate the importance of easy car access for their patronage. Developers by nature will have other targets than a local council when building a new estate. But the local authorities hold the key to what will be built in their town or city, when they are to grant planning permission for a new development. It must be up to them to take active leadership in creating the town s road, foot and cycle path network layout. They should consider the planning process as a creative process rather than a formal act, in order to avoid towns and suburbs that look like a patchwork of isolated estates, almost chiselling car dependency in stone to the highest degree, as can often be observed as a result of less favourable results of past planning. This train of thought has led a fair bit away from the immediate influence of the University in terms of cycling promotion. But it can be understood as the University s role as local stakeholder and bearer of a huge amount of knowledge to raise awareness for such contexts and interdependencies, both through research within the related faculties and disciplines and locally in the course of public consultation processes. Because: Staff and students who can leave their homes only by car are unlikely to arrive in college by bike. 5 THE UCC CAMPUS-BIKE SCHEME Despite all efforts, there will always be a considerable number of university (staff) members who do not come to work by bicycle, because they need to drop their children at school, they live too far away to cycle in, or various other constraints. In order to give these people access to a bike during the day, UCC is in the process of establishing a communal bicycle scheme. This scheme called CampusBikes was proposed as a demonstration project under the Department of Transport s Smarter Travel Fund programme in September 2009, and UCC was granted significant funding for it. The project has a volume of 30,000, two-thirds of which funded through Smarter Travel for a duration of 18 months. At its pilot stage, the CampusBikes fleet will consist of 10 bicycles, located throughout the greater UCC Campus at five different locations. The bikes will be available to staff members for short term use during the working day, for travel between different parts of campus or within Cork City, primarily, but not only, for work related purposes. The scheme can be regarded as a mini version of the Dublin Bikes (public rental) scheme, with some significant differences to be noted: It shall operate without an expensive background infrastructure, it will be free of charge and open to a far less anonymous, still limited target group. It will be designed for round trips only (no one-way bookings). The most significant difference, however, in legal terms will be the fact that the employer will provide bicycles to its employees for work purpose use, which leads to a different relationship between the user and the service provider. CampusBikes will give UCC staff easy access to a bicycle in college, providing a new degree of mobility for short trips, faster than walking or driving, avoiding all issues of parking. It shall raise awareness for a green and healthy travel option and lower the threshold of using a bicycle. The CampusBikes scheme is designed for an ongoing operation, once the formal 18 month pilot has ended, and may be extended to further user groups in UCC, namely to the student population (at this stage, charges will need to be addressed). The scheme shall serve as a demonstrator for any kind of campus, educational, health or business, as a strong emphasis is laid on its documentation and transferability. CampusBikes is planned to replace up to 200 motorised trips (car, taxi) per month, and to make cycling as easily accessible as possible, as a means of transportation, for a significant number of people, be they experienced cyclists or novices to the two wheels. With CampusBikes, University College Cork will bring cycling (back) to people s minds as a matter of cause in their every day mobility. 6 CONCLUSION A university has many opportunities and means to encourage and facilitate cycling among its staff and Page 6 of 7
24 student body, ranging from provision of basic access and parking infrastructure to incentives for acquiring a bicycle, dissemination of information and raising awareness about the benefits. But providing a decent cycling infrastructure for getting to the campus and back is up to the local authorities. They are in charge for both soft measures (winning people s hearts and minds) as well as for hard measures, like substantial improvements for cyclists on their roads. The local councils need to take on this challenge and the university as a local stakeholder can support the council in this respect. And where there are institutional impediments for the councils to do so, the local authorities must be enabled to be a driving force in this process, and administrative structures and legislation should be subject to review in case. The Irish Government s National Cycling Policy Framework, published in early 2009, as part of its Smarter Travel programme, is an excellent basis for creating a more cycling friendly environment and for establishing a cycling culture comparable to other European countries. In Cork City, there has been and continues to be a fruitful cooperation between the City Council Traffic Division and UCC (and other local parties involved) and a good climate to promote cycling. This is also manifested in Cork City s very ambitious bid to become a Smarter Travel Area, with substantial funding for sustainable travel projects from the Department of Transport. This is fully supported by University College Cork, and the prospects are good that in Cork, we can make a difference in the way we all move in our city, in a greener, healthier, more space and cost effective and future proof way. Stephan Koch, Dipl.-Ing. Commuter Plan Manager Buildings and Estates University College Cork College Road Cork, Ireland s.koch@ucc.ie ANNOTATIONS / REFERENCES [1] Car sharing schemes consist of a fleet of cars for short term rental, based throughout the city (also known as car clubs, not to be confused with lift sharing) [2] National Heart Alliance and Irish Heart Foundation, Building Young Hearts, Physical Activity, Young People and the Physical Environment, April 2010 Page 7 of 7
25 THE POTENTIAL FOR ORIGIN-BASED MOBILITY MANAGEMENT PLANS (PERSONALISED TRAVEL PLANS) IN THE GREATER DUBLIN AREA David O Connor 1 1. Lecturer in Transport Planning and Urban Design, School of Spatial Planning, Dublin Institute of Technology, Ireland; david.oconnor@dit.ie ABSTRACT Personalised Travel Planning, a form of mobility management planning targeted at the trip-origin (in other words at residential areas), has proved to be a reliable and cost-effective means of reducing car usage in favour of other more sustainable travel forms. These direct-marketing schemes, which target communities with individually tailored travel information materials, succeed in reducing car usage with no investment in hard infrastructure. The concept, when subjected to rigorous academic and other independent scrutiny, has reportedly achieved consistent mode transfers away from car-usage of five to fifteen per cent. This has often taken place in lowdensity areas of high car ownership rates and results have been maintained over time. In Australia, every major city has commissioned personalised travel planning programmes. In the UK, the government has, on foot of successful pilot studies, recommended the implementation of such schemes across all local authorities. Recently, three Smarter Travel Town initiatives in the UK where suites of soft transport planning measures were piloted suggested that personalised travel planning can be a core and successful component of any such program. This study seeks to assess the applicability of such concepts within the Greater Dublin Area. Initial evidence suggests the methodology is applicable with potentially high benefit : cost ratios. A pilot survey, undertaken as part of earlier research, revealed that within five selected newly developed areas individuals response to the concept is comparable, if not more favourable to that revealed in other travel markets. A benchmarking study carried out in Drimnagh during March 2010 as part of the Dublin City Council Smarter Travel Town bid demonstrated high levels of community receptivity to such a scheme. The context and revealed market response indicates that such schemes are likely to achieve a successful outcome within Dublin. Indeed, one recent pilot, at Adamstown, yielded very positive results after a thorough programme was piloted to more than 200 households. Assessment of the initiative in other markets suggests certain cautions. A groundbreaking UK study, Smarter Choices, which thoroughly assesses all soft, or behavioural transport planning initiatives in the UK, warns that such initiatives should only be implemented alongside complementary demand-management measures. Otherwise, gains in reduced congestion will only be lost to alternate users not targeted by the scheme. Nevertheless, the evidence suggests that Personalised Travel Planning, when combined with demand management and introduced to areas where available public transport capacity exists, has the potential to make significant impacts on car usage within the Greater Dublin Area. Keywords: Personalised Travel Planning, Smarter Travel, Origin-based Mobility Management Planning for this reason is often classified as a travel behavioural change initiative. Mobility management has traditionally focused on the trip-end. Recent evidence strongly suggests that the most effective means of achieving sustainable target objectives is by targeting the trip-origin (residential areas). A number of methodologies have emerged based on this principle and some, in particular, have been shown to be very successful in 1 INTRODUCTION This paper discusses the potential for Origin-based Mobility Management Planning in the Greater Dublin Area. By Origin-based Mobility Management Planning, it is meant to describe noninfrastructural (often described as soft ) measures, which can be applied to residential, or primarily residential areas to reduce the demand for travel and to promote environmentally sustainable travel behaviour. Mobility Management is an attempt at improving mobility by influencing behaviour and Page 1 of 16 other markets. These approaches, known as Personalised Travel Planning, involve programmes whereby individuals are contacted and provided
26 2.1 Study Area Profile The study area is a mature, low-density residential suburb of Dublin. Public transport services to the area are good, including the Tallaght LUAS light rail line and the Crumlin Road QBC. The survey and proposed scheme represents an intervention in a mature low-density residential suburb with relatively high private car mode shares (55% per baseline survey). The target area is characteristically low-density, fostering high car dependency. Infrastructure and public transport services are notoriously costineffective in such environments. Yet Personalised Travel Planning has been demonstrated to be an effective tool for reducing car dependency and improving mobility with sustained results over time. with tailored information to assist them in altering their travel behaviour should they so wish. The first part of this paper describes a recently undertaken benchmarking study in Drimnagh, Dublin. Undertaken in March 2010 its aim was to pilot the initial stages of a Personalised Travel Planning (PTP) program and assess the potential for such a scheme in the area. The second part of this paper looks at the evolution of PTP and appraises the benefits and risks of the methodology as likely to be applied within Dublin. 2 PART I DRIMNAGH SMARTER TRAVEL TOWN BENCHMARK PTP SURVEY During 2010 Dublin City Council prepared a bid to have Drimnagh designated as a Smarter Travel town. Smarter Travel towns are areas where latest practices and investments in sustainable travel are piloted and reviewed. One of the initiatives being explored is a Personalised Travel Plan, whereby local people are encouraged to improve their travel behaviour via direct marketing. As part of UniverCities (part of the Creative Dublin Alliance) and Students Learning with Communities (SLWC) initiatives, DIT School of Spatial Planning agreed to carry out a survey of the local community to gauge interest in and the likely success of such an initiative. This was a door-to-door questionnaire survey and was carried out by second year BSc Spatial Planning and Environmental Management students during March 2010 as part of the Techniques II Data Collection & Survey Methods module. The DIT Programme for Students Learning With Communities supports staff and students engaging in community-based learning and research (also known as service-learning), and builds links with communities. Students Learning With Communities involves DIT staff and/or students working with community partners (local groups, not-for-profit organisations, etc) to develop real-life projects. Learning comes alive for the students as they work on these projects with real clients, applying their specialist subject skills, and receiving course credits for their work. The community becomes part of the teaching process and benefits from the students work. These projects give all participants the opportunity to engage in critical thinking and to develop their social awareness. The Programme for Students Learning With Communities ultimately aims to energise participants to work for social change. 2.2 Survey Methodology The survey was undertaken door-to-door on Thursday 4th March 2010 between 4PM and 8PM. While most surveys were collected during this period, a small number were collected during the subsequent weekend. Conditions were fair for the duration of the survey. 233 households were surveyed. This represents approximately a 5% sample of the target neighbourhood, which itself consists of 4,780 houses. The surveys were carried out by 5 teams of two students each. Each team was designated a locality within Drimnagh Integrated Area Plan and required to collect 50 surveys. Group E (Slievenamon) gathered 33 surveys. The localities were discussed with local community representatives at a forum organised by Dublin City Council to make sure that they were a representative sample of the wider area. 2.3 About Personalised Travel Planning Personalised Travel Planning (PTP) schemes aim to encourage increased cycling, walking and public transport usage among communities. PTP is a direct marketing scheme which targets communities with tailored, individualised information to reduce car dependency and promote public transport and cycling/walking. PTP is best suited to lowmedium-density suburban and semi-suburban residential neighbourhoods, where sustainable travel gains are otherwise difficult to achieve. The proposed PTP in the Drimnagh IAP area can test the methodology with local improvements to cycle / pedestrian infrastructure. Page 2 of 16
27 Personalised Travel Planning normally comprises a three stage process: - Initial benchmark travel survey Household Marketing Campaign Ongoing travel surveys The PTP scheme is an awareness raising exercise targeted directly in the community. A benchmark travel survey is carried out to profile existing behaviour and assess the potential for change. An individualised marketing campaign can then deliver tailored information to all households expressing an interest in the scheme. Evidence suggests that through direct marketing awareness raising households will modify their travel behaviour towards more sustainable practices. Ongoing travel surveys are finally conducted to monitor progress and benchmark the performance of the programme. Various independent UK (UK Dept. for Transport, Smarter Choices, 2004 / Merseyside Pilot PTP 2009 / Sutton Pilot PTP 2009) and Australian evaluations suggest that PTP typically delivers 5-15% sustained mode shift away from private car towards walking, cycling and public transport with no required investment in services or infrastructure and also suggest positive cost : benefit ratios. ( / In planning terms, the benefits of PTP schemes are considered to be threefold. Firstly, Sustainable Communities can be protected and developed fostering improved health; carbon footprint reduction; improved social cohesion. Secondly, Sustainable Transport is a natural aim of the program creating a reduction in traffic levels; public transport mode share increase; increased cycling / walking mode share; reduced car dependency. Finally Sustainable Planning is pursued through finding a cost-effective methodology for reducing car dependency in low / medium-density residential environments. 2.4 Main Survey Findings The entire survey, some of which examined variances between areas within the study area, will not be described here. Below, however, are the responses to and analysis of the most pertinent aspects of the survey inquiry. The analysis compares the results with typical or expected results based on benchmarking studies and outcomes from other markets. These outcomes and their limitations will be discussed in greater detail in Section II of this paper (below). Figure 1. Mode of travel to place of work or education 54% of respondents travel to work or education by car 10% of respondents travel to work or education by rail 11% of respondents travel to work or education by bus 9% of respondents travel to work or education by bicycle or foot Travel behaviour varied quite significantly between localities, with a higher car mode share in Comeragh Road (70%) than Brickfields Park (40%). Not applicables were made up of a relatively high number of taxi drivers and also outof-work people. Rail was highest in Galtymore / Cooley Road (22%) but relatively consistent elsewhere (8 11%). Figure 2. Distances travelled to work 12% of respondents travel 0 2km to work or education 27% of respondents travel 2 5km to work or education 27% of respondents travel 5 10km to work or education 34% of respondents travel more than 10km to work or education Page 3 of 16
28 Proceedings of ITRN2010, 31st August to 1st September 2010, University College Dublin, Ireland Distances travelled to work in the area are relatively Only 20% had a necessity to use the car. high, reflecting perhaps its suburban nature distant Benchmarked against other markets where PTP from main centres of employment. 39%, however, schemes have been carried out this is quite a typical travel less than 5km and could be targeted for situation. Using the PTP methodology a significant potential transfer to walking or cycling modes. percentage of the community (47%) could be targeted for mode transfer. PTP schemes are generally successful where 40% or more have the potential for change. Figure 3. Time travelled to work or education 21% of respondents travel under 15 minutes to work or education 38% of respondents travel minutes to work or education 20% of respondents travel minutes to work or education 21% of respondents travel more than 45 minutes to work or education Times travelled to work or education could be considered reasonable in the context of the Greater Dublin Area but are nonetheless significant. 41% of respondents take longer than 30 minutes to get to work or education. Long journey times, especially by car, have the greatest potential for mode transfer as people generally value personal time highly. Figure 5. Willingness to switch to a Public Transport (PT) alternative 27% of respondents stated they regularly use PT 33% of respondents stated they were unlikely or very unlikely to opt for PT 40% of respondents indicated at least some willingness to opt for PT Benchmarked against other markets and PTP schemes, a low number of respondents (only 33%) stated they were unlikely or very unlikely to opt for PT. This is again encouraging for PTP within Drimnagh. Using the PTP methodology a significant percentage of the community (40%) could be targeted for mode transfer specifically to PT. This does not include potential for transfer to non-motorised transport, which often is the highest beneficiary of changed behaviour. Figure 4. Reason for car choice 33% of respondents stated they do not use the car on a normal basis 20% of respondents stated public transport alternatives are either too poor or absent 20% had an absolute necessity to use the car 27% stated the car as a preference only Figure 6. Willingness to participate in a Personalised Travel Planning (PTP) scheme Page 4 of 16
29 terms of city centre / brownfield / greenfield and inner/transitional/outer locations. A number of them also have developer-funded public transport service agreements, the most successful of which is Pelletstown, where the developer has funded the extension of an existing route into the site with a 10-minute headway. Surveys were hand-delivered to household letterboxes. A stamped addressed envelope was enclosed to encourage a good response rate. Survey distribution was done in the evening time so that it was possible to tell whether houses were occupied or not. 220 surveys were distributed. 64 surveys were returned. This represents a response rate of 29 per cent, which is considered reasonable in survey response terms. Each survey queried the behaviour and opinions of up to two adults within each household. In total, then, 115 individual responses were received. While this is a relatively small sample size, given the resources, timeframes and scope of this thesis dissertation a larger sample was 68% of respondents stated a willingness to participate in a PTP scheme 32% of respondents stated no willingness to participate in a PTP scheme Each respondent had the PTP Concept briefly explained to them. On the basis of this they were asked if they would be willing to participate in such a scheme if carried out in their community. Over two thirds of the surveyed community indicated a willingness to participate. The response rate varied greatly between localities (see appendix), with a very positive response in Comeragh Road (78%) and less so in Brickfields Park (47%). Benchmarked against PTP surveys in other markets, both within the Greater Dublin Area (GDA) and internationally, this is a very high positive response rate (68%). Similar surveys within the GDA have yielded a positive response rate of 52-64%. The premium achieved in Drimnagh may be as a result of strong community cohesion mixed with recent participatory planning and outreach activities by Dublin City Council. PTP schemes in other markets have proven successful where 45% or more have indicated willingness to participate. 2.5 Other PTP Pilot Initiatives in the Greater Dublin Area A similar study to Drimnagh was carried out in Glasnevin during 2009, also by students of the BSc in Spatial Planning at DIT. Glasnevin is a similarly structured neighbourhood to Drimnagh with a lowdensity residential profile. The study revealed very similar results to Drimnagh and will not be discussed in-depth in this paper. Car mode share was 62%. Potential for change levels of up to 51% were recorded and a willingness to participate response of 64% was returned. In order to understand people s likely responses to a PTP in newly developed areas, a household survey was undertaken in five framework development areas within the GDA during The aim of the survey was to assess the potential demand for Personalised Travel Planning within such areas. Surveys took place within the following areas: - Pelletstown Cherry Orchard Tyrrelstown Ongar Smithfield Each of the above are recently occupied areas developed on the basis of framework development plans. They represent a reasonable distribution in Page 5 of 16 impractical. However, the response may be considered significant enough to be considered as a robust pilot study into Personalised Travel Planning within new framework development areas. Responses were good from four of the five areas. Only Smithfield returned a low response (4 surveys returned out of 40 issued). This may be attributable to the fact that no door letterboxes were available and it was not possible to establish clearly whether homes were occupied or not. The survey objectives were four-fold. Firstly, a number of questions were put to profile the respondents. Secondly, a number of questions were put to establish existing behaviour. Thirdly, a number of questions were put to establish the Potential for Change of the respondents. Finally, respondents were asked directly whether they would be willing to participate in a Personalised Travel Planning programme. Respondents comprised a typical profile of newly developed areas, with a high level of professional employment and reasonably high-income levels. It was interesting that only 7 per cent of households did not possess a car. Given the large size of houses, it is likely that many of the households contained families. 61 per cent of respondents travelled to work by car. 22 per cent used public transport, while 6 per cent walked or cycled. 24 per cent of respondents travel a distance of under 5 kilometres to work. 87 per cent of respondents take less than one hour to travel
30 to work. Similar profiles to those undertaken The survey undertaken was a small sample size, within the base survey were observed. One notable which is understandable given the scope of the difference is the significantly lower level of carusage study. However, it is considered large enough to from Pelletstown. While the sample size is form a robust pilot survey and it should be noted much smaller, this would suggest that the recently that pilot surveys have played a significant role in improved bus and rail services are having some the evolution of Personalised Travel Planning effect. programmes. The main reasons given for car usage were lack of Observed behaviour from the survey was broadly in realistic alternatives. Half of the respondents line with what had been recorded in the same areas indicated that if a realistic alternative was available in 2002, although the sample size restricts the level they would consider using it. Also, the proportion of significance that can be attached to such results. of respondents who had an identifiable reason for Whereas, for example, in the 2002 survey 63% car-dependency other than lack of choice was very travelled to work by car across the five study areas, low (20 per cent). A further 10 per cent chose car in the 2005 survey 64% travelled by car. travel based on personal preference. These may or Overall, the results are generally positive towards may not be categorised as having potential for the concept of Personalised Travel Planning. The change. Either way, the survey indicates that the Potential for Change and Willingness to Participate, Potential for Change could be between 49 per cent - two key factors in the success of Personalised 59 per cent. This is higher than what is normally Travel Planning, measured higher than what is recorded within other markets, where 40 per cent is typically achieved in other markets where the considered a typical response rate. scheme has been successful. While the overall Peoples opinions of service levels were relatively sample was small the results are favourable towards benign, with reasonably high levels of approval for the concept and would indicate, at least, that further public transport quality as well as the quality of more in-depth market research is worthwhile. facilities for cycling and walking. There was a An important recent pilot study has been clear and (somewhat contradictory) disapproval of undertaken by South Dublin County Council at the level of available alternatives within the local Adamstown (South Dublin County Council, 2010). area. The lowest level of disapprovals came from A full PTP scheme was carried out targeting 213 Pelletstown and Ongar, both areas where recent households. Door-to-door contact was made with high-frequency bus services were put in place. 84% of participants and car use in the area is 62%. When asked directly whether or not respondents Over the course of the study 59% of respondents would like to participate in Personalised Travel said they had made some behavioural changes with Planning, 52 per cent said yes. This is a slightly 35% saying they would maintain their behaviour on higher rate than is generally experienced from pilot a regular basis. The scheme incorporated many studies in other markets where interest levels of 40 typical PTP measures including travel packs, - 50 per cent are considered typical. This is an pedometer challenges (considered to be one of the encouraging indicator given a number of factors. most successful components), door-to-door visits The respondents were given a very brief written by representatives of the scheme and sample public explanation of what Personalised Travel Planning transport tickets. The scheme, while relatively involved. Respondents had just completed a small in nature, is the first fully executed PTP questionnaire and therefore may have been affected exercise in Ireland. The result of the scheme by survey-fatigue. Respondents would also have appears to be exceptionally high and corroborate been unaware of the strong incentivisation typically the results of pilot benchmarking exercises associated with Personalised Travel Planning described above. This is an important development initiatives. as it provides further vital evidence that PTP can Some level of skew may exist, however, given that deliver a high return on investment in the Dublin the overall response rate was 28 per cent. context (South Dublin County Council, 2010). Respondents may have an inherent interest in or be Results of benchmarking schemes in Drimnagh, biased towards the concept. Such potential for Glasnevin and several new framework areas in the artefacts are inherent in all surveys and equivalent GDA have suggested strongly that PTP effects are likely to be present in comparable programmes are likely to exceed the results surveys in other markets, so it is likely that the returned from other markets where the positive response can be interpreted as significant. methodology is well established. The Adamstown Page 6 of 16
31 A final report including evaluative data was published by the Department of Planning and Infrastructure in October The scheme was directed at a total of 17,000 residents representing 71 per cent of the population of this suburban city within the Perth built-up area. The results of the evaluation survey declared a 12 per cent reduction in car-as-driver trips, a 13 per cent increase in public transport trips, a 25 per cent increase in walking trips and a 38 per cent increase in cycling trips. Overall, the total private car mode share reduced from 75 per cent to 70 per cent while alternative modes of transport increased from 25 per cent to 30 per cent. Following the initial contact phase, households were segmented into Regular User (25 per cent), Interested (48 per cent) and Not interested (27 per cent). During the scheme a total of 4,901 households expressed an interest in receiving exercise provides the first hard evidence that this may indeed be so (South Dublin County Council, 2010). 3 PART II - A REVIEW OF PERSONALISED TRAVEL PLANNING PROGRAMMES INTERNATIONALLY 3.1 Introduction Personalised Travel Planning initiatives are becoming increasingly widespread and the extent to which they are being analysed and debated is similarly increasing. While the earliest studies were undertaken in Germany its widest application has probably been in Australia where it has been deployed at a reasonably large scale (Brog, 2005). In the UK the environmental transportation consultancy, Sustrans generated interest in the topic by undertaking a number of small scale studies in Gloucester and Frome in 2001 (LTT, 2005a). This led to the Transport for London Travel Options initiative, which aims to provide easy access to local travel information. A Transport for London Personalised Travel Planning initiative involving 4,000 households was undertaken in 2001, while the Living Change scheme by the Scottish Executive also involved 4,000 households (Department for Transport, 2004a). A Department for Transport programme of 14 pilot projects was also undertaken across the UK including target areas of up to 18,000 residents in some cases (Department for Transport, 2005a). The Smarter Choices study provides in-depth assessments of a sample of Personalised Travel Planning initiatives and some overview of the majority of those that have taken place. More recently, the Department sponsored three Smarter Travel Towns, Peterborough, Darlington and Worcester. The Smarter Travel Towns piloted a suite of behavioural travel planning measures including personalised travel planning. The results from some of the towns have recently been published and high rates of return, in terms of mode transfer, were recorded, especially for PTP initiatives (Department for Transport, 2010). There is also considerable case study material from Australia and other markets from the various consultants behind each scheme ( Fremantle, Australia A Personalised Travel Planning scheme using the Travelsmart methodology was undertaken in Fremantle, Western Australia (Socialdata, 2003b). information. distributed. A total of 3,500 travel packs were Not Inter ested 27% Interested 48% Regular User 25% Regular User Interested Not Interested Figure 7.Segmentation of Fremantle Surveyed Households ( As part of the scheme 143 bus stop specific timetables were devised and distributed to households. Other marketing materials distributed included: - A local area access map, showing bus stops, walking and cycling routes and local facilities Tickets and fares guide Bus stop specific timetables Standard timetables How to save money with Transperth Brochure Accessible travel brochure Brochures on cycling Cycle route maps Discount card from 4 local bike stores Page 7 of 16
32 Guide to walking that they were cost effective. Secondly, the report Walking maps and local walking event was influential in kick-starting a range of centrallyfunded initiatives, including Personalised Travel information Travel in Perth: facts and myths brochure Planning ones. It further led to the introduction of Of those who cited themselves as Regular users of behaviour-side initiatives into transport policy, an existing alternative to the car, 1,493 households again, including Personalised Travel Planning ones or 84 per cent declared themselves interested in (LTT, 2005a; Department for Transport, 2004b; receiving further information. The remainder c; Wilson, 2005). were issued with a reward travel pack in line with The Smarter Choices report forecasts that, with a the principles of the Travelsmart scheme. coordinated and integrated introduction of travel Those regular users who expressed an interest, planning measures as appropriate, a reduction in along with the Interested population segment were peak period urban traffic of about 21 per cent could issued with service sheets to define what areas they come about. According the study, the cost of were interested in receiving information. 11 per implementing such soft initiatives is about 1.5p cent requested public transport-only information. per kilometre; whereas the estimated benefit to the 11 per cent requested only walking and cycling economy per 1km of congestion removes is 15p. information. 78 per cent requested information Thus every 1 spent on well-designed soft pertaining to two or more modes. In total 65,000 measures could bring about 10 of benefit in items of information were issued. Much of this reduced congestion alone. was issued by mail, but over 3,000 travel packs As regards Personalised Travel Planning, Smarter were distributed by bicycle couriers. According to Choices was no less thorough than with the the report, the wallet sized personalised local assessment of other measures. Smarter Choices timetable proved to be the most popular item looked at all of the initiatives carried out within the overall. UK and the bulk of those carried out in other markets. Notwithstanding some reservations about the independence of the evaluative process utilised within Personalised Travel Planning, Smarter Choices concluded broadly that Personalised Travel Planning had potential to deliver significant mode Car only option Op ted for car 39% 41 % transfer and represented value for money: - Opted for alternatives 7% Alternatives o n ly op t i on 13% Figure 4.2: Potential for Change among Surveyed Users in Perth, Australia (source: Smarter Choices a Comprehensive Review of Behavioural Transport Planning in the UK The Smarter Choices - Changing the Way We Travel study represented a watershed in thinking within the UK towards Personalised Travel Planning and other behavioural travel planning measures (LTT, 2004a; Department for Transport, 2004a). Firstly, based on a comprehensive and exhaustive assessment of travel planning initiatives, the report concluded that significant mode transfers were attributable to behavioural travel planning and results so far available suggest that Personalised Travel Planning may lead to reductions in car driver trips of 7-15 per cent amongst targeted populations in urban areas. According to the study a coordinated delivery of soft-factor interventions could lead to a reduction in peak hour traffic of about 21 per cent. The Smarter Choices report concluded overall that any such behavioural initiatives should not be implemented in isolation of a complementary set of demand management measures. These projected changes in traffic levels are quite large (though consistent with other evidence of behavioural change at the individual level), and would produce substantial reductions in congestion. However, this would tend to attract more car use by other people, which could offset the impact of those who reduce their car use unless there are measures in place to prevent this. Page 8 of 16
33 programmes. The programmes could benefit by a higher level of third party independent evaluation, a principle conclusion of the Smarter Choices report. Nevertheless, the conclusion of the Smarter Choices report is that: - Therefore those experienced in the implementation of soft-factors locally usually emphasis that success depends on some or all of such supportive policies as reallocation of road capacity and other measures to improve public transport service levels, parking control, traffic calming, pedestrianisation, cycle networks, congestion charging or other traffic restraint, other uses of transport prices and fares, speed regulation, or stronger legal enforcement levels. Such an approach is equally likely to apply to Personalised Travel Planning programmes as any other behaviour-side transport planning measure. Bearing in mind these issues of data validity, (which, incidentally, may also apply to a greater or lesser extent to the monitoring of other soft factors), results so far available suggest that personalised travel planning may lead to reductions in car driver trips of 7-15 per cent amongst targeted populations in urban areas (according to trials in Germany, Australia, USA and the UK), with rather lower reductions in car driver trips (2-6 per cent) reported from a smaller number of more rural trials. 3.4 Evaluation of Personalised Travel Planning Initiatives The Smarter Choices report points to a number of areas of concern facing Personalised Travel Planning evaluation. Firstly, differing methodologies have been developed that have all been categorised as Personalised Travel Planning in one form or another. However, the differing systems have inherently different evaluation frameworks. This affects the extent to which such results can be compared. Nevertheless, quantitative and subjective assessment of the results combined with the methodological framework strongly indicates that those initiatives based on individualised marketing tend to be the more successful. While the Smarter Choices report concludes that merit is to be found in Personalised Travel Planning in general, it is implicit that individualised marketing programmes have a wider applicability and have, thus far, demonstrated higher success rates. A further issue that arises is one of objectivity. Most evaluation is carried out by the first party consultants themselves. Certain consultants have also been decidedly evangelical about, particularly, individualised marketing programmes. These programme reports are often published freely on the internet as part of the scheme. This no doubt contributes to the public awareness of the programme, an inherent element within the methodology itself. It also makes a lot of data readily available for assessment. Nevertheless, there is a clear need for objective criticism of the 3.5 Alternative Approaches to Evaluation The conclusions of the Smarter Choices report while positive, given its thoroughness and strong empirical approach, are not without significant caveats. In the first instance the report is very conclusive that soft measures are likely to be of no material benefit unless accompanied by meaningful hard measures, in the form of a complementary programme of demand management, service level improvement or other investment in planning and infrastructure. It also iterates strongly that evaluation should be undertaken independent of the lead-implementing agents. This appeal for an objective and independent auditing process is a strong theme in the Personalised Travel Planning debate in Australia. Other concerns have also been voiced as to the validity of claims made by Travelsmart proponents (Morton et al, 2005; Richardson et al, 2005b; Stopher et al, 2005b). It may be tempting to suggest that the enthusiasm with which Travelsmart has been adopted as a core part of national and regional travel policy is in itself an indicator of success. Travelsmart initiatives have now been adopted in all major cities in Australia with funding assistance from central government (Morton et al, 2005; Some commentators, however, have raised concern that Personalised Travel Planning schemes are seen as something for nothing whereby, at relatively low cost, transport authorities can achieve meaningful dents into car mode shares without any investment in infrastructure or services (Morton et al, 2005). The Page 9 of 16
34 study group who are invited to act as respondents over a long time-frame. New members are coopted onto the study group as old members decide to leave, thereby ensuring a reflection of the sampled population. In this way, the impacts of schemes can be studied in considerable detail. The panel approach has limitations, most particularly in relation to the size of the sampled population and the obvious risk of participation itself leading to skewed results through enhanced involvement and awareness. An alternative approach is the use of corroborative evidence to validate Personalised Travel Planning initiatives. A study in Darebin, Melbourne used a combination of background data sources to verify results of a local Personalised Travel Planning initiative (Stopher et al, 2005b). The corroborative evidence confirmed mode transfer rates close to what the Personalised Travel Planning evaluation study itself revealed. Traffic count data indicated a 3 per cent reduction in car trips within the study area. Ticket validation data, recorded by individuals boarding public transport using smartcards revealed a 4/5 per cent increase in boardings. A similar rise in ticket sales was recorded in information also received from the local transit authority. Finally, independently monitored customer satisfaction surveys showed a 3 per cent increase in public satisfaction with local transit services. implicit suggestion here is a shifting of responsibility from the agencies responsible for transport planning onto the users of transport services. This seems a highly plausible concern and theory dictates that any such gains would quickly be negated in any instance as alternate travellers use up whatever road capacity was freed up by the Personalised Travel Planning programme. In this instance the warnings of the Smarter Choices report authors are reinforced and it must be strongly put forward that Personalised Travel Planning should form part of an integrated transport strategy that involves infrastructural, operational as well as marketing components. Morton and Mees, in particular, challenge the validity of the Travelsmart claims (Morton et al, 2005). In a considered analysis of the psychology of Personalised Travel Planning participation the potential for data contamination is highlighted. In the target sample groups, the authors point out there are a number of inherent conflicts of interest that may skew the data and lead to false results. The results of the scheme are based on certain predications, the main one being that public transport is better than I thought it was once I tried it. But there are also certain expectations of the initiative and likely respondents often act as good subjects, or ones who wish either to impress or have a personal interest in a positive outcome. This leads to what are known as artefacts, another way of saying a self-fulfilling prophecy, whereby the observation of a study group itself alters the likely outcome of the study. These are important concerns and there is some evidence to suggest that they are occurring phenomena within the Travelsmart framework. These are also, however, concerns that ought to be associated with any sampling study and their discussion only underlines the importance of considering them in relation to Personalised Travel Planning studies. The authors correctly conclude, however, that objective, independent evaluation is the only framework within which Personalised Travel Planning can be assessed. A number of other studies have expanded on this theme and examined ways in which Personalised Travel Planning can be independently audited (Richardson et al, 2005b; Stopher et al, 2005a; 2005b). One particular approach is the use of panels in scheme assessment. A popular methodology within public transport market analysis, panels are based on a targeted sample Table 5.1: Darebin Corroborative Evidence (Source: Stopher et al, 2005b) Data Source Impact Effect Traffic Count Data - 3% Reduction in car trips Ticket Validation Data + 4% / 5% Increase in passenger boardings Ticket Sales + 4% / 5% Customer Satisfaction Survey Increase in sales + 3% Increase in satisfaction with transit services 3.6 Relative Impact by Mode Share In almost all schemes, the greatest relative mode transfer was in favour of walking trips (Brog, 2005; Tideman, 2005). This was reflected in the number of behavioural switches completely over to walking or to walking and public transport. Figure 5.2 shows how mode transfers of 2-4 per cent overall are typically recorded. Page 10 of 16
35 Tendency Towards The Smarter Choices report observed potential improvements to off-peak public transport patronage. In Nurnberg and Kassel, 70 per cent of behaviour change in favour of public transport was accounted for by shopping and leisure trips. While this suggests that the impact on peakhour traffic is relatively lower, increased capacity utilisation is a considerable incentive to public transport service providers. In any case, overall peak hour car-as-driver trips are known to have been reduced in both Kassel (6 per cent) and Nurnberg (14 per cent) (Department for Transport, 2004a). Local facility utilisation was also improved in a number of studies. Several of the schemes cited benefits to local businesses, both in terms of increased footfall, and lower congestion levels as net benefits of the scheme (Sustrans, 2004a). This suggests that one of the main beneficial impacts of the scheme is on health levels among the target population. This is reflected by several costbenefit analyses that attempt to measure these benefits (Socialdata, 2003a; 2003b). In several of the schemes, the effect which information regarding the benefits of walking had on individual health was remarked upon (Corpuz et al, 2005; Sustrans, 2004a; 2004b). The logical extension of such an argument is that Personalised Travel Planning should involve some input or support from local or regional health authorities who would lend weight to marketing initiatives and would themselves benefit from reduced healthcare burdens. James also analysed the impact of Personalised Travel Planning schemes undertaken in the Perth area on public transport patronage (James, 2004). By assessing ticketing records, the evaluative surveys conducted following the schemes delivery could be cross-checked. Tangible increases in ridership were recorded in each target area examined, which included South Perth (17 per cent increase), Cambridge, Perth (11 per cent increase), Marangaroo, Perth (5 per cent increase) and Fremantle (12 per cent increase). The lowest increase was in Subiaco, Perth where a 4 per cent increase was recorded. This was after a 15 per cent reduction in public transport operational capacity in the area during the programme, suggesting a net possible increase of up to 19 per cent. The use of public transport ticketing records offers a useful independent evaluation and auditing tool, something that will be discussed in greater detail below. Table 5.2: Effects of Individualised Marketing Initiatives in other markets (Source: Department for Transport, 2004) Control Travelsmart Fall in Car Usage South Perth 60% 52% -14% Nurnberg 44% 38% -14% Goteburg -13% Viernheim -12% Brisbane -10% Portland -8% Kassel 48% 44% -8% Cambridge 60% 56% -7% Marangaroo -4% Breisgau 44% 43% -2% 3.7 Self-reinforcement One particular feature among a large number of Personalised Travel Planning schemes is a tendency towards self-reinforcement. The overall assessment of Personalised Travel Planning initiatives, particularly those tending towards an individualised marketing approach, delivers a clear picture of success. What is remarkable in a number of schemes where continuing assessment took place was that mode share figures in the targeted areas continued to improve over time. This was in the absence of continued investment in the scheme and in comparison to neighbouring, control-group areas where the scheme was not carried out (Goulias, 2001; Department for Transport, 2004a; Stopher et al, 2005; Tideman, 2005). James, in an independent assessment of the Perth pilot scheme, showed how the impacts of the scheme had been maintained two years after the programme had been delivered (James, 2004). Studies in Nurnberg and Kassel indicated sustained impacts 2 and 4 years later respectively. 3.8 Targeting Areas for Personalised Travel Planning One final issue to be addressed regarding evaluation is the type of areas where Personalised Travel Planning is more or less likely to be successful. Interestingly, one of the least successful schemes was that conducted in Lambeth, London. Mode transfer rates achieved were low, as was the level of public interest in receiving information and incentives. This was possibly attributable to the absence of tailored incentives and information, Page 11 of 16
36 the sustainable city. Ironically, it is the now discarded phenomenon of suburban, segregated land-use planning inherited from the garden city movement that can perhaps most benefit from the Personalised Travel Planning concept. unlike other individualised marketing programmes. Nevertheless the results from this low car-use, highdensity urban are that is comparatively well served by public transport is in contract to the results reported by consultants in other dissimilar places (Department for Transport, 2004a). By comparison, in Gloucester, where car ownership was considered high by the local authorities and levels of congestion low, a significant level of sustained mode-transfer was achieved (Sustrans, 2004a). The evidence from these and other studies suggests that the Personalised Travel Planning approach is a good fit for medium-low density suburban areas, provided some potential for mode transfer to an accessible alternative exists. The Smarter Choices report, based on its comprehensive assessment and case study interviews of all schemes within the UK, puts forward a list of likely relevant factors: - A recognition in the community concerned that there are traffic problems A fairly discrete and self contained community, with reasonable local services and facilities (not just a dormitory or satellite suburb) A reasonable level of public transport (and, ideally, some recent improvements in services) Some excess capacity on public transport A reasonable quality of environment for walking and cycling, including lower speeds and a people-friendly street scene Support from the local authority and other key partners, including public transport operators Evidence from the Smarter Towns schemes, not addressed by the Smarter Choices study (the Smarter Towns initiative came about as a consequence of the Smarter Choices report) would also suggest that effective Land Use and Transportation Planning can influence the likely success of Personalised Travel Planning programmes (LTT, 2005a). Analysis of the three study areas indicated a correlation between the proportion of trips less than 3km and the potential for change. This is supported by results from other programmes where walking was seen as the biggest potential for mode transfer. The principle of locating employment uses in relative proximity to residential areas is now well recognised and an ever-increasing priority in area planning. The evidence from Personalised Travel Planning thus far serves to underline its importance in engineering 4 CONCLUSION: PTP IN DUBLIN A WORTHWHILE INITIATIVE? 4.1 Evaluation Issues The emerging evidence from an increasing library of scrutiny is that Personalised Travel Planning is an effective method for reducing car-usage in the long term and that it is justifiable on cost grounds (Department for Transport, 2004a; 2005a; Cohen, 2005). Furthermore, most of the available research suggests that there are considerable intangible benefits to community-health, local business and the environment that these should be factored into benefit-cost calculations. This evidence is supported by the rate at which the concept is expanding. Most major Australian cities now budget for ongoing Personalised Travel Planning programmes. In the UK it has been adopted as part of national strategy and extensive funding of initiatives has commenced. Personalised Travel Planning has bee successfully deployed in the US, Scandinavia and continental Europe (Brog, 2005). Some criticism of Personalised Travel Planning schemes has come about, particularly within Australia, where the concept is perhaps most established. Most of this has been to do with the way in which schemes are evaluated. This has been echoed in the UK where official studies are recommending independent evaluation and auditing (Morton et al, 2005; Wilson, 2005). Frameworks for such independent evaluation are emerging in Australia. Recently, a Personalised Travel Planning scheme in Victoria State was subjected to independent auditing using corroborative evidence (Stopher et al, 2005b). Results from traffic counters, public transport boardings and ticket sales all supported the results of the scheme. Analysis of bus boardings across a number of schemes in Australia, over an extended time period showed that the positive results are maintained in the medium to long term. Similar results were found when public transport ridership figures were used to audit schemes in the UK. Overall, these schemes indicated mode transfer away from car usage, consistently, of 5 per cent - 10 per cent. Conservative estimates indicate that they support a benefit-cost ratio of at least 5:1. This is considered extremely favourable in transport Page 12 of 16
37 no significant push factors in inducing mode transfer; yet tangible mode transfer did take place. Walking is also the biggest benefactor in terms of mode transfer in almost every scheme (Department for Transport, 2004a; Brog, 2005). The evidence from the Sustainable Towns initiative where there was a clear relationship between distance to work and potential for change, suggests that areas where good land-use and transport planning has taken place are likely to display the biggest success rates (LTT, 2005a). In the UK and Australia, however, higher success rates have been achieved in areas where demonstrable capacity existed on public transport routes. The Smarter Choices report was particularly effusive in suggesting that such schemes should be mixed in with harder measures, particularly service enhancements and demand management measures. Therefore, one recommendation would be to introduce Personalised Travel Planning schemes alongside new public transport initiatives. planning terms. Many infrastructural schemes are deemed of merit with benefit-cost ratios of 2:1 or less (Cohen, 2005). One of the commendable aspects of the Personalised Travel Planning process, in fact, has been the emphasis placed on evaluation and this has probably been influential in the successful evangelisation of the concept. Such evaluation of travel behaviour is worthwhile in its own right. When deployed as part of a Personalised Travel Planning programme, it could just as easily form an integrated part of a wider transport strategy. In fact, strong arguments exist in favour of doing this. 4.2 Area Targeting Issues Another issue within the Personalised Travel Planning debate is what areas it is likely to be successful in. This is pertinent, too, in deciding whether or not it would be a success in Dublin. Proponents of Personalised Travel Planning schemes are phlegmatic about this. They point to positive results from virtually anywhere that Personalised Travel Planning has been deployed. Also, they point to commonalities found across apparently contrasting travel markets. There are indications to suggest, however, that the Greater Dublin Area does offer some challenges to Personalised Travel Planning. Ireland has reportedly the highest average car-mileage in the world and much of this activity is attributable to the Greater Dublin Area (Bannister et al, 2000). Also, analysis of 2002 Census data shows vastly contrasting travel patterns even within otherwise broadly similar city-sectors. Nevertheless, evidence suggests that Personalised Travel Planning can succeed within adverse environments. It should be noted that transport in Perth is predominantly car-based. The model of public transport provision in most Australian cities is market-based with commercial operators competing for business on high demand routes. This is not the optimum system for maximising boardings and accessibility (Mees, 2000; Casey, 2005). Perth is a dispersed low-density city with limited rail provisions. In other words, conditions for the promotion of public transport are not considered ideal yet significant results were achieved by Personalised Travel Planning schemes. In Quedgeley, the area was specifically chosen for its high car ownership rate and available capacity on public transport (Sustrans, 2004a). However, no serious congestion was noted in the area prior to the study commencing. This indicates that there were Page 13 of Methodology Issues The Smarter Choices report strongly points out that the projected changes in traffic levels and reduction in congestion, while large, are likely to attract more car use by other individuals (Department for Transport, 2004a). This would offset the benefit of the initial behaviour-change unless there are measures in place to prevent this. Therefore, the measured reallocation of road space to public and non-motorised modes can reinforce the initial programme and provide further inducements to switch modes among other users. Of the various methodologies examined a number of features emerged as likely to be transferable to the Dublin market and contribute to successful mode transfer. Personalised Travel Planning Marketing Programme. A marketing programme that will assess the targets of the programme, the most appropriate means of delivering those targets and an accompanying but independent system of ongoing monitoring, feedback and improvement; Household surveys. The programme would rely on quality information derived from all individual households within the study area. Based on this information, fitting proposals can be devised to suit the needs of residents; Information tailoring and provision. The success of the scheme is based on the provision of tailored and relevant
38 principle of marketing is product development and this is something that can take place within Personalised Travel Planning programmes. information to each user. The preparation of travel packs with utilities such as localised bus timetables, walking information and other elements would need to be prepared as part of a programme; Incentivisation. As part of a marketing strategy, incentives can be organised, such as free bus passes and vouchers for cyclestores, to promote increased use of public transport and non-motorised transport. Monitoring. In order to measure the success of the entire scheme as well as individual initiatives within the scheme, independently undertaken monitoring and evaluation against key performance indicators should be undertaken. The use of corroborative evidence appears to be highly valuable also; Formulation of individual initiatives. The overall programme will be a composite of several sub-initiatives, as deemed appropriate to the local area. These may include, among others, all or some of the following: Teleworking initiatives; School travel plans; Car-sharing / pooling initiatives; Cycle to work initiatives; Walk to PT initiatives; PT incentivisation schemes. Outreach programmes to related or compatible community organisations have also been successfully achieved in some Australian markets (Tideman, 2005). An area that may need further analysis or piloting within the Greater Dublin Area is that of establishing contact methods. This is something that may naturally vary from market to market. While telephone contact is probably the quickest and cheapest mode of establishing initial contact and was very successful in many Australian pilots, it was less successful in some UK studies where door-to-door contact was reverted to (Socialdata, 2003a; Sustrans, 2004a). Door-to-door contact has been demonstrably successful in Adamstown but the question of transferability to much larger programs must be applied (South Dublin County Council, 2010). Feedback processes have not been highlighted as part of previous Personalised Travel Planning studies. This is surprising given both the involvement of public transport agencies and also the high quality of information that can be assembled from a community relating to travel and mobility. It would seem an apparent waste of resources not to feed this information back into improved areas and services. A fundamental 4.4 Organisational Issues A notable feature of all Personalised Travel Planning schemes is the involvement of a large number of entities. Personalised Travel Planning schemes are targeted at communities. Who these are and how they should be involved can best be identified by analysing who benefits from the concept. Naturally the community themselves benefit and their involvement is tacit. Transport agencies benefit through increased ridership and a scheme is unlikely to have credibility without their involvement. The local authority is responsible for the area and any improvements to its character or amenity accrue to it. In new development areas, the developer may also benefit financially from increased marketing opportunities. However, there are also significant environmental and health benefits that may occur as a result of the scheme. These can have a reductive impact on the budgets of both environmental departments and health departments. Safety authorities may also benefit through indirect expedition of their aims. Experience indicates that environmental and health issues are effective marketing tools. Therefore, a strong argument exists for a partnership approach to coordinating Personalised Travel Planning initiatives. Such has successfully been the case in, for example, the UK where up to 10 logos have been published on literature and marketing collateral. In fact, the preparation and collation of such materials is a practical example of how such a partnership can work together to deliver the scheme. Since the benefits of Personalised Travel Planning are dispersed, it is reasonable to suggest that so should be the costs. This is a consideration in raising the budget for schemes. For example, in the majority of Australian schemes, the budget comes not from transportation departments or local authorities, but from national and state greenhouse funds. 4.5 Conclusions This study has examined the potential for Originbased Mobility Management Plans, most specifically the newly emerging concept referred to as Personalised Travel Planning, in the Greater Dublin Area. The concept has been undoubtedly successful in other markets, as testified by Page 14 of 16
39 analogy to illustrate the potential effectiveness of the scheme is the potential for turning a vicious cycle into a virtuous cycle. Increasing congestion can be described as a vicious cycle, whereby roads become clogged, public transport services deteriorate, forcing more travellers into the car, causing roads to become clogged, etc. A virtuous cycle, on the other hand would show people opting for public transport, revenue for public transport, to be reinvested in better services, enticing more people onto public transport, etc. To cause a transition from one cycle to another requires a three-stage process within a transport system: - a) intervention b) momentum c) partnership approach An intervention is required to halt the downward decline. A series of measures are required to give momentum to the upward cycle. A partnership approach between the responsible stakeholders is numerous independent and official sources. In addition, it has proved successful within areas demonstrating what may be described as adverse conditions for sustainable travel planning. Without the benefit of any direct applications within Ireland, it would appear to be an applicable methodology. Caveats from independent sources should be gleaned; some form of independent evaluation needs to be incorporated, for example. A high-level study in the UK, the Smarter Choices report, confirms the effectiveness of the scheme but concludes strongly that its real potential will only be realised when integrated into an overall transport strategy incorporating effective demand management measures. 4.6 Future Matters The concept of Personalised Travel Planning is a relatively new one within transport planning. The overall area of behavioural-side policies can itself be identified as a new wave in the science of transport planning (Department for Transport, 2004a). Traditionally transport planning focussed on the delivery of infrastructure. Later, principles such as demand management and Land Use and Transportation Planning emerged (Buchanan, 1960). Behavioural-side planning is a new and relevant aspect to transport planning. Much of it is focussed on communicating with communities and as such it is very focussed on marketing. This in itself presents challenges to transport planners who are largely untrained in complex marketing concepts such as identifying Stages of Change, for example (Davis, 2005). Many analysts of Personalised Travel Planning complain of credibility issues when they quote benefit-cost ratios of anything between 5:1 up to 15:1, even though all the empirical evidence suggest that this is so (Cohen, 2005). It could be that this is a rational market response to the infinitesimally small resources that are applied to marketing alternatives to the car when compared with that invested in marketing the car. The area of carbon-emissions trading is a matter that should be explored in relation to Personalised Travel Planning. Both seek to find market-based solutions to environmental problems. The potential for carbon emission reduction should not be lost on the proponents of Personalised Travel Planning and this could potentially provide a further revenue source to fund the scheme (Economist, 2002). The main aim of Personalised Travel Planning must be, however, the reduction of car-based travel in favour of more sustainable options. A useful Page 15 of 16 required to maintain momentum. A Personalised Travel Planning scheme can represent an intervention. However, it is unlikely to fulfil its full potential without measures to give it momentum and without a partnership approach to maintain the momentum. ACKNOWLEDGEMENTS The author gratefully acknowledges Edel Kelly and Vanessa Hand of the Dublin City Council Roads and Traffic Planning Division for enabling the Drimnagh Benchmarking Survey as part of the Smarter Travel Town bid. Also Catherine Bates and Elena Gamble of the DIT Students Learning With Communities Office for facilitating the community learning exercise. REFERENCES Banister, David and Berechman, Joseph. Transport Investment and Economic Development, UCL Press, Brog, Werner. Identifying and Achieving the Potential for Changing Behaviour: experience from the Sustainable Travel Towns and International Programmes, paper to the Smarter Choices Conference, London, November 2005 Cohen, Tom. Demonstrating the Value for Money of Smarter Choices, paper to the Smarter Choices Conference, London, November 2005
40 Corpuz, Grace. Hay, Annette. Merom, Dafna. Local Transport Today. Travel patterns in smart Walking for Transport and Health: Trends in towns show potential for traffic reduction, 14 th Sydney in the Last Decade, 28 th Australian April 2005a Transport Research Forum, (Papers available on Local Transport Today. How much influence can September 2005 marketing have on elasticity?, 18 th August 2005c Davis, Adrian. Changing Travel Behaviour: Longhurst, Mike. Professional Marketing or Lessons from Health Psychology, paper to the Smarter Choices Conference, London, November 2005 Department for Transport. Smarter Choices Changing the Way We Travel, (Authors: Cairns, Sally. Sloman, Lynn. Newson, Carey. Anable, Jillian. Kirkbride, Alistair. Goodwin, Phil.), Her Majesty s Stationary Office, 2004a Department for Transport. Personalised Travel Planning: evaluation of 14 pilots part funded by Department for Transport, Her Majesty s Stationary Office, 2005a Department for Transport. The Effects of Smarter Choice Programmes in the Sustainable Travel Towns, Her Majesty s Stationary Office, 2010 Dublin Transportation Office. The Route to Sustainable Commuting An Employers Guide to Mobility Management Plans, Dublin Transportation Office, 2001b Dublin Transportation Office. Mobility Management Plans, Dublin Transportation Office, 2002a Economist, The. How Many Planets: A Survey of the Global Environment, July 6 th 2002 Goulias, Konstadinos. Audit of South Perth Individualised Marketing Evaluation Survey, Socialdata Australia Pty. Ltd., James, B. Update on the Travelsmart Programme in Perth, Western Australia, unpublished paper, 2003, quoted in Department for Transport, Smarter Choices, 2004 Mees, Paul. A Very Public Solution Transport in the Dispersed City, Melbourne University Press, 2000 Morton, Anthony and Mees, Paul. Too Good to be True? An Assessment of the Melbourne Travel Behaviour Modification Pilot, 28th Australian Transport Research Forum, (Papers available on September 2005 Local Transport Today. Australians put brakes on car use with major programme of personalised travel planning, 14 th February 2002a Local Transport Today. When soft measures meet demand management, 29 th July 2004 Local Transport Today. Can soft policy measures help deliver hard results in reducing the amount of congestion, 29 th July 2004 Marketing by the Transport Profession, paper to the Smarter Choices Conference, London, November 2005 Richardson, A.J. Davis, M.B. Harbutt, P.L. Using Before and After Household Travel Surveys 28th Australian Transport Research Forum, (Papers available on September 2005a Richardson, Roddis, S. Arblaster, D. Attwood, D. Newman, J. The Role of Trend Analysis in the Evaluation of a Travelsmart Program, 28th Australian Transport Research Forum, (Papers available on September 2005b Socialdata. Travel Behaviour Change Program for the City of South Perth under the Travelsmart Program, Socialdata America Ltd, 2003a Socialdata. Travel Behaviour Change Program for the City of Fremantle under the Travelsmart Program. Socialdata Australia Pty. Ltd, 2003b South Dublin County Council, Smarter Travel Adamstown Personalised Travel Planning Pilot Project, March 2010 Stopher, Peter. Greaves, Stephen. Xu, Min. Fitzgerald, Camden. Lauer, Natalie. A Panel Approach to Evaluating Travelsmart Initiatives in the Short Term South Australia Pilot Survey, 28th Australian Transport Research Forum, (Papers available on September 2005a Stopher, Peter. Greaves, Stephen. Xu, Min. Lauer, Natalie. Designing a Procedure to Undertake Long Term Evaluation of the Effects of Travelsmart Interventions, 28th Australian Transport Research Forum, (Papers available on September 2005b Sustrans. Travelsmart Gloucester (Quedgeley), July 2004a Sustrans. Travelsmart Bristol (Bishopstown), November 2004b Tideman, Jill. Making Smarter Choices in South Australia: approaches to delivery and evaluation of Travelsmart Households in the West, paper to the Smarter Choices Conference, London, November 2005 Wilson, Jacqui. Mainstreaming Smarter Choices what needs to be done?, paper to the Smarter Choices Conference, London, November 2005 Page 16 of 16
41
42
43 = α + β + γ +
44
45
46
47
48
49
50
51
52
53
54 + β + γ +
55
56
57
58
59
60
61
62
63
64 A METHODOLOGICAL FRAMEWORK FOR THE STUDY OF HOUSEHOLD RESIDENTIAL LOCATION CHOICE AND TRAVEL BEHAVIOUR Z. Sultan 1, J. Hine 2 and J. Berry 3 1. School of Built Environmental, University of Ulster, Jordanstown, Northern Ireland; sultan-z@ .ulster.ac.uk 2. School of Built Environmental, University of Ulster, Jordanstown, Northern Ireland; jp.hine@ulster.ac.uk 3. School of Built Environmental, University of Ulster, Jordanstown, Northern Ireland; jn.berry@ulster.ac.uk ABSTRACT The aim of this paper is to examine the relationship between housing location choice and travel behaviour at a disaggregate level. Evidence from existing research studies show that land-use planning patterns influence mode choice and patterns of mobility. Residential location is also an important factor in land-use planning which has a long lasting effect on household travel behaviour. This research explore the notion of selfselection which encompasses household residential location choice decisions matched to a households travel behaviour i.e. that car owning household has more flexibility in their choice of housing location. The paper explores the literature on household location choice and travel behaviour and then develops a conceptual model to assess the causal effect of household choice on housing locations and travel patterns. The paper also examines the importance of attitudinal and socio-demographic factors which contribute to household mobility patterns and residential location choice. By identifying the common methodological flaws the paper then propose the methodological framework and rational for residential self-selection research. The paper concludes with key findings for policy development. Keywords: Land-use planning, Travel behaviour, Housing location choice 1 INTRODUCTION Choice of residential location is a multidimensional decision for any household. During the last three decades, researchers are attempting to find out the exact relationship between attributes of built environment and household travel behaviour. The motivation of this interest is based on the possibility that design policies associated with land-use planning may be used to manage, control and shape individual s travel behaviour and then overall aggregate travel demand (Bohte et al., 2009; Litman, 2009). There are some studies which look at urban form factors and the effect of land uses such as smart growth, mixed land-use and street design on the travel patterns of households. Detailed review of such studies has been conducted by leading scholars with conclusion that there is indeed a significant impact of land-use attributes on the travel behaviour. At least some link exists between the characteristics of residential locations and travel behaviour (Badoe and Miller 2000; Crane 2000; Stead and Marshall 2001; Ewing and Cervero 2001; Handy 2005; Cao et al., 2008). These studies show that among Page 1 of 25
65 others, socio-demographic characteristics of family and urban form attributes formulate the households travel behaviour. When investigating the direction of causality between residence location choice and travel behaviour two questions are of particular importance (i) does housing location choice affect travel behaviour and/or vice versa and (ii) after the causality has been established in either direction should land-use planning policies be based on expected transport impacts? Such questions are of key interest for policy makers. For example, the Dutch government has adopted the well-known ABC location policy. The reason for this policy is that spatial planning can be used to influence the amount and mode of travel. The objectives for adopting this policy are environmental and economic because good accessibility and a clean environment are vital for the economic and social functioning of the country (Schwanen et al., 2004). Planning Policy Guidance (PPG) 1 in the UK on transport is similar to ABC policy in spirit but less specific. The guidance deals with the reduction in the length and number of car journeys and encourages alternate means of travel which have less impact on the environment and reduce car dependency (Owens, 1995). The interaction between land-use and transportation has been a matter of interest for many years from both theoretical and empirical perspectives among the researchers. Land-use planning as a mobility strategy is still a 1 In UK Policy Planning Guidance (PPG) is a statement of Government policy and principle towards the aspects of the town planning and transport framework. matter of debate. Land-use planning is a key element for achieving sustainability in an urban context and housing location is one of key component. Recent literature shows that sustainable urban development can only be achieved when transport and land-use are treated simultaneously (Banister 2008). The land-use planning stimulates the need for transportation and the supply of transport infrastructure shapes urban form. Urban planners and transport policy makers face a challenge to reduce overall mobility and as a result carbon emissions without compromising economic growth. The relationship between urban form and travel behaviour is complex and there are many factors (variables) involved from both sides (TRB 2009). Bhat and Guo (2007) have mentioned three elements which represent the complexity of this relationship. These elements are (i) the multi-dimensional nature of the relationship between both (ii) the influence of decision maker characteristics and (iii) the spatial scale of analysis. Due to this complexity researchers do not have harmony in opinion about the intensity of causality between residential location choice and travel behaviour (Ewing and Cervero, 2001; Dieleman et al., 2002). Here there is also an argument about residential self-selection concerning travel behaviour which refers to how households choose a residential location that conforms to their travel-related attitudes. It makes a significant contribution to this complexity and ignoring this can lead to wrong estimation of the impacts of urban form on travel behaviour. Emerging research studies have addressed the relationship between urban Page 2 of 25
66 form and travel patterns. In response, land use planners have recommended certain policy measures to reduce travel demand such as: Push and Pull policies: Car user s attitudes can be changed by pull (by making the car unattractive) and push (by making public transport attractive) strategies, because attitudes are based on the weighing of the (perceived) costs and benefits of various alternatives. (ii) Hard and Soft measures: An effective way to change the behaviour of people is with hard measures like doubling the fuel price or doubling the public transport frequency. For soft measures (e.g. education, information and motivation) to be effective in changing the attitudes of people, a comprehensive and integrated urban form policy is required along with the transportation demand management strategies. (iii) Sustainable Communities: It means development policies that encourage dense and mixed land-use, car free developments where appropriate and establishment of home zones - strict controls on vehicles within residential areas (e.g. low speed limit such as 10 mph). The smart growth development strategies have impact on numbers and length of car trips. (iv) Opportunities and constraints: policies based on opportunities (for environmental friendly modes) and constraints (car mobility) are more effective to change the human behaviour such as safe riding paths for cyclists and pedestrians and maximum car parking standards rather than minimum. It is considered that households make a trade-off between residential location and the cost of commuting to access the goods and services. Households make their decision about a particular transport mode and residential choice on the basis of a systematic analysis of available alternatives. The advantages and disadvantages of a particular site can encourage or discourage adoption at a specific behaviour. Local development policies therefore need to provide certain kinds of opportunities at the micro level (e.g. neighbourhood design), in order to influence behavioural change at the macro level. The impacts of these interventions can be significant for society but there is still a need for research to explore the effectiveness of these policies. The aim of this paper is to examine the international research evidence concerning the factors which drive the residential location choice behaviour of households. It includes empirical research which discusses travel behaviour from the perspective of three main factors namely: planned behaviour (e.g. desire and attitude), land-use planning factors and socio-demographic characteristics. The rest of the paper has been organised as follows. Section two and three examines the theoretical linkage between land-use planning and travel behaviour. The role of sociodemographic and attitudinal factors has been assessed in section four. In section five, an importance of household selfselection has been examined and a conceptual model of household travel behaviour and housing choice preferences has been developed by focusing on personal and social characteristics which contribute to household mobility patterns and location choice. Section six deals with overall research methodologies and rational and Page 3 of 25
67 in the last section conclusion with key findings has been presented. 2 CHOICE BEHAVIOUR: THEORETICAL PERSPECTIVE A theoretical link between land-use planning and travel behaviour is important because theories provide the basis for understanding hypotheses. Theories can also explain the relationship between variables. The choice behaviour literature shows vast disagreement about the theoretical relationship between travel behaviour and land-use planning (Handy, 2004a). After many years of research, a common understanding is still missing, how the urban development in the region stimulates the needs for transportation and the supply of transport infrastructure makes the shape of urban form. For many years, the researchers have developed travel pattern theories about travel mode choice in the context of economy, geography and social aspects. It is pragmatic to look in detail these theories to understand the travel activity of the household. Before going to the depth of land-use planning impacts on travel behaviour, it is important to look at the theoretical perspective of choice behaviour first. 2.1 Planned Behaviour Theory Individual/household choice behaviour is mostly influenced by two factors, individual characteristics and the surrounding environment. Many studies show that individual travel choice depends on demographic factors (age, gender) and socioeconomic characteristics such as income level and education. Other internal and external factors which are also important in deciding the travel mode choice include: (i) attitudes, preferences, motivations and skills related to behaviour (ii) constraints or opportunities that have a direct impact on making the behaviour easier or more difficult in relation to a trip (iii) and the incentives and disincentives (Ajzen, 1991). Psychological studies explain behavioural responses by searching for factors that may explain people s choices including the external and internal factors which affect travel behaviour. One of such study is planned behaviour theory (PBT) (Ajzen, 1985; Ajzen 1991) which provides important information about attitude measurement and the prediction of human behaviour. PBT is probably the most frequently used theory in transportation on travel behaviour (Bamberg et al., 2003; Gardner and Abraham, 2008) which is derived from the expectancy-value theory (Bohte et al., 2009). Expectancyvalue theory says that people determine the expected value of their action by cognitive evaluation (e.g. public transport is environmentally friendly) multiplied by the affective evaluation of the attribute (e.g. using an environmentally friendly travel mode is good). Therefore, it is assumed that people choose the travel mode and residential location which they feel has the highest expectancy-value for them (Gärling and Garvill, 1993). The application of PBT to travel choice and residential choice helps in understanding how people make decisions. According to the PBT most actions can be viewed as deliberative and planned behaviour. Behavioural intentions are influenced by people s attitudes, subjective norms and perceived behavioural control. PBT says that individuals make their decision about a particular transport mode and residential Page 4 of 25
68 choice on the basis of systematic analysis of available alternatives. Behavioural intention comprises of three main factors namely: attitude to the behaviour (individual s positive or negative evaluation of performing a behaviour), subjective norm (perceived social pressure to perform the behaviour) and perceived behaviour control (perception of weather it is feasible to perform the behaviour). Behavioural Beliefs Attitude toward Figure 1 the Behaviour Normative Beliefs Subjective Norms Intention Behaviour Control Beliefs Perceived Behaviour Actual Behaviour Control Figure 1- The Theory of Planned Behaviour (Ajzen, 1991) Subjective norms mean an individuals perception about expectations and opinions of other people (like family members or friends). Social norms affect people s behaviour through intentions, especially when they are not sure about appropriate behaviour. People who are sure about which behaviour to perform are less affected by social norms and they have a low possibility of changing their behaviour. Perceived behavioural control refers to a person s perception about his/her own capability to perform an act (Forward, 1997). According to the theory, perceived behavioural control affects people s intentions, which subsequently influences behaviour. As presented in the figure 1, the broken arrow between perceived behavioural control and behaviour shows that the effect on behaviour can be both direct and indirect. There are four additional variables that are important and they include environmental concern, moral norm (internal notion whether it is right or wrong to perform the behaviour), behavioural norm (perception of other s behaviour) and habit (willingness to use a particular transport mode to travel to a variety of destinations). 3 LAND-USE PLANNING AND TRAVEL BEHAVIOUR The rise in transport demand is encouraged more by the increased spatial separation of homes and workplaces, shops and schools than by any rise in trip making, particularly in low density, sprawled cities (Banister, 2008; Owen, 1992). Rapid growth in car ownership has permitted more dispersed patterns of urban development; these land-use patterns in turn require longer journeys for most daily activities and have become increasingly difficult to serve by energy-efficient modes of Page 5 of 25
69 transport (Guo and Bhat 2007; Owens, 1992). The urban system is a dynamic entity and its spatial structure evolves overtime. There are some actors which are responsible for this evolution namely; housing, public institutions and activities centers. Location decisions of these actors can affect urban form and subsequently transport choice. Normally travel behaviour is a result of three main factors (Van Wee 2002; Stead and Marshall, 2001 and Stephen, 1993) as shown in the Fig. 2. The figure illustrates the relationships between the main determinants. All three categories are influential in all directions. Changes occurring in one of the three categories of determinants could have an impact on the complete system (Van Wee et al.1997; Van Wee, 2002). Figure 2 - Relationships between activity locations, needs and desires, transport resistances and travel behaviour (source: Van Wee et al.1997) Generally mobility can be defined as a movement of people and goods in space and time (Chapin, 1974). Activities are located in the space of different landuses and people need to spend time on these activities. Some studies show that mobility is also determined by demographic, cultural and socioeconomic aspects of a region, besides the temporal and spatial characteristics. These characteristics create the demand for travel and define how and why people travel and what modes they use for travelling. Many studies show that smart growth development (also called new urbanism in US which is a set of sustainable planning practice based in more compact, public transport accessible and multi-model development) can significantly reduce the need to travel (Erwing et al., 2007; Litman, 2009; TRB 2009). It is believed that travel is a derived demand, people need to travel long distances because jobs, services and other activities centres are located far away from their place of residence. People rely on cars for their daily activities even for short trips because there is no other viable option available Page 6 of 25
70 such as transit oriented development and mixed use development. 4 HOUSEHOLD S RESIDENTIAL CHOICE FACTORS In the previous sections of this paper our discussion formed on the human psychology and physical environment perspective of household residential choice. Other factors which influence household residential choice, are sociodemographic characteristics and the social environment such as, opportunities/constraints and incentives/ disincentives (Michaelson, 1977). According to some studies, housing characteristics such as cost, size and location are main choice factors (Timmersmans, 1988). Some researchers have opinion that life cycle - rather than economic motives - is the main explanatory factors in housing moves (clark and Van Lierop, 1987; Kijkamp et al., 1993) Residential location choice depends also on at least three other factors such as (a) attitudes, preferences, motivations, and skills related to the behaviour; (b) opportunities or constraints that make the behaviour easier or more difficult to perform; and (c) incentives or disincentives that encourage or discourage the desired behaviour relative to competing activities (Handy 2004; Brun and Fagnani 1994). 4.1 Demographics Characteristics People move their home location because of dissatisfaction with their current location or because a new location offers benefits not available at their current location. They are encouraged to move by changes in their personal (e.g. job change) or household circumstances (e.g. marriage, birth of child) or changes in their neighbourhood (more environmental friendly, quietness). Households are pulled to new locations by their aspirations for better housing or by opportunities that more closely match their needs and preferences. A move may occur because of a socio-economic change or social desire. For those households with children of school age, there is ample evidence that perceptions about the quality of schools influence locational decisions, as well as housing prices. Some studies point out that households make a trade-off between the amount of housing they can buy and the costs of commuting to access services (Hunt et al., 1994; Sermons and Koppelman, 1998). Because most households have budgetary constraints, housing costs and housing attributes (parking facility, number of rooms, lawn) are a primary factor in the locational choices they make. Housing costs vary with diverse factors of current location including size, quality, type, and age of the unit and the characteristics of the neighbourhood where it is located. Studies find that housing affordability is a primary determinant of the location of households, and people make trade-offs between housing cost and travel cost of access the different destinations (Kaysi and Abed, 2001; Cooper et al., 2001). Some studies addressed the residential choice issue by comparing housing attributes, residential environment and accessibility. The results of six case studies from the Netherlands suggest that accessibility considerations are significantly less important than housing attributes and attributes related to neighborhood environment (Molin and Timmermans, 2002). These findings however represent a discrepancy from Page 7 of 25
71 the results of other residential location choice studies (Gayda, 1998; Cooper et al, 2001; Walker et al, 2002). 4.2 Socio-economic Characteristics The socio-economic differences between different types of settlement also play an important role in transport choice (Headicar, 2000). Being a relatively prosperous society; it is easy to buy private car in most developed countries therefore the result is newer, expanding urban areas and in dormitory rural areas. This is reflected in much higher rates of household car ownership overall in developed countries including UK (Headicar, 2000; DfT, 2009). In the UK, two factors which are especially important in influencing the amount of car travel are the current lifestyle of younger generations and land-use planning (Headicar, 2000). A proportion of the difference in travel behaviour between settlement size categories will be attributable to such socio-economic differences rather than to settlement size in itself. This behavior is clearer when research conducted within two English counties is considered which suggests that socio-economic rather than land use characteristics account statistically for more of the variation in travel patterns (Stead et al., 2000). There are also large numbers of research studies available in literature, which deal with variety of socio-economic factors and their influence on travel pattern and residential location choice. After comprehensive review of studies, Stead and Marshall (2001) identify among others eleven types of socio-economic factors which impact on travel patterns. These socio-economic factors are interconnected with each other, and it is often difficult to separate the effect of one from another (Stead and Marshall, 2001). For example household income is linked to employment and this may influence car ownership and use. Car ownership and use is also further influenced by age and gender. Several studies have examined the impacts of socio-economic factors on travel pattern by using different methods and scales (Dunphy and Fisher, 1996; Kockelman, 1997). Socioeconomic characteristics such as income, age, gender, occupation have a significant impact on travel behaviour and must be adequately represented at a disaggregate level in models that attempt to estimate the impact of the built environment on travel behaviour (Stead and Marshall, 2001). Ewing and Cervero (2001) note further that socioeconomic factors are dominant in trip frequency decisions, whereas the built environment appears to be more influential with respect to trip length, while mode choice depends on both factors. Overall, a combination of household socio-demographic characteristics, such as income levels, age of household members, and family size, interact with the housing opportunities available in a region to determine whether a household will move. Housing opportunities are a product of the type and quality of housing stock, the characteristics of neighbourhoods, and desired quality as well cost of public services. 4.3 Attitudinal Factors Mostly all human being make mind towards or against something after the careful evaluation of situation. These evaluations can be affective evaluations, cognitive evaluations as well as behavioural responses. When it comes to the selection of residential location, it usually is impossible to identify the Page 8 of 25
72 exact role of travel related attitudes because with housing alternatives plenty of built environment attributes are also involved. As Lindberg et al., (1998) indicated the complexity of residential choice by mentioning that, different dimensions of housing attributes may not be evaluated independently of one another and therefore the evaluation of housing attributes in isolation from one another does not seem reasonable. On the issue of residential choice, most empirical studies have also measured current travel related attitudes rather than attitudes at the time of the residential choice to account for residential self-selection. Therefore, the whole interaction between attitudes, built environment characteristics and travel behaviour is important for sustainable transport policy Habit and Desire Some other factors like habit and desire have been added into many other studies. Infact, habit is considered one of the most significant factors and several studies have demonstrated the role played by habits in travel behaviour (Naess, 2005; Gardner and Abraham, 2008). Some scientists have criticised TPB for neglecting the role of habit and desire in human behaviour (Perugini and Conner, 2000; Perugini and Bagozzi, 2004; Dijst et al., 2008). It is considered that when any particular behaviour is performed repeatedly, it becomes habit, consequently individuals are guided by an automatic cognitive process and therefore decisions are influenced. Several studies have looked the effects of contextual changes (residential parking policy, financial incentives) on habits, intentions and attitudes related to travel patterns and have found a mix of results. According to some researchers land-use policies may be helpful with pull and push strategies to change attitude, as well as the habit of car use (Bamberg 2002; Fujii and Kitamura, 2003). But other studies show that it is hard to change the strong habit and as a result this habitual behaviour is a key barrier to reducing the car use (Bamberg et al., 2003; Bamberg, Rolle, and Weber, 2003; Matthies, Klockner, and Preissner, 2006). Some social behaviour experts have the opinion that objective advantages of car use like, higher speed, comfort, and flexibility are the main determinants of individual travel mode choice and consequently residential choice Lifestyle Lifestyle is defined as individual pattern of behaviour towards the resources available (Salomon and Ben-Akeva, 1983, Ge and Hokao, 2002 & 2006). Individual have developed a particular lifestyle for self satisfaction. Lifestyle determines the travel patterns for all kind of activities like; work, education, social and recreational. Travel patterns of individuals are influenced by lifestyle which is considered a very stable characteristic that is very hard to change and is a prominent determinant for residential location choice (Ettena and Timmermans; 1997). Thus, in the longterm lifestyle choice is an important factor in determining mobility behaviour. Choice of life-style is long term decision while the daily travel choice is short term. Decisions about family formation, job and free time activities all mostly depend on life-style. Page 9 of 25
73 4.4 Opportunities versus Constraints The role of opportunities and constraints at neighbourhood level has been discussed in detail in the health and physical activity literature (Handy 2004a&b; TRB 2002). Sustainable development of built environment can provide equal movement opportunities for motorized and non-motorized transport. For example, concerns about personal safety can reduce the modal share of non-motorized on the roads. Research studies have shown that cyclists perceive unsafe with car speed increases in urban region (TRB.2009 & 2002). Just providing opportunities for walking and cycling may not be sufficient to change behaviour unless the constraints related to use the opportunities cannot be omitted. Segregated land-use development and therefore long travel distances between destinations makes the personal car only viable option Incentives versus Disincentive In a review article, Kearney and DeYoung (1996) summarize the results of 29 empirical studies evaluating the effects of different intervention strategies on commuter car use. The results indicate that material incentives and disincentives are successful strategies which can initiate rapid changes in travel behaviour. It is hot debate among the researchers how to change the household travel behaviour using financial instruments. Pull and push policies (e.g. parking policy, congestion charges and subsidized public transport) have been introduced to encourage more sustainable patterns of transport. Incentives and disincentives policies can be introduced from a neighbourhood to a regional scale by lowering the cost of a desired behaviour and raising the price of an undesired behaviour. For example, walking and cycling can be encouraged by providing the safe designated paths and restricting the vehicle speed limit. If people perceive that the behavioural changes are impossible (reflecting little personal control), then push and pull policies will not be effective. Individual s behaviour also depends on the opportunities to perform the behaviour. Besides the actual opportunities, the perceived opportunities are also important in deciding whether to perform an action. For example, if people consider the public transport as unsafe then it cannot be perceived as a reasonable option, even though it might be a feasible alternative. Often pricing policies are considered to be able to change the opportunities that people have (Ubbels and Verhoef, 2003). Though the PBT claims that major source of behaviour determinants are attitude, subjective norms and perceived behaviour control, the empirical research (DfT, 2003) shows that they are hardly sufficient to provide a complete account for decision making process. 5 RESIDENTIAL SELF- SELECTION Households may not only align their travel behaviour to the possibilities and constraints of their residential location, but also self-select themselves by choosing to live in residential locations that correspond with their travel related attitudes. For example, residents who prefer driving over using public transport may choose remote and spacious neighbourhoods, while households with a preference for public transport may opt for more urban residential locations within walking or Page 10 of 25
74 cycling distance of a railway station. Residential self-selection significantly contributes to the complexity of travel behaviour and links with housing location choice. Ignoring residential selfselection leads to an overestimation of the impact of the built environment. This is evidenced by several studies on residential choice which, using different research methods, have indicated that travel-related attitudes and preferences do indeed influence residential choice (e.g. Molin and Timmermans, 2003; Schwanen and Mokhtarian, 2007; Naess, 2009). Therefore it is essential that the issue of self-selection is discussed in some detail. Residential self-selection (also called the Sorting effect) is related to travel behaviour and means how households choose a residential location that suits to their travel-related attitudes. In other words, self-selection refers to the tendency of people to choose locations based on their travel abilities, needs and preferences (Litman, 2005, p.6). Residential location choice is an important a long term decision for a family which affects the travel patterns in the long run. On the other hand, travel behaviour of households may be affected by the opportunities and constraints of a location. Research studies show that, for residential self-selection, people take decisions under the influence of two sources: socio-demographic circumstances and personal attitudes (Mokhtarian and Cao, 2008). For example, a location decision under certain financial limitations (job, budget to buy/rent the house) and a residential choice without any internal or external limitation. Under the first assumption people (households and individuals) select an area and locate themselves accordingly and then based on a range of neighbourhood attributes, develop their travel behaviours. This means people choose the location under financial or time constrained reasons but not necessarily because of car ownership. Built environment attributes can play an important role in shaping the travel behaviour, but the problem with the above assumption is that it does not take a comprehensive view of how individuals and households make residential choice and travel decisions. In real life, it is clear that high density and mixed land-use developments with public transit are more attractive for the car neutral households and individuals. These types of households will use walking and cycling to pursue their daily activities if neighbourhood facilities are available. The second assumption is based the strong personal preferences related to travel pattern. Travel behaviour of people and consequently residential location selection comes under personal attitude and then people fulfil their daily requirement accordingly, like visiting jobs, services and activities. For example, people with high car ownership prefer less crowded residential location and remote neighbourhood. These assumptions have been confirmed by many studies with different research methods, although disagreement exists about impact intensity of built environment attributes and household variables. Some recent studies show that travel related habits and preferences have a significant influence on residential self-selection (Molin and Timmermans, 2003; Schwanen and Page 11 of 25
75 Mokhtarian, 2007; Mokhtarian and Cao, 2008; Naess, 2009). The correlation of housing choice and travel mode choice is an understudied area and researchers are divided about the exact causal effect of both. Numerous recent studies have found a significant association between the residential environment and travel behaviour (Scheiner J. 2009; Pinjari et al., 2009; Cao et al., 2009; Naess 2009). However, most of these studies confirm only the associative relationship between them and the disagreement exists in knowing whether the neighbourhood environment influences travel behaviour or travel pattern preferences affects residential choice. The above mentioned large amount of literature from US and Europe covers the impacts of residential location choice (neighbourhood facilities) on travel behaviour but the reverse effect has not been well documented in the literature. Accessibility is a dominant factor when selecting a residential location. Policies related to transportation and land-use planning can impact on the lifestyle of households in the specific area. The residential location preference is one of many variables thought to affect travel behaviour. The conceptual model for this study (Fig. 3) recognizes the complex relationships travel behaviour and housing location. The impact of many variables in particular context are still unknown, however some decisive factors are included: household s sociodemographic characteristics, personal attitude and habits and physical environment as shown in the conceptual model below. As mentioned above, numerous studies have found a significant association between the built environment and travel behaviour. However, most of these studies confirm only the associative relationship between them and the disagreement exists in knowing whether the built environment influences travel behaviour or travel behaviour preferences and land-use patterns affects residential choice. If the later assumption is more dominant then the ability to use the built environment characteristics to change traveller s mobility patterns may be limited because the majority of people like suburban types of development and who prefer walking, may consciously choose to live in walkable neighbourhoods (Morrow- Jones et al., 2004). Page 12 of 25
76 Land-use Planning and Transportation Policies Housing Location Choice & Activities Accessibility & Connectivity Housing Choice Location Preference Personal Behaviour (Attitude, Habit etc.) Travel Behaviour Travel Preferences Personal & HH Characteristics Direct effect Indirect effect Causal effect Socio-economic and Demographic Characteristics Figure 3 - Conceptual Model: Travel behaviour and Housing choice Preferences 6 METHODOLOGICAL FRAMEFORK The literature review indentified the research gap in the area of housing location preferences and travel patterns. Three methodological flaws are most common. First, only few studies have systematically tried to differentiate carefully the influence of sociodemographic variables, neighbourhood built environment and transportation system on RLC. Often, there is a strong empirical relationship between sociodemographic variables and neighbourhood characteristics, implying that any correlation between travel patterns and neighbourhood characteristics might be spurious. Secondly, researchers have used different levels of aggregation (individual, neighbourhood, city) in the same analysis directly impacts the significance levels of the estimated regression coefficients, which may lead them to draw the wrong conclusions. Thirdly, many studies only look at trips for specific travel motives, such as work or shopping. Effects found on these types of trips do not shed light on the effects on total travel over all motives. Based on the identified factors, this study evaluates two key themes. Firstly, households select an area and locate themselves accordingly; then based on a range of neighbourhood attributes, they develop their travel behaviours. Attributes of built environment thus play an important role to shape travel behaviour. Many empirical studies support this idea that high density and mixed land-use development with good public transit are more attractive for the car neutral households. Secondly, households make their housing location decision under strong personal mobility habit/attitudes and fulfil their daily requirements accordingly. This implies Page 13 of 25
77 that built environment attributes do not have any significant impact on RLC. Some recent studies stress the importance of habits and attitudes in self-selection (Naess, 2009, Bohte et al. 2009). Literature review in the previous sections has indentified the following key factors in connection with RLC and travel behavior namely; Housing unit (number of rooms, property type, garden, parking space etc) Neighbourhood index (distance to school, shops and activity centres) Residential Environment (quietness, green area, safety) Accessibility (PT connection, car dependency) Cost (housing cost, travel cost) Social Status (lifestyle, attitude) Corresponding to international studies of residential self-selection (Scheiner, 2010; Pinjari et al., 2009; Cao et al., 2009) the above mentioned six key determinants are included in this research. Combination of quantitative as well as qualitative research can enable us to answer the questions concerning the residents motivations and purposes for their ways of relating to their physical surroundings, notably the question about rationales for activity location and modal choice. This research study will avoid the potential methodological flaws by using the combination approach which is including focus group discussion (FGD), Q method, cross-sectional and time series analysis. 6.1 Overall Research Design The research incorporates qualitative and quantitative analysis, the approach and methodology has been depicted in the figure 4. The methodology developed seeks to address the effect of housing location on travel mode choice on access to facilities, goods and services. In order to address the research problem the work is divided in two parts, the first part deals with focus group discussion and Q methodology while the second part deals with the application of revealed preference household surveys. Page 14 of 25
78 Land-Use planning and Transportation Policies Focus Group Discussion M E T H O D O L O G Y Literature Review RP Questionnaire Data Collection Statistical Analysis Policy Evaluation Q Methodology Figure 4 - Overall research methodology framework Table 1 provides an overview of the types of information considered necessary in order to answer each of the research questions of this study. The table also shows the data sources used in order to acquire the desired information. This study uses focus groups and Q methodology to develop an understanding of the causality direction of residential self-selection -influence of different neighbourhood types on households mobility patterns and vice versa- which is further examined using a revealed preference (RP) survey. The methodology will be based on a selection of neighbourhoods with variation of determinants resulting in areas with high versus low accessibility and land use mix. Table 1: Research questions, information required and data sources Research Question Required Information Source of Information - Which neighbourhood qualities are important for households choice of residential location? Measurement of key variables such as: Perceived neighbourhood characteristics, accessibility to selected services and activities, commute trip characteristics, vehicles available to household Page 15 of 25 * Survey questions about the factors for neighbourhood characteristics such as: attractiveness, accessibility to PT & neighbourhood facilities, socializing, housing space * Technical visits * Qualitative FG discussion including questions about motives for choices of neighbourhood and modal choices * Ranking the most to least desired neighbourhood qualities through
79 - Do the household select a particular location or do the attributes of the particular location affect car ownership of the people moving to it? - What is the main residential location factors influencing the dwellers choice of transport mode? - To what extent household s lifestyle and attitudinal preferences play role in residential location decision and travel behaviour? * Socioeconomic characteristics of the residents and their attitudes to relevant issues * The location of the residence and its distances from various facilities * Travel behaviour before and after moving to the present dwelling * Residents travel activity to access services and activities centres * The activities in which the residents engage, their location, and possible changes compared to previous residential location and/ or life situation * Location of activities, use of different modes of transport, and the considerations behind these choices * Information about Travel Preferences and residential preferences related to lifestyle and attitude/habit. * Information about number of cars/cycles/bus pass and sociodemographic (age, education, income etc.) Q-methodology * Survey questions about socio-demographic characteristics of the residents, travel & environmental attitudes Estimation of residents travel Survey questions about the and the distances travelled by their vehicles, and any changes in the amount of travel after moving * Questions in questionnaires and qualitative interviews about activities, their location, * Qualitative interviews including questions about destinations and travel modes, and the motivations for these choices *Through the Q-methodology respondents will be pooled in 5 main categories namely: Pro- Transit, Car dependent, Environment concerned, Safety concerned and Status conscious. * Further through quantitative survey results will be analysed Qualitative data will be derived through the focus group discussion (FGD) as well as using Q-method with the carefully selected household representatives from the case study areas. Focus group discussion will be helpful to inquire the decision of residential self-selection. RP Survey will be well designed and only relevant and to the point question will be included with easy to reply. Five neighbourhoods in Greater Belfast Metropolitan Area (GBMA) that differ with respect to neighbourhood design have been selected. From each case study area approximately the opinion of 200 household units will be collected through face to face survey. For survey households who had moved within the last 5 year will be selected. Data on travel behaviour, perceived neighbourhood characteristics, preferences for neighbourhood characteristics, travel preferences, and socio-demographic characteristics using a face to face household survey will be collected. 6.2 Methodology Rational Different techniques have been used to investigate residential self-selection with respect to household travel behaviour such as direct questioning (focus group, in-depth interviews) (Handy and Clifton Page 16 of 25
80 2001), statistical control (Kitamura et al., 1997; Schwanen and Mokhtarian, 2005), instrumental variables models (Greenwald and Boarnet, 2001), discrete choice models (Cao et al., 2009), structural equations models (Bagley and Mokhtarian, 2002; Scheiner, 2010), and longitudinal designs (Handy, 2004; Cao et al., 2007 Naess, 2005&2009). In a comprehensive paper Mokhtarian and Cao (2008) has identified main advantages and disadvantages of each method and also noted the difficulties in actually quantifying the absolute and/or relative extent of the true influence of the built environment on travel behaviour. This research has adopted a combination of qualitative and quantitative. To understand household attitude and preference for residential self-selection qualitative approach (FGD and Q method) if carefully implemented, can provide very useful insights and perceptions, sometimes beyond what multivariate analyses can do. Mokhtarian and Cao (2008) have mentioned several limitations and weakness related to direct questioning (FGD) method such as small sample size. Moreover, some researchers (Galasiński and Kozłowska, 2010) based on (Gomm, 2004) questioned the validity of direct questioning data because of certain reasons such as; the participant does not know the right answer but gives an answer nonetheless; the participant gives an inaccurate answer which she/he thinks is accurate; the participant knowingly gives an inaccurate answer in order to present a favourable impression; the participant is unwilling to give (what s/he thinks) is the right answer, but gives another, perhaps one which the respondent thinks the interviewer wants; the participant refuses to give any answer at all; the participant doesn t interpret the question as it was intended and gives an answer based on a different interpretation, unbeknown to the researcher. Mokhtarian and Cao (2008) have pointed out that direct questioning studies suffer with number of biases including; memory, consistency, saliency and social desirability. However, social science researchers defend the direct questioning method by arguing that these biases are equally possible and self-administered questionnaires survey data is equally vulnerable to the most of biases and limitation discussed above. Therefore, for better understanding the issue of residential self-selection the combination of qualitative as well as quantitative approaches are equally important for this research study. Qualitative methods, e.g. group discussions and Q methodology, will provide the subjective analysis (by segmenting households according to their lifestyle, preference and attitude) whereas questionnaire survey will focus on objective analysis (e.g according to socio-economic variables) of households. The advantages of Q- method are nowadays generally recognized (Raje, 2007) to investigate attitudinal variables such as households lifestyle, and preferences. Moreover, accuracy in data quality can play an important role in understanding selfselection and decreasing errors due to Page 17 of 25
81 ignoring self-selection. For data collection, Q-method is relatively simple technique compare to questionnaire survey requires low number of participants and therefore high chances to collect accurate data. Thus, the combination of qualitative and quantitative analysis will allow the researcher to estimate more precisely (i) the direct effect of person and household variables (e.g. age, income and household characteristics, but also attitudes) on travel behaviour; (ii) the impact of land-use variables (such as d mixed land use variables) on travel behaviour; and (iii) the effect of person and household variables on location choice, and via location choice on travel behaviour. 7 CONCLUSION This paper has examined the literature related to household travel behaviour and the relationship with urban form. It investigates empirical evidence about the claims that land-use planning factors, household socio-demographic factors and social as well as personal preferences (attitude, habit) are the main determinants in the selection of household travel patterns and residential location choice. The analysis of the literature indicates that urban form factors have impacts on household s travel behaviour but that the role of socio-demographic factors and personal preferences are also significant which need to be quantified precisely. Another issue is self-selection; in the literature there are still limited numbers of studies which address the issue of self-selection principally. Households choose their residential locations based, among other things, on their preferences for modal split and/or preference for residential location. Here are key findings of this paper; The research implies that the relationship between urban form and travel behaviour is promising but it is premature to conclude that land-use planning policies can manage, control and shape individual s travel behaviour and then overall aggregate travel demand. Spatial planning certainly influences transportation behaviour, but explicit claims regarding any connection b/w residential location and mode choice are mainly speculative. Smart Growth is a hopeful effort to provide more consistent and sustainable planning, but disagreement exist among the researchers about its specific transportation behaviour claims. Better data and better empirical methods with the combination of qualitative/quantitative methods and models can give understanding the interaction of urban design and transportation. It is a challenge to balance the human need for residential location preference against the need for sustainable mobility. In order to achieve sustainable travel behaviours, spatial planners need to design neighbourhoods (either constructing new or modifying the existing) that have sustainable patterns with houses that consider households various housing, travel and locality preferences. Page 18 of 25
82 8 REFERENCES Ajzen I. (1985) From intentions to actions: A theory of planned behavior. In J. Kuhl & J. Beckman (Eds.), Actioncontrol: From cognition to behavior, Heidelberg Springer. pp Ajzen I. (1991) The theory of planned behavior. Organizational Behavior and Human Decision Processes, 50(2), pp Badoe D. and Miller E. (2000) Transportation-land use interaction: empirical findings in North America, and their implications for modeling. Transportation Research D. Vol. 5, No. 4, Bamberg S. (2002) Effects of implementation intentions on actual performance of new environmentally friendly behaviours: Results of two field experiments. Journal of Environmental Psychology, 22, Bamberg S. and Schmidt P., (2001) Theory-driven evaluation of an intervention to reduce the private caruse, Journal of Applied Social Psychology 31 (6), pp Bamberg S., Ajzen I. and Schmidt P. (2003) Choice of travel mode in the theory of planned behavior: the roles of past behavior, habit, and reasoned action, Basic and Applied Social Psychology, 25(3), pp Bamberg S., Rölle D. and Weber C. (2003) Does habitual car use not lead to more resistance to change of travel mode. Transportation 30: Banister D. (1996) Energy, quality of life and the environment: the role of transport. Transport Reviews, 16(1), pp Banister, D (1997) Reducing the Need to Travel, Environment and Planning B: Planning and Design 24 (3), pp Banister, D. (2008) The sustainable mobility paradigm, Transport Policy, 15(2), pp Bento, M., Cropper L., Mobarak M. and Vinha K.(2005) The Effects of Urban Spatial Structure on Travel Demand in the United States. The Review of Economics and Statistics, Vol. 87, No. 3, pp Bhat C. and Guo J. (2007) A comprehensive analysis of built environment characteristics on household residential choice and auto ownership levels, Transportation Research Part B, 41(5), pp Bhat C. and Lockwood A. (2004) On distinguishing between physically active and physically passive episodes and between travel and activity episodes: an analysis of weekend recreational participation in the San Francisco Bay area. Transportation Research Part A, 38 (8), pp Bhat C. and Singh, S. (2000) A comprehensive daily activity-travel generation model system for workers. Transportation Research Part A 34, (1), pp Bhat C., Srinivasan S. and Axhausen K. (2005) An analysis of multiple interepisode durations using a unifying multivariate hazard model. Transportation Research Part B, 39 (9), pp Bhat C. and Srinivasan S. (2005) A multidimensional mixed orderedresponse model for analyzing weekend Page 19 of 25
83 activity participation. Transportation Research Part B 39 (3), pp Bhat C. and Zhao H. (2002) The spatial analysis of activity stop generation. Transportation Research Part B, 36 (6), pp Boarnet M. and Crane, R. (2001) The influence of land use on travel behavior: specification and estimation strategies. Transportation Research Part A, 35 (9), pp Boarnet M. and Sarmiento S. (1998) Can land-use policy really affect travel behavior? A study of the link between non-work travel and land-use characteristics, Urban Studies, 35 (7), pp Bohte W., Maat K. and Wee van B. (2009) Measuring Attitudes in Research on Residential Self-Selection and Travel Behaviour: A Review of Theories and Empirical Research, Transport Reviews, 29 (3), pp Breheny M. (1992) the Contradictions of the Compact City: A Review, In: Breheny, M. (ed.) Sustainable Development and Urban Form. London: Pion Limited. Breheny, M (1998) Demographic, Household and Housing Issues, Paper for National Spatial Planning Framework, University of Reading Brownstone D. and Golob F. (2009) The Impact of Residential Density on Vehicle Usage and Energy Consumption. Journal of Urban Economics, 65, pp Brun, J. and Fagnani, J. (1994) Lifestyles and locational choices tradeoffs and compromises: a case-study of middle-class couples living in the Ile-de- France region, Urban Studies, 31(6), pp Mokhtarian P. and Cao X. (2008) Examining the impacts of residential self-selection on travel behaviour: A focus on methodologies. Transportation Research B, 43 (3), Cao X., Mokhtarian P. and Handy S. (2009) Examining the Impacts of Residential Self- Selection on Travel Behaviour: A Focus on Empirical Findings. Transport Reviews, Vol. 29, No. 3, pp Cao X., Mokhtarian P. and Handy S. (2009) The relationship between the built environment and nonwork travel: A case study of Northern California, Transportation Research Part A, 43(5) pp Chen C., Gong H. and Paaswell R. (2008) Role of the Built Environment on Mode Choice Decisions: Additional Evidence on the Impact of Density. Transportation, Vol. 35, pp Clark W. and Onaka D., (1983) Life cycle and housing adjustment as explanations of residential mobility, Urban Studies 20, pp Cooper J. Ryley, T. and Smith A. (2001) Energy trade-offs and market responses in transports and residential land use patterns, Urban Studies, 38, Crane, R. (2000), The influence of urban form on travel: an interpretive review. Journal of Planning Literature 15(1), pp Curtis, C and Headicar, P (1995) Reducing the need to travel: strategic housing location and travel behaviour, Oxford Planning Monographs 1 (2) DfT (2003) Psychological Factors Affecting Transport Mode Choice: Identification and Measurement Tool Development, Department for Transport, [Accessed on June 18, 2008] Page 20 of 25
84 Dieleman F. M., Dijst M. and Burghouwt G. (2002) Urban form and travel behavior: micro-level household attributes and residential context, Urban Studies, 39(3), pp Dijst M., Farag S. and Schwanen T. (2008) A comparative study of attitude theory and other theoretical models for understanding travel behaviour, Environment and Planning A, 40(4), pp Ettena D. Timmermans H., (1997) Theories and models of activity patterns. In: Ettema, D. Timmermans H. (Eds.), Activity-Based Approaches to Travel Analysis. Pergamon, Oxford, pp Ewing R., DeAnna M. and Li, S-C. (1996) Land use impacts on trip generation rates. Transportation Research Record, 1518, pp. 1-6 Ewing R., and Cervero R. (2001) Travel and the built environment - synthesis. Transportation Research Record 1780, pp Forward F. (1997) Measuring attitudes and behaviour using the theory of planned behaviour. In: Rothengarther T. and Carbonell Vaya E. (eds.), Traffic and transport psychology. Theory and application, Elsevier Science Ltd. Oxford Fujii S. and Kitamura R. (2003) What does a one-month free bus ticket do to habitual drivers? An experiental analysis of habit and attitude change, Transportation 30: Gardner B. and Abraham C. (2008) Psychological correlates of car use: a meta-analysis, Transportation Research Part F, 11, pp Galasinski D and Kozłowska O., (2010) Questionnaires and lived experience: Strategies of coping with the quantitative frame. Qualitative Inquiry, 16(4) Gayda S. (1998) Stated preference survey on residential location choice in Brussels, Proceedings of the 8th World Conference on Transport Research, Antwerp Gärling T. and Garvill J. (1993) Psychological explanations of participation in everyday activities, Psychological and Geographical Approaches, pp Elsevier Ge J.and Hokao K., (2004) Research on residential environmental evaluation of local cities considering regional characteristic and personal residential preference - a case study of Saga City, Japan, Journal of Environmental Science. 16 (1), pp Ge J.and Hokao K., (2006) Research on residential lifestyles in Japanese cities from the viewpoints of residential preference, residential choice and residential satisfaction, Journal of Landscape and Urban Planning, 78, pp Guo J. and Bhat C. (2007) Operationalising the Concept of Neighbourhood: Application to Residential Location Choice Analysis, Journal of Transport Geography, 15(1), Handy S. (2004) Critical Assessment of the Literature on the Relationships Among Transportation, Land Use, and Physical Activity. TRB and Institutes of Medicine Committee on Physical Activity, Health, Transportation, and Land Use, Washington, DC Handy, S. (2005) Smart Growth and the Transportation-Land Use Connection: What does the research tell us? Page 21 of 25
85 International Regional Science Review, 28(2) Handy S., Cao X., Buehler T. and Mokhtarian P. (2005) The link between the built environment and travel behavior: correlation or causality? Presented at the 84th Annual Meeting of the Transportation Research Board, Washington, DC Headicar P. (2000) the Exploding City Region; Should It, Can It, Be Reversed? InWilliams K, Burton E and Jenks M (eds.), Achieving Sustainable Urban Form, E&FN Spon, London Hunt J., McMillan J. and Abraham J. (1994) Stated preference investigation of influences on the attractiveness of residential locations. Transportation Research Record, 1466, pp Jenks M. and Demsey N. (2005) Future forms and design for sustainable cities, Architectural Press, UK. Holtzclaw J., Clear R., Dittmer H. and Haas P. (2002) Location efficiency: neighbourhood and socioeconomic characteristics determine auto ownership and use -studies in Chicago, Los Angles and San Francisco. Transportation Planning and Technology, 25(1), pp Kaysi I. and Abed J. (2001) Residential choice in post-war Beirut: Implications for urban development and travel patterns, Proceedings of the 9th World Conference on Transport Research, Seoul. Kearney A. and De Young R. (1996) Changing commuter travel behaviour: Employer-initiated strategies, Journal of Environmental Systems 24, pp Kitamura R., Mokhtarian P. and Laidet L., (1997) A micro-analysis of land use and travel in five neighborhoods in the San Francisco Bay area. Transportation 24, pp Kitamura R., Laidet L., Mokhtarian P., Buckenger C. and Gianelli F. (1994) Land use and travel behaviour. Institute of Transport Studies, University of California, Davis Lindberg E., Gärling T. and Montgomery H. (1988) People s beliefs and values as determinants of housing preferences and simulated choices, Scandinavian Housing and Planning Research, 5, pp Litman T. (2009) Where We Want To Be: Home Location Preferences and Their Implications for Smart Growth, VTPI at ( [Accessed on July 11, 2009] Louviere J. and Timmermans P. (1990) Hierarchical information integration applied to residential choice behaviour. Geographical Analysis, Vol. 22, 1990, pp Lund H., (2003) Testing the claims of new urbanism. Journal of Applied Psychology 69 (4), Matthies E., Klockner, C. A., & Preissner, C. L. (2006) Applying a modified moral decision making model to change habitual car use: How can commitment be effective? Applied Psychology and International Review, 55, Michaelson W. (1977) Environmental choice, human behaviour and residential satisfaction, Oxford University Press, New York, NY Mokhtarian P. and Cao X. (2008) Examining the impacts of residential self-selection on travel behavior: a focus on methodologies, Transportation Research B, 42(3), pp Page 22 of 25
86 Molin E. and Timmermans H. (2003) Accessibility considerations in residential choice decisions: accumulated evidence from the Benelux. Paper presented at 82nd Annual Meeting of the Transportation Research Board, Washington, DC Molin E., Oppewal H. and Timmermans H. (1999) Group-based versus individual-based conjoint preference models of residential preferences: a comparative test, Environment and Planning A, Vol. 31, pp Morrow-Jones H., Irwin G. and Roe B. (2004) Consumer preference for neotraditional neighborhood characteristics, Housing Policy Debate, 15, pp MuConsult, (2000) Mobility Starts at Home. The Effect of the Housing Environment on Mobility and Mode Choice. Eindrapport. MuConsult, Amersfoort. Naess P. (1993) Transportation Energy in Swedish Towns and Regions. Scandinavian Housing & Planning Research, 10, pp Næss, P., Sandberg L. And Røe (1996) Energy Use for Transportation in 22 Nordic Towns. Scandinavian Housing & Planning Research, 13, pp Naess, P. (2005) Residential location affects travel behaviour: but how and why? The case of Copenhagen metropolitan area, Progress in Planning, 63(1), pp Naess, P. (2006) Accessibility, activity participation and location of activities: exploring the links between residential location and travel behaviour, Urban Studies, 43, pp Naess, P. (2009) Residential selfselection and appropriate control variables in land use-travel studies, Transport Reviews, 29, pp Newman P. and Kenworthy J. (1989) Gasoline consumption and cities: A comparison of U.S. cities with a global survey. Journal of the American Planning Association, 55 (1): pp Newman P. and Kenworthy J. (1999) Costs of Automobile Dependence: Global Survey of Cities. Transportation Research Record 1670, pp Nijkamp P., Van Wissen L. and Rima A. (1993) A household life cycle model for residential relocation behaviour. Socioeconomic Planning Science. 27 1, pp Owens S. (1992) Energy, Environmental Sustainability and Land Use Planning, In: Breheny, M. (eds.) Sustainable Development and Urban Form. London: Pion Limited. Owens S. (1995) Integrated Urban Transport and Land Use Planning Policies, ECMT. Sustainable Transport in Central and Eastern European Countries. Bucharest, Romania. Perugini M. and Bagozzi R. (2004) The distinction between desires and intentions, European Journal of Social Psychology, 34, pp Perugini M. and Conner M. (2000) Predicting and understanding behavioural volitions: the interplay between goals and behaviours, European Journal of Social Psychology, 30, pp Pinjari A. R., Bhat C. R. and Hensher D. (2009) Residential self-selection effects in an activity time-use behaviour model, Transportation Research Part B, 43, Issue 7, pp Rajamani J., Bhat C. and Handy S. (2003) Assessing impact of urban form Page 23 of 25
87 measures on non-work trip mode choice after controlling for demographic and level-of-service effects. Transportation Research Record 1831, pp Raje, F. (2007) Using Q methodology to develop more perceptive insights on transport and social inclusion, Transport Policy 14, Rodriguez D., Khattak A. and Evenson, K. (2005) Can neighborhood design encourage walking and bicycling? Physical activity on a new Urbanist and a conventional suburban community. Presented at the 84th Annual Meeting of the Transportation Research Board, Washington, DC Rooij R. (2005) The Mobile City: The planning and design of the Network City from a mobility point of view, TRAIL Thesis Series, The Netherlands Salomon I. and Ben-Akiva M. (1983) The use of the life-style concept in travel demand models, Environment and Planning A 15(5) Scheiner J. (in press) Social inequalities in travel behaviour: trip distances in the context of residential self-selection and lifestyles, Journal of Transport Geography (2009), doi: /j.jtrangeo Schwanen T., Dijst M. and Dieleman M. (2004) Policies for Urban Form and their Impact on Travel: The Netherlands Experience, Urban Studies; 41; pp Schwanen T. and Mokhtarian P. (2005) What affects commute mode choice: neighborhood physical structure or preferences toward neighborhoods? Journal of Transport Geography 13 (1), pp Sermons M., and Koppelman S. (1998), A Factor Analytic Approach to Incorporating Systematic Taste Variation into Models of Residential Location Choice. Transportation Research Record, V. 1617, pp Schwanen T. and Mokhtarian P. (2007) The role of attitudes toward travel and land use in residential location behavior: some empirical evidence from the San Francisco Bay Area, Housing Policy Debate, 18(1), pp Shay E. and Khattak A. (2005) Auto ownership and use in neo-traditional and conventional neighborhoods. Presented at the 84th Annual Meeting of the Transportation Research Board, Washington, DC Stead D. (2001) Relationships between land use, socioeconomic factors, and travel patterns in Britain. Environment and Planning B 28 (4), Stead D. and Marshall S. (2001) The Relationships between Urban Form and Travel Patterns: An International Review and Evaluation. European Journal of Transport and Infrastructure Research, 1(2), pp Stead D, Williams J and Titheridge H (2000) Land Use, Transport and People Identifying the Connections, In: (eds.) William K., Burton E. and Jenks M. Achieving Sustainable Urban Form. London: E&FN Spon, pp Stephen J. (1993) Transport, Strategy and Policy. Blackwell Publisher, pp Timmersmans H. (1984) Decompositional multi-attribute preference models in spatial analysis: a review of some recent developments, Human Geography. 8, pp Page 24 of 25
88 TRB (2009) The Effects of Compact Development on Motorized Travel, Energy Use, and CO2 Emissions. Transportation Research Board Special Report 298. Available at [Accessed on January 15, 2010] TRB (2002) Does the built environment influence physical activity? Examining the evidence. Transportation Research Board Special Report 282. Available at [Accessed on May 17, 2010] Ubbels B. and Verhoef E., (2003) Behavioural Responses to Road Transport Pricing: A Multidisciplinary Perspective. Paper presented at the NECTAR congress, Umea, Sweden Van Wee B. (2002) Land use and transport: research and policy challenges, Journal of Transport Geography 10, Van Wee B., Bakker T.D. and Van der Hoorn, T. (1997) Office suites suit the railways: the effects of office locations to public transport nodal points on passenger transport. In: PTRC European Transport Forum, Annual Meeting, Proceedings of Seminar E: Transportation Planning Methods, vol.1 Verplanken B., Aarts H. and van Knippenberg A. (1997) Habit, information acquisition, and the process of making travel mode choices, European Journal of Social Psychology 27: Walker B., Marsh A., Wardman, M. and P. Niner (2002) Modeling tenants choices in the public rented sector: A stated preference approach, Urban Studies 39, Page 25 of 25
89 USING A MULTI-CRITERIA ASSESSMENT APPROACH TO IDENTIFY SUSTAINABLE TRANSPORT KEY ATTRIBUTES Moataz M. Mahmoud 1, Julian Hine 2, Banihan Gunay 3 1. School of the Built Environment, University of Ulster, Newtownabbey, Northern Ireland; mahmoud-m@ .ulster.ac.uk 2. Professor of Transport, School of the Built Environment, University of Ulster, Newtownabbey, Northern Ireland; jp.hine@ulster.ac.uk 3. Lecturer, School of the Built Environment, University of Ulster, Newtownabbey, Northern Ireland; b.gunay@ulster.ac.uk ABSTRACT There is a great reliance on sustainable transport assessment in order to monitor the progress of achieving sustainability in transport systems. These assessments are varying both on nature and type. However, the selection of the appropriate assessment is a challengeable task not only due to the vast number of available assessments methods, but also because of the numerous attributes of sustainable transport and the relative weight of each attribute. These attributes have different influences on the way sustainable transport could be monitored and achieved. The challenge is to identify the key attributes of sustainable transport systems from user perspectives and to define their relative weight and priority of application. In this paper, the motive to apply the concept of sustainable transport from the transport policy perspective was introduced addressing all the different definitions of the concept in the UK transport context. Second, taxonomy of sustainable transport objectives was carried out introducing different objectives of sustainable transport in varied contexts. Third, sustainable transport indicators were introduced, derived and categorised. Fourth, a qualitative method was used to investigate users perceptions and attitudes toward sustainable transport. Fourth, a multi-criteria approach was generated in order identify the relative weight and priority of application. Finally, the opportunities and challenges were discussed opening the way for future research. Keywords: Multi-criteria approach, Sustainable Transport, User perception. 1 INTRODUCTION The term sustainability as a principle in urban transport policy is frequently advocated but rarely defined (May et al, 2006). The term gained great value due to the role it plays in adding multidimensional tasks through the transport agenda (Hull, 2005). Several governmental publications both in UK and EU have advocated a sustainable approach to be applied in transport polices (May et al, 2006). After the rise of the new realism in UK transport policy. Especially after the introducing of integrated policy approach in the first white paper new deal of transport (DETR, 1998), the UK government identified sustainable transport as a key component of the new policy approach (Dft, 200a). Yet, the meaning of sustainability in the context of transport planning is still broad and it has been used in different contexts (Santos et al, 2010). 2 DEFINITIONS OF SUSTAINABLE TRANSPORT Historically the term sustainable transport was derived from the origin of sustainable development as the expression of sustainability on the context of transport system. Although there are many trails to define sustainable transport, yet there is no single universally accepted definition (Castillo and Pitfield, 2010). Out of these trials (Black, 1996; Richardson, 2005) defined the term through adopting the Burdtland commission definition of sustainable development as; the ability to meet today`s transportation needs without comprising the ability of future generation to meet their transportation needs. While, many writing (Mahmoud and Yousef, 2010; Litman, 2003; Loo, 2002; World Bank, 1996; OECD, 1996; WECD, 1987) pointed out the definition of the term in the context of the triple bottom life concept of economic, environment, and social equity. According to this definition, sustainable Page 1 of 10
90 transport system must insure achieving economic growth combined with both social justice and environmental concerns. Reacting to this definition, many writing have investigated the specific objectives and features of sustainable transport and tried to break down the complexity of the triple bottom life. Gudmundsson and Hojer (1996) and Black (2000) explained the economic theme of sustainable transport, while Lautso and Toivanen (1999), Gilbert and Tanguay (2000), and Marsden and Bonall (2006) focused on the environmental concerns of sustainable transport. In addition May et al, (2001), and Castillo and Pitfield (2010) investigated the social attributes of the concept. However, even with the agreement of the triple bottom life concept, every individual and group address specific objectives of sustainable transport according to the role it plays in their context (Richardson, 2005). 3 SUSTAINABLE TRANSPORT OBJECTIVES Policy makers introduced the term of sustainable transport in order to evaluate, measure and assess the positive and negative impact from traffic and transport as they are apparent now or in the near future (Gudmundsson, 2001). While, stakeholdersand operators used the term in order to achieve the policy objectives and monitor energy usage, consumption, CO 2 emissions and any harmful substances (Steg and Gifford, 2005). Due to the lack of any widely accepted definitions of sustainable transport even with the agreement on the triple bottom life concept there was an increasing concern to define the concept by proposing the targeted objectives of this term (Castillo and Pitfield, 2010). Gudmundsson and Hojer (1996), OECD (1997), Lautso and Toivanen (1999), Gilbert and Tanguay (2000), Black (2000), and Shiftan et al, (2003) introduced sets of different objectives which have been illustrated in Table 1. However, May et al, (2001) introduced all these objectives under an umbrella project titled as the PROSPECT project. This project identified five main objectives of sustainable transport system as: liveable streets and neighbourhoods, protection of the environment, equity and social inclusion, health and safety, and support of vibrant and efficient economy. Till now some writing argued that the objectives of sustainable transport systems are still wide ranging and varying within the context, time, locality, and public awareness (Abolina and Zilans, 2002). Table 1. Sustainable transport objectives Source Gudmundsson and Hojer 1996 OECD 1997 DETR 1998 Lautso and Toivanen 1999 Black 2000 Gilbert and Tanguay 2000 May et al, 2001 Shiftan et al, 2003 Marsden and Bonall, 2006 Castillo and Pitfield, 2010 Objectives - Maintain natural resource base - Define usage levels and usage patterns - Maintains the productive capital base for future generations - Improves the quality of life - Integrates land use and transport planning - Minimises resource usage - Contributes to social equity - Supports economic growth - Maximises health and safety - Reduce pollution from transport - Improve air quality - Encourage healthy life style by reducing reliance on car - More cycle and walking schemes - Reduce noise and vibration from transport - Reduces congestion - Minimises consumption of natural resources - Reduces pollution - Maintains health and safety - Reduces air pollution - Meets mobility needs - Minimises accident - Minimises noise - Limits waste within defined targets. - Minimises usage of non-renewable resources - Maximise the usage of recycling materials. - Minimises land usage. - Maintains ecosystem and general health - Meets individuals and society basic needs - Consistent with human health - Availability of all transport modes - Provides access to all services - Ensures that mobility needs are met safely - Supports economy - Liveable streets and neighbourhoods - Protection of the environment - Equity and social inclusion - Health and safety - Support of vibrant and efficient economy - Reduces energy consumption - Minimise air pollution. - Protects wildlife and natural habitats - Improves accessibility to employment, social activities, etc - Maximises the availability of public transport to population - Decreases road transport accidents - Improve air quality by meeting Improve air quality by meeting UK national air quality strategy objectives for carbon monoxide, lead, nitrogen dioxide, particles, sulphur, benzene and 1-3 butadienes - Reduce noise and vibration - Triple the number of cycling trips compared with a 2000 base - Liveable streets and neighbourhoods - Protection of the environment from transport pollution - Social equity and social activities inclusion - Maximises Health and safety - Support economic growth Page 2 of 10
91 4 SUSTAINABLE TRANSPORT INDICATORS In order to monitor and assess the performance of any sustainable transport system, define indicators for each objective is an essential task. Reacting to this, indicators have been generated in many contexts (May et al, 2008). Although these indicators give the ability to capture the multidimensionality of the system and break it down into manageable items, it is still challengeable to identify and use these indicators for two main reasons; first, the numerous existing indicators of sustainable transport and the vast subsets it contains. Second, the indicators give only partial analysis to the whole system and coherent correlation between all indicators must be achieved in order to understand the whole picture (Castillo and Pitfield, 2010). However, Castillo and Pitfield (2010) identified on the ELASTIC framework initial list of 233 indicators of sustainable transport system based on nine sources illustrated in Table 2. In addition, an evaluation and pair wise comparison of these indicators have been carried out using the ELASTIC framework. Castillo and Pitfield (2010) used the same five objectives of sustainable transport system identified in the PROSPECTS project. This framework evaluated the sustainable transport indicators form both academic and planners perspectives. In which a short list of 20 indicators of sustainable transport in the UK context have been introduced and ranked which are illustrated in Table 3. However, both policy makers and stakeholders need to understand how consumers perceive and evaluate these indicators. Attitude towards transport is an important determinant for evaluating the system (Beirao et al, 2007). From the service providers perspective it is essential to identify the most important attributes of service quality that are perceived by current and potential users. However, the specification of a set of relevant attributes is a challengeable task and it is important to identify their relative weight and influences on users satisfaction (Prioni and Hensher, 2000). Yet it remains a challenging and important research area (Hensher et al, 2003). It is important to understand the different user evaluation for the same service, and to define the influence on their satisfaction by each element (Andreassen, 1995; Jensen, 1999; Anable, 2005). Table 2. Initial list of sustainable transport indicators (Castillo and Pitfield, 2010) Source Indicators - Modelling for sustainable cities: the transport sector (Kupiszewska, 1997) 32 - Indicators for the integration of environmental concerns into transport 27 policies (OECD, 1999) - Indicators of transport and environment integration TERM 2002 (European 38 Environmental Agency, 2002) - Sustainable Transport Indicator Project, CST (Gilbert et al., 2002) 14 - The Civilising Cities initiative (Jones et al., 2003) 15 - PROSPECTS project s methodological guidebook (Minken et al., 2003) 19 - Securing the future (Department for Environment, Food and Rural Affairs, ) - Local quality of life counts (Department of the Environment, Transport and the 12 Regions, 2000) - How to monitor indicators in Local Transport Plans and Annual Progress Reports 2005 Update (Department for 8 Transport, 2005) Total numbers of indicators 233 Table 3. Ranking for the preliminary 20 best performing indicators (Castillo and Pitfield, 2010) Rank Indicator 1 Motorised traffic volume 2 Number of cycling trips 3 Vulnerable road user accidents 4 Local air pollutants 5 Modal share of public transport 6 Social/External cost of transport 7 Quality of public transport 8 Availability of key services locally Total number of killed or seriously injured (in 9 road accidents) 10 CO2 emissions from transport Public awareness of transport sustainability 11 issues 12 Percentage of freight transported by road 13 Length of cycling and walking paths 14 Access to public transport Percent of population affected by high traffic 15 noise levels Energy consumption by the road transport 16 sector Number of crimes committed on or while 17 waiting for public transport 18 Total number of road motor vehicles 19 Transport related wastes 20 Public participation in transport planning Page 3 of 10
92 5 EVALUATION CRITERIA As it mentioned before, user perception and attitudes are an essential principle of the success of sustainability. It is important for those who affected by the concept end-users as it important for those who can affect sustainable decisions (Castillo and Pitfield, 2010). However, in order to address the end users attitudes, a numeric weight of important are required for each indicators by using multi-criteria decision analysis applications (MCDA). Although there are numerous of MCDA techniques used in different contexts, many writing argued the accuracy of these techniques (Ball and Srinivasan, 1994; Castillo and Pitfield, 2010). However, one MCDA technique the analytic hirarichy process (AHP) devised by (Saaty, 1980) overcomes these problems. The AHP attempts to resolve conflicts through a process of determining the relative importance of a set of activities or criteria. The major difference between the AHP and other MCDM is that the AHP enables the systematic structuring of any complex multiplayer, multidimensional problem (Ball and Srinivasan, 1994). 5.1 AHP chart The AHP chart is structured in two main levels; the first level is divided into five objectives based on the PROSPECTS project by (May et al, 2001) as; liveable streets and neighbourhoods, protection of the environment, equity and social inclusion, health and safety, and efficient economics. While the second level of the AHP chart contains the top 20 indicators of sustainable transport in the UK context. Those indicators have been introduced in the ELASTIC framework by Castillo and Pitfield (2010). AHP is constructed in Figure 1. In which each objective have a set of four different indicators. However, in order to evaluate the users perception and attitudes towards sustainable transport indicators, this paper has used a questionnaire-based survey in different locations city centre, periphery, and rural areas for Belfast. This survey aims to; first, identifies the most desirable objectives of sustainable transport defined by users. Second, it defines a hierarchy evaluation for all sustainable transport indicators from users perspectives in different contexts. The participants were selected randomly in the mentioned above locations. The data collected in the survey have been prossessed by using Microsoft Excel. First, all respondentes have been inputed in an excelsheet, then both arithemtic and geometric means have been calculated. Second, all geometric means have been normalised and used for the AHP final equations. Finally, AHP calculation have been generated using a custom formated sheet on Excel. Finally, the local and global means have been intoruced and analysed in the follwoing sections. Evaluation criteria Liveable neighbourhoods - Motorised traffic volume - Quality of public transport - Total number of road motor vehicles - Public participation on transport planning Protection of the environment - Local air pollution - CO2 emission from transport - Transport related waste - Public awareness on environmental issues Equity and social inclusion - Social cost of transport - Access to public transport - Length of cycling and walking paths - Number of cycling trips Health and safety - Vulnerable road user accidents - Total number of road accidents - Number of crimes committed on or while waiting for public transport - Percent of pollution of high noise levels Efficient economic - Availability of key service locally - Modal share of public transport - Percentage of freight transported by road - Energy consumption by road transport modes Figure 1. AHP chart Page 4 of 10
93 In order to assess the overall sustainability in the transport system, Which of these objectives would you think more important Liveable neighbourho ods Protection of the environme nt Figure 2. Objective pair wise comparison Table 4. AHP Standard scoring method (Saaty, 1996) Intensity of Definition Importance 1 Equal importance ,4,6,8 Slightly more importance of one over the other Moderate importance of one over the other Strong importance of one over the other Absolute importance of one over the other Intermediate values between the two adjacent judgements 5.2 Survey 1, objectives weighting The first survey was conducted by printed questionnaire distributed for both public transport and car users in different areas in Belfast city (city centre, periphery, and rural). In order to validate the data for AHP application, the participant were asked to make pair wise comparison for sustainable transport objectives based on AHP Standard scoring scale which is shown in Table 4. An example of the distributed questionnaire used for the first survey is illustrated in Figure Survey 2, indicators weighting The second survey was conducted by the same methods as the first one. The participants were asked to compare between five sets of sustainable transport indicators. Each set (evaluation criteria) contains a group of four indicators illustrated in the AHP chart in which pair wise comparisons between these four indicators were generated. This process has been used for all the five sets in order to identify the weighting of each indicator. An example of the distributed questionnaire used for the second survey is illustrated in Figure 3. 6 RESULTS In the survey 100 questionnaires have been distributed during July 2010 (50 city centre & inner ring, 25 periphery areas, 25 rural areas) only 70 have responded and 54 questionnaires are valid and used in the AHP model (25 city centre & inner ring, 18 periphery areas, 11 rural areas). The survey have ensured a balance of public transport users and car users, taking into account a mix of ages from 25 to 75 and a balance between male and female participants. All respondents categories are illustrated in Table 5. Table 5. Respondents categories Public transport Age Car user user Total Group Male Female Male Female Total Evaluation criteria weighting The results from the first questionnaire indicates that liveable streets and neighbourhoods are the most important criteria from the people perspectives with the global means of out of 1, following by protection of the environment (0.23), health and safety (0.1937), equity and social inclusion (0.1658), and support of vibrant and efficient economy (0.0781) with the consistency ration (CR) of (0.056). All results from the first survey are illustrated in Figure 4. In order to assess the overall sustainability in the transport system, Which of these indicators would you think more important Liveable neighbourhoods Motorised traffic volume Motorised traffic volume Motorised traffic volume Quality of public transport Quality of public transport Total number of road motor vehicles Quality of public transport Total number of road motor vehicles Public participation on transport planning Total number of road motor vehicles Public participation on transport planning Public participation on transport planning Figure 3. Indicators pair wise comparison Page 5 of 10
94 6.2 Sustainable transport indicators weighting From the second survey, the results show that quality of public transport (global means = ) perceived as the most important indictor in the first group of liveable streets and neighbourhoods. While, local air pollution (0.4675), social cost of transport (0.4088), vulnerable road user accidents (0.4358), and availability of key services locally (0.5232) are the most important indicators of sustainable transport, each in protection of the environment, equity and social inclusion, health and safety, and support of vibrant and efficient economy groups in order. All second survey results are illustrated in Figures 5, 6, 7, 8, and 9. Public awareness on environmental issues Transport related waste CO2 emission from transport Local air pollution Figure 6. Protection of the environment CR= Number of cycling trips Length of cycling and walking paths Efficient economic Access to public transport Health and safety Equity and social inclusion Social cost of transport Figure 7. Equity and social inclusion CR= Protection of the environment Percent of pollution of high noise levels Liveable streets and neighbourhoods Number of crimes committed on or while waiting for public transport Figure 4. Evaluation criteria results CR=0.056 Total number of road accidents Vulnerable road user accidents Total number of road motor vehicles Figure 8. Health and safety CR= Public participation on transport planning Quality of public transport Motorised traffic volume Figure 5. Liveable streets and neighbourhoods CR= Energy consumption by road transport modes Percentage of freight transported by road Modal share of public transport Availability of key service locally Figure 9. Efficient economic CR= Page 6 of 10
95 However, the weighting of all sustainable transport indicators shows that quality of public transport is the most important indicator for sustainable transport system from the users perspectives with the absolute weight of ( out of 1), followed by local air pollution (0.1101) and motorised traffic volume (0.1063). While, energy consumption by road transport modes have been evaluated as the less important indicator in the sustainable transport system from the users perspectives with absolute weight of (0.0090), which came slightly after percentage of freight transported by road (0.0106). The absolute weightings of sustainable transport indicators from user perspective are illustrated in Figure 10. Meanwhile, the comparison between users perception and stakeholders which illustrated in Table 6 shows that both users, academic, and planners sharing some priorities such as; motorised traffic volume, local air pollutants, and quality of public transport as the most important indicators sustainable transport systems. Meanwhile there was a variation in some indicators such as; number of cycling trips, modal share of public transport, and public participation in transport planning. Table 6. Sustainable transport ranking users perception & stock holder perception Stakeholders Indicator Users 1 Motorised traffic volume 3 2 Number of cycling trips 18 3 Vulnerable road user accidents 4 4 Local air pollutants 2 5 Modal share of public transport 17 6 Social/External cost of transport 6 7 Quality of public transport 1 8 Availability of key services locally 11 9 Total number of killed or seriously injured (in road 12 accidents) 10 CO2 emissions from transport 5 11 Public awareness of transport sustainability 14 issues 12 Percentage of freight transported by road Length of cycling and walking paths Access to public transport 7 15 Percent of population affected by high traffic 16 noise levels 16 Energy consumption by the road transport sector Number of crimes committed on or while waiting for public 12 transport 18 Total number of road motor vehicles Transport related wastes Public participation in transport planning 9 Page 7 of 10
96 1. Quality of public transport 2. Local air pollution 3. Motorised traffic volume 4. Vulnerable road user accidents 5. CO2 emission from transport 6. Social cost of transport 7. Access to public transport 8. Total number of road accidents 9. Public participation on transport planning 10. Total number of road motor vehicles 11. Availability of key service locally 12. Number of crimes committed on or while waiting for public transport 13. Transport related waste 14. Public awareness on environmental issues 15. Length of cycling and walking paths 16. Percent of pollution of high noise levels 17. Modal share of public transport 18. Number of cycling trips 19. Percentage of freight transported by road 20. Energy consumption by road transport modes Figure 10. Sustainable transport indicators "Absolute Weighting" 7 CONCLUSION Sustainability and its assessment in the context of transport is a challengeable process which incorporates many principles and participants. The key factor inside this process is to achieve the balance between policy makers priorities, stakeholders capabilities, and consumers perceptions. The output and the success of sustainability in almost any context is highly depending on correlation between those three participants. This paper addressed the users perceptions and attitudes towards a sustainable transport system in Belfast. The paper provided a broader context in which both policy makers and stakeholders can visualise the whole picture of sustainable transport from different perspectives. However, it may be argued that quality of public transport is the key factor of sustainable transport chain, but with the massive effect and the multidimensionality of the public transport on the triple bottom life concept environment, economic, and social it is unsurprising to be perceived as the key factor of the sustainable transport form users perceptions. ACKNOWLEDGMENT The authors gratefully acknowledge the University of Ulster for its supports in all the aspects related to this study. REFERENCES Abolina, K., Zilans, A., Evaluation of urban sustainability in specific sectors in Latvia. Environment, Development and Sustainability, Vol. (4), , 2002 Anable, J., Complacent car addicts or aspiring environmentalists? Identifying travel behaviour segments using attitude theory, Transport Policy, No. 12, Vol. (1), 65 78, 2005 Andreassen, T.W., Dissatisfaction with public services: the case of public transportation, Journal of Services Marketing, No. 9, Vol. (5), 30 41, 1995 Ball, J., Srinivasan, V. C., Using the analytic hierarchy process in house selection, Journal of Real Estate Finance and Economics, Vol. (9), 69-85, 1994 Beirao.G & Cabral.J.A, Understanding attitudes towards public transport and private car: A qualitative study, Transport Policy, Vol. (14), , 2007 Page 8 of 10
97 Black, W.R., Socio-economic barriers to sustainable transport, Journal of Transport Geography, Vol. (8), , 2000 Black, W.R., Sustainable transportation: a US perspective, Journal of Transport Geography, Vol. (4), , 1996 Castillo, H., Pitfield, D., ELASTIC A methodological framework for identifying and selecting sustainable transport indicators, Transportation Research Part D, Vol.(15), , 2010 Department for Transport (DfT), The future of transport: A network for 2030, Cm 6234, London: The Stationery Office, 2004a Department of the Environment (DoE), Transport and the Regions (DETR), Transport 2010: The 10 Year Plan, DETR, London, 2000a Department of the Environment, Transport and the Regions (DETR), A New Deal for Transport: Better for Everyone, London: TSO, 1998 Gilbert, R., Tanguay, H., Sustainable transportation performance indicators project. Brief review of some relevant worldwide activity and development of an initial long list of indicators, The Centre for Sustainable Transportation, Toronto, Ontario, Canada, 2000 Gudmundsson, H., Hojer, M., Sustainable development principles and their implications for transport, Ecological Economics, Vol. (19), , 1996 Gudmundsson, H., Indicators and performance measures for transportation, environment and sustainability in North America (Research Notes No. 148), Roskilde, Denmark: Ministry of Environment and Energy, National Environmental Research Institute, 2001 Hensher, D.A., Stopher, P., Bullock, P., Service quality developing a service quality index in the provision of commercial bus contracts, Transportation Research Part A, No. 37, Vol.(6), , 2003 Hull, A., Integrated transport planning in the UK: from concept to reality, Journal of transport geography, Vol.(13), , 2005 Jensen, M., Passion and heart in transport a sociological analysis on transport behaviour, Transport Policy, No. 6, Vol. (1), 19 33, 1999 Lautso, K., Toivanen, S., SPARTACUS system for analysing urban sustainability, Transportation Research Record 1670, 35 46, 1999 Litman, T., Sustainable transportation indicators. Victoria Transport Policy Institute, Victoria, BC, Canada, 2003 Loo, B.P.Y., Role of stated preference methods in planning for sustainable urban transportation: state of practice and future prospects, Journal of the Urban Planning and Development 128, Vol. (4), , 2002 Mahmoud, M., Yousef, K., Developing Street Network in Gharb El Balad District: Towards Sustainable Transport, The 1st Technology and sustainability in the built environment conference, College of Architecture and Planning, King Saud University, KSA, , 2010 Marsden, G., Bonsall, P., Performance targets in transport policy, Transport policy, Vol. (13), , 2006 May, A.D., Jarvi-Nykanen, T., Minken, H., Ramjerdi, F., Matthews, B., Monzon, A., Cities Decision-making Requirements; PROSPECTS Deliverable 1, Institute of Transport Studies, University of Leeds, Leeds, 2001 May, A.D., Kelly, C. and Shepherd, S., The principles of integration in urban transport strategies, Transport Policy, vol. (13), , 2006 May, A.D., Page, M., Hull, A., Developing a set of decision-support tools for sustainable urban transport in the UK, Transport Policy, Vol. (15), , 2008 Nicolas, J.P., Pochet, P., Poimboeuf, H., Towards sustainable mobility indicators: application to the Lyons conurbation, Transport Policy, Vol. (10), , 2003 OECD, Towards Sustainable Transportation, OECD Publications, Paris, 1996 Prioni, P., Hensher, D.A., Measuring service quality in scheduled bus services, Journal of Public Transportation, No. 3, Vol. (2), 51 74, 2000 Richardson, B.C., Sustainable transport: analysis frameworks, Journal of Transport Geography, Vol. (13), 29 39, 2005 Santos, G., et al., Part II: Policy instruments for sustainable road transport, Research in Transportation Economics, Elsevier, 1-44, 2010 Saaty, T. L. The Analytic Network Process - Decision Making with Dependence Feedback, RWS Publications, Pittsburgh, PA, 1996 Page 9 of 10
98 Shiftan, Y., Kaplan, S., Hakkert, S., Scenario building as a tool for planning a sustainable transportation system, Transportation Research D, Vol. (8), , 2003 Steg, L., Gifford, R., Sustainable transportation and quality of life, Journal of Transport Geography, Vol. (13), 59 69, 2005 The World Bank, Sustainable Transport: Priorities for Policy, Reform, The International Bank for Reconstruction and Development, The World Bank, Washington, DC, World Commission on Environment and Development (WCED), Our common future, Oxford University Press, Oxford, 1987 Page 10 of 10
99 IRISH TRANSPORT POLICY AND SUSTAINABILITY: DELIVERING A GREENER TRANSPORT NETWORK? A. Hamilton 1 2 and Dr. A. Ahern 1. School of Architecture, Landscape and Civil Engineering, University College Dublin; olenkhamilton@hotmail.com 2. School of Architecture, Landscape and Civil Engineering, University College Dublin; aoife.ahern@ucd.ie ABSTRACT The challenge facing policy makers today is to develop sustainable transport policies, whilst maintaining the balance between environmental and economic issues (Banister et al, 2000). The use of private motor vehicles for journeys such as commuting to work must be examined when creating solutions to decrease C02 emissions in-line with the Kyoto Protocol. Private motor vehicle ownership has risen by 146.2% over the twenty-year period from 1986 to 2006, which directly co-relates with the increase of 148.4% in number of motor vehicles used in the commute to work (Central Statistics Office, 2006). This paper investigates reasons behind this increase, suggesting that failure by Irish governments over the last four decades to give sufficient importance to transport policy led to a lack of cohesion between government departments and agencies as to the responsibility for transport issues (Meldon, 1991, Department of Communications, 1985). This paper also looks at commuters attitudes towards modal choice, transport policy, planning and infrastructure by analysing data gained through interviews carried out with commuters who travel by privately owned motor vehicles. The paper will conclude by looking at current Irish transport policy to examine whether policy makers are answering these challenges of achieving a sustainable transport system for the future. Keywords: Transport Policy, Private car-use, Sustainability 1 INTRODUCTION: THE NEED FOR CHANGE One of the great challenges facing policymakers at the start of the 21 st century is to reconcile the different priorities between economic development and environment, whilst at the same time recognising the different social priorities and the distributional consequences of decisions. Transport offers us the best example of the complexity of these choices. (P.1, European Transport Policy and Sustainable Mobility, David Banister et al, 2000) International public awareness of global warming is increasing, leading to pressure on governments to guide the way towards sustainability. Targets for the reduction of carbon dioxide emissions set during the 1992 United Nations Conference on Environment and Development in Rio de Janeiro, as well as the ratification of the Kyoto Protocol have turned this awareness into an acceptance that a change is required. It is understood that transportation is the largest end-use of energy in developed countries and the fastest growing one in most developing countries (United Nations, 2009). Transport also contributes to noise and air pollution, congestion and health issues. In Ireland the transport sector accounts for 43% of final energy demand, creating 36% of energy related C02 emissions (Howley et al, 2009). Reducing the need to travel by improving development patterns through planning and landuse policies, encouraging alternatives to private motorised travel by favouring high-occupancy public transport modes, and efficiently and well maintained transport infrastructure are all advised. Banister et al (2000) states that, as the developed world s largest population centre, Europe is in a unique position, and can lead the way in developing and promoting sustainable transport policies. European countries must work together in forming transport policies, as the Kyoto targets set are an average for fifteen EU countries. The United Nations Framework Convention on Climate Change (UNFCCC) affirms that emission level targets are set at 8% overall reduction of greenhouse gases for the EU15 (members of the EU in 1990) along with Page 1 of 13
100 demand, as the frequently used predict and provide policies implemented tried to achieve, will not improve the mounting congestion problems, as more roads will be filled by the increasing volumes of vehicles (Vigar, 2002, Bradley, 1991). Bradley states that what is therefore needed is a sustainable transportation policy which puts protections of the urban environment (both physical and biological) as its goal and not simply relieving congestion. Bulgaria, Czech Republic, Estonia, Latvia, Lithuania, Romania, Slovakia, Slovenia (member states since 2004 or 2007), Liechtenstein, Monaco, and Switzerland (non EU member states) (United Nations Framework Convention on Climate Change). The target levels set for Ireland limits emission growth to 13% above 1990 levels. Currently Ireland is at 23% above these base levels, although targets are expected to be met due to the purchase of credits from other EU countries (EPA, 2010). 2 PAST TRANSPORT POLICIES Current European transport trends are recognised as being unsustainable (Banister et al, 2000). Bradley (1991) examines the fact that even though fuel efficiency and emissions reduction has improved, the consumption of fuel is being counter balanced by escalating traffic volumes. Policy makers in the transport sector must now deal with these issues, while still providing solutions to mobility problems and travel needs. The impact of transport on the environment and ecological conditions is a relatively new phenomenon. Even so, it is now widely documented (Vigar, 2002, Banister et al, 2000, Whitelegg, 1993), and will not be discussed in great detail in this paper. It is suffice to say that, in terms of resources used, travel by private vehicle is considered to be more damaging to the environment than any other mode. Society has become dependent on cars to travel for work, leisure, shopping and socialising, with the car becoming an essential tool in every day life (Wickham, 2004). The need for more resourceful transport systems is, therefore, vital for access to the work place, places of education and other basic services. It is this that has led to an increase in pressure for policy changes within the transport sector. In the past, policies have tended to be divided, solving one problem at a time, such as providing local solutions to bottlenecks, rather than focussing on the transport system as a whole across regions, sectors and modes (Banister et al, 2000). It is this Just-In-Time practice that has led to countries not looking at the transport system as a single, important entity. It is thought that this type of trendbased analysis does nothing to mitigate the steady increase in travel. Therefore, simply increasing road capacity to match the increase in forecasted Page 2 of 13 Ridley (1991) and Barrett (1990) both discuss that the predict and provide approach used by governments has seen policy aimed at mobility rather than accessibility, the answer usually being to build more roads to cope with the increasing number of privately owned motor vehicles. Instead, it is advised that attitudes to transport must be reassessed and that demand management will become more relevant in policy decisions. Barrett (1990) suggests that it is better to maximize the existing road space by proper management and coordination, as an investment approach has dominated a management approach to solving congestion. The relation between land-use and transport should be treated more significantly, as the level of travel demand can be greatly affected by better control of land-use. O Connell (1991) also discusses this issue, citing the EC Green Paper on the Urban Environment (1990), which states that transportation decisions are taken in an ad-hoc response to demand and are in no way related to any long term strategy to landuse planning or environmental concerns. The Green Paper recommends that cities stop land-use zoning and instead create mixed areas, therefore reducing demand for travel between amenities. However, O Connell argues that due to the well-established land structure found in Dublin, this type of policy on land-use would offer little solution. Instead, the answer may be to redistribute modal balance by encouraging a shift from private car to public transport. 3 WHY IS CONGESTION SO BAD? The phenomenon of urban sprawl has been talked about by many over the last twenty to thirty-years in relation to transport problems (Banister et al, 2000, Bradley, 1991, Department of Communications, 1985). Though every city is unique, The Department of Communications (1985) suggested that traffic problems are common in
101 privately owned vehicles and attitudes towards modal change to more sustainable modes of travel. nature, with the growth of population tending to disperse outwards. Banister et al (2000) discusses the fact that cities have become fragmented, with the development of large, low-density suburbs, leading to an increase in journey distance and length between home and work, schools, hospitals, shops and relatives and friends, the affect of which is most acute at peak commuting hours. It was suggested back as far as the mid-eighties that commuting from suburbs tends to be cars based due to the lack of public transport alternatives (Department of Communications, 1985). It is believed that to help reduce the amount of private cars on the road, the need for travel must be reduced. Banister et al (2000) and Bradley (1991) both suggest that transport and land-use policies must be linked to help reduce the spatial division that has occurred, with the development of new road plans being in accordance with land-use plans. This sub-urbanisation has led to the need for combined transport, land-use and environmental policies. The lack of integration in Ireland is discussed by Meldon (1991). Two main reports, commonly known as the Myles Wright Report (1967) on landuse strategy and the Dublin Transportation Study (1971) on transportation planning dominated the period up until Myles Wright recommended a new settlement strategy for the Dublin area, with the development of four new towns, Tallaght, Clondalkin, Lucan and Blanchardstown, each being self sufficient with employment facilities, education centres and other amenities, the aim of which was to ease traffic congestion in the city centre. A good road network was planned, linking each town centre, with significant public transport networks. However, the reality was somewhat different; Myles Wright s hope for self-sufficient towns fell apart due to shops, schools, college and hospital all coming after the construction of residential areas. The fast population growth in these areas led to mass commuting, while the recommendations made by the Dublin Transportation Study still appear on each successive development plan as either 5-year or longer term objectives (Meldon, 1991). This gives a clear example of the gap between planning and reality. This researcher carried out a travel survey and in-depth interviews with employees working in the Blanchardstown area, one of the above named newly developed towns, in order to ascertain reasons behind commuting to work by Page 3 of 13 It is not only urban sprawl that has contributed to the increase in traffic congestion. Perry (1991) and O Connell (1991) both discuss the attractiveness of independent travel; cheap, direct, comfortable and fast. The private car still remains a macho image, being an essential element of material display and comparison (O Connell, 1991). This attitude towards the private car must be examined, and alternatives that are just as attractive must be found and supplied. Irelands economic success has also attributed as a factor in the increasing volumes of the private car (McKinsey International Inc., 1980). However, despite Ireland s new found wealth, the 1987 European Conference of Ministers of Transport (ECMT) claimed that Ireland had spent the lowest GDP share on transport infrastructure; only 0.6% compared to the European average of 1.5% (Barrett, 1990). 4 THE DIFFICULTIES FACING POLICY MAKERS. Vigar (2002) discusses the difficult choices local and national governments face in making transport policy decisions, due to the inter relationships between movement, economic growth and social justice. The need for a change in transport policy across Europe has been discussed for some time (Masser et al, 1992, as cited in Vigar, 2002). Banister et al (2000) claim that even though it is now widely accepted that current transport trends in Europe are unsustainable, there is little being done to put in place policy changes that will actually rectify these issues. However, it is also suggested that transport policy-makers are in a difficult situation, due to having to satisfy both environmental and economic issues. Another problem facing policy makers is the reality that democratic governments do not like to implement measures that are unpopular with voters, as discussed by Bansiter et al (2000) and Vigar (2002). Transport policy is socially constructed in that what constitutes a problem, and the means used to address that problem, is a matter of political judgement (Vigar, 2002). This leads to many policies sitting on shelves, waiting for public opinion and attitudes to change before they can be successfully implemented. For the policies to be successful, the development and implementation requires consultation and co-operation from the
102 actual individuals, organisations and communities 1980). It found that, even then, the car was the who will be asked to change their attitudes and dominant mode of transport, leaving the growth of behavioural patterns (). For this reason, it was public transport use static. The policy issues considered important for this research that suggested were aimed towards increasing public employees who drove to work by car were asked transport use, by investment in rail facilities, during in-depth interviews what action would regulation of traffic and parking, an increase in encourage them to change to a more sustainable other traffic management issues such as priority bus mode of travel. lanes, particularly in the Dublin region, and subsidising public transport. 5 TRANSPORT POLICY IN IRELAND In Ireland there is a belief that the transport sector has been left stranded between state Departments and government agencies, and transport policy and investment has been neglected (National Economic Social Council, 1978, Department of Communications, 1985, Perry, 1991). It was not until recently that the Irish Government viewed transport as crucial, giving sole responsibility for all transport issues to one State Department, establishing the Department of Transport (DoT) in However, it was only in August 2007 that the Department of Environment, Heritage and Local Government (DoEHLG) handed over certain financial roles to the DoT for such areas as annual resurfacing budgets for local authorities. This was despite the fact that back as far as 1980, this had been recommended in a report on Irish transport policy, commissioned by the National Economic and Social Council (NESC). In this report it was made clear that the need for a comprehensive transport policy was of great importance. The study advised that the transport problem in Ireland is no longer one of information, so much as of decisive action (NESC, 1980). The main issues raised in this report were organisational, such as the need for a State Department with sole accountability for transport issues, to replace the then current situation where transport was divided between the Department of Environment and the Department of Tourism and Transport. Also suggested was the need for a Transport Authority for the Greater Dublin Area, to supersede the State Departments, five Local Authorities and the state sponsored bodies such as Coras Iompair Eireann (CIE), who all had responsibility for particular sections of transport within the region. This report went on to state that one of the main objectives of transport policy should be to make transport as widely available as possible (NESC, Page 4 of 13 This echoed the advisory report by An Foras Forbatha (1971), who almost 10-years earlier had warned that major decisions regarding transportation and the future of Dublin should be made as a matter of urgency. This report found that, for example, the increase in motor vehicles since 1900 had not been mirrored by changes in infrastructure, as shown by the fact that there was not one new crossing of the River Liffey, and very few changes in the canal crossings. Again, recommendations were made in an effort to help reduce car use in the ever-growing congested streets of Dublin, including high-speed bus routes and an underground system linking the rail networks. The Dublin Transportation Study Final Report (Steer Davies Gleave, 1991) found that the reason behind the failure to implement any recommendation made by the numerous major transport studies in Ireland between 1971 and 1980 as discussed above, is that not one of these reports were adopted as Government Policy. Indeed, Michael Walsh discussed during his conference reflections at the 1991 Transport in Dublin: Policy and Practice, that transport conferences in Dublin gave a sense of de ja vu ; that is the same speakers, talking about the same issues, whilst the same problems persist, with no real urgency to act to solve them. 6 CURRENT TRANSPORT TRENDS IN IRELAND The concern for the environmental impacts of transport relates to the volume of motor vehicle use. The growth in the use of the private car, and subsequent decrease in public transport use must be looked at when coming up with solutions to reduce carbon dioxide emissions. A Department of Communications Green Paper on Transport Policy (1985) stated that road transport was the predominant mode of transport in Ireland. The
103 Green Paper also advised that every person in achieved by facilitating access to alternative modes Ireland has transport needs of one kind or another, of transport, as well as reducing the need for travel and due to the ever changing nature of this transport at all. demand, the supply of transport should adjust accordingly in order to adequately meet the needs of the travelling public. 7 CURRENT IRISH TRANSPORT POLICY The most recent available statistics are from 2006 and 2007, and are taken from Ireland North and South: A Statistical Profile, 2008 Edition (NISRA & CSO, 2008), Transport 2008 (CSO, 2009a) and the Statistical Yearbook of Ireland, 2009 (CSO, 2009b). In the ten years from 1997 to 2007, car ownership in Ireland grew by 66.0%, from 1.13million to 1.88million cars registered. The use of private car as a mode of transport to travel to work has increased dramatically, leading to extremely high levels of congestion. The statistics indicate that, in 2006, the peak period traffic is being affected by 71.08% of the million Irish work-force that travel to and from work by privately owned vehicles, including motorcycles, lorry s and vans. The statistics also show that people are now living further from their place of work. The distance travelled to work within the state in 2006 was 15.19km, whilst in Dublin County and city the travel distance was only 10.81km. However, the average time taken to travel to work in the state was 29.6 minutes, whilst in Dublin it was 34.6 minutes. This shows that, even though the average commuter distance in Dublin is 28.8% less than the average national commuter distance, the time taken to travel this distance is 17.0% higher than the average national commuter time. The Dublin area has been described as a city in crisis (Steer Davies Gleave, 1991), and it can be suggested that one of the reasons for this is the lack of infrastructure Dublin has had in the past. These statistics show that there is a distinct need for the Irish government to react quickly and efficiently to help reduce the amount of privately owned cars on the roads. It is also clear that there are a large number of people travelling to work in privately owned vehicles, which must be reduced by providing alternatives and encouraging adults to use these different modes of transportation. It is these changes that has now made it vital that transport policies are designed and implemented to contribute to sustainable development by not only slowing down this growth, but by reversing it. This can be Page 5 of 13 The Statement of Strategy (Department of Transport, 2005a) stated that these aims would be achieved by integrating land-use and transport policies. This statement was the first half of a 5- year, 10.2 billion investment plan from aimed at the effective delivery of transport policies. It acknowledges the fact that investment in transport infrastructure requires long lead in times for planning, design and consultation. The mission statement was developed from the mandate given in the Agreed Programme for Government, which is to implement an integrated transport policy'. It was clearly stated from the outset that the government once again recognised the problem areas, but also seemed set on solving them. The strategy was split into five high level goals, each with their own guiding principles, describing the way in which each goal will be achieved. Of importance to this paper is the goal of integration, the aim of which is to ensure an integrated approach to the development and delivery of transport policy covering all modes of transport and underpinning the development of an integrated transport system and by integration of transport policies with other Government policies, particularly sustainable development. As already mentioned, the goal of integration is of prime importance to this paper. The aim of the Irish Government is to allow people the option of moving seamlessly from mode to mode, and to enhance the overall attractiveness of the network to the end-user. This is to be achieved by integrating fares, ticketing, timetables and general information. Also, as mentioned above, in order to reduce the number of private car use to and from work, there is a need to encourage modal shift to tackle congestion. A mix of transport policies is needed to help alleviate the impacts of congestion. The Department of Transport has recognised that it must work along with other relevant sectors and Government Departments to develop a coherent policy framework to address all modes and underpin the development of an integrated transport system, as well as integrating transport policies with other Government policies,
104 period, the aim of which is to reverse current unsustainable transport and travel patterns (Department of Transport, 2009). In this document, An Taoiseach Brian Cowan states that it is not only infrastructure that must be improved, but also mindsets, in order that our institutions and individual citizens realise the benefits from altering their travel behaviour. There appears to be a realisation that public consultation is necessary and that a change in personal behaviour is necessary in helping to achieve a sustainable transport system by However, the aims set out in this document mirror those as stated in Transport 21 and the Statement of Strategy , verifying the sense of de ja vu discussed by Michael Walsh in In spite of this, this researcher believes that with more public consultation, which has now been prioritised by the government, this may now allow for more successful design and implementation of these transport policies. particularly sustainable development and spatial and land-use policies. The Statement of Strategy outlines strategies and outputs for achieving the objective of integration and sustainability. 8 TRANSPORT 21 Part of the Department of Transport s way of achieving its goal of integration is to put out a 10- year transport investment plan. In November 2005 Ireland saw the launch of the governments 34.4billion new transport investment framework entitled Transport 21, which will see 9.4million invested every day for the next 10 years in Irish transport (Department of Transport, 2005b). Investment in transport infrastructure is required to ensure the effective delivery of transport policies aimed at overcoming existing delays, bottlenecks and congestion and to provide alternative choice by alternative modes of transport (Department of Transport, 2005a). Transport 21 is the framework through which the transport system in Ireland will be developed, and aims to increase accessibility, ensure sustainability, expand capacity, increase use and enhance quality. Transport 21 also forms the cornerstone of the Governments aims at achieving a sustainable transport network. A record amount of 16 billion is to be invested in public transport, in order to encourage modal shift by providing alternatives to the private car. The third annual progress report for Transport 21 was published in 2008 (Transport 21 Division, 2008), and states that, in billion was spent in total on Transport 21 projects. 890 million of which was spent on public transport, equating to approximately 29.5% of 2008 total expenditure. This included planning and preparation of LUAS and Metro links to Dublin West areas, improved Quality Bus Corridors and preparing for the introduction of an integrating ticketing system for the Greater Dublin Area. A very small 0.5% was spent on regional airports, leaving the majority, 70%, spent on the National road network. 9 SMARTER TRAVEL In 2009 a new Transport Policy for Ireland was introduced, entitled Smarter Travel: A Sustainable Future, outlining strategies for the Page 6 of RESEARCH RESULTS Part of this research consisted of carrying out a preliminary travel survey with employees in a large worldwide computer company, based in Blanchardstown, Dublin 15. This survey was carried out in early 2004, and showed that 76% of employees travelled to work by privately owned motor vehicles, which is above the national average of 71%, as described above. The average travel time was 27.6 minutes to work and 31.2 minutes home from work, with the average distance travelled being 6.69km. These figures are both significantly below the 2006 national averages, as described above. While statistics such as those discussed above are useful in showing the proportion each mode of transport accounts for on the journey to and from work, it is very important to recognise that travel is more complex than implied in such reports. Although some journeys to work do involve a simple outward and return journey, many do not, and there is little information detailing commuters daily travel behaviour. Since the introduction of Transport 21 and the large amounts of money being invested to increase infrastructure around Dublin, with the LUAS, increase in bus corridors and increased capacity on both bus and rail networks, there has still been a significant increase in commuters who travel to work by privately owned motorised vehicles; 19.3% increase over the period
105 if using another mode of transport. This corresponds with the largest response given as to why public transport is not used; public transport is too slow or takes too long. Time saved travelling produced extra time at home, to spend with family or carrying out other personal activities to 2006 (CSO, 2007). Therefore it is clear that there is a need to investigate this phenomena further to try to understand in greater depth the attitudes of these drivers, and to gain knowledge that may help in producing a more successful method of reducing the number of car commuters in the Dublin Area that policy makers can use effectively. In the past, transport has been seen as a problem for engineers to solve. However, as discussed by Ridley (1991), it is becoming increasingly apparent that no matter how much new infrastructure is put in place, transport engineers must take into account human behaviour and psychology to help understand the material that is being dealt with; human beings. As discussed previously, there is a need to look at the traditional problem of congestion from a new stance, recognising that it is not always appropriate to mitigate the steady increase in car use by looking merely at trend-based analysis, but also to acknowledge that this may require changes in user behaviour. In order to look at this in more depth, travel behaviour and public attitudes must be explored. Therefore, the main stage of this research consisted of in-depth interviews with those survey respondents who drove to work in privately owned motor vehicles. Many issues were discussed in detail, such as reasons for modal choice, perceptions of infrastructure and public transport available in Dublin and attitudes towards using alternative modes. This paper outlines some of the preliminary findings from these interviews in relation to these three topics, in order to aid policy makers in understanding users behaviour more comprehensibly RReasons For Driving To Work And For Not Using Public Transport Two of the initial questions posed in the interview were why do you drive to work? and why do you not use public transport to travel to work? The most frequent responses for travelling to work by car and not using public transport correspond with one another; that is time and speed, no direct public transport route and convenience. The majority of respondents outlined that the reason behind driving to work was a matter of saving time, or getting to and from work faster than The second most frequent response given as to the reason for driving to work is that there is no direct public transport route, which again is the second most recurrent response given as to why public transport is not used. The lack of direct routes is also linked to the time spent travelling to and from work, and the reason why it is believed that using public transport takes longer than driving. Many of the interviewees describe the fact that as there is no direct route, it requires them to first travel into the city centre on one route, then travel back out of town to the suburb of Blanchardstown on a second route, before changing to a third route to travel into the Ballycoolin Industrial Estate, where the company is located. It is believed that there is a lack of cross-town routes, and in general a lack of infrastructure servicing parts of the city. One interviewee describes this: The public transport options seem to go definitely from city centre out. There s no kind of cross-town options or anything like that But there s nothing that runs from Rush, or Skerries, it s all like from there into town and then back out. (#10) Even for those who accept that they live relatively close to work, there is still an impression that the lack of direct routes is a negative when choosing a mode to travel to work. The journey on public transport, therefore, not only takes longer, but is also seen to be extremely inconvenient, another frequently given response to both questions. Also, it is often mentioned that many of the routes around the Blanchardstown area travel in and out of the increasing number of housing estates that have been constructed over the years, causing the routes to take longer again. Therefore, the routes themselves are perceived to be highly inconvenient. The inconvenience of public transport correlates with the convenience of the car, and there are a large number of interviewees who state that this convenience in itself is a major consideration when choosing which mode of transport to use, even when alternatives are available. Page 7 of 13
106 10.2 MModal Choice If Car Not Available Some responses go further in describing the exact reasons as to why the car is considered so convenient. One interviewee states that the car is convenient when dealing with the unpredictable Irish weather, and indeed the weather was a response given by a small minority of interviewees. Other responses given on the convenience of the car include the fact that it is direct, which corresponds with the indirect public transport. Freedom of the car was also a response given by a few interviewees, with one interviewee outlining that the convenience in having the car allows freedom to carry out other tasks on the way to and from work. The third most frequent response given for the reason behind driving to work was distance; that is the interviewees perceived themselves to live too far from work to use an alternative mode. Further examination found that all of these respondents lived a distance of 13.6km or more from work, a distance accepted to be too far to either walk or cycle to work. The Institute of Highways and Transportation Guidelines for Providing for Journeys on Foot (2000) suggest that 2km is the maximum desirable distance that commuters will walk to work, although the distance acceptable for cycling to work caries between 5km and 8km (Sustrans, The Highland Council). The majority of the responses to the question why don t you use public transport to travel to work were negative towards public transport, with some of the less frequent responses being that public transport was dirty, inefficient, over crowded, too expensive, unreliable and uncomfortable. Timetable issues were also mentioned by a minority of interviewees, with the fact that services are infrequent being stated as the reason why public transport is not used more often. Again, similar to reasons given for driving to work, two interviewees gave the response that they have a car and therefore will use it. Interviewee number 22 clearly stated that she learnt to drive and therefore bought a car and will use it to drive to work, even though she recognises that she only lives 2km from work and there is a direct bus route. Laziness was also a response given by one interviewee. Another question in the area of modal choice was how would you travel to work if your car broke down? This was to ascertain whether or not alternatives could in fact be utilised for the journey to and from work. A large number of responses continued to involve the use of privately owned vehicles, including getting a lift from a partner, getting a lift from a colleague or having a second car available, including making the owner of the second car use an alternative mode so that the interviewee could continue to drive to work: "I would, eh, make my sister get the bus and I would take the car." (#3) Those interviewees who had second cars available were probed further, and asked if there was no second car how would they travel to work, with further responses being ascertained from all of these respondents. The joint most frequent response over all was that the interviewee could get a lift to work from a colleague, which would be car-pooling. The other most frequent response was that public transport could be used to travel to work. It was also found that a large minority could in fact walk or cycle to work if a car was not available to them. Therefore it was found that there are alternative modes available to a large majority of car drivers interviewed, although two interviewees, #11 and #13 responded that they would have to take a day off work. Their only other option was to either get a taxi to work, or physically move house in order to get to work, until such a time that the car returned to working order. Taking these two respondents into account, it could be concluded that a large majority of those who drive to work could in fact find alternative means of travelling to work if required PPerception of Dublin s Public Transport Network This section outlines the findings from the interviewees in relation to the perception of the public transport system in Dublin. The findings come from both answers to the direct question Page 8 of 13
107 what is your perception of public transport in transport system is ten times better than here like. Dublin, as well as other responses given #8 throughout the interview. This comparison links with two of the other Negative Views of Dublin s Public Transport Network The majority of responses to this topic were of a negative connotation, with every interviewee having at least one negative view of public transport in Dublin, and a significant number simply stating that it was poor (#19), atrocious (#2), appalling (#4) or worse. There was an extensive number of responses given, and many respondents had more than one negative view. The majority of interviewees stated the public transport system in Dublin was worse than public transport systems in other countries, comparing it to countries such as the UK, France, Holland and the U.S. There were many items that were used to compare public transport systems, such as difference in fares and frequency of services. However the principal point of comparison was the lack of over all infrastructures in Dublin compared to other cities such as London, Newcastle, New York and San Francisco. It was suggested that the lack of infrastructure leads to a lack of integration and links between services, making it difficult to travel through Dublin. Another employee discusses his frustration at the lack of infrastructure, describing the current number of transport systems that are available, yet referring to the fact that they do not link up or service the entire city: Cos I think it s all done in like bits and pieces. I can t understand why you have like, em, the DART, and then you have a bit of the LUAS somewhere, and you ve nothing here, out here, and, well you ve got a main train that goes through some places, and I can t understand why they couldn t have done it the way you see in other countries. I was over in Newcastle there last weekend and they have a metro that literally runs everywhere, all over the city, everywhere, to anywhere you want to go. It s brilliant, so clean, so convenient, and accurate and on time. I can t understand why we have a bit of this and a bit of that Like, I gave you an example of Newcastle, which is just an urban city in England, which isn t even the capital, and the responses given. The second most frequent response, where half the respondents stated that that there was a lack of infrastructure in Dublin, as well as a small minority who stated that there was a lack of integration between the existing services. The thoughts on lack of integration was primarily in relation to ticketing, with all who referred to integration discussing the benefits of a single ticketing system for all modes of public transport, including all buses, DART and LUAS routes. There is, therefore, an overall strong belief that there is a lack of public transport options available in order to easily and efficiently travel around Dublin. However, a number of employees did reason that where the infrastructure did exist it was seen as a positive system. The principle positive response given was that the LUAS and DART are perceived to be good systems. The negative aspect is that they only serve part of the city, and few employees at Creative had any experience of using either system. Again, another factor connected to the lack of infrastructure and links available via public transport is the third most frequent response given, which was in relation to inconvenient routes. As mentioned previously, this was a frequently given response as to why these commuters do not travel to work by public transport. The perception by many of the interviewees is that the existing public transport routes all start or end in the city centre, with no cross-city routes in operation. An inconvenient route was also described as one where a journey was elongated due to the route being overly indirect by having to service a greater area, with some interviewees stating that buses have to drive around numerous housing estates before reaching its destination, lengthening the route and therefore the time it takes to travel. This links into another response, where a number of interviewees view the lack of infrastructure as bad planning, and state that there should have been more planning at development stage. It was mentioned by a number of interviewees that the increase in the number of housing estates was not mirrored by an increase in public transport networks, causing the existing services to cater for Page 9 of 13
108 recommendations made to assist the development of self-sufficient suburban town areas, including Blanchardstown, with good road network and significant public transport networks making employment centres and other amenities more accessible. larger areas and numbers, as referred to above. One interviewee believes that it is now too late to make the area of Dublin 15, where Blanchardstown is located, fully functional, but instead any newly implemented or constructed networks will simply be to stop congestion deteriorating further, rather than actually improving matters. He discusses the lack of any LUAS or DART system for west Dublin: They had a good opportunity to do the same thing, to do something with D15 because in 95, 96 this was still a very, like there was no such place as Clonea, Clonsilla was just a small village, the Blanchardstown centre wasn t built, Tyrellstown wasn t built, up near where I live, that wasn t built up either so they had a great opportunity to put either the M50 in, they had a great opportunity to put a rail link in, or at least make provision for a rail link, which they just didn t do. So I think any changes they do try and make now will be just treading water. Em, its just as bad, it ll get worse, or they ll do a few things, like as I say, you know, a few cosmetic changes, change the sequence of the lights, put in a few one-way systems round the Blanchardstown centre maybe, but it ll just be treading water really. #7 Another theme found in relation to negative perceptions of public transport was that of timing. As mentioned above, the lack of infrastructure is the primary perception of those interviewed. The lack of road infrastructure was also mentioned, with the fact that buses get caught in the same traffic congestion than private vehicles: I suspect it s probably because there s no dedicated transport channels for them to use so they re getting caught up in the same traffic that everybody else is getting caught up. And the bus lanes for example, certainly make a difference. But when you have bottlenecks every so often down the bus lanes you re basically just racing down to the next bottleneck every time and you have to rely on the good will of hassled commuters to let the bus out. #6 Therefore, it is clear to see that there is an overall feeling of frustration that there is a lack of public transport options and infrastructure allowing employees to access their workplace easily and effectively. This is despite the fact that, as far back as Myles Wright s 1967 report, there were Page 10 of 13 Positive Views of Dublin s Public Transport Network In comparison, it was also found that a large majority of the interviewees had at least one positive or optimistic view of the public transport system. A small minority stated simply that it was OK or similar. However, these respondents acknowledged that they lived on or near a good route, mostly into the city centre. As discussed previously, the most frequent positive response towards public transport was in relation to the LUAS and DART systems, which are seen as good systems for those who can avail of them. Similarly, there is an awareness that there is a reliable means of travelling into the city centre. The fact that it is perceived that there is no orbital routes, and all public transport routes start or end in the city centre, was discussed above as a negative aspect for travelling around Dublin. However, it is clear that overall there was a considerably negative attitude towards the public transport network in Dublin AAternatives Another aspect to the interviews was to ascertain whether or not those who drive to work would be willing to use an alternative mode to travel to work, and what would encourage them to do so. This is because it is believed that in order for government policy to be implemented successfully, those members of the public who will be affected must be consulted in order for changes to be accepted and put into practice (Vigar, 2002). Firstly, it was established through analysing the transcripts whether or not the respondents would be willing, under any circumstances, to use an alternative mode to travel to work. The majority or those being interviewed gave responses that indicated that they would be willing to change, however, there was a large minority who stated they would not be willing to use an alternative. The alternatives that were considered included all possible substitutes, from using public transport, car-pooling, cycling and walking:
109 This was then followed by further questions in relation to what specific actions would be required to induce the interviewees to change mode of transport. There was a wide range of responses, with all respondents except two gave more than one response. The single response given by these two respondents, #7 and #22, was that nothing would encourage them to change mode. The most frequent responses given were in relation to improved infrastructure, direct public transport routes and an increase in the cost of driving. As discussed previously, the interviewees had a mostly negative perception of the public transport available throughout Dublin, with a significant number stating that there was a lack of infrastructure and integration between existing services, making it difficult to travel around Dublin. Responses included extended LUAS and DART lines or a metro style network that includes Blanchardstown on its route, as well as improved road surfaces, widths, cycle and bus lanes and improved pedestrian footpaths. In relation to direct bus routes, a significant number of respondents, just under half, stated that they would use public buses if there was a direct route, including a direct route to Blanchardstown shopping centre, which would still require a change to a second local bus to the industrial estate. The main negative aspect of indirect bus routes was the need to travel in and out of the city centre. 11 CONCULSION Proceedings of ITRN2010, 31 st August to 1 st September 2010, University College Dublin, Ireland acceptance and leadership in needing to provide a better infrastructure. It is quite clear, and has been for some time, that there is a need for integrated transport systems and the promotion of the use of non-motorised modes of transportation. With a view to providing safe, affordable and efficient transportation, increasing energy efficiency, reducing pollution, congestion and adverse health effects and limiting urban sprawl, national strategies, plans, policies and processes are crucial ( United Nations, 1993). As discussed, issues were being raised about traffic congestion in Dublin as far back as 1967, and recommendations were being made for long-term solutions. The reason that these recommendations were ignored time and time again is hard to understand, and Ireland, especially the Greater Dublin Area, is now paying the price for the lack of In a way, the repetitive nature of transport strategies in Ireland over the last 30-years is not encouraging, as it shows a lack of conviction of Irish Government both past and present to actually commit and lead the way in sustainable mobility. The failure of past Governments to act promptly to recommendations made by industry experts, as well as poor funding and design of infrastructure, has led to the current crisis in Irish transport. The new aim in transport policy should be to reduce the amount of private car use by making public transport more attractive and efficient. It is also crucial that the public be consulted during these periods of implementation, as it is the commuters who, as end users, will determine whether or not these policies will be successful in reducing the number of cars on the road. Only by understanding traveller behaviour more deeply will policy makers be able to effectively change attitudes towards transport and ensure a successful shift to more sustainable transport modes. As can be seen from the preliminary findings shown above, there is a wide range of responses given as to why these commuters drive to work, with every interviewee having negative attitudes towards the existing public transport network and infrastructure as a whole. Therefore, it is essential that these reasons be considered during the planning, designing and implementation of new policies. It is also evident that for transport policy to be successful, policy makers from different governmental departments must work together by decreasing the distances being travelled, and reducing the need to travel at all. Again, it was discussed above that every interviewee lived more than 8.5miles from the work place, a distance accepted to be too far to either walk or cycle to work. Looking at current Irish transport policy, there appears to be a strong understanding of what is required to achieve this, and policies are indeed being put in place. However, the lack of policies in the past has led to the under investment in the transport sector, which in turn has led to the poor quality of transport infrastructure in place in Ireland up to Since the introduction of Transport 21, and its apparent success in delivering ahead of schedule, and within budget (Transport 21 Division, 2008), Ireland is heading towards a future with a Page 11 of 13
110 greener transport network. Whether this policy is successful enough to not only catch up with the deficit left by years of inept policy making, but to ensure a better quality of life for everyone, now and for generations to come (World Commission on Environment and Development, 1987), is yet to be seen. REFERENCES An Foras Forbartha (1971). Transportation in Dublin: An Advisory Report. Dublin: An Foras Forbatha Department of Transport (2005b). [Internet] g=eng&loc=1850 [Accessed on 16/02/2010] Department of Transport, (2009). Smarter Travel: A Sustainable Transport Future. Dublin: Stationary Office Environmental Protection Agency, (2010). Ireland s Greenhouse gas Emissions Projections: Environmental Protection Agency: Ireland Banister, D., & Stead, D., & Steen, P., & Akerman, J., & Dreborg, K., & Nijkamp, P., & Schleicher- Tappeser, R. (2000). European Transport Policy and Sustainable Mobility. London: Spon Press Barrett, S. (1991). Transport Policy in Ireland in the 1990 s. Dublin: Gill & Macmillan Bradley, K. (1991). The Need for a Sustainable transport Policy for Dublin, in Transport in Dublin: Policy and Practice, edited by John O'Sullivan. pp Dublin: An Taisce Central Statistics Office (2007). Census 2006, Volume 12: Travel to Work, School and College. Dublin: Stationary Office Central Statistics Office (2009a). Transport Dublin: Stationary Office Central Statistics Office (2009b). Statistical Yearbook of Ireland Dublin: Stationary Office Chartered Institute of Highways and Transportation, (2000). Guidelines for Providing for Journeys on Foot. UK: Institution of Highways & Transportation Commission of the European Communities (1990). Green paper on the Urban Environment: Communication from the Commission to the Council and Parliament. Brussels: COMS Department of Communications, (1985). Transport Policy: A Green Paper. Dublin: Stationary Office Department of Transport (2005a). Statement of Strategy, Dublin: Stationary Office Howley, M., & Dennehy, E., & O Gallachoir, B. (2009). Energy in Transport: 2009 Report. Cork: Sustainable Energy Ireland Energy Policy Statistical Support Unit Masser, I., Svidén, O., Wegener, M. (1992). Towards a New Paradigm for Transport Planning, in Planning Practice and Research, 7(2), pp4-8. Routledge McKinsey International, Inc. (1980). The transport Challenge, The Opportunities in the 1980 s: A Report for the Minister for Transport. Dublin: Stationary Office Meldon, J. (1991). Land-use Strategy and Transportation Policy in Dublin, , in Transport in Dublin: Policy and Practice, edited by John O'Sullivan. pp Dublin: An Taisce National Economic and Social Council, (1980). No. 48: Transport Policy. Dublin: Stationary Office Northern Ireland Statistics and Research Agency, & Central Statistics Office, (2008). Ireland North and South: A Statistical Profile, 2008 Edition. Dublin: Stationary Office O Connell, D. (1991). The Car, The Bus and European Policy, in Transport in Dublin: Policy and Practice, edited by John O'Sullivan. pp Dublin: An Taisce O Mahony, M., & Broderick, B. & Gill, L., & Ahern, A., & English, L., (2002). Scope of Transport Impacts on the Environment, Final Report. Wexford: Environmental Protection Agency, Ireland Page 12 of 13
111 Perry, S. (1991). Mass Transit as a Policy Instrument, in Transport in Dublin: Policy and Practice, edited by John O'Sullivan. pp Dublin: An Taisce Wickham, J. (2004). Public Transport & Urban Citizenship. Dublin: Policy Institute, Trinity College Dublin Ridley, T.M. (1991). International Transport Policy and its Relevance for Dublin, in Transport in Dublin: Policy and Practice, edited by John O'Sullivan. pp9-19. Dublin: An Taisce Wright, M. (1967). The Dublin Region: Advisory Regional Plan and Final Report. (2 vols.) Dublin: Stationary Office Steer Davies Gleave (1991). Dublin Transportation Study Final Report, Phase 1. Dublin: Stationary Office Sustrans. [Internet] 20Travel%20Cymru%20Toolkit/Motivating_Indivi duals.pdf [Accessed on 16/07/2010] The Highland Council, (2006). [Internet] inabledevelopment/climatechange/greentravel/activ etravel/cycling.htm [Accessed on 16/07/2010] The World Commission on Environment and Development (1987). Our Common Future. Oxford: Oxford University Press Transport 21 Division, (2008). Transport 21: Third Annual Progress Report to the Government. Dublin: Stationary Office United Nations (UN) (1993) Earth Summit Agenda 21: The United Nations Programme of Action From Rio, New York: United Nations United Nations Department of Economic and Social Affairs. (2009) [Internet] tm [Accessed on16/07/2010] United Nations Framework Convention on Climate Change. [Internet] [Accessed on 16/07/2010] Vigar, G. (2002). The Politics of Mobility: Transport, The Environment and Public Policy. London: Spon Press Whitlegg, J. (1993). Transport for a Sustainable Future: The Case for Europe. London: Belhaven Press Page 13 of 13
112 SMARTER TRAVEL IN SIX EUROPEAN CITIES - A PRECEDENT STUDY Kay Cullinane 1 and Tom Cosgrove 2 1. Research Masters Student of Civil Engineering at the University of Limerick, Ireland; Kathleen.Cullinane@ul.ie 2. Professor of Civil Engineering at the University of Limerick, Ireland; Tom.Cosgrove@staffmail.ul.ie ABSTRACT This precedent study details six European cities that portray leading best practice in the implementation of continuous and integral transport policy. This study describes the course of development of transport policy in each city, specifically seeking how each city achieved such high bicycle and public transport use. The six Smarter Travel cities concerned are Malmö in Sweden, Copenhagen and Odense in Denmark, Groningen and Delft in The Netherlands and Freiburg in Germany. Keywords: Smarter Travel, Transport Policy, Cycling, Travel Behaviour Change 1 INTRODUCTION Smarter Travel - A Sustainable Transport Future the new transport policy for Ireland was published in February of last year (2009). This policy was launched as a response to Ireland s ever increasing demand for road transport and details how a sustainable travel and transport system can be achieved in Ireland by In order to fully understand how this vision can be achieved in Irish cities such as Limerick, this study was carried out to investigate European experiences and the transferability of successful sustainable travel and transport policy. This study details six European cities that portray best practice in terms of continuous and integral transport policy, modal split for all journeys, especially bicycle mode share, land use planning, and car free initiatives. The six cities chosen cities are Malmö in Sweden, Copenhagen and Odense in Denmark, Groningen and Delft in The Netherlands and Freiburg in Germany. Copenhagen and Groningen were chosen as both cities are famous for their bicycle mode share, in particular Copenhagen. Malmö and Odense were selected as both cities have engaged in recent campaigning for travel behaviour change towards more sustainable modes of transport, cycling in particular in Odense. And finally Freiburg and Delft were included in this precedent study as Freiburg is of similar size to Belfast City and Delft shares a similar population with Limerick City for comparative purposes. Figure 1 and Figure 2 outline the modal split and population comparisons between Limerick and the chosen six European cities, respectively. Freiburg Delft Groningen Odense Copenhagen Malmö Limerick Other 1% 1% 4% 2% 8% 3% 2% 0% 0% 4% 4% 2% 14% 11% 15% 18% 29% 28% 24% 16% 16% 26% 26% 23% 20% 37% 34% 28% 31% 37% Figure 1. Modal Split Comparisons 43% 41% Proportion of journeys by public transport Proportion of journeys by car Proportion of journeys by bicycle Proportion of journeys by foot 46% (Source: Limerick 2006 Census; Malmö, Odense and Freiburg Urban Audit 2004; Copenhagen 2008 Bicycle Account; Groningen and Delft 2006 Dutch Bicycling Council) 50% 56% Page 1 of 22
113 Limerick City & Suburbs Malmö Copenhagen (including Greater Copenhagen) Odense Town Groningen City Delft City Freiburg City 95, , , ,623 96, ,547 1,875,179 Figure 2. Population Comparisons (Source: Limerick Malmö - Copenhagen - Odense - Groningen and Delft - and Freiburg MALMÖ Transportation and buildings account for the largest share of climate-changing impact. This means that we must mitigate climate change largely at the local level that we must work for the sustainable city. Municipalities must function as role-models on the climate issue Ilmar Reepalu, Mayor of Malmö Introduction Malmö is Sweden s third largest city and has a population of 293,909, as of the 1 st of January Malmö City is the capital of Skåne County located in southern Sweden. During the eighties and nineties Malmö underwent a period of economic recession and high unemployment. However, during the last decade Malmö has consciously reinvented itself as a sustainable multi-cultural European city of the future with major developments such as the opening of Malmö University. Malmö City actively works to facilitate the city's traffic, with a strong focus on public transport and non-motorized transport, especially the bicycle. There are 143,000 jobs in Malmö city and 55,000 people commute daily into the city to work. Figure 3 outlines Malmo s modal split for those commuting to work every day. Malmö city incorporates approximately 420 kilometres of bicycle paths, containing more bicycle pathways than any other Swedish city, thus being known as Sweden s Cycle City. In fact Malmö has five kilometres more than its sister-city Copenhagen, which is world famous for its bicycle culture. The City of Malmö (Malmö s city council) carries out a large-scale travel habits survey every five years, with the most recent survey having been carried out in In addition, the traffic is counted yearly at 140 traffic measure points across the city. From this, the movement of the traffic to and from different areas in Malmö is obtained. The city s monitoring of the changes in the travel habits of its people has so far conveyed that cars are being used for shorter journeys less often. In addition, the number of journeys per person for 2008 and 2003 is on average the same. However, the number of car journeys fell from 52% of all journeys in 2003 to 41% in Conversely, the number of shorter journeys on foot and by bicycle increased, and for longer distances the number of train journeys also increased. This is in line with the increases in rail and bicycle traffic recorded in the entire region. Overall, the percentage of bicycle journeys rose from 20% to 23%, with the number of journeys on foot increasing from 14% to 20%. Train journeys also increased from 3% to 5%. The modal split for all journeys is outlined in Figure 3. Proportion of journeys to work by public transport 18% Proportion of journeys to work by car 52% Proportion of journeys to work by foot 6% Figure 3. Malmö Modal Split Proportion of journeys to work by bicycle 24% 2.2 Cycling in Malmö In 2008 cycling in Malmö increased by 11%; with approximately 30% of all transport journeys occurring via a bicycle. Malmö s high cycling rates can be attributed to the city councils continuous Page 2 of 22
. This route varies significantly in character.")

114 investment in providing well connected and integrated cycle routes. An extensive cycling route runs through Malmö city from the southern part of the inner city to Universitetsholmen in the north. (Universitetsholmen is a small artificial island in Malmö harbour, surrounded by bays and channels, to the west of the train station). This route varies significantly in character. In the north, it runs past the old part of town before following the more fashionable streets of the city, and finally branching off eastwards to the city suburbs. Figure 4 below highlights the density of the cycle network of Malmö. Malmö city continuously invests in improving its cycle routes and increasing its already impressive percentage of bicycle mode share. At present a variety of solutions are being tested along this stretch of cycle network already mentioned which runs through Malmö from the southern part of the inner city to Universitetsholmen in the north. For example, different types of lighting are being trialled along the route to improve visibility in the dark. Malmö city s aim is to make cycling faster, safer and more enjoyable. The innovations introduced along this route include rails at traffic lights which cyclists can rest against so that they do not need to put their feet down. found in Odense in Denmark). The pumps can also be used for prams and wheelchairs. Tools have also been added to the three air pump stations along the cycle route, turning them into mini-service stations where cyclists can carry out their basic repairs. Cycling barometers at different locations in the city automatically count and display passing cyclists which provide a visual indication of cycling levels in Malmö; showing how many people cycle in Malmö, encouraging and reminding cyclists that they are appreciated. Radar sensors have been fitted at 28 intersections in Malmö to detect approaching cyclists and automatically give them a green light at intersections, which are not already crowded by car traffic. At the junctions the lights turn green quickly in favour of the oncoming cyclists allowing cyclists to flow more smoothly in traffic. A free map is also available which portrays all of Malmö s cycle paths. The map is updated every year to show new cycle paths. The latest version is always available from the town hall and tourist information offices. Skånetrafiken s (the regional public transportation authority) website includes an online bicycle journey planner which when one inputs their journey origin and destination, it then suggests the best route to take when cycling in Malmö. A time comparison for the same journey by bike, bus, and car is also provides, with cycling often coming out on top. Figure 4. Malmö Cycle Network (Source: Malmö Stad - Official website of City of Malmö. Large mirrors have also been erected at crossings to allow cyclists to see around corners where visibility would otherwise be poor. Air pumps have been installed at six locations around the city for cyclists who need to top up their air. (Similar pumps can be Figure 5. Malmö Bicycle Parking (Source: Google Images) Page 3 of 22

115 2.3 Public Transport in Malmö Skånetrafiken is the regional public transportation authority and operator in Skåne. Skånetrafiken was founded in 1999 when the two counties Kristianstads Iän and Malmö Iän were merged into one region. During this merger the two respective transport authorities were amalgamated. Presently, Skånetrafiken is a part of the regional government of Region Skåne. Within the city, Skånetrafiken s green city buses run frequently along lines and are entirely powered by biogas. A focus on modern, environmentally-friendly public transport means that passengers can find out departure times using their mobile phones and public transport is given priority at crossings, ensuring green, clean travel. The Öresund train, which departs from Malmö every twenty minutes, also links Malmö with Copenhagen and the rest of Denmark. The Öresund Bridge (as seen in Figure 6) is a combined twotrack rail and four-lane road bridge across the Öresund strait. It is the longest combined road and rail bridge in Europe and connects the two metropolitan areas of the Öresund Region: Malmö with Copenhagen. The international European Route E20 runs across the bridge and through the tunnel via the two lane motorway, as does the Öresund railway line. The Öresund Bridge has connected mainland Europe to Sweden and the rest of Scandinavia. The Öresund Bridge connects the two cities of Malmö and Copenhagen allowing the cities to better compete against other European cities. It also provides for the creation of diverse revenue streams and allows for more efficient resource utilisation. In addition, it encourages more collaboration between universities, research institutes, and corporations. Approximately 29 million journeys are made on city buses in Malmö each year. Several policies and programs have attempted to make city buses an even more attractive choice. Such efforts include increasing the frequency of bus transportation, as well as providing for bus traffic lanes. Additionally, Skånetrafiken has installed digital real-time signs at almost 100 bus stops in Malmö so that travellers can see when exactly buses will arrive. One can also get real-time information via mobile phones using either mobile internet or a downloadable program. Having a mobile journey planner allows travellers to plan their journey while on the go. Skånetrafiken s city bus services in Malmö are based around eight trunk lines which cover much of the city. City buses run so frequently on these lines that there is almost no need for a timetable. During the rush hour, most of these lines run almost every six minutes. Skånetrafiken has also drawn up a safety policy and installed cameras on all city buses for greater security onboard. Bus travellers in Malmö take priority in purely practical terms, the city s buses communicate electronically with traffic lights so that they get a green light more quickly than cars. And if the traffic light is about to turn red, buses are given a green light for a few moments longer. Figure 6. The Öresund Bridge 2.4 Environmentally-Friendly Cars and the Transportation of Goods Renewable biogas is produced in Malmö, and ethanol is available from many of the city s petrol stations. In Malmö, VA SYD (Waste and Sewerage Authority) collects organic waste such as leftover food from households and restaurants. The organic waste is then composted at the city s sewage works. This produces biogas, which is pumped into Malmö s biogas network, producing a total of 20 GWh each year (the equivalent of 2 million litres of petrol). This allows both buses and cars to run on renewable food waste, without producing fossil carbon dioxide emissions. The City of Malmö and many of the city s organisations and businesses are investing in environmentally-friendly cars. Employees working for Malmö s city council receive the opportunity to join ecodriving training. The city councils own Page 4 of 22
116 fleet of vehicles already consists almost exclusively of environmentally-friendly cars and a large number of private companies have followed the councils lead. The city councils company vehicles are almost exclusively classified as environmentally-friendly cars, with many those using renewable fuels such as biogas and ethanol. A few are electric, and one even runs on hydrogen gas from wind power. In Malmö, driving an environmentally-friendly vehicle is both easier and cheaper. Malmö city has a low-emissions zone for HGVs. Within this zone only HGVs with modern engines are permitted. Those who drive environmentally-friendly cars made within the last three years can also apply for a special parking permit from the city council which entitles them to one hour s free parking. Malmö Lastbilscentral (Malmö Lorry Centre) has also invested heavily in heavy ecodriving economical driving for HGVs enabling it to make an approximate saving of 15% on its fuel consumption. Some vehicles have also been fitted with onboard computers which can work out the fastest route and how much fuel will be used. In addition the company has seen a significant reduction in damaged goods since introducing these measures. The city council has also helped to set up an ordering system which connects food producers with restaurants and caterers via a website. Farmers can upload details of seasonal produce and restaurants can log on to order locallygrown, organic food which is then delivered on a pooled basis by biogas-powered lorries. Shorter journeys and less empty mileage help save both money and the environment. 2.5 Sustainable Urban Planning Historically Kockums shipyard was located in Malmö s Western Harbour; today the area is home to Bo01 - Sweden s first climate neutral city district. The area is supplied completely by local renewable energy over the course of a year. Bo01 incorporates an eco-friendly transport system, with buses connecting Bo01 every 10 minutes. Bus stops feature real-time displays so passengers know when the next bus will arrive. Bicycles are common and the district features a carpool. 2.6 Changing Travel Attitudes and Behaviours Since 2001, the Malmö s city council has been actively working on changing travel attitudes and behaviours. The ultimate goal is for more people choosing to walk, cycle, or use public transport, instead of using their cars. The fact that so many parents regularly drive their children to school has become a major problem, as in Ireland s towns and cities. The Friendly Road to School project aims to encourage parents of children attending the first few years of school to walk or cycle to school with them instead of driving them by car. Each metre walked by pupils on their way to school is converted into a footstep on a giant map of Europe at each of the participating schools. In this way, the project can be integrated into teaching and the children learn about the cities and countries which they pass through. Persuading companies to take more responsibility for business travel and employees journeys to and from work is part of the work involved in changing travelling habits. Having held seminars and breakfast meetings on the subject, Malmö city council started to work with companies by offering help and advice in drawing up mobility plans including measures to change travelling habits. In the Businesses on Bikes project 53 companies replace ridiculously short car journeys with bicycle journeys. 2.7 Success in Malmö Malmö s success has been down to the fact that the municipality, different businesses and people are willing and happy to work together to help make a better future for the city. In the Western Harbour, the municipality led the way and brought together house builders and the local energy company. They also involved people, asking them what they would want the Western Harbour to look like. The result is a place great for the city, great for the businesses that took part and great for the people. Furthermore it appears that Malmö city s success is also down to its strong and continuous integration with public transport. In December 2010 a new city tunnel will be opened to the public which will connect train travel north of the city to southern connection points. The City Tunnel will consist of 17 kilometres of railway and 6 kilometres of tunnel, generating the largest investment in public transport in Malmö's history. Page 5 of 22

117 3 COPENHAGEN 3.1 Introduction Copenhagen is known internationally as a model bicycle friendly city. In Denmark taxes are used to invest in the country s energy and environmental future, creating new revenue opportunities. Denmark s citizens support investment that improves their environment and creates jobs. The result is short term energy savings and the lowest long term prices for energy. The people of Denmark accept that global climate change is real and create regional pride in people by pursuing a global mission. Cycling, for the relatively fit riding short distances, including large tricycles for senior citizens, and free bicycles; Buses making frequent stops; Metros, fast and independent of street conditions; Trains for longer distances; and Smart card, automatic payment and transferable between different modes. In Copenhagen bicycles and public transportation are prioritized over cars in planning. Effort is put into continually improving the efficiency of public transport. Bicycles and public transport also receive greater funding. Copenhagen is eliminating car parking spaces at a rate of 2-3% per year which includes minimal parking even out of the city centre. For example DR Byen (DR Town) is the headquarters of the Danish national broadcasting corporation (DR) and employs approximately 2,700 employees but only provides 500 parking spaces. As a result, 47% of Copenhageners do not own a car, 58% use a bicycle everyday, 26% use a car everyday and 25% use a bus every day. The commuting modal split in Copenhagen is outlined in Figure 8 below. Figure 7. The City of Copenhagen The emphasis on public transport and bicycle commuting in Denmark and in fact throughout Scandinavia has emerged based on the following two values that Scandinavians possess: 1. Universal mobility everyone regardless of their financial situation, age or ability should have access to work, education, health care, and the other aspects of participating in society; and 2. Quality of life clean air, green spaces, traffic reduction, reduction of CO 2, independence for children, protection of character of historic districts. These values have led to the planning of multiple modes to provide efficient and convenient mobility for all which include; Proportion of journeys to work by public transport 28% Proportion of journeys to work by car 31% Proportion of journeys to work by foot 4% Figure 8. Copenhagen Modal Split Proportion of journeys to work by bicycle 37% 3.2 Transport Policy The Greater Copenhagen Region is a metropolitan area of 1.8 million inhabitants on almost 3,000 square kilometers in the North eastern corner of Zealand. Besides the two cities - Copenhagen and Frederiksberg - the region has three counties - Copenhagen, Roskilde, and Frederiksborg - and 46 other municipalities. The five major counties have Page 6 of 22
118 owned a transport company, known as HT or Copenhagen Transport, for more than 25 years. The Greater Copenhagen Authority - Hovedstadens Udviklingsråd (HUR) was launched in July 2000, and is directed by a council of 11 regional politicians. As the key government authority, the HUR-council has responsibility for solving political difficulties within their competence, and for the HUR budget. The counties raise money for HUR s operating budget through the county income tax, which also funds some investment, with the balance coming from national government. Copenhagen is seen as leading best practice in the implementation of transport policy. This is for a number of reasons outlined as follows: Integration of land use and transport; A strong emphasis on the integration of the public transport network, especially at interchanges (with timed connections between buses and trains, for example); High quality bus transport. This has been achieved through the introduction of competitive tendering, with considerable emphasis placed in the contracts on quality, with a number of incentives on operators to reward them for high quality service; Other transport policies, such as pedestrianisation, traffic calming, parking policy and cycling policy, especially in the urban centres within the Copenhagen agglomeration, that have been seen to support policy objectives aimed at reducing car use; and High levels of funding, but also imaginative ways of delivering that funding for example with the Ørestad metro line. This good practice has been achieved by voluntary co-operation between the five main municipalities in the region, together with concerted action by the regional public transport body (HT, now HUR). The existence of a regional public transport body has been of significant benefit to the region s public transport system, compared to the fragmented system that existed prior to the creation of HT in In addition, the dependence on the private sector for the provision of bus services in the Copenhagen region has provided major opportunities for improvements to services. 3.3 Cycling Copenhagen has been called the most liveable city in the World, and it has a realistic vision to become the World's best cycling city Copenhagen city council carries out a Bicycle Account bi-annually. This account is an assessment of cycling development in Copenhagen, dealing with city cycling conditions, new initiatives as well as the way in which the Copenhageners themselves perceive cycling facilities. The first bicycle account was published in The most recent account is based on 2008 statistics and includes telephone interviews with 1,025 randomly selected Copenhagen residents. The bicycle account also includes data form Denmark s Department of Transports Transport Survey of Transport Behaviour research carried out by the department involving the continuous collection of information on the transport behaviour Therefore it is known that cyclists in Copenhagen travel a total of 1.2 million kilometres by bike every day, the equivalent of cycling to the moon and back twice! Copenhagen however is not a natural bicycling city, like many of Ireland s towns and cities presently. In the early 1960's it was a city renowned for cars, traffic jams, and pollution. In 1962 the city created its first pedestrian street, the Stroget (the longest pedestrianised street in the world), and every year since then Copenhagen has allocated more and more of its public space to bicycles, pedestrians and people who just want to sit and take a load off. 34% of Copenhageners commute by bicycle. Copenhagen's city government, along with Jan Gehl's public space research institute, is constantly measuring and analyzing street usage. After finding that the majority of the city's bike accidents were taking place at busy intersections they began striping them in blue. They are now studying whether these blue paths are doing anything to reduce casualties. Copenhageners follow and respect the rules of the road. The vast majority of Copenhageners will get off their bicycles and walk when they come to a pedestrianised street like the Stroget. People stop at traffic signals. They stay in their lanes. Cyclists follow the rules of the road because they are a legitimate mode of transportation and they have Page 7 of 22
119 their own infrastructure. It is possible to bike across the entire city in 45 minutes. Bicycle planning has the same status as public transport planning in Copenhagen. In 2002 one third of the city s road construction budget went towards cycling improvement. Fees and taxes for vehicular purchase, use, and parking have increased and continue to increase. As a result in Copenhagen there are over one million bicycles, which equates to one for every resident. The Copenhagen bicycle network consists of over 180 miles and was built over the course of almost a century. Bicycle traffic is considered a distinct traffic category with its own separate road area, on par with motor and pedestrian traffic. Copenhagen s larger streets feature travel lanes for cars, then sometimes a semi-separated bus lane, a stone kerb, then a slightly elevated cycle lane, then a pedestrian area. At most intersections cycle lanes are clearly marked in blue paint and separated from pedestrian walkways. At intersections bicycles have the right of way. Copenhagen has set up 125 parking areas and stocked them with 1,300 specially designed bicycles with spoke-less wheels and puncture-proof tyres. A 20-kroner coin releases the key and one is free to ride anywhere with the bicycle. 3.4 Public Transport Public Transport in Copenhagen comprises buses (including boat buses), trains and a metro. Copenhagen operates one public transport system which includes same fares, tickets and the ability to transfer freely between different modes. Transport planning emphasises public transport making buses and trains more convenient than trains. Certain streets have limited or no access to cars. The Copenhagen Metro is a rapid transit system serving Copenhagen, Frederiksberg and Tårnby in Denmark. The 20.5 km system opened between 2002 and 2007, and has two lines, M1 and M2. Approximately 118,000 passengers use the Metro daily. Trains leave every 3 to 6 minutes. High priority is given to providing easy access to other means of public transport at all stations. The new metro was not funded by taxes; instead a new district was established south of Copenhagen called Ørestad. This land was owned by the government and the government constructed the new metro to bring people to Ørestad district. With the Metro the land then became more valuable and allowing the government to sell the land to private developers and using the funds to pay off the loans for the Metro and other infrastructural expenses. 3.5 Summary of the Key Transportation Concepts in Copenhagen Today 37% of Copenhagen s commuters cycle to work or education. By 2015 the city aims to raise this to 50%. The city is committed to further improving bicycle infrastructure and developing campaigns and to promote urban development in ways that consistently incorporate and give high priority to cycling. Copenhagen s most recent bicycle account portrays that cyclists and noncyclists prime motivation for more cycling would be more and wider cycle tracks and fewer cars. The city also aims to reduce motor traffic by introducing road pricing. The legal procedures for introducing road pricing, however, are not as yet in place. Copenhagen operates following the idea of thinking mobility rather than traffic control, prioritizing bicycles and public transportation over cars. The city strives for a flexible multi-modal mass transit system. It is clear that efficient, reliable, safe public transportation can entice people to reduce car use. Copenhagen has made undesirable travel behaviours inconvenient and expensive. 4 ODENSE 4.1 Introduction Odense is the third largest city in Denmark and the main city of the island of Funen. As of the 1 st of January 2009 the population of Odense Municipality was 187,929. More than 150 different nationalities live in Odense among them are several international students. All in all 16,320 students attend higher education in Odense. 21,928 children live in Odense and they have more than 250 playgrounds to play in. Page 8 of 22


120 approximately 50%, with a simultaneous drop in accidents of approximately 20% in the 1990s. Odense s modal split for journeys to work made by the city s population is outlined in Figure 10. This four year programme comprising more than 60 demonstration projects had a budget of 3.5 million euro s. The programmes action plan concerned not only with building more cycle infrastructure, but also safety, leisure cycling, legal issues, accessibility, service, maintenance and quality. Figure 9. Odense National Cycle City of Denmark The city lies close to Odense Fjord on the Odense River. Its railway station lies on the route between Copenhagen and Jutland, the peninsular mainland. A 7.5 m deep canal, dug from 1796 to 1806 gives access to the town from the fjord. Accessibility to Odense was greatly increased when the ferry service between the two main Danish islands, Zealand and Funen, was replaced by the Great Belt Bridge which opened to rail traffic in 1997 and to road traffic in When the bridge opened, it was the second longest suspension bridge in the world. Its construction greatly cut transportation time between Odense and the Danish capital, Copenhagen. 4.2 Odense Four Year Programme Odense City supported by The Road Directorate and Odense Municipality, and the Danish Ministry of Transport, conducted a travel behaviour change programme between 1999 and This Smarter Travel type programme aimed solely cycling and at further increasing the city s modal share of cycling and the number of bike trips and improving the safety of cyclists. The Danish Ministry of Transport had already named Odense as Denmark s National Cycle City, because it had been promoting cycling extensively for many years prior to this programme. Since the 1980s, Odense has created an extensive cycling network comprising more than 350 km of cycle paths and lanes. In the 1990s attention focused on the improvement of traffic safety and comfort and to bicycle use promotion. Consequently, Odense experienced a growth in bicycle trips of It was envisaged that these measures would lead to improvements throughout Denmark and further afield, with Odense acting as a cycling laboratory and a model city. Odense s cycling promotion plan gives cyclists more rights: cyclists are allowed to cycle both ways along one-way streets, and they are given more space, for example through the construction of new cycle paths. There have also been numerous awareness-raising campaigns, with particular emphasis on new types of campaign. It was apparent to the municipal authorities that brochures were not enough to change daily travel behaviour. Instead the municipal authorities confronted the people of Odense directly with the issue of cycling, establishing close contact with the general public and in particular with employers and employees. Proportion of journeys to work by car 46% Proportion of journeys to work by public transport 14% other 2% Proportion of journeys to work by foot 4% Figure 10. Odense Modal Split Proportion of journeys to work by bicycle 34% Action Planning became the key words for Odense s strategy - a strategy to engage participants physically in order to "reach" them mentally. The strategy worked continuously towards establishing Page 9 of 22

121 a close contact with citizens in general, and especially to employers and employees. Focus was placed on action, social experiences and person-toperson contact between campaign staff and participants. As previously mentioned, the project consisted of 60 different sub-projects which were conducted between 1999 and The objective was to encourage people to ride their bicycles instead of driving their cars, to improve safety for cyclists, and to give bicycles priority over cars. The main target group were commuters. These projects involved a combination of means, such as top priority to bicycles in town planning, regulation of motor traffic, technical initiatives, and campaigns. Emphasis was also place on quality in the construction and maintenance of cycling areas, and how they motivate people to use their bicycles. Campaigns played a crucial part of the strategy of Odense Cycle City. Experiences in Odense clearly showed that it was crucial to continuously accompany investments in physical improvements for cycle traffic with campaigns in order to promote, motivate and secure cycling. Many of the campaigns were directed towards children and young people (students) - the philosophy was that it is easier to establish good than to change bad traffic habits. Figure 11. Bicycle Pump Station in Odense 4.3 Campaigns Campaigns included the following: 1. Cycle to Work Campaign Aimed at companies via direct mail to 2,00 workplaces; Advertisements for the campaign; Postcards; Handing out 3,000 ice-creams as part of the campaign; Pins for all participants; Pin patrol awarding prizes for pin holders; and In ,000 participants. 2. Test a Cycle Trailer Campaign Trailers were offered free of charge for one week; 10 trailers and 6,000 parents got the offer; 45% of the users normally travelled by car. 3. Cycle Duckie Campaign Cycle Duckie (Odense is the birthplace of the author of the Ugly Duckling Hans Christian Anderson) became the mascot for one of Odense Cycle City's campaigns; Used to motivate new young cyclists; and More than 3,000 children and their parents competed in cycling the most to and from day care centres for 2 weeks. 4. Permanent Cycle Lights Attached via magnets to the wheel, no batteries, fixed at the cycle; 16,000 signed up, 2,000 got free lights; 98% happy cyclists; and -32% accidents as a result. 5. Get Rid of the Sack Aimed at middle aged men; Advertisements, bus ends, people dressed up as a sack of potatoes promoting the campaign; Go-cards to 84,000 households; and 75% remember the campaign. 6. Cycle Route Planners and Cycle Counters and Scanners Allowing citizens to plan their cycle routes online; Cycle computer model allows cyclists to draw their preferred route; Counters cycle traffic information comes from the cyclists; Barometers counting cycle traffic have been exported to other European cities; and Cycle detectors include cycle lotteries and monthly rewards. 7. Cycle Simulator Cycle training for 12 year old children; Linked to the national practical cyclist exam; and Based on attitude not rules. Page 10 of 22
122 The following outlines a number of the sub-projects considered as good examples of action planning for more cyclists in Odense. 4.4 Highest Quality for Cyclists At Odense Central Station, a new state of the art underground parking lot for bicycles was opened, featuring video surveillance, music, special locking arrangements, water fountain, lockers, and showcases for bicycle equipment. Finest quality also extends to the maintenance of all bicycle paths in Odense. Resurfacing, keeping the paths free from dirt, garbage, broken glass etc., and snow clearing are carried out at the same high level as on the largest roads in Odense. In addition, road inspectors are required to regularly inspect all bike paths. 4.5 Cycle Trailers for Children This campaign involved in total 7,500 parents. 10 trailers were sponsored by their manufacturers, and each trailer went to a kindergarten for 2-3 months at a time. One employee was responsible for instructing the parents. It was thought that cycle trailers offer good training for the parents and show a good role model for the children to become cyclists too. An extra advantage is that one can carry two children plus some luggage at ease. All parents with children in kindergartens were also offered to borrow a trailer for free for one week. Parents were also given the option of buying a trailer afterwards. 4.6 Campaigns for School Children During the period of , Denmark had the highest rate of child mortality due to road accidents in Western Europe. However, only one out of six accidents occurs on trips to and from school. Cycling is the most common mode of children s transport and the use of bicycles increases with age. In response to this a project in Odense started more than 20 years ago and includes all 45 schools of the city. For each school, maps of the area have been drawn, showing where the children actually move around and the places, which they consider dangerous. (The study also includes routes to and from organized activities). Based on the study, proposals to improve the traffic environment for children were worked out. All results and proposals for each school were included in a report. Since 1981, a total of around 200 projects have been implemented. The most common measures have been slow-speed areas, traffic islands and separate foot and bicycle paths. New techniques has been developed, e.g. to get the acceptance of speed humps on roads with city buses. Speed registration on twelve 30-km/h roads showed a decrease in speeds from 45 to 31 km/h. The effect on the total number of accidents has been a reduction of 82 %. Furthermore the accidents are now less serious. A new national pilot project permits automatic speed control in Odense. Control is used on school roads with heavy traffic, where road humps cannot be accepted. Looking at the traffic accidents involving children there has been a drop of 24% from 1994 to 1999, even though that there has been some fluctuation in the meanwhile. Adding data from the hospital to double the number of accidents doesn t affect this conclusion. New statistics show that the percentage of children cycling to school in Odense today varies between 24 and 73 % at different schools. 4.7 Green Wave for Cyclists When cycling in Odense it is actually possible to arrive at a green light every time at a specific traffic light in Odense. To guide the cyclists, Odense has developed a 'running light', the first of its kind, which makes a green wave. If you don't cycle in the green wave you have to speed up or slow down to avoid the red light. The idea behind "the green wave" is to give the cyclist some priority in traffic and to make travelling more comfortable. Project manager Troels Andersen from the city of Odense thinks stated that "The light signals are usually put up for the sake of cars. Therefore many cyclists have to stop a lot of times. If a cyclist adjusts the speed to the green wave, the ride will be more comfortable. according to Troels Andersen Physically cyclists take up much less space than cars on the street. And that means that the high technological solutions that car drivers have often not are seen in the cyclists context. It has been important to us to demonstrate that new technology also can be used in connection with cycling. 4.8 Evaluation The many campaigns carried out in Odense were led to make people sensitive and interested in the daily use of bicycle. As a result of this transport Page 11 of 22
.")
123 policy and bike promotion during a 10 year period ( ), cycling increased by more than 50%, Odense s four-year promotion programme ( ) was assessed in detail following its completion (Evaluering af Odense Danmarks Nationale Cykelby, 2004). During an extensive survey conducted among citizens, almost half of them appeared to be informed about the initiatives that had been taken during the four years. The measures best remembered were infrastructural improvements: short-circuits, green wave, safe bicycle parking facilities. The people of Odense were quite satisfied with the physical facilities: 82% finds that Odense has excellent bicycle facilities. Campaigns were remembered far less easily. The assessment also proved that development in traffic safety had been positive during the four years. To illustrate the development in bicycle use, the assessment compared the period with The share taken up by bicycles in all trips by citizens of Odense aged between 16 and 74 rose from 22.5 to 24.6%. There was a simultaneous, notable decline in public transport (8.2 to 6.6%). The increase in bicycle use remained within the fluctuations appearing in the time sequence from 1993 onwards. The bicycle share largely fluctuated around 25%. This was the case in 1993, later (1996) it fell until slightly over 20% and it has since been fluctuating between 23% and 27% - with 2000 as top year. To summarise: In three years the number of cyclists in Odense increased by 20%; The number of accidents declined by 20% during the same period; 25% of Odense s citizens choose the bicycle as their mode of transport for getting to work or their place of study and for other errands; 80% of Odense s children walk or ride a bicycle to school; and There are 18,600 inhabitants in Odense 500 kilometres of cycling routes. 5 GRONINGEN 5.1 Introduction Groningen is a medium sized city located in the northeast of the Netherlands, approximately 200 km from Amsterdam. Groningen is the capital city of the province of Groningen. The city was founded in the middle Ages and the street pattern of the inner city continues to show characteristics of that period. Figure 12. Groningen City The city comprises a compact spatial structure. The city has a population of approximately 180,000 inhabitants (2009). Groningen as well as being an important economic centre, is a university city catering for over 30,000 students and the average age of the city is low at 33 years. Five radial routes characterize the main road network structure of Groningen today. These primary routes connect the city centre with its suburbs. A ring road which these radial arterial roads branch out from in turn connects the suburbs to the surrounding region. Around the carrestricted, partly car-free city centre a car park distribution ring operates comprising eleven parking garages for the inner city and the adjoining residential quarters. The city also has an extensive cycle network, good public transport, and a large pedestrianised zone in the city centre. Public transport (bus and train), is also characterised by this radial structure, running largely parallel to the main car traffic structure, especially along the routes leading from the ring roads to the inner city. All city and district public transport merges in two connected public transport nodes in the city centre and central station area. In the past 25 years Groningen has had a consistent transport policy which has aimed at encouraging the use of the bicycle and discouraging the use of the car for short distances in particular. The Page 12 of 22
124 historic structure of the city of Groningen offers limited possibilities in terms of extending car infrastructure, which consequently encourages the transfer of mode share to bicycle use. Groningen is known as the bicycle city of the Netherlands with a bicycle use share of approximately 40% for all trips. The contributing factors to Groningen s cycling success are policy, engagement, and continuity. Successions of policies have emerged with the same concept that cycling is an integral part of urban renewal, planning and transport strategy. Through the provision of proper infrastructure and amenities cycling has increased over time and today the main 46 routes of Groningen s cycling network are used daily by approximately 216,000 citizens. Cycle traffic has received priority over motorised traffic and through the promoting of cycling as the main mode of transportation, city planners, local authorities, and cycling advocates have played an important part in establishing the city s reputation as a city which provides sustainable urban living brought the introduction of a traffic circulation plan for Groningen's which introduced cycling policy to the city. In 1976 a plan was devised for Groningen which would extremely affect car traffic. The main idea of the plan was to ban through traffic from the inner city with the exclusion of bicycles and buses. Due to the experimental nature of the plan, the Dutch government considered it to be of more than local significance. Consequently the government provided financial and other support for the implementation of the plan. Following the introduction of this circulation plan, the inner city moved its focus more towards the bicycle and essentially away from the car. A lot of time, money, and energy were invested in cycling infrastructure and the inner city was transformed into the pleasant living area it is today. The city is now famous for having one of the highest percentages of bicycle usage in the world. In 2002, Groningen was awarded as 'Bicycle City' by the Dutch cyclist organisation called Fietsersbond. Figure 13 conveys Groningen s modal split for journeys to work. 5.2 History of Transport and Traffic Policy Groningen s success as a bicycle city results from the changes in the city s urban design and policies over time. Since the late 1960s the municipality of Groningen has been the leading European city in terms its traffic plans and spatial planning policies; maintaining a vision of a compact city and implementing policies which have lead to a car free city centre, with all areas easily reachable by bicycle. However, the provision of such a city has not always been easily achievable. Proportion of journeys to work by car 50% Proportion of journeys to work by public transport 8% Proportion of journeys to work by foot 3% Figure 13. Groningen Modal Split Proportion of journeys to work by bicycle 37% Proportion of journeys to work by motor cycle 2% During the 1950s and 1960s most cities and towns in the Netherlands were providing for vehicles, some even removing bicycle paths in order to make space for the car. Between 1955 and 1968 car traffic in Groningen became threefold; and between 1960 and 1968 it doubled. Car ownership in Groningen in 1965 was slightly above the national average (110 cars per 1,000 inhabitants compared to the national average of 100 cars per 1,000 inhabitants). In Groningen, car traffic was growing rapidly, as was suburban sprawl. At this time there were no restrictions for cars driving through the city and very few cycle routes to the city centre existed. This motor car is king situation was also happening in Ireland during this period. During the 1960s the conflict between the growing space demands of car traffic and the limited amount of space available within the city centre led to plans for a ring road around the inner city, one through residential districts and another entirely outside the city. The available space within the city was adapted, where possible to accommodate car traffic. In 1969 the municipal executive presented a traffic circulation plan: Verkeerscirculatieplan Groningen This outlined plans for a distribution Page 13 of 22

125 ring road which would closely encircle the city centre. According to the plan, the traffic structure would be composed of three tangents: the inner, middle and outer tangent. However, the plan showed much resistance and the municipal executive finally came to the conclusion that, apart from economic development, a livable, small-scale inner city as a venue for all kinds of activity and with a mixture of living, working and shopping functions favoring pedestrians, cyclists and public transport was an alternative worth considering. During the 1970s there was a change in policy. This meant the end of the construction plans of the inner, middle and outer tangents. Only the distribution ring road was fully transformed into an arterial road consisting of four to six lanes in the 1970s. The dissatisfaction of Groningen s population and its municipal government with the then existing situation led to a Memorandum of Objectives in This gave the chance of improved conditions and reduced the plans for ring roads to a proposal for a single ring road through the newer residential districts. This Memorandum of Objectives comprised the following aims: Pedestrians would have space to move without being constrained; There would be a fairer sharing of public space between different forms of movement; Public spaces would be used for a greater variety of purposes; Public spaces would be made pleasant places in which to pass time; Excessive noise level would be avoided; and Air pollution would be kept at a low level. Local authorities at this time changed the emphasis of urban planning and development in Groningen. The centre of the city was to be considered as the living room for its people. The basic concept used in urban planning was based on the compact city vision, which placed an integrated transport system high on the agenda for an inner city favoring the combined use for pedestrians, cyclists, buses and other means of public transport. A new version of the traffic circulation plan was made in This plan based on the Memorandum of Objectives, and was agreed in principle by the municipal council in Work started in the summer of 1977 and the new traffic system was introduced on the 19 th of September The revised traffic circulation plan divided the inner city into four sections and one ring road (the distribution ring road mentioned previously) was built encircling the city and reducing access to the city centre by car. The result was an inner city which is entirely closed off to cars; it is only possible to travel between sectors by walking, bicycle or public transport. Figure 14. Groningen City Centre Today What has encouraged the use of bicycles over all other sustainable modes of transport is the vast expansion of the cycle network. There are many traffic free bike lanes which run from the outskirts of the city to the city centre, which makes cycling the most viable mode of transport for most journeys. The traffic circulation plan was not intended to remove all car traffic from the city centre, but to bar through traffic from the city centre and to guide car drivers heading for the city centre to nearby car parks as directly as possible. In the 1980s Groningen's transport policy was aimed at accommodating ever growing rates of motor traffic through more investment in infrastructure, which in fact led to more and more traffic. Where one congestion spot was eliminated the traffic problem simply shifted further down to another street. In the 1980s and 1990s the application of traffic circulation made it possible to bar through traffic from city quarters and to concentrate it on a limited number of ring roads. The completion of the full ring road system in 1987 made closure possible of what is known as the Lelieboulevard, which ran through the Noorderplantsoen - Noorderplantsoen is an urban public park in the city of Groningen. After about Page 14 of 22
126 ten years of discussion on the pros and cons a pilot closure followed in 1993, succeeded by a referendum in October 1994 resulting in a very narrow 51% majority and the decision to close the road was made. Assessment shows that bicycle traffic in the Lelieboulevard and Noorderplantsoen has increased by approximately 30%. More than half of all car traffic that used to take this road through the Noorderplantsoen chose the ring road system after the road closure. In 1989, the municipal council recognised that attempts to accommodate more traffic were futile and leading to a poor quality environment and outward migration of the population from the city. All attempts to accommodate more motor vehicles were abandoned in At the same time a 'master plan' was established for the whole of the entire region. This put in place policies to provide greater mobility by public transport and bicycles and to restrict the growth in motor traffic. Priority was also given to promoting journeys on foot, by bicycle and via public transport. Motor traffic was restrained apart from goods and service vehicles in the city centre of Groningen. Quality of Life was also an important part of the policy and emphasis was placed on road safety and the introduction of 30 km/h zones in all residential areas. Between 1989 and 2000, 23 million Euros have been invested in cycling infrastructure and making cycling faster and more convenient in the city, and the annual amount continues to grow. Investments have been made on expanding the network of cycling lanes, improving the pavements, incorporating bridges for cyclists, more bike parking facilities. During the 1980s and 1990s a parking policy became an increasingly guiding policy instrument and was strictly implemented in the city. Car parking with associated time restrictions was introduced in a broad radius around the inner city. Park and Ride areas were created combined with city buses and other high quality public transport. At present there are eleven parking garages (Park and Ride), offering a total number of 3,600 places Public transport is strongly promoted too, including a Park and Ride Citybus system.. In 2004 over 1.3 million people made use of the Citybus. 5.3 Groningen Today Office buildings, services and mixed use developments have all been developed in the vicinity of public transport interchanges and are also highly accessible by bicycle. There has been an extensive programme of urban renewal with high quality accommodation located within the city. As mentioned previously strict parking policy has been implemented and the distribution of shopping facilities has been designed so that people can do their daily shopping in neighbourhoods with the city centre acting as the main centre for shopping. In addition, supermarkets are not permitted adjacent to motorways or within industrial sites. It is reported that initially these measures were regarded as severe and there was hostility to the plans, particularly by retailers, who thought their premises would become inaccessible with a subsequent drop in turnover. However, 20 years on and visitors to the city have increased. More people have moved back to the city, increases in retail trade and a high quality environment entirely dominated by pedestrians and cyclists and not motor traffic has been created. The spatial policy of Groningen continues to focus strongly on a compacts city. Within a 3 km radius from the heart of the city 78% of all inhabitants and 90% of all jobs can be located. To summarise Groningen City offers the following today: A reclaimed Grote Markt which was once a traffic roundabout and today is the city square-a centerpiece with markets and street cafe's; A city divided into four sectors within the ring road which cannot be crossed by motor traffic (i.e. it is impossible to get directly from one sector to the other by car and requires use of the ring road); 11 Park and Ride sites provided on the outskirts of the city for visitors to the city centre; Shuttle services for employees living on the outskirts of the city and in rural areas; Cycle lockers located at rural bus interchanges to allow those in suburban areas to bike and ride; An extensive cycle network with direct radial routes into the city centre from the suburbs to the city centre with journey times of 20 minutes; Page 15 of 22


127 Maximum accessibility by bicycle such as permission for cyclists to travel in the opposite direction of one way streets and permission to turn right on a red traffic signal when the road is clear and it is safe to do so; Integration of bike and rail at the central rail station through the provision of guarded bike shelters for up to 5,000 bicycles; and Newly built neighbourhoods are no more than 6 km from the city centre and along major bicycle and scooter roadways. characteristic of the Delft bicycle network plan is its hierarchy. 6 DELFT Figure 15. Bicycle Parking in Groningen 6.1 Introduction Delft is a town of approximately 96,000 inhabitants, located in Southern Holland in the centre of the Dutch Randstad between the capital The Hague and the City of Rotterdam. Delft has an historical centre and a dense residential area. Delft was one of the first towns in the Netherlands with a consistent and persistent cycling policy that is still continuing today. Since the early 1980s Delft designed and realized a cycle network in the city. A slogan: Delft fietst - Delft cycles was put in place to encourage cycling across all ages. Delft is connected to Rotterdam via a cycle free way. 6.2 Cycling Policy 1979 to 1985 A bicycle plan was implemented in Delft from 1979 to Key efforts were made in the construction of equipment which could help to complete the town's network of cycle tracks. This plan included several measures from the construction of infrastructures to traffic regulation. The main Figure 16. Delft Town It is made up of three networks at different spatial levels - the city level, the district level, and the subdistrict level, each having its own functional and design characteristics: "Town" level: the cycle network is a grid of cycle tracks which are about 500 m apart. This network is intended to carry large numbers of cyclists to the main centres of activity: schools, universities, bus stops and railway stations, offices and industrial areas, sports fields and leisure areas. The physical barriers which are the canals and railway lines require heavy infrastructures to be built if detours are to be avoided; "District" level: the cycle network has two main functions, which are to serve the various strategic points of the district (schools, shops, etc.) and provide a link to the "town" network (to join it and to return). At this level, tracks are 200 to 300 m apart. The flow of circulation is less dense than for the "town" network; the distances covered are shorter. The developments required at this level are less heavy: cycle lanes, little bridges, etc. "Sub-district" level: the cycle network links residential areas with local amenities. The routes covered by this network are usually short and often covered by children. The cycling infrastructures are about 100 m apart and are mixed: they are also used by pedestrians. Page 16 of 22
128 Delft town council allocated 12,705,846 to finance its cycling policy between 1982 and % of this amount was from subsidies granted by the Dutch Minister of Transport, Public Works and Water Management. 6.3 Cycling Policy 1999 A new bicycle plan was made in Priority was given to cycling areas that experience bottle-necks, and a study was done to identify these areas. Second, further facilities, and accommodations were made for bicycle parking and storage to make cycling a more comfortable option. Funding was received to accomplish these measures. Local operators including The Delft Entrepreneurs Federation, the first Dutch Cycling Federation (ENFB), the University and the "Priority to Children" organization, had a large influence on the plan's contents. The following outlines the objectives of the plan: to encourage the use of the bicycle as an alternative means of transport to the car for distances up to 7.5 km by creating new cycle tracks, linked to the existing network and limiting problems engendered by other forms of traffic; to increase the modal share of bicycles even further; to reduce the number of accidents to cyclists by improving infrastructures; to reduce the number of accidents involving schoolchildren through traffic education; to increase the parking facilities for bicycles in the neighbourhood of the original sites and destinations by providing cycle garages, particularly in residential areas, and by converting car parks into cycle parks; and to reduce the number of cycle thefts by creating more guarded cycle garages and installing deposit services for bicycles (particularly close to the two railway stations, schools and businesses) and by equipping cycle parks with efficient antitheft devices. 6.4 Evaluation So far, the Delft bicycle network consists of: building of two tunnels; construction of three bicycle bridges; reconstruction of seven intersections; creation of space to wait in front of cars at 14 traffic lights; 3.3 km of new connecting bicycle tracks; 2.6 km of streets that are bi-directional for cycles, but one-way for cars; 8.5 km of bicycle lanes and tracks parallel to roads; and Repaving of 10 km bicycle path with asphalt. Through the policy implemented, the average number of daily trips made by bicycle has increased by 12%, rising from to , and the total distance covered by 6 to 8% depending on the type of trip. The increase in the number of trips is mainly attributed to men, using their bicycle more often to go to work or study. The average distance of a trip has risen from 3.7 to 3.9 km, which seems to reflect an increasing interest in cycling among the inhabitants of the town's peripheral districts. Note that this increase has not occurred to the detriment of the time needed to make the trips, which has remained the same, and therefore tends to demonstrate the effectiveness of the network. An evaluation study has shown that these results are mainly due to a change in use of the network. The following factors have contributed towards this improvement: the hierarchical structure is an important part of town planning because it gives priority to urban centres and links between the various levels described; 60% of the kms covered by bicycle were at "town" level, which only represents 30% of the total length of the network; and The use of cycle tracks has increased, rising from 30 to 35%, while at the same time, the use of roads for cycling has fallen from 45 to 40%. Improved comfort and safety therefore seem to encourage residents to choose the bicycle as a means of transport. The number of cars travelling into the town centre has fallen, which is good for its attraction and creates a pleasant atmosphere. Modal distribution has risen from 40 to 43% for the bicycle. Cars and walking have remained stable at 26% while public transport has fallen from 6% to 4%, although the number of passengers carried has not changed. Page 17 of 22

129 Proportion of all journeys by car 26% Proportion of all journeys by public transport 4% other 1% Proportion of all journeys by foot 26% Freiburg have always been: expanding the public transport network, completing the cycling network, realising 30 km/h zones in staying areas, limiting the number of lanes on some main roads or narrowing them down, and applying a controlling car parking policy. Figure 18 shows the city s commuter modal split. Proportion of all journeys by bicycle 43% Figure 16. Delft Modal Split 7 FREIBURG 7.1 Introduction Since the 1970s Freiburg has been developing this reputation as Germany's ecological capital. By 1986 the City had a vision for a sustainable city reliant on an ecologically-oriented energy supply, today its solar, energy efficiency and transport programs are among the best in the world. Over 10 years CO 2 emissions have been reduced by more than 10% per capita, there has been a 100% increase in public transport use with up to 35% of residents choosing to live without a car Freiburg is living proof that solar can work in the Northern Hemisphere. Freiburg is a sustainable city driving down CO 2 emissions by regulation, incentives, design, long-term commitment, and policy reform. In 1996, the City passed a resolution, the Climate Protection Concept, to reduce CO 2 emissions to 25% below the 1992 level by Target areas include energy (i.e. in buildings, private households and businesses, and in industry), and transport. Emissions from waste, farming, and forestry are not included because they are negligible. The majority of the City's emissions reductions have come from co-generation. Almost 50% of the City's electricity is supplied through a CHP steam and gas plant called Rhodia. Heat from the plant is used for industrial purposes for the chemical industry. In this Belfast sized University City, commuter car journeys have fallen from 60% in 1970 to 43% in 2009, taking 4,000 cars per day away from the city centre. The main points of this traffic policy in Figure 17. Freiburg City 7.2 Transport The focus of inner-city traffic policy was placed on public transport due to the preservation of the historic city centre. A highly innovative urban transport policy lies at the core of Freiburg s transformation. The medieval city centre has been progressively pedestrianised, revitalising its use. In 1972 the decision for the maintenance of the light rail system was made. As a consequence, the city centre was pedestrianised in 1973 and in 1983 the first new tram route was opened. In 1990, a 30 kph zone was introduced for almost all residential streets, except main roads. The old streets have been widened to take the trams. 65% of residents live within walking distance to a tram stop. Public transport informs the planning system, for example in 1997 when a new suburban district was under construction, Rieselfeld, a new tramline was included in the first construction phase. In the new district of Vauban, if residents sign a contract stating that they will live without a car, the requirement to buy a parking space in the district garage is waived, reducing the cost of their housing. Page 18 of 22
 is integrated with regional train routes and bus services.")
130 Proportion of journeys to work by public transport 18% Proportion of journeys to work by car 29% Other 1% Figure 18. Freiburg Modal Split Proportion of journeys to work by foot 24% Proportion of journeys to work by bicycle 28% The tram system (Stadtbaln) is integrated with regional train routes and bus services. The public transport system is reliable, frequent, and convenient. In addition with a monthly pass for 45 Euros which covers the whole region and multiple modes, the system is also affordable. Almost a third of daily commuters use public transport. 7.3 Cycling A cycling plan was drawn up in 1970, and the city now has over 500 km of bicycle paths, and a third of all journeys are by bicycle. There are more than 5,000 bicycle parking spaces in the city, with more at tram stops for "bike and ride" commuters. The main railway station has parking and other cyclist facilities for 1,000 bicycles. Since 1976 Freiburg has been conducting an active cycling policy at an annual investment of 836,000. In the past ten years a considerable effort has been put in towards further expansion of the cycling network. This has resulted in a coherent, fine-mesh cycling network, connecting all quarters with the city centre and with each other. This cycling network now has a total length of 500 km, of which 160 km are cycle paths (114 km along main roads, 46 km autonomous), 130 km through 30 km/h areas (of which 90 km are cycle lanes) and 210 km on country roads. It is now possible to traverse the city by bicycle without any interruption in an east-west direction, using the car-free bicycle route known as Dreisam, a wide road lining the bank. Another detailed study was performed in It concerned mapping the time each mode of transport took to travel from certain city locations to the Bertoldsbrunnen, a tram-and-bus node in the heart of the city. This map shows that bicycles are the quickest mode of transport for distances until ca. 3 km: from the first layer encircling the city centre it is a fifteen-minute bicycle ride to the Bertoldsbrunnen. This node is within thirty minutes reach by bicycle from practically all over the core of the city, just as quick as public transport. Thanks to the presence of a few quick main roads this takes a car only twenty minutes in many cases. Public transport is quicker than the bicycle only when you start from a few immediate station surroundings in the remotest western quarters. It is not likely that there will be many cities that would even realise the value of such knowledge about competitive positions of different modes of transport. The active cycling policy of Freiburg most certainly contributed to the fact that bicycle use has almost doubled in size since the early 80s as regards local trips. In 1999 Freiburg inhabitants took their bicycles for 28% of their local trips. This is ca. 22% of all trips. At the same time, car use for local trips dropped heavily: from 38% to 29%. All of them together, the environment-friendly modes of transport (public transport, bicycle, walking) cover 70% of all local trips. 7.4 Integral Policy The success of this cycling policy lies mainly in the coherence of overall traffic policy. Cycling policy is an integral component of a traffic policy consistently promoted by the Freiburg s environment association (Umweltverbund) while car use is being discouraged at the same time. Add to this the city s spatial policy, aiming to keep distances short to avoid unnecessary traffic. This has also resulted in new, partly car-free residential quarters like Rieselfeld and Vauban, both situated within cycling distance from the city centre, and an active location policy for large companies and supermarkets. To summarise Freiburg s car free initiatives : The old town centre became car-free in 1973, and in 1990, a 30 km/h zone was introduced for almost all residential streets, except main roads; Page 19 of 22
131 Freiburg introduced a low-cost flat-rate monthly "Environment ticket" for the region-wide bus service in 1991, and there has been a 100% increase in people using public transport since 1980; In the new district of Vauban, if residents sign a contract stating that they will live without a car, the requirement to buy a parking space in the district garage is waived, reducing the cost of their housing; Around 30-35% of the residents have chosen to live without a car. In 2004 and 2005 the city will open two major new tram lines, one from the city centre to Vauban. As a result of these initiatives, motor vehicle use fell from 38% to 32% between 1982 and 1999, in complete contrast to the trend in almost all other central European cities. A cycling plan was drawn up in 1970, and the city now has over 500 km of bicycle paths, and a third of all journeys are by bicycle. There are more than 5000 bicycle parking spaces in the city, with more at tram stops for "bike and ride" commuters. The main railway station has parking and other cyclist facilities for 1,000 bicycles. 8 DISCUSSION AND CONCLUSION The six Smarter Travel cities described in this paper highlight how best practice has been achieved through strong and continuous co-operation between local government and public transport authorities which together prioritise bicycles and public transportation over cars. Cycling policy forms an integral element of each city s overall transport policy, encouraging the use of the bicycle and discouraging the use of the car. Each city has been and continues to be committed to improving bicycle infrastructure and developing bicycle promotion campaigns which encourage their citizens to become sensitive and interested in the daily use of the bicycle. Community engagement has developed Smarter Travel cultures where sustainable transport is regarded as the norm. In addition this best practice has been achieved through integration of transport policy with each city s spatial policy, altering the emphasis of urban planning and development and aiming to keep distances short to avoid unnecessary traffic. This type of urban planning is based on the ides of a compact city, which relies on an integrated transport system to provide a city favouring pedestrians, cyclists, buses and other public transport users. Although the six chosen cities offer unique journeys in terms of achieving high sustainable urban transport use, there are notable parallels which could serve as best practice examples for Irish towns and cities. It is obvious from this precedent study that the main contributing factors which appear to be decisive in achieving Smarter Travel behaviour change comprise community engagement, community involvement, soft measures (information) which support hard measures (infrastructure), support of government local leaders and the removal of incentives for car travel (i.e. penalizing unsustainable travel and rewarding greener alternatives). This study encompasses a wide range of physical interventions and measures to reduce car use which have been implemented through engagement with citizens. All this has been accompanied by behaviour change over time across these European cities which have had a sustained impact. Travel behaviour change programs have an important role to play, however, they alone will not deliver the Department of Transports vision for a sustainable travel and transport system for Ireland, we cannot afford to lose sight of the importance of the whole system and each of its components; the importance of improving the underlying infrastructure combined with the encouragement of travel behaviour change. REFERENCES Andersen, Troels, Civil Engineer, and Project Manager (2007). The Cycle City A Brief Introduction City of Odense, Nørregade 36-38, DK Odense, Denmark Alyse Nelson, University of Washington, Seattle (2006). Liveable Copenhagen The Design of a Bicycle City, Center for Public Space Research, Copenhagen. Denmark City of Malmö (2010). Sustainable City Development; Mobility. City of Malmö: Malmo, Sweden. Accessible at: Page 20 of 22
132 Development/Mobility.html City of Malmö (2009). PDF Archive on Sustainability in Malmö; Transportation, Improving Malmö s Traffic Environment. City of Malmö: Malmo, Sweden. Accessible at: Development/PDF%20archive/pagefiles/SMILE_M almo_-final-brochure.pdf City of Malmö (2009). PDF Archive on Sustainability in Malmö; Malmö in General, Sustainable Malmö. City of Malmö: Malmo, Sweden. Accessible at: Development/PDFarchive/pagefiles/susmalmo_kortis_eng_091118we bb.pdf City of Malmö (2010). Sustainable City Development; Sustainable Urban Planning in Malmö. City of Malmö: Malmo, Sweden. Accessible at: Development/Sustainable-Urban-Planning.html City of Copenhagen ( ). Cycle Policy. City of Copenhagen: Copenhagen, Denmark. Accessible at: ykelpolitik_uk.pdf City of Copenhagen (2008). Bicycle Account. City of Copenhagen: Copenhagen, Denmark. Accessible at: Copenhagen/SubsiteFrontpage/InformationAndServ ices/cityandtraffic/cityofcyclists/~/media/5bcc C20D62914D DC07718A54A.ashx City of Copenhagen (2009). City of Copenhagen, Cycle Statistics. City of Copenhagen: Copenhagen, Denmark. Accessible at: Copenhagen/SubsiteFrontpage/InformationAndServ ices/cityandtraffic/cityofcyclists/cyclestatistics. aspx City of Copenhagen (2010). City of Copenhagen, Green Urban Mobility. City of Copenhagen: Copenhagen, Denmark. Accessible at: Copenhagen/SubsiteFrontpage/InformationAndServ ices/cityandtraffic.aspx City of Copenhagen (2009). City of Cyclists- Copenhagen Bicycle Life. City of Copenhagen: Copenhagen, Denmark. Accessible at: 1_GektAxfnoq.pdf City of Odense (2010). National Cycle City (Cycleby) Website. City of Odense, Odense, Denmark. Accessible at: City of Groningen (2010). Traffic and Transport Policy. City of Groningen, Groningen, The Netherlands. Accessible at: Colin Buchanan and Partners (2003), Transferability of Best Practice in Transport Policy Delivery, Final Report - Copenhagen, Scottish Executive Transport Research Series Danish Ministry of Transport (2000). Promoting Safer Cycling: A Strategy. Copenhagen: Danish Ministry of Transport. Danish Ministry of Transport (2007). Danish National Travel Surveys. Copenhagen, DK: Danish Institute of Transport Research. Dutch Bicycling Council (2006). Bicycle policies of the European principals: continuous and integral. Fietsberaad Publication. Amsterdam, the Netherlands. Accessible at: en/fietsberaad_publicatie7_engels.pdf Dutch Bicycling Council (2009). Cycling in the Netherlands Fietsberaad Publication. Amsterdam, the Netherlands. Accessible at: en/cyclinginthenetherlands2009.pdf Freiburg Green City (2010). Sustainable Mobility. City of Freiburg, Freiburg, Germany. Accessible at: 545_l2/index.html Page 21 of 22
133 John Pucher and Ralph Buehler (2007). At the Frontiers of Cycling: Policy Innovations in the Netherlands, Denmark, and Germany. Bloustein School of Planning and Public Policy Rutgers University 18 November 2007 Swedish Institute for Transport and Communications Analysis, SIKA (May 2004). Follow-up of the Swedish Transport Policy Objectives, Stockholm, Sweden 2004 Internet Resources: Bike City Copenhagen. URL: City of Malmö Statistics. URL: Copenhagenize. URL: Cycling Embassy of Denmark. URL: The Danish Cyclists Federation. URL: nglish European Cyclists Federation. URL: European Urban Audit. URL: Freiburg. URL: 2/index.html Page 22 of 22
134
135
136
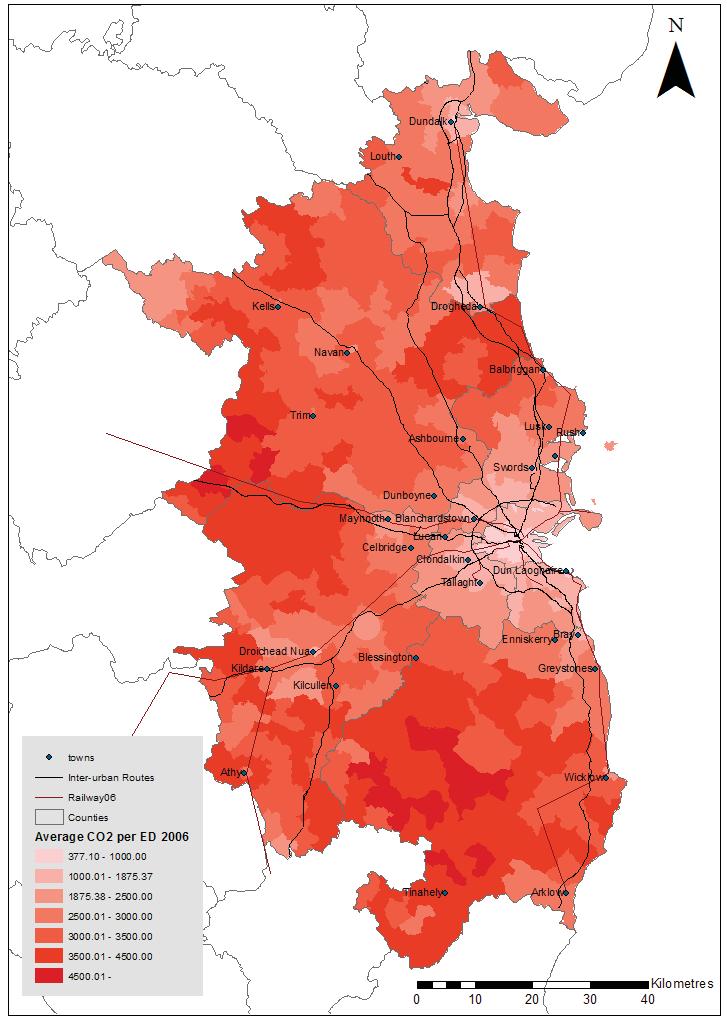
137
138
139
140
141
142
143
144
145 TRANSPORTATION SCENARIOS: LOOKING FORWARD AND LOOKING BACK IN FOUR EUROPEAN CITIES James Wickham Department of Sociology, 3 College Green, Trinity College Dublin, Dublin 2, Ireland; jwickham@tcd.ie ABSTRACT The post World War II history of European urban transport in cities involves trajectories, switching points and socio-political choices. The paper contributes to our understanding of such choices by confronting the results of a scenario-building exercise carried out with urban experts in four European cities in year 2000 with subsequent developments. Already by 2000 urban experts were committed to sustainable mobility in terms of both spatial planning and transport technologies. They tended to link these aspirations to the broader European social model. However they did not expect such aspirations to be realised. Subsequent developments in the four cities show that while experts expectations in relation to urban transport technologies were overly pessimistic, the cities have not moved significantly towards sustainable mobility and new forms of car-based mobility have emerged. Keywords: Sustainable Mobility, Scenarios, Urban History 1 INTRODUCTION Urban transport policy is interwoven with urban planning policy: choices of transport technologies and transport systems are to some extent choices of urban form. In other words, choices of technology are certainly not just technical choices and not even purely economic choices. Precisely because such choices involve values and politics in the broadest sense, they are open to social scientific analysis: we can ask why and how and for whom specific choices were made. Such social science also has to be historical: transport choices made in the past have very long term consequences, transport choices are themselves embedded in long lasting historical structures. Furthermore, transport choices inevitably look to the future: they involve assumptions about what will happen and, even implicitly, aspirations as to what should happen. This paper addresses the last of these issues. It is about urban experts expectations and aspirations for transportation in four European cities in 2000 and what happened to these expectations in the subsequent decade. Experts hoped that mobility in their cities would become more sustainable and less car-based. In fact the reverse occurred. The paper begins by arguing that the development of urban transport involves pathdependent trajectories, in which institutional structures lock in a particular set of technologies, and switching points, which move development in a new direction. One such switching point appears to have occurred in some cities in Europe in the 1970s, and this can be linked to the emergence of a distinctive European social model. This raises the question tackled in this paper: to what extent policy makers across Europe became committed to transport technologies and urban planning which differed from that of the previous period. The paper then outlines research carried in the year 2000 on urban experts aspirations and expectations in four European cities. The main empirical sections of the paper use this research to assess whether these views do show the emergence of a new commitment to sustainable mobility; we examine experts scenarios for the future of their city and their understanding of possible urban transport technologies. The paper then confronts these views with an initial sketch of subsequent developments in the four cities. It concludes with the suggestion that experts in 2000 failed to fully anticipate the development of a new form of postmodern market-based automobilism. 2 PATH DEPENDENCY, SWITCHING POINTS AND SCENARIO-BUILDING Car ownership and car usage have long become absolutely normal in all advanced societies. However, general discussions of automobilism or Page 1 of 15
146 you, you do not need a car to explore a European city you move around on foot and you extend your pedestrian journeys with relatively short distance journeys on public transport. When World War II ended, most of Europe had not yet been shaped by the private car. Photographs of the bombed cities of Europe in the immediate aftermath of the war often show trams presumably on rapidly restored tracks threading their way through the ruins with hardly a car in automobility can detract from the considerable diversity that exists both in the level of car ownership and in the level of car usage. Notoriously for example, car ownership and especially car usage are higher in the USA than in Europe. There are also well established differences between European cities in the extent to which people use for specific journeys cars as opposed to using public transport, or walking or cycling (e.g. Cameron et al, 2004). It is increasingly accepted that such differences have very little to do with the overall wealth of the city rich cities often have low car usage and even low car ownership. Furthermore, within cities car ownership and car usage cannot be simply read off from income or occupation, since car usage also depends on location, life style and even personal ideology (Kaufmann, 2002). The fact that such variations exist increases the plausibility of public policies which attempt to reduce car usage. Despite the growth of empirical sociological and even social historical research on urban transport in the last decade, our understanding of this diversity remains ad hoc and fragmented. Changes in the technological system of automobility (the car system ) needs to be located in broader accounts of social structure and social change. Political economy and historical institutionalism offer one possible framework. Thus we could differentiate between fordist (or modernist) and post-fordist (or post-modernist) forms of automobility. This could link car production and above all car usage to different social structures, different types of employment, different types of economic structure. We could contrast the regular and routinised journeys of the fordist period (home/suburb to work/city centre) with the more diffuse patterns of the contemporary city where most journeys are suburb to suburb and are more dispersed in time. Such long term periodisations need also to be located in different physical geographical contexts. The great metropolises of 19th century Europe were built around a public transport system which was created before the advent of the motor car. By the 1920s cities such as London, Paris and Berlin had systems of trams, metros and suburban rail that allowed their inhabitants to move easily over a large densely inhabited area. In many ways the inter-war period was the golden age of public transport (Wolf, 1996). Unlike in the USA (with the partial exception of New York), these systems were not then destroyed. As any tourist will tell sight. In the 1930s Germany had certainly embarked on its famous programme of Autobahn construction, but in fact Hitler s new motorways were largely empty. It was in Britain, or more precisely Southern England, that the private car first became an item of mass consumption. By 1939 private car ownership had reached two million and the car industry was producing 300,000 cars a year (Stevenson, 1984: 390f): the family car, just like the owner-occupied house in the suburbs, now became part of normal life for the middle classes. This normalisation of the car occurred in the rest of Europe only after World War II. During the 1950s the car became a key symbol of modernity, along with other mass produced consumer goods. Across Europe the car industry was at the centre of the mass production industry and car companies were national champions, often interwoven with the state or even in outright state ownership. The state was also crucial to the consumption of the car, planning and building new motorways, autoroutes and Autobahnen. However, even here Europe remained different to the USA. There the construction of the interstate highway system in the 1950s, claimed to have been the world s biggest construction project, along with the subsequent expansion of domestic airlines, ensured that US railways became marginal for passenger transport except in a few areas of the North East. By contrast, European railways were not destroyed, although many small rural branch lines were closed. There were major investment programmes in many systems after World War II, although they were not able to compete with road traffic especially in freight transport. Furthermore, road construction was uneven, with Britain only beginning a motorway construction programme in the very late 1950s. Nonetheless, through the 1950s and 1960s the general direction of policy was clearly towards the motorisation of cities with American developments usually held out as indicating the future. Although car ownership remained well below US levels, Page 2 of 15
147 urban development usually involved the reducing car usage within urban areas. In the new construction of urban motorways which began to century, would these changes become built into the destroy the fabric of the city. trajectory of more European cities? Above all, During this period there was some limited would car usage finally decline in importance as expansion of underground railways in the very new transport systems developed in tandem with largest cities. In the 1950s underground metro lines more compact urban areas? were built in Rome and Stockholm. However, part Achieving such changes would involve a of the attraction of the underground at this period paradigm shift in urban transport away from autodependence. was precisely that it could relieve congestion on the The sustainable mobility paradigm roads and so facilitate car traffic. In West Berlin by (Banister, 2008) can be thought of as involving the end of the 1960s all the trams had been both technologies of transport and spatial planning. removed, to be replaced by buses and an expanded Central to sustainable mobility is reduced U-Bahn system contrasting with the eastern part expenditure on roads and greatly increased of the city where trams are still in use. provision of public transport. Sustainable mobility From the 1970s onwards however the also involves measures that restrain car use through development paths of some European cities began re-allocating road space and which directly to diverge from those of America, just as at the encourage walking and cycling. Instead of treating same time European welfare states as a whole transport as a derived demand ( predict and became more different to that of the USA. The provide ), such planning tries to reduce the demand radicalisation of the late 1960s and early 1970s for travel, especially car-based travel. It means generated new social movements which contributed designing compact cities with accessible local to a radical change in urban policy. A new urban facilities so that people can choose whether or not aesthetic re-valued the existing urban fabric, areas to own a car. In the most general terms, it marks a of the city centres began to be pedestrianised, plans reinvigoration of the ideal of the European city for urban motorways were slowed and even (Kazepov, 2005), an ideal which at least in Britain abandoned. Within this, and very much part of the had been abandoned by the end of the 19 th century expansion of the welfare state of the decade, urban (Hunt, 2004). public transport was expanded in particular with Given that, as we have seen, political investment in urban rail systems. Differences institutions and social structures have influenced within Europe also grew. Whereas the 1970s and transport technologies in European cities, such 1980s saw a dramatic investment in urban rail in changes in technology in the future will also German cities, there was virtually no investment involve social and political change. However, the within the UK. (Whitelegg, 1988:48f). The 1970s nature of these changes is far from clear and is are therefore a switching point in European urban often contested. For example, in the second half of transport trajectories. Some cities in some countries the 20 th century urban public transport in Europe begin to move down a different path. was almost entirely provided by state owned In the 1990s there was a second wave of urban companies. Today however many such enterprises public transport expansion. Within cities there was have been privatised. While some claim that this an almost complete halt to new road projects, and it will inevitably mean a decline in public provision, became widely accepted that urban transport others argue that it will lead to better services and problems could not be solved by road building. higher usage (Wickham and Latniak, 2010). Public transport was promoted, but now with Furthermore, although compared to the 1950s there slightly different arguments than before. There was certainly has been a greater acceptance across a new concern for the quality of urban life, often Europe of investment in public transport and of linked to notions of urban economic some restraint on car usage in cities, there is no competitiveness. Public transport was one of the universal consensus on individual policy measures, policy areas increasingly appropriated by subnational whether these involve road building, road pricing, governments at urban or regional level. improving suburban rail lines or building new Indeed, public transport became a crucial area of metros. activity for the resurgence of city and regional Once transport technology is seen as even to government across Europe. Furthermore, effective some extent the result of socio-political choices, urban public transport was increasingly seen as then clearly people s beliefs about transport are contributing to environmental sustainability by important. It matters what participants in urban Page 3 of 15
148 experts in four European cities; it also confronts this material with actual developments in the four cities. This section of the paper describes how the original interviews were carried out and how they are re-utilised for the specific purposes of the paper. The interviews formed the end of a project on scenarios of sustainable mobility in European cities which I co-ordinated 2. Two cities Bologna and Helsinki - were chosen as examples of relatively good urban practice: they had explicit policies to reduce car usage, they had well developed public transport and relatively successful urban planning. In both cities political movements in the late 1960s and early 1970s had been decisive in pushing transport away from continued development of the motor car, and such policies had subsequently become part of a broad-ranging consensus within the city and were supported by a broad urban coalition. Two other case study cities - Athens and Dublin - were the exact opposite. They were notorious both for their traffic jams and for their reliance on the private car; they were an international byword for failed urban planning; they had ineffective public transport. Crucially the urban social movements of the 1960s and 1970s had passed them by, and there was no urban coalition to carry forward policies that restrained the private car. The research was carried out by four separate teams, one for each city; overall co-ordination and analysis was carried out by the Dublin team 3. For this stage of the project we invited urban experts and policy makers in each of the four cities to an extended group discussion. This discussion was intended to produce a scenario for sustainable mobility in the city. The scenario was defined as involving both the overall context of mobility and the specific technologies of mobility. Despite our best attempts, in every city meeting politicians from the established political parties were conspicuous by their absence, whereas representatives of the local Green parties attended in Dublin and Helsinki. In Bologna a large proportion of the group was politics consider to be possible, what they want and what they expect, and what connections they make between different technologies and between technologies and their socio-political context. One influential group in policy debates is what we might call the urban experts: urban planners, transport planners, lobbyists and interested academics. These are not those who necessarily make the decisions that matter, not least because many of the important decisions occur almost out of sight of the public political process. Although this too is variable, it does seem to be the case that usually rail projects, whether light rail or metro, have a higher public profile than road-building decisions, even though arguably the impact of a major road scheme is far greater, and that this can only partly be explained by the fact that many road schemes are incremental increases in capacity 1. Equally, planning decisions such as new housing areas or retail parks have major impacts on transport in the city, but they too often occur out of the limelight. Nonetheless, to the extent that there is public debate, urban experts make an important contribution. Accordingly, their views are important in their own right. A shift towards sustainable mobility raises questions about the views of such experts. Firstly, is there a new consensus across Europe amongst such people on the basic principles of sustainable mobility as outlined above? In other words, what changes in urban planning and transport technology do such experts want? Are they agreed amongst themselves? Is sustainable mobility seen as universally desirable and is it defined in the same way across Europe? Secondly, do these experts link their conceptions of sustainable mobility to a broader socio-political context? For example, is environmental sustainability seen as interwoven with social inclusion and social cohesion? For such experts, is market provision inherently inimical to sustainability? Finally, how do such experts evaluate the impact of their own views? They may have expertise, but does this mean that they have influence? Sustainable mobility may be desirable, but do they consider it achievable? Once again, differences in Europe will be important here and will tell much about European cities chances of achieving sustainable mobility. 3 RESEARCH APPROACH In order to answer these questions this paper uses data from interviews carried out in 2000 with urban 1 Of course, the extent to which road building projects are debated is itself a political process. Page 4 of 15 2 Project SOE1-CT of the Targeted Socio- Economic Research Programme (TSER) of the European Commission; reports at 3 Team members were: D. Balourdos, A. Mouriki, K. Sakellaropoulos, E. Theodoropolos, K. Tsakiris (Athens); E. Battalgini, F. Farina (Bologna); M. Lohan, P.Poli, J. Wickham (Dublin); M. Javela, T. Rajanti (Helsinki).
149 The logic of the scenario is that the four different aspects and indeed their component dimensions are all independent. Thus a position on one dimension does not necessarily involve a similar position on any other dimensions. Furthermore, there is no explicit linkage between each dimension and the form of urban mobility. Equally, although the versions of the original spider diagram had been used to construct scenarios in which sustainability was an over-riding objective (Rienstra and Nijkamp, 1998), we made no explicit link between any dimension and environmental sustainability. How and why people make such links is one of the empirical issues we investigated. While the spider diagram is concerned with the overall context of mobility, we also asked experts to evaluate various transport technologies. Once again they were asked to score these in terms of both whether they expected them to be widely used, and whether they wanted them to be widely used, in both cases using the same timeframe as for the scenario. The technologies ranged from increasing the supply of roads, through improved public transport provision to regulation (e.g. road pricing) and alternative technologies (e.g. electric cars). Here again we treated the technologies as independent of each other. Of these technologies, increasing the road supply, whether by new roads or by road-widening, would be inimical to sustainable mobility, whereas all the other technologies could be part of a sustainable mobility package. Whereas the spider diagram was originally to specify different possible scenarios for transport policy (e.g. Rienstra and Nijkamp, 1998), we treat here its elements in different ways. The dimensions or spokes of the diagram mostly refer to the possible context of sustainable mobility policy. We use the diagrams to specify the social, economic, institutional and spatial framework within which the experts saw mobility policy occurring. We do not assume any particular link between these dimensions and sustainability, but ascertain whether the experts themselves made such links. One spoke of the spider is however treated drawn from social activists; in Dublin various types of academics were particularly over-represented. While our original intention was to interview decision-makers in general, the members of the final groups do in fact correspond to those urban experts defined above. To structure the different aspects of the experts views we used a slightly adjusted version of an established transport scenario model (Nijkamp et. al, 1998). This so-called spider model is based on the assumption that transport systems involve a number of inter-related policy aspects spatial, economic, institutional and social. Each aspect can be conceptualised as comprising two distinct dimensions and each dimension involves a continuum between two extreme positions. For example, the spatial aspect of the scenario includes the dimension of urban form. Here one extreme would be the highly concentrated and high density compact city, at the other extreme would be the more dispersed and low density suburbanised city. Figure 1 presents the basic model as adapted from Nijkamp et. al (1998). Figure 1 The Scenario Model For this exercise we asked participants to choose points representing how they would like the city to be ( desired scenario ) and how they expect the city to be ( expected scenario ). Furthermore, because the dimension takes the form of a numerical scale, it is possible to calculate the average value given to each dimension by all participants or indeed sub-groups of them 4. differently. Given that sustainable mobility involves reducing the demand for travel through urban planning, we treat the spatial dimension 4 It should be noted that where this diagram is used to present the scores each dimension has been reversed. Thus for example on the dimension urban form the position diffuse city is at the outer rim of the diagram, while the position compact city is at the inner edge of the diagram. This was necessary in order to generate the charts with Excel while keeping the original scores. Page 5 of 15
150 compact city/diffuse city as a component of sustainable mobility itself 5. Each team followed guidelines for the meeting which had been circulated by the Irish team. The meeting began with a presentation of the key findings of the research project. The team then explained the model and illustrated by showing the scenario for the city which they themselves expected; they also prepared their own desired scenario, but did not present it to the meeting. We then asked the participants to fill out a questionnaire in the meeting. The questions referred directly to the policy dimensions of the model with some additional questions in relation to specific technologies. After this data collection stage, the results were immediately analysed using the SPSS statistics package to generate mean scores of the participants policy choices and preferred policy outcomes. These results were then mapped onto the model and presented to the group towards the end of session. While the questionnaire data was being analysed, the meeting was used to form a focus group discussion. Here the experts were asked to explain the choices that they had made on the different dimensions of their desired and expected scenarios, the extent these took into account environmental and social concerns, whether they felt that their desired scenario was possible within a business as usual course of development, what factors they believed shaped their expected scenario and what would be needed to move in the direction of their desired scenario. Each national team wrote up a report of their meeting following an agreed template. These reports were then edited and collated together with an introduction and analytical conclusion to form the workpackage report for this part of the research project. 5 Proceedings of ITRN2010, 31 st August to 1 st September 2010, University College Dublin, Ireland 4 EXPERTS SCENARIOS Figure 2 represents the average expected and desired views of all four expert groups. On all dimensions except that of European spatial organisation, the experts desired positions are closer to the centre of the web than their expected positions. If as suggested above, the scoring of this dimension was reversed, the picture would be completely consistent. The status of the other spatial dimension, European spatial organisation, is more ambiguous. It could be argued that if urban development occurs in a series chains and zones this is perfectly compatible with the cities themselves being relatively compact, and would reduce travel demand more so than if development is concentred in a few mega regions. The coherence of the spider model would therefore be enhanced if the scoring of this dimension was reversed. 4.1 Experts desired scenarios Figure 2. All experts expected and desired scenarios We begin our analysis by investigating the differences between the cities in terms of the experts aspirations. Figure 3 presents the desired scenarios for the four groups of experts. The spatial aspect generated most disagreement. In terms of regional development (concentration versus chains & zones) most experts wanted what they considered a balanced population development rather than the concentration of growth at a few major centres. However, within the Finnish group there was no consensus. One set of participants welcomed the trend towards concentration of population in a few major urban areas, largely on the grounds that this was the only way they could receive adequate services. In most countries such a deliberate policy of rural depopulation is rarely explicit, though in the past it has been part of social democratic regional planning in Sweden. By contrast, other Finnish experts argued that this move to the large cities undermined the traditional Finnish way of life and was anyway environmentally less sustainable. Page 6 of 15
151 subsidy, with the Finnish group in particular stressing that the reason for this was essential to ensure accessibility was available to all. Even amongst those directly concerned with the actual provision of transport in cities, there was clearly no discernible strong desire for private enterprise participation and deregulated solutions which were already being widely promoted by some national governments and the European Commission. Furthermore, even in the two cities where state owned public transport has been a manifest failure, namely Dublin and Athens, there was no strong pressure for outright privatisation and marketisation. Figure 3. Experts desired scenarios The two societal dimensions are individualisation versus social cohesion and In terms of the institutional aspect of transport exclusion versus social inclusion. Here all the provision, all the groups stressed the role of the experts opted for social cohesion and social state and of public control and regulation. In inclusion. This is hardly surprising, since almost by Helsinki, where there was already some experience definition everyone is in favour of social cohesion of limited competition on the bus lines, the group and social inclusion! This is the sort of position can argued that regulation and market mechanisms can only be explicitly rejected by a clearly formulated be combined and are not necessarily antagonistic. neo-liberal ideology which regards inequality as This was the clearest acceptance of some role for desirable in itself and which values individualism the private provision of public transport. Here so highly that it is prepared to tolerate high levels of however the group insisted that overall public social anomie. Such an ideology remains unusual control was crucial, and that this had to involve in Continental Europe, unlike in the USA. Clearly public control of physical infrastructure. While this most participants regarded social inclusion and debate over the institutional structures for public social cohesion as linked, although interestingly in transport has become commonplace recently, it is the Helsinki discussion it was suggested that social noticeable that nowhere among our groups was inclusion is the basis for individualisation of the full there a strong demand for more private provision. development of each individual s potential. The debate amongst the experts also raised two As far as the layout of the cities themselves was issues that are not usually heard in the conventional concerned, all the experts were opposed to discussion, dominated as it is by the categories of European cities developing as suburban cities on economics or engineering. In Bologna participants the US model. However, there was disagreement in stressed that public transport was public in the each group as to the extent to which their city sense of sociability travelling by public transport should become compact. Thus in Helsinki, some allowed you to meet people, it was part of living in felt that making the city more compact would mean a city with fellow citizens. This rather understated a loss of green space and be unjust or even connection between public transport and public unhealthy. In Dublin one participant argued that: citizenship was also developed by participants from I believe we could be living in a Bologna and Helsinki, who talked of the compact, dense city; a postindustrialised city, in a civilised city importance of moral pressure in getting people not to use cars. It both senses therefore public that is clean and efficient. I don t transport is seen as something belonging to the believe we are going to (Dublin focus public realm, not as simply a technical solution to a group participant) given mobility need. Presumably this We will return to the issue of not getting what understanding of the public nature of public we want later, but it is important to notice that this transport is difficult to reconcile with its private view was not shared by all the Dublin group: provision. I think we don t want to have a tightly Significantly, there was universal support for focussed European city where the financial subsidy of public transport. All experts centre is very dense. I think we are accepted that public transport would require public Page 7 of 15
152 likely just looking at the character of Dublin city as it is we are likely to have a more diffuse shape and I don t necessarily think there is anything wrong with that. In my housing estate, for example, there is a huge big green pitch for kids to play football. I am not a believer, personally, in the European model of apartment living, which is often held up as the great way to do cities. I think it might be good from a transport point of view but not necessarily from a society point of view (Dublin focus group participant). By contrast this notion of the European city was supported unanimously in the Bologna group. For them the city centre was an important source of identity for the citizens, as well as a place for recreation and if possible for habitation. This meant that for the Bologna group, the city as a whole should remain compact, as the Bologna report stated, in what is effectively a summary of sustainable mobility: In the experts desired scenario, the city is an accessible, socially compact and liveable place, where the car becomes a residual means in the economy of mobility (Bologna scenario report) Experts expected scenarios Turning to the future of their cities, the experts were mostly pessimistic. Whereas their desires tended towards the centre of the web, their expectations (with the exception of concentration versus chains & zones ) tended towards the rim. Interestingly, the Dublin experts were the most pessimistic of all the expert groups (Figure 4). 6 The Bologna experts score of 4.2 on this dimension indicates a desire for a very diffuse city, but this seems to be contradicted by their comments. Page 8 of 15 Figure 4. Experts expected scenarios In terms of spatial developments, all the experts expected population growth to be concentrated in the main urban regions, even if they would have preferred a more evenly distributed growth. Rather similarly, the experts all expected a move towards more regulation through market mechanisms and more private provision of transport. Here again the Dublin experts took the most extreme position. Our measuring instrument does not really measure the extent of change from the status quo. The comments however suggest that in both worst case Athens and best practice Helsinki, the experts expected very little actual change, so that state regulation would continue to be more important than regulation through the market, and public transport would continue to be largely provided by publicly owned enterprises. By contrast, in Bologna and especially in Dublin the experts anticipated a substantial shift towards market regulatory mechanisms and the private provision of public transport. None of the experts contributions suggested that they anticipate any major benefits from these changes, and in the Bologna discussion it was suggested that they would create greater problems of co-ordination. As we have already seen, the experts frequently found the dimension organisation of the European economy outside their area of competence and not really relevant to transport issues. In terms of the subsidisation of public transport experts in Athens and Bologna in particular stressed that public transport would always need subsidies, no matter how it was organised. Most experts anticipated a future of greater social inequality with social welfare systems becoming less redistributive. In Athens the experts expected the effects of the growth in social inequality would be softened by the continued importance of the family, thus echoing social policy
153 experts, because of any closer linkage between land use policy and transport policy. writers who have suggested that the family lies at the heart of the Mediterranean version of the European welfare state (Ferrara, 1996). At the same time however the Greek experts foresaw a growth in individualism and a diminishing regard for the common good. In Bologna too a similar theme emerged. Although the experts there foresaw that in the future the social welfare system would continue to restrain social exclusion, they worried that conventional mass participation in politics would continue to decline and that the social welfare system would becoming increasingly disconnected from new forms of politics and less able to tackle new forms of social exclusion. The comments from the Helsinki group were rather more optimistic. They were aware of growing inequality and growing individualisation; and they suggested that both changes were symbolised by the growth of gated communities of new housing. Nonetheless, their optimism derived from the fact that they did not expect such forms of physical and social withdrawal to become normal. Turning to the compact city issue, the dimension we have directly linked to sustainable mobility, only the Dublin experts expected an extensive suburbanisation of their city itself. The reasons for this varied. In Bologna relatively compact cities were seen as inherent in the Italian way of life There isn t the English or American mentality that you work until Friday evening and you stay at home with your wife and children on Saturday and Sunday. In Italy, there is the custom to return to the centre to have access to services, cinemas, restaurants etc. This leads me to believe that there is an alternative to this expansion, in other words, people move out of the city because they are forced to because of conditions but if they can, they stay in an acceptable area in the centre (Bologna focus group participant). In Athens high density would continue because the infrastructure was inadequate for more dispersed settlement, and only in Helsinki would this happen as the result of planning policies. It is often argued that cities land use policy should promote higher density in cities in order to facilitate public transport. Paradoxically however, our scenarios do suggest that some of our cities will remain relatively compact, but not, according to our Page 9 of 15 5 EXPERTS AND TECHNOLOGICAL STRATEGIES As well as completing the spider s web scenarios, the experts also discussed various transport technologies and the extent to which they saw them as desirable and the extent to which they expected them to be used. It is important to notice that these are discussed as technologies, i.e. outside of any specific institutional structure (such as discussed in the scenarios) and without any explicit discussion of costs. Some technologies (physical infrastructure, whether road or rail) would have a high capital cost as well as running costs, all of which would probably have to be subsidised by the state in some form. Other technologies mainly impose actual costs on car users (e.g. parking fees or road pricing) or physically restrain them (e.g. bus lanes). Finally the new technologies (e.g. electrical vehicles) provide alternative transport means within a system which is still based on individual mobility. 7 Repeating the form of analysis used for the scenarios, Figure 5 presents the technologies experts wanted introduced and those which they expected to be introduced. 8 Although roads and rail infrastructure both involve costs, it is noticeable that the experts clearly preferred expenditure on rail systems. The three rail technologies all scored higher than any other technology apart from the new vehicle technologies. However, while the experts did not see roads as particularly desirable, they nonetheless expected them to be built, while conversely they saw rail systems as desirable but less likely to be actually built. 7 Obviously this is a simplification. Subsidies to roads (and cars) operate in different and less transparent ways than subsidies to public transport. Alternative forms of private transport may well involve different forms of private mobility for example, if electric cars have a shorter range and lower speed, they would be less compatible with suburbanisation than existing cars. 8 Desired scores were reported for all four cities; no expected scores were reported for Dublin. However the Dublin report states that while the Dublin experts favoured rail-based technologies over the construction of more roads, they in fact expected more expansion of roads than rail. Dublin expected scores would not therefore undermine the analysis of this section.
154 Greek experts were strongly in favour of ring roads and even supported road-widening within the city. The very limited construction of new roads in Athens before the construction boom of the Olympics was not because of any political decision, but because of general institutional problems. At the same time, streets were already filled with cars. In many other European cities it was already the conventional wisdom of transport specialists that road building merely generates more traffic, but this had little intuitive appeal in Athens. At the time of the research Athens had not had the negative experience of other cities, where new roads have Figure 5. All experts expected and desired destroyed the inner city without solving the traffic technologies problem. In Athens the city was being destroyed - not by new roads, but by cars clogging existing By contrast for regulatory measures (bus lanes, roads. etc.) the experts aspirations appeared more There is also a divergence on the desirability of realistic. Experts wanted some increase here, and a metro system. Metro extensions scored highest in this in line with what they expected to actually Athens and Helsinki, both of which already had a happen. Of the market measures, parking charges metro. By contrast, building a new metro received got a higher expected than desired score, rather low support in Bologna and Dublin, neither whereas the reverse was true for road pricing and of which had a metro at the time. The Bologna reducing parking supply. Arguably the experts result can plausibly be explained in terms of the wanted measures taken which would actually unsuitability of a metro for what is the smallest of reduce car usage, but suspected that these measures our four case study cities. By contrast, even by would merely be introduced to raise revenue detailed plans for a metro in Dublin had 5.1 Experts desired technologies already been discussed for decades, but the metro Figure 6 presents the experts desired technologies was largely posed as a partial alternative to onstreet rail, not, as in Helsinki, as a complement to it. in the four different cities. It shows that the key finding of the aggregate level analysis remains true Interestingly, in Athens a tram system had been at the city level: in each city experts were in favour mooted as an alternative to an extension of the of rail-based solutions and less favourably disposed metro, but the experts give the metro the higher towards road-building. There are however some rating. differences between the cities on this and other In terms of the desirability of controlling car technologies. usage, Bologna emerges as the outlier. Although Bologna was one of the first Italian cities to introduce controls on cars, by 2000 the experience had become increasingly negative. Traffic control in Bologna had become widely seen as simply a restriction on citizens wishes, rather than as part of a new and improved mobility for all. The Bologna reports also lead to the suggestion that restrictions on car usage should involve some appeal to social citizenship or social capital an asset that appeared to be declining in Bologna. 9 Figure 6. Experts desired technologies In terms of road building, Athens was unusual. Much more so than their colleagues elsewhere, the 9 Another term for social citizenship could be social capital (Putnam, 1993). It is paradoxical that the term was introduced into social science by Robert Putnam in his study of civic activism in North-Eastern Italian cities such as Bologna! Page 10 of 15
155 Finally it is worth noting that pedestrian important, they hoped to see the introduction of subways are often viewed negatively - as dangerous more environmentally friendly vehicles and fuels. and unattractive spaces - while new vehicle and fuel Crucially, while they supported measures to technologies appear as self-evidently desirable to directly restrain car usage (road pricing, parking all. fees, parking controls), they considered all forms of rail-based public transport to be more important. 5.2 Experts expected technologies Turning to the spatial planning aspect of the Disaggregating the experts expected technologies paradigm, the experts were fundamentally shows that within each city it was still true that committed to the idea of the compact city and often expectations for road building were higher than for identified this as a specifically European model. rail infrastructure (Figure 7). In Bologna scores for Our interviews suggest therefore the emergence of both forms of road building were higher than those a clear European policy consensus in support of for all rail forms; in Athens the only exception to sustainable mobility and furthermore, that this is this is the metro (doubtless partly because the metro defined in broadly the same way across Europe. is at the moment the largest transport project within Furthermore, urban experts did appear to see the inner city area). Only in Helsinki did rail sustainable mobility as linked to an important role projects come very close to road-building, and in for public authorities and the state. Although they Helsinki too, all three forms of rail infrastructure gave importance to market principles in the general scored highly. In the experts expectations organisation of the European economy as a whole, therefore, Helsinki came closest to moving away they clearly wanted public transport to be from merely continuing to invest in the existing car subsidised and were somewhat sceptical of the system. Finally it should be noticed that Helsinki is effectiveness of private provision and of regulation also remarkable for the extent to which all through the market. The Finnish experts were the technologies received relatively high scores in only group with experience by 2000 of the private other words, the experts in Helsinki expected their provision of public transport (recall that Helsinki s city to be implementing a broad range of measures bus routes were already provided by private to improve mobility. companies). While their experience had been positive, they stressed the importance of overall public direction and regulation. Finally, this stress on the role of the state went together a desire for greater social inclusion and for some restraint on pure individualism. Transport, for these experts, did seem to be implicitly part of what I have elsewhere termed the European social model (Wickham, 2002; Alber, 2010). If our experts wanted sustainable mobility, they were however not very optimistic that it would be achieved. They expected road building to continue more than they would hope, and public transport to be expanded less than they would desire. Although they were more hesitant, they also expected suburbanisation to continue. For them, the compact Figure 7. Experts expected technologies European city might be an ideal, but the reality lay more in the past than in the future. They expected institutional developments to favour private 6 EXPECTATIONS IN CONTEXT These interviews suggest that already by 2000 provision and regulation through the market. Here European urban experts had become advocates of however there was an important divergence what Bannister later termed the sustainable mobility between the concerns of these urban experts and paradigm. They preferred the expansion of public those of many urban transport policy makers. transport in all its forms over continued road Although the dimensions of the scenario building building. Indeed, only in Athens was there any real exercise focused strongly on issues of market support for any new road projects at all. While they versus state regulation and provision, such accepted that private cars would continue to be questions did not particularly concern them. Page 11 of 15
156 Privatisation, deregulation, competitive tendering part of this paper suggested that motorisation was for public service contracts all the institutional partly halted in some cities in Europe during the innovations that were already attracting much 1970s. Of our two case studies, both Helsinki and attention at national and EU level all played in Bologna experienced switching points in the relatively little role in the open-ended discussions. late 1960s and early 1970s: the first In other words, such solutions appeared to these pedestrianisations in the Centro Storico and the experts at least as at best marginal and at worst experiments with free public transport in Bologna, irrelevant to actually tackling the transport issue in the rejection of the Smith-Polvinen urban motorway their cities. And finally, the experts saw the plan in Helsinki. These social movements were broader social context in gloomy terms: they might part of a process which moved these two cities desire more social equality and more social capital, decisively away from continued fordist car but what they expected was a society of greater dependency. However, such changes are not inequality and greater individualism. necessarily permanent. For example, also in the There were also significant differences between 1970s social movements helped to halt a massive the experts. These confirmed and illuminated the programme of urban motorways in Melbourne. systematic differences between the four cities that However, in recent years there has been a revival of emerged elsewhere in the research. In the study as large scale road construction in the city, financed a whole Athens and Helsinki were our extreme by public private partnership and linked to a new cases, respectively the worst and the best cities ideology of urban growth and competitiveness in terms of car usage and car dependency. In these (Davision, 2004). two cities the experts aspirations and expectations In terms of transport technologies many of the were relatively close to each other. In Athens the experts pessimistic expectations have not been situation was so bad that our experts aspirations realised. The expansion of rail-based transport has appeared to have been lowered in line with their been on the policy agenda in each of our four cities. expectations, while in Helsinki the experts The most dramatic case has been Athens. By 2010 aspirations were really for minor improvements the city had restructured suburban rail lines and within what they considered already a reasonably integrated them with an entirely new tram system adequate status quo. By contrast, in both Bologna and a vastly expanded metro. By the same year our and Dublin the situation appeared much less stable. other worst case city, Dublin, had two In Dublin, the experts aspirations diverged (unconnected) light rail lines and improved dramatically from their expectations, suggesting a suburban rail including several new stations. In pent-up frustration which perhaps reflected the Helsinki there had been some minor extensions of contrast between the ambitious plans of the key the tram system, some enhancement of the metro, transport authority (DTO, 2000) and the reality of and work had started on the long debated major congested roads and inadequate public transport. In extension of the metro to the western city of Espoo. Bologna, the experts looked nervously into the Only Bologna saw no extension of rail transport future, expecting an erosion of the political within the city, although discussion of a new light structures that had sustained the city s pioneering rail line centring on the nearly completely rebuilt initiatives in the past. We now turn to evaluating mainline railway station does continue. In all four these expectations. cities, as elsewhere in Europe, there has been a The original research project originated in the clear trend to maintain and improve the city centre belief that the current levels of car usage in as a leisure and tourist destination, what has been European cities were a major threat to called museumification (De Frantz, 2005), and environmental sustainability. However, we this does require improved public transport. Dublin deployed our competence as social researchers not and Athens also saw additional restraints on car to investigate this issue directly, but to ask about usage in the city centre, even though Dublin s the possibilities and implications of change. The historic College Green continues to be a traffic car is central to contemporary life: realistically, intersection (albeit with bus lanes). how could a reduction in car usage be achieved and Nonetheless, facilities for the motor car have what would be the social implications? also been enhanced. In the immediate environs of The scenarios provided one starting point. The all four cities motorway construction has continued experts aspirations and expectations, provided (e.g. completion of the Helsinki-Turku motorway evidence as to the possibilities of change. The first and an entire inter-urban motorway network in Page 12 of 15
157 scenario discussion the experts were clear that the Italian preference for relatively compact cities would persist and an important role for the state would continue to be important, Bologna appeared as a city where car dependency could well be less controlled in the future. These predictions have been borne out. Bologna in fact is the only one of our four cities in which there has been no expansion of public transport infrastructure in the last ten years. The remarkable feature of the Dublin scenariobuilding was the experts dystopian vision. While those involved in policy formation argued for radical solutions (a very compact city with a strong reliance on rail transport), they were pessimistic as to whether such solutions would be implemented. Shortly after our meeting, the body charged with developing a transport strategy for the city published its proposals for the period until 2016: whereas in % of all journeys to work in the Dublin area were by car, it was planned to reduce this to only 37% in 2016 (Dublin Transportation Office, 2000). While it is indeed noteworthy that such radical plans were being formulated in Dublin (Ellis and Kim, 2001), in 2010 such a change now seems totally implausible. Finally, the Helsinki situation suggested the traditional maxim If it s not broke, don t fix it. Throughout the project Helsinki consistently emerged as a best practice case, with the highest levels of public transport usage and low car usage and low car dependency. This despite the fact that the institutional structures were the more marketoriented options in the scenario. The discussion during the scenario building continually raised the linkage between citizenship, public spaces and public transport, all centred around a positive evaluation of powerful local government. Indeed, Helsinki is the only case of all our cities where public authorities had clear plans which they appeared to have a realistic chance of implementing. Ireland). Within the cities there has been the construction of massive urban motorways in Athens and of the Port Tunnel in Dublin, although especially the latter has been justified on environmental grounds as taking traffic out of city centre. In terms of spatial planning the experts worst expectations have been fulfilled. Everywhere urban sprawl has continued, with Dublin leading the pack. Indeed, Dublin s sprawl was highlighted as an example of bad planning by the European Union (European Environmental Protection Agency, 2006), and this before the final splurge of the Celtic Tiger. As we have seen, the compact city is a core component of the sustainable mobility paradigm. Sprawl is usually measured simply by population density, yet the link between density and car usage is not actually straightforward. On the one hand, some Scandinavian cities, such as Helsinki but also Copenhagen, have low overall density but effective public transport, largely because development is clustered around public transport nodes. On the other hand, car usage is rising in high density cities such as Athens, just as it is in newly affluent but compact cities of Asia. Reviewing the evidence to date a preliminary assessment is that by 2010 there had been no major shift away from car usage and indeed car dependency, with the possible exception of Athens. Of all four cities, Athens had appeared most clearly locked into its original trajectory, but partly because of the 2004 Olympics a series of major infrastructural projects have transformed public transport provision (extensions to the metro, reconstruction of the suburban rail line, a new tram system). In addition, institutional changes have improved the integration of the public transport system. Nonetheless, these prestige projects have made relatively little impact on overall levels of car usage. Bologna turns out to be the most negative city from the perspective of sustainability. Having once stood at the forefront of transport change in Europe (Jaeggi et al, 1977; Topp & Pharaoh, 1994), the city appears to rejecting the trajectory of the last thirty years. This was in fact in line with the findings of our scenario exercise. The discussion suggested that a growing individualism, allied to political changes, had already begun to undermine the collectivist (and rather top down ) solutions of the previous generation. The measures needed to directly control car usage were seen as particularly unlikely to succeed in Bologna. Although in the Page 13 of 15 7 CONCLUSION By the year 2000 many urban experts across Europe accepted what has been termed the sustainable mobility paradigm. As we have seen, in our four cities experts expressed a clear preference for investment in rail-based public transport over further road-building; they favoured restraining car usage; they hoped to limit urban sprawl; for them the European city was a compact city. Sustainable mobility thus involved both technologies of mobility in the broadest sense and spatial planning.
158 Copenhagen have an overall low population density but their spatial planning and extensive public transport make mobility more sustainable. The claimed inevitable domination of the automobile also ignores the linkage between sustainable mobility and social structure in its broadest sense. Our experts were challenging fordist automobility, where the private car is facilitated by massive expansion of publicly funded roads. Today the family car is as outmoded as the family telephone: the car, like the mobile phone, is individualised. The infrastructure which promotes this automobility is increasingly privately financed through various forms of public private partnerships. Just as our experts linked sustainable mobility to other features of European society, so new forms of automobility appear to be linked to the erosion of European social structures by financialisation and individualisation, to the destruction of public facilities and public spaces by an expanding market. In this increasingly unequal society, urban ideals become the leisure ideology of the affluent, but for much of the population, the car and its unsustainable environment remains an essential, if expensive, necessity. In far away Melbourne too the car wars of the 1970s have led to a new defeat in victory: Walking or cycling to work from a warehouse apartment, drinking caffe latte in a sidewalk café, sociability rather than seclusion are the new urban ideals. Now it is the poor, marooned in far suburbs, who are most dependent on their cars, and most vulnerable to the rising costs of urban sprawl (Davison, 2004: 261). For these experts, sustainable mobility was linked to a strong state, restraints on social inequality and extensive social cohesion (social capital). For them, as for enthusiasts of the European Dream, environmental sustainability was interwoven with social structure in a distinctively European way (Hill, 2009; Rifkin, 2004). Yet our experts did not expect such aspirations to become reality. The gap between aspiration and expectation was lowest in Athens and Helsinki, but for very different reasons. In Athens aspirations were not quite so clearly within the framework of sustainable mobility as elsewhere, and so were more consistent with the anticipated (and less sustainable) future. Only in Helsinki did experts anticipate that their aspirations towards sustainable mobility might be achieved. By contrast, in Bologna and in Dublin, experts looked to the future with trepidation. They anticipated a move away from sustainable mobility and they linked this to (to them) undesirable changes in social structure and political institutions. In fact in relation to technology per se our experts were perhaps over pessimistic. The worst case city, Athens, saw a massive expansion of railbased transport, while rail was also expanded in Dublin. Unlike in the USA, some rail transport is increasingly the norm in European cities. However, what is less obvious is that road building and motorisation have also continued, so that sustainable mobility technology is probably further away than ten years ago. In relation to the spatial planning aspect of the paradigm, here too the gap between aspiration and reality has probably increased. In our four cities, but especially in Dublin, our experts gloomy (to them) expectations have been fulfilled: the compact European city remains an ideal of the past rather than a realistic aspiration for the future. For some researchers this is hardly surprising. They consider that urban sprawl is the inevitable outcome of greater individual mobility, itself an inevitable result of greater individual choice resulting from economic growth. Accordingly, sustainable mobility has to mean more environmentally friendly technologies above all electric vehicles (e.g. Rienstra and Nijkamp, 1998). Yet such arguments ignore the sheer variation of urban form and urban transport within Europe. At its most extreme, a few cities such as Munich and Bilbao with very good public transport and strong urban government have been able to limit sprawl (EEA, 2006); cities such as Helsinki and REFERENCES Alber, Jens (2010). 'What the European and American welfare states have in common and where they differ...' Journal of European Social Policy 20.2: Banister, David (2008). 'The sustainable mobility paradigm' Transport Policy 15.2: Cameron, Iain, T. J. Lyons and J. R. Kenworthy (2004). 'Trends in vehicle kilometers of travel in wolrld cities, : underlying drivers and policy responses.' Transport Policy 11.3: DTO - Dublin Transportation Office (2000). A Platform for Change: Outline of an integrated transportation strategy for the Greater Dublin Area Page 14 of 15
159 2000 to Dublin: Dublin Transportation Wickham, James (2002). The End of the European Office. Social Model - Before it Began? Employment Davison, Graeme (2004). Car Wars: How the car Research Centre, Trinity College Dublin. Briefing won our hearts and conquered our cities. paper for Infowork project. Australia: Allen & Unwin. Wickham, James and Erik Latniak (2010). De Frantz, Monika (2005). 'From cultural 'European urban public transport: Towards a single regeneration to discursive governance: Constructing European employment model?' Work the flagship of the 'Museumsquartier Vienna' as a Organisation, Labour and Globalisation 4.1: 160- plural symbol of change.' International Journal of 174. Urban and Regional Research 29.1: Wolf, Winfried (1996). Car Mania: A critical EEA - European Environmental Agency (2006), history of transport. London: Pluto Urban Sprawl in Europe: The ignored challenge. Luxembourg: Office for Official Publications of the European Communities. Ellis, G. and J. Kim (2001). 'Dublin'. Cities 18.5: Flynn, Brendan (2008). The Blame Game: Rethinking Ireland's sustainable development and environmental performance. Dublin: Irish Academic Press. Hill, Steven (2010). Europe's Promise: Why the European way is the best hope in an insecure age. California UP Hunt, Tristram (2004). Building Jerusalem: The rise and fall of the Victorian City. London: Weidenfeld & Nicholson. Jaeggi, Max et al (1977). Red Bologna. London: Pluto. Kaufmann, Vincent (2002). Rethinking mobility: Contemporary sociology. Aldershot: Ashgate. Kazepov, Yuri (2005). 'Cities of Europe: Changing contexts, local arrangements, and the challenges to social cohesion.' Yuri Kazepov ed., Cities of Europe, pp Nijkamp, Peter, S. Rienstra and J. Vleugel, (1998). Transportation, Planning and the Future. Chichester: John Wiley & Sons. Putnam, Robert D. with R. Leonardi & R. Nanetti (1993). Making Democracy Work: Civic Traditions in Modern Italy. Princeton UP. Rienstra, Sutze and Peter Nijkamp (1998). 'The role of electric cars in Amsterdam's transport system in the year 2015: A scenario approach.' Transportation Research D 3.1: Rifkin, Jeremy (2004). The European Dream. London: Polity. Stevenson, John (1984). British Society Harmondsworth: Penguin Topp, H. And T. Pharaoh (1994). 'Car-free city centres.' Transportation 21.3: Whitelegg, John (1988). Transport Policy in the EEC. London: Routledge. Page 15 of 15
160 MANAGING CAR DEPENDENCY: REVIEW OF WORLD CITIES EXPERIENCES AND LESSONS FOR THE UK Waseem Akram 1, Julian Hine 2 and Jim Berry 3 1. School of the Built Environment, University of Ulster, Newtownabbey, Northern Ireland; akram-w@ .ulster.ac.uk 2. Professor of Transport, School of the Built Environment, University of Ulster, Newtownabbey, Northern Ireland; jp.hine@ulster.ac.uk 3. Professor in Urban Planning and Property Development, School of the Built Environment, University of Ulster, Newtownabbey, Northern Ireland; jn.berry@ulster.ac.uk ABSTRACT Car dependency is a critical issue facing towns and cities across the UK. Recent rises in car ownership combined with stability in the patterns of their use (Vkms) is a crucial policy issue which requires attention in the development of an adequate policy response. City structure, land use patterns, urban densities, socio-economic characteristics, ample parking spaces, low investment in public transport service provisions and its limited use are the key factors for increased car journeys in cities. The spatial changes combined with rapid growth of car traffic have adverse effects on the environment, road safety and health. Responses to make car less attractive by levying high taxes on car use, encouraging alternative transport modes, mixing of land uses and traffic management measures have been effective in many world cities. The paper explores various policy measures implemented internationally to manage car dependency. The review of policy responses identifies the range of experience in terms of transport and development strategies to control car usage and ownership. Furthermore, an assessment of car dependency nature and policy approaches adopted in UK rationalise the policy objectives, examine adequacy of the available policies and lessons from international experiences to limit car use in cities. Keywords: Car dependency, Policy, Transportation, Cities. 1 INTRODUCTION Sustainable transport options for the city have become a key issue in delivery of an effective transport policy for cities. In last few decades, the car use per person has risen significantly across the Europe and Asia (Kunert, 2007; Kenworthy, 1999). Responding to the trend, car has dominated other transport modes across the UK (RCA, 2009). The radical shift in the life styles, increased income levels, improved economic opportunities, and increased participation in social and leisure activities has resulted increased car trips in cities (Abrahamse et al, 2009; OECD, 1995). People are now heavily dependent on cars for their scheduled (essential) and occasional journeys due to the advantages of time, convenience, privacy and until recently cost. This preferential choice of car use has led to increased levels of car dependency. Economic, social and environmental costs associated with rising car journeys have challenged the allocation of resources to development activities and the environment. Policies aimed at the reduction of car dependency and an increase in the role and mode share of public transport, are high on the world s political agenda to satisfy demands for sustainable development and climate change objectives (CBT, 2009). In early 1950,s world population was 2.6 billion with 50 million cars on the roads (Newman et al, 2008). In 2000, the population numbers crossed 6 billion (UNFPA, 2007) with massive increase in automobiles approaching 500 million. This growing car ownership and its habitual use in last six decades have threatened the sustainability of urban areas. Recently, the world population have reached 6.7 billion (2008) with half of the population living in urban areas driving 600 million cars on world s roads Page 1 of 22
161 ( 2010). With current growth in car traffic, it is expected that number of motorised vehicle will cross 1 billion by year 2050 (Gauzin-Müller, 2002). Past and present trends of transport supply dominated by private automobiles are challenging the policy makers not only to manage growth of cars in world cities but also to safeguard against the impacts of income households reveal that cars are used for 45 percent of the daily household trips and accounts for 65 percent of total travel mileage. More than one third of households own a single car and 70 percent of adults have driving license. The current research study indicates that use of a car is more frequent for leisure trips (RCA, 2009). environmental damages, accidents, road congestion and high fuel consumptions. Recent rises in car ownership combined with stability in the patterns of their use is a crucial policy issue which requires attention in the development of an adequate policy response. Dispersed development patterns, increased land values in the core city, raised income levels, social changes and household s travel behaviours are the key factors for increased travel demands within urban areas (kenworthy, 1999). Cars are being identified as the most space intensive mode of urban transport (Crawford, 2002). The benefits associated with the car use (high speed, door to door access, multiple choices, privacy and safety) have resulted in an expansion in car use (Moriarty, 2008). The shift in travel behaviour away from more public modes of transport has caused social, economic, environment and management problems. As a consequence, increased carbon emissions, higher noise levels, fuel demands, congestion, space demands and road accidents are threatening the urban quality of life (Mayer et al, 2007). Moreover, people who do not own a car have been socially excluded to access particular shopping, leisure and employment locations in a city (Steg, 2003). The disadvantages of car dependency are apparent within individual and groups, but still car use is rising in most countries including UK; whilst government objectives to reduce car dependency and promote sustainable transport modes (DfT, 2005e & 2008g; Goodwin, 1994; RAC, 1995). The UK is facing challenges to manage transport system in cities that is heavily dependent on cars despite difference in their city structures and transportation patterns (CfIT, 2007). An increase of 28 percent in the car ownership has been experienced from 1994 to 2004 in the UK (Clark, 2009). The major factors contributing to the increase in car ownership are household income, size and composition. The statistics for the National Travel Survey for low Growing car use is a strong barrier to achieve sustainability objectives in world cities. Recognising the fact, many cities are attempting to attain mode shift objectives by restricting car ownership and use. The informed policy measures, such as traffic calming, pedestrian and home zones, road pricing, multi-modal public transport system, travel demand management, behavioural changes, parking controls and increased share of walk and cycling in daily travel attempt to minimise the impacts of growing car reliance in many world cities (CfIT, 2005). Given the fact that many UK towns and cities facilitate private motor cars at the direct expense of public spaces and other city features; the review of car dependency nature and response of various policy measures within international cities is crucial to explore transport policy options for the UK. 2 RATIONALE OF THE PAPER The extent and nature of car dependency problem is different in the world cities depending upon the rate of car ownership, availability of transport infrastructure, diversity in pricing policies, significance of public transport network in their usage and the land use transportation interaction, government investments and priorities, socio-economic factors and household travel behaviours. The paper describes common trends and nature of car dependency (vehicle ownership, vehicle use, quality of public transport and use, share of public transport in motorised travel and mode split) within international cities, compares transport policy objectives and measures implemented, and appraise success of strategic interventions in delivering policy targets to manage transport demands and restricting car use. The lessons from international experiences to control and manage car dependency in urban areas have been reviewed as a knowledge contribution towards development and delivery
162 of sustainable transport policy objectives (reducing car dependency) across the UK. 3 LITERATURE REVIEW 3.1 Land Use pattern and car dependency The amount of travel in a city is assessed by parameters of travel behaviour and spatial planning (Souche, 2010). Many researchers believe that intensive spatial changes in the planning of existing and new developments with limited improvement in transport infrastructure and services have altered the movement patterns, transport demands and mode choices of the people. These changes in the spatial patterns of cities have resulted in high ownership and use of the private cars (Sinha, 2003). The research studies result indicate current decentralisation trends in most European cities as a major cause for growing car ownership across the Europe and UK (Hansen, 1993, Gillespie, 1999 & Giuliano, 2005). The research and development theories on this particular topic consider urban density as a most influencing indicator affecting the pattern and patronage of the urban transport system in a city. Higher residential densities Compact Development having mixed type land uses and reduced trip lengths encourages the viability of public transport operations, walking and cycling modes while Dispersed Development tends to separate activity areas by large distances and are attractive by private motor car journeys as long as public transport network is not available. Therefore, the existing land use patterns of a city defining locations and distances amongst work places, shopping areas, schools and neighbourhoods have significant value in assessing amount of travel, journey patterns and movement behaviours impacting people s decision to own and use a car for daily travel needs. 3.2 Factors influencing car ownership and use The research studies indicate that decision to own a car at individual level is medium term in nature influenced by variables of residential location and employment places (Naess, 2006). The variation in patterns of car use is associated with the parameters of age, gender, geography and income levels of the population. The other important parameters are the availability and quality of public transport, transport infrastructure and trip cost. All these factors combine together in arriving at the decision by individual or household to use a car (Acker, 2010). In older parts of many cities, local shops and services have been shifted away from neighbourhoods due to regeneration policy previously accessible by walking to long distances for which local people started to travel by cars to benefit from those local services, thus increasing traffic volumes on neighbourhood streets (CBT, 2009). Most recently, the development patterns of new housing locations planned without expanding public transport networks are responsible for car oriented developments. The increase in the economic status and wealth of a family also give rise in private car usage for essential and occasional journeys. The rise in per capita income decreases the relative price of automobile travel and people find private cars more attractive due to high speed and time savings (Ingram and Liu, 1999 & Giuliano, 2005). Ingram and Liu, analyse the relationship between the income elasticity of demand for private cars, and their use. The study results indicate that car use increases with rise in the income despite variations in the elasticities. The research also observed the income elasticities of motor vehicle use less than one which are smaller than the long-run income elasticities of motor vehicle ownership, suggesting that motor vehicle use increases less rapidly with increases in income growth than motor vehicle ownership does (Kain, 2001). Given the relationship between fuel prices and car use, it was observed that the fuel prices have an elastic demand and use of private cars would decrease with increase in the fuel price (Hanly et al., 2002; Holmgren, 2007). Use of public transport is more elastic to fare variations and decrease in fares would increase patronage of public transport (Paulley et al., 2006). The change in prices effect the travel demand and use of particular transport mode. The demand for the private cars will be substantially increased with decrease in the user cost or increase in household income and waiting times for public transport (McFadden, 1974). Similarly, the demand for public transport increases with decrease in waiting time, fares and improved service quality of public transport against rise in cost by car travel (Souche, 2010).
163 3.3 Impacts of car dependency congestion and inconvenience due to increased car dependency (Pooley, 2005). The negative effects of car dependency have threatened the metropolitan cities of the world. Recognising the role of transport policies and strategies to respond the global sustainability targets of low carbon economies, the impacts of increased car traffic are the major challenge (Kenworthy, 1996). The global impacts of car dependency are on the energy cost and green house emissions. The local impact of automobiles dependency in cities of Australia, Europe, USA and Developing Nations are emissions, noise, gridlocks on roads and spaces wasting precious hours and destruction of natural landscape (Newman, 2006). Other problems like social exclusion of certain groups of society who doesn t own a car and isolation of the suburban areas are also an outcome of the automobile dependency (Steg, 2003; Kenworthy, 1996). Car dependency is, however, a major threat to sustainable transport initiatives (Han, 2010). People are increasingly cognisant of the damaging impacts of the car traffic on the built environment and quality of life (Newman, 2006). The international responses to increased car dependency are the ongoing development and implementation of fiscal policy measures, road pricing schemes and strict parking controls. Growing policy concerns with climate change, social exclusion, energy consumption, sustainable transport and public health have forced the government to address the challenge of car dependency at their national and local levels. The transport sector is a major contributor to CO 2 emissions and shares one quarter of the carbon emissions in the UK (Hickman, 2010). The impacts of car dependency are evident in the form of large concentration of parking demand in the business areas of cities, major employment centres, commercial and retail facilities and leisure areas. Allocation and management of parking space in those highly car concentration zones are tough decision for the authorities whilst to high land values in central city and demand for offices and real estate market potentials. The construction of multi-storey car parks in those locations creates visual impact on city image and streetscape; while on-street parking creates congestion by reducing road capacities (Steg, 2003). The decline in public transport patronage is also an outcome of growing car dependency in many urban areas as public transport service operators tend to reduce their frequencies during off-peak hours (Cairns, 2000). The commuting into the central areas of towns is connected with problems of time, cost, 4 CAR DEPENDENCY IN THE UK 4.1 Historical perspective After industrial revolution and before 1920s, the 40 percent trips to working places were carried by walking in the British cities. During 1920 to 1950, public transport remained major transport mode facilitating the movement of people within urban areas and working places with some proportion of population travelling by bicycles and walking (Headicar, 2009). Till 1940, the use of private cars was limited only to leisure trips; however after 1940 trends to approach the work places using private cars started to gain momentum among males. Suddenly within few decades, car became dominant mode of travel for all kinds of trips (Pooley, 2000). Meanwhile, government also heavily invested in new road infrastructure encouraging private automobile travel. The car use was not frequent till 1980s among females in British society and later on share of car trips among female especially working women rose rapidly leading to decline in the use of walking, cycling and public transport (Pooley, 2005). The negative impacts of time, delays, cost, health and environment from car traffic got attentions of the government in 1960s, but no major actions were taken arguing economic development and managing transport demands as dominated motives compared with neighbourhood planning and sustainability. In last decades of the 20th century, the global agenda of low carbon cities to restrict high level of green house emissions pressurise the government to pay attention into the development of sustainable communities with reduced car dependency in cities (Pooley, 2005). In response, the government announced transport policy prioritising actions to control carbon emissions, limiting automobile stock, encouraging integrated transport system, reduced

164 journeys and high patronage of public transport, walking and cycling modes. 4.2 Reasons for car ownership and use The car usage in the UK is multi-dimensional and interrelationships of various factors. The car mode share in the UK is high compared to other European countries although the car ownership is less for UK as the travel by public transport, foot and cycle is not effective compared to other countries (CfIT, 2005). Source: CfIT, 2007 Figure 1. Car Ownership per 1000 inhabitants in 2004 in Countries The spatial restructuring of business and employment places and living areas is major factor responsible for increased mobility needs in cities. The growth in car ownership means increased number of trips by individuals and households as compared to public transport (Bagley and Mokhtarian, 2002). The accessibility within activity areas has negative impact on the car ownership in the UK. The increased accessibility among locations tends to increase the use of a particular mode to access urban facilities. The distant locations of shops, recreational facility within neighbourhood have resulted in less walking trips by households in the Britain (RCA, 2009). However, the accessibility by cars has increased the automobile use with few exceptions of negative externalities of road congestion, high parking charges and fuel prices. The household size has positive relation to car ownership in the Britain (RCA, 2009). Results of research studies conclude that desire for increased car ownership is greater among large households with increased average travel distances in the UK. The car ownership also vary among different age groups and old age group have low car ownership and there travelling is usually for shorter distances mostly to specific locations such as health facilities, shopping areas and religious places (Acker, 2010). In UK, the average share of household expenditure on transport has increased from 13 percent to 17 percent from 1968 to 1998 due to increased car ownership and travel preferences by using private cars (Aldous, 2000). The impacts of growth in travel are significantly associated with economic organisation and personal life styles resulting in an increased average length of journeys and additional monetary costs. There has been a steady increase in the fare levels by government to travel by train or bus in the UK (DfT, 2005a). However, the cost for car ownership has remained constant over last 20 years. It is believed that major factor to restrict some degree of car use in the UK is the fuel price and parking costs. The fuel cost has also been more fluctuated due to international prices and government policy towards fuel duty. However, overall rate of increase in fuel prices remained below the fare increase for rails and buses. These variations in cost have enabled household s decisions for a modal shift preferring individual private cars for major journeys within cities (Headicar, 2009). 4.3 Transport policies and car dependency in UK There is strong campaign going on both at public and government level in the European cities including UK for a modal shift from private cars to public transport (CfIT, 2005). The transport policy objectives in most cities aim to reduce congestion through alternate transport options in the large urban areas and business centres. The car use in many countries including UK has been encouraged by road investment schemes aiming at reducing journey times. The problems of induced traffic by expanding road capacities have negative impact on fuel use and emissions in the UK. The construction of new roads attracted extra traffic rather reducing traffic congestions in the large urban areas of UK (Goodwin, 1994; SACTRA, 1994; Goodwin,
165 1997; Hansen and Huang, 1997 & Kenworthy, 1999). Before and just after Second World War, mobility in British cities was managed through rail transport, buses and walking with few exception of private car use. The shift for goods and passengers from rail transport to road transport started in the Within no time, automobiles became popular within British society (Headicar, 2009). The proportion of motor vehicles increased by four times in 1963 as compared to 1939 (Savage, 1996). There was no serious policy thinking at government level to device strategies for the growing automobile use in cities. Moreover, the growth of road traffic was under estimated by the Ministry of Transport in the 1950s and later decades of 1960s and 70s (Glaister et al, 2006). The inadequate policy response of the government towards road transport, low spending and priority for the transport infrastructure resulted in severe traffic congestion and safety problems on roads. In UK, an increase in motorised traffic by 7 percent in the year 1989 paved the way for public criticism on transport policies favouring road building activities at the expense of environment damages and reduced public spaces within local communities (Headicar, 2009). With the publication of the White Paper, Roads for Prosperity (DoT, 1989) the environmental implications of the transport got significant importance in the transport policy development. In early 1990s, the focus on the greener image of cities was prioritised to secure British commitments within the European Parliament. Responding to it, Department of the Environment published This Common Inheritance (DoE, 1990), followed by the 1991 report by the Department of Transport titled Transport and the Environment which emphasised the need to preserve the environment against automobile use. The immediate actions were taken by 10 percent increase in the fuel duty to minimise car usage and emissions (Headicar, 2009). Analysing the impacts of the traffic on the communities, the idea of building roads was replaced with considering physical management measures for traffic congestion and emissions. The integrated transport policy was reflected in the White Paper, A New Deal for Transport (DETR, 1998a). The policy objective were aimed to consider new approach to minimise the impact of pollution and enable UK command towards climate change initiatives by adopting sustainable transport options for cities. The focus was transferred in developing coordinated approach to public transport, walking and cycling with effective transport land use integration. The white paper was followed by a succession of seven more supported documents on different aspects of transport. Later, the 10 Year Plan was indication by the government towards anti-car transport policies and strategies aiming at the objectives of environment sustainability. In July, 2004 a further White Paper, The Future of Transport was published giving formal expression to pragmatic policies which was run by the Conservative governments in the 1980s and 90s (Glaister et al, 2006). Most recently, the UK transport policy aims to reduce the traffic volumes in the large towns by envisaging the implementation of integrated transport system; imposing road pricing and parking fees, strengthening local bus services and introduction of new rail system in medium and metropolitan areas at local levels (Headicar, 2009). 5 INTERNATIONAL EXPERIENCES TO MANAGE CAR DEPENDENCY High growth in travel demand resulting increased mode share of cars have been progressively addressed in world cities of Barcelona, London, Odense, Singapore, Freiburg, Bogota, Copenhagen, Perth, Melbourne and Tokyo by combining transport and land use policies. The measures adopted in these cities have targeted the car use reduction by limiting and balancing travel demands with improved public transport service and encouraging alternate modes. The most
166 recognised strategies adopted in these cities are restricting urban sprawl, encouraging mix type available road capacities (Koh and Lee, 1994). The measure has been successful to control over developments, increasing public transport the vehicle growth population and 3 percent patronage through transit oriented developments and reducing travel demands by promoting reduction in growth rate of vehicle was achieved during 1990,s (Sharp, 2005). walking and cycling. 5.1 Singapore Improved supply of public transport has become a major policy objective in the Asian cities including Singapore (Bresson et al., 2003; Walle and Steenberghen, 2006). Singapore city is a good example, where land use and transport policy have been successful integrated to limit rapid motorisation. City has a high population growth, rapid motorisation and high population densities. There has been huge investment in transport infrastructure over the years improving the mobility to compete with the objectives of economic development in the region. Another distinctive feature of the city is huge income disparities where rich are accumulating the wealth with rising car ownerships and travel. Private cars have major share in daily trips as car trips increased by 23 percent from 1997 to 2004 (Han, 2010). The average kilometres travelled by a single car in 2007 was 20, 800 kilometres annually (Han, 2010; LTA, 2008). Managed growth of car ownership is interesting feature of the Singapore transport policy lesson over the years. The strong argument behind policy to control motorisation was to protect the scare city land and ensure increased efficiency in the movement of people and goods. The impact of the policy can be as from 1980 to 1996 the car ownership increased from 67 to 100 cars/ 1000 persons and it is forecasted to be increased to 143 cars/ 1000 persons by 2010 (LTA, 2007 & Han, 2010). The measures adopted to restrict motor growth in the city include high import taxes, high registration fees and road taxes initially (Chin and Smith, 1997) and vehicle quota system (VQS), road pricing schemes afterwards. The VQS limits the annual vehicle growth rate and manage vehicle allocations by reviewing current traffic conditions and The concept of road pricing was introduced in 1975 by implementing Area Licensing Scheme (ALS) in Singapore. The ALS was an attempt to solve the congestion problem in the central area and was applied in CBD and nearby commercial and retail corridors within a specified area (Foo, 1997). These areas were highly concentrated for jobs, commercial activities and tourism therefore, each vehicle except ambulances, police, fire vehicle and public transport (buses) was charged on entering the zone. Later on, in 1998 electronic road pricing was introduced which increased the operational efficiency of the measure substantially and impacts were reduced traffic volumes by more than 20 percent with increased average speed in the city centre (Foo, 2000). The focus of the measure was to control car use rather than direct intervention in restricting car ownership. The policies of promoting public transport system in the city was targeted with providing a quality based alternate to car use in the city. The attractiveness of public transport system was imperative to the success of vehicle quota system and road pricing policies. The impact of public transport has been delivered by increasing the coverage and capacity of the MRT and LRT system simultaneously. The MRT system is supported with Light Rapid Transit (LRT) in the form of buses and taxies to form the feeder network in the city. The high densities in the central areas of the city provided an opportunity for increased frequencies of the transit system with handsome investment gains for the operators. The system was integrated to provide convenience and comfort in its usage and guiding standards were developed for route designing, scheduling and safety of public transit system.
167 Table 1 Summary of Policy Measures & Effectiveness in Singapore Policy Objectives Strategy/ Measures Targets/ Results Reducing car use in city Promoting public transport system Restricting car ownership 143 cars/1000 inhabitants by the end of year 2010 High import taxes Decrease in car population by High registration fees 21% from 1996 to 2006 High road taxes Vehicle quota System Reduction in automobile growth by 1.5% from 2009 to 2012 Reduced investments in road expansion projects Road pricing Implementation of area licensing scheme Electronic road pricing Developing multi-modal transport system (MRT, LRT, buses and Taxis) Increased coverage and capacities Increased frequencies during peak hours Standardising public transport infrastructure Improving safety Integrated and affordable fare prices Improved efficiency of public transport services Reduction in road expansion from 1% to 0.5% per annum from 2009 Traffic volume reduced by 20% in road pricing areas Increase in average speed from 35km/h to 45km/h Expanding system capacity by 36% in the year 2020 Taxis share 11% of daily trips due to low average travel cost A commuting trips average costs 2% of average household s income Dedicated bus lanes Bus priority signals Time tables and scheduling Traffic intelligence system
168 Policy Objectives Strategy/ Measures Targets/ Results Transport land use integration Reducing travel demand Maintaining compact city form Development of pedestrian zones in CBD Hub and spoke structures (Town centre linked by MRT while LRT and buses connecting housing areas with MRT stations Encouraging walking and cycling within neighbourhoods by mix use developments The management measures like bus priority at signals and intelligence system were introduced to increase the operational efficiency of the public transport network. The travelling cost by public transport was controlled by marginal increase in fares to attract more people for public transport usage. It is proposed to expand the system capacity by 36 percent by the year 2020 with increased lines and buses (Han, 2010). The Singapore experience is unique in the way that two different scenarios of public transport system and car dependent system have been organised. The objective of balancing the motorisation with a public transport system has been the real policy challenge achieved by a range of well-coordinated strategies to control rising car population and usage with increase patronage of high quality public transport facilities. 5.2 Freiburg The case of German cities is unique where levels of car ownership and use is managed by providing good quality public transport service with increased share of walking and cycling. The policies developed in Germany provide a balance between use of car against other transport modes especially in those areas where impacts and consequences of car dependency were becoming problematic (Wolf, 1986, Schmucki, 2001). The Germany has always high car ownership in Europe after Luxemburg with 546 cars/ 1000 inhabitants against 466 cars/ 1000 inhabitant in Europe (OECD, & EUROSTAT, ). Freiburg is the most sustainable and environment friendly city of the world. City has a population of about 2, 20,000 inhabitants (City of Freiburg, 2009a). The car ownership rate in Freiburg from 1950 to 1970 was higher than overall car ownership in West Germany. However, with the implementation of car reducing policies in 1970,s the rate started to decline with 419 cars/ 1000 inhabitants in 2006 (Buehler and Pucher, 2009). Freiburg city transport system is far more sustainable than country despite increase in per capita income of the residents. The vehicle km per capita of car use has been decreased by 7 percent on all roads and 13 percent on residential roads from 1990 to 2006 (Buehler and Pucher, 2009). Carbon emissions decreased by 13 percent from 1992 to 2005 and decline in the accident rate have been noticed in last few years (City of Freiburg, 2007a). The financial viability of the public transport is also very high with only 10 percent subsides compared to 28 percent subsidy for public transport in Germany (Buehler and Pucher, 2009).
169 Table 2 Summary of Policy Measures & Effectiveness in Freiburg Policy Objectives Strategy/ Measures Results/ Targets Sustainable and environment friendly city Reducing car ownership and use Discouraging on-street parking Restricting car use in designated city areas High road taxes Improved road safety Priority to pedestrian traffic Control over carbon emissions Promotion of green modes over automobiles Traffic calming Speed limits within neighbourhoods Home zoning Integrating land use and transport policies Decline in car ownership from 422 to 419 cars/1000 inhabitants (1990 to 2006) compared to 546 cars/ 1000 inhabitants in Germany Decrease in vehicle km per capita of car use by 7% on all roads and 13% on residential roads (1990 to 2006) Road accidents rate in city is half to overall rate of Germany/ inhabitant CO 2 emission from transport sector reduced by 13.4% (1992 to 2005) Reduce speed of 30km/h on residential streets and maximum 7km/h within home zone Reducing travel demands in a city Encouraging mode shift policy New development along corridors served by LRT system Car free developments High population densities in central areas by discouraging suburban development Integrated multi-modal public transport system Integrated timings and frequencies for peak and off peak hours Unified ticketing system Green priority lines at junctions Reduced cost and travel time by public transport over cars Car share trips fell from 38% to 32% (1995 to 2006) Public transport patronage rose from 11% to 18% (1995 to 2006) Use of regional passenger card increased to 85% from 37% (1974 to 2007)
170 Promoting cycling and walking Bike share of total trips nearly doubled from 15% to 27% (1995 Adequate provisions for to 2006) infrastructure Pedestrian areas with limited car entrances Construction of parking spaces away from city centre and major roads forcing people to walk Behavioural change in daily travel patterns of inhabitants to travel by foot and cycle The success of Freiburg is attributed to massive behavioural change in daily travels of the people where use of cars has been reduced with shift towards cycling and public transport. There has been strong public and political support enabling the implementation of the anti-car using policies since 1970s (Santos, 2010). The land use and transport policy shift in 1970s emphasised to modernise the tramway, to promote the integrated bikeways and converting historic city centre into pedestrian zones with limited car entrance (Newman and Kenworthy, 1999). Later in 1979, the transport plan officially included the promotion of green modes alternate to private automobiles. The land use policies guided the new developments along public transport corridors particularly by expanding light rail transit. The last land use plan prepared for the city focus on the development of car free neighbourhoods and high density developments along light rail routes to strengthen the neighbourhood identity by reducing the travel distance among various land uses. The central developments have been prioritised over suburban development to increase residential densities. The transport measures include traffic calming of residential streets with a speed of 7km/ hour to 30 km/ hour with priority for pedestrian and cyclist over cars. The city parking spaces have also been reduced to discourage use of cars (Buehler and Pucher, 2009). The dignity of Freiburg is its integrated public transport network and light rail transit covering 36.4 kilometres in The light rail is expanded in radial pattern to provide maximum residents access to their work places within a distance of 300 metre. The share of light rail in public transport service is 70 percent with 30 percent public transport served by buses (City of Freiburg, 2009a). The frequencies and timings of public transport networks are well integrated to accommodate peak and off peak passenger movements. The public transport networks have been provided with green priority lines at major locations and junctions. The ticketing system is also unified where one can travel on different transport modes using a single ticket and there are special incentives for regional ticket and discounts for student travelling. The operation of public transport ensures complete advantages in terms of time and cost over cars which have been key success of the city. The walking and biking facilities have been encouraged for shorter trips by introducing traffic calming measures. To restrict car use the parking areas and garages for motor cars have been intentionally built far away from the activity areas forcing people to walk or use public transport to reach their destinations. The residential parking is only reserved for the residents and special permission are required for on-street parking by the visits in those neighbourhoods. The parking cost is very high in central areas and comparatively less moving on the outskirts. The consistency in policy development and implementation supported with
171 strong behavioural change has changed the fortune of the city making it more attractive and environment friendly. 5.3 Copenhagen Copenhagen is one of the largest metropolitan cities in North Europe and capital of Denmark. The population of the metropolitan city stands around 1.8 million in 2008 (Santos, 2010). The urban growth pattern of the city is famous by post-war Finger Plan where urban development and growth of the city takes place along five railway lines to north, west and south directions. The car ownership in Greater Copenhagen was 333 cars/ 1000 inhabitants in 2006 (CfIT, 2007). The overall development in car traffic shows an increase of about 20 percent from 1990 to The increase has been noticed on the primary distributors; while there have been no major changes to secondary distributor and district streets (Niels, 2009). The number of private passenger cars was 21 percent higher in 2007 than in From 2006 to 2007 there was an increase of slightly over 4 percent in the number of private cars in city. From 2007 to 2008, the volume of traffic on the road network as a whole has remained virtually unchanged ( The increased car use started to threaten the city in 1980s. To address the issue, city authorities implemented a policy to move traffic from housing areas to main roads supported with traffic control measures by reducing signals green time in the central areas to discourage motor trips. Another important measure was effective distribution of travel demands over transport modes shifting large number of commuters from cars to bicycles and public transport modes. It was aimed in the transport policy to limit the inbound traffic in the congested areas and managing transport demand in these areas through public transport and cycling facilities, although policy remained under pressure due to growing car ownerships and use by the higher income groups. The focus of transport policy for last few years is the development and expansion of public transport system in the city. The multi-modal public transport network of local trains, metro lines, buses, and express buses serve the city and regional areas to reduce congestion on limited road capacities central areas of the city. The barriers to road expansion in the old city, the most viable solutions to manage car usage have been alternate transport modes, increased traffic controls and management and improved public transport coverage and service quality ( Public transport is accessible from about 1,200 bus stops and 40 stations to trains, metropolitan S- trains and the Metro. More than half of passengers travel by buses, while the rest use the train or Metro. The number of Metro passengers has risen by 15 percent from 2007 to 2008 (Niels, 2009). Copenhagen is a pioneer of introducing competitive tendering for private bus operators in city. Due to falling ridership and increasing subsidies during the 1980s, in 1990 in city, the bus service operation was privatised by introducing competitive tendering system providing number of incentives for operators on improved service quality. These management reforms were successful to reduce operating costs per bus hour by 24 percent over ten years, and stress on service quality in the contract specifications resulted in increase ridership (Niels, 2009). In late1990s, Copenhagen car use has been discouraged by eliminating the parking space every year replacing with green areas and public spaces (Newman & Kenworthy, 1996).The increase in car ownership has put great pressure on street parking. Partly for this reason, the city adopted a parking strategy in 2005, one result being the opening in 2008 of a municipal parking facility for the public and the start of building work on three fully automated underground parking installations due to high concentration of automobiles in specific areas of municipality. Road pricing is another measures adopted to reduce the flows of cars in the city.
172 Table 3 Summary of Policy Measures and Effectiveness in Copenhagen Policy Objectives Strategy/ Measures Targets/ Results Improving air quality Integrating transport and land-use policy to reduce reliance on the car Reducing car ownership Control over car ownership with 4% increase in car traffic in 2007 Control over carbon emissions Reducing car use Unchanged traffic volume in Reduced green times for automobiles in city centre Road pricing City growth along main railway lines to restrict urban sprawl Limiting inbound traffic in city centre and managing demand through improved land use planning and alternate modes Replacing car parking with green spaces in city centre Improving the quality of public transport, to reduce reliance on the car Multi-modal public transport system (local trains, metro lines, buses, and express buses) Development and expansion of public transport system Improved service quality of public transport Increased coverage of the public transport services Integrated fares Introduction of competitive tendering for public transport operations Encouraging alternate transport modes Construction of green cycle tracks Construction of bike lanes Provision of parking spaces for bicycles Cycle sharing network Improve safety for cyclist Metro passengers increased by 15% (2007 to 2008) Increase in ridership Increased growth in public transport passenger in last five years 24% reduction in operation cost/bus in last ten years Highest cycling and walking share in Europe Cycle trips share to work places to be increased by 40% in 2012 Cycling accounts 26% of total mode share 50% reduction in road causalities by year 2012
173 Copenhagen has a unique culture of dominated bicycle share and use. The city cycle and walking mode share is the highest in Europe (Schwanen, 2002) as there is an establish cycle sharing network operated in a city (Santos, 2010). There are nearly 390 bike roads, of which 320 are cycle tracks, 40 green cycle routes and 15 cycle lanes. For year 2025, it is estimated to invest about 123 million of Danish Krone (DKK) to improve the existing bike routes as well to construct new route (Niels, 2009). Although a lot of improvement and investment is still required on improving road safety for bicycles and provide parking spaces for increased use of the bikeways (Santos et al, 2010). In 2002, Copenhagen cycle policy determined certain targets to be achieved in next ten years mainly, increasing the share of bike trips from 34 percent to 40 percent, reduction in bicycle causalities by at least 50 percent and measures to increase the comfort speed by 10 percent (Santos et al, 2006). 5.4 Melbourne Australian cities are most extensive in their level of car dependency when measured against their transportation patterns, infrastructure and land uses. The analysis by Newman and Kenworthy (1999) concludes that Australian cities utilise percent of their city s wealth on passenger transportation system while in European cities it is estimated about 7-8 percent spending on the transportation. The Australian Bureau of Statistics (ABS) survey results and Census data published in March, 2009 indicates 15.7 million vehicles registered in the country with a growth rate of 13.1 percent in last 5 years with 18.4 percent increase in buses against 13 percent increase in passenger vehicle due to policies aiming at reducing car dependency in Australia. There were 720 passenger vehicles/ 1000 population in 2009 compared to 674 vehicles / 1000 resident population in 2004 with 14,600 kilometres travelled by each vehicle ( Car is the dominant mode of transport in Melbourne with 91 percent share of car trips in 2008 (DTV, 2009). The city has an extensive public transport system of trams, buses, coaches and trains. The city tram system is one of the largest in world with 245 kilometres of double tracks providing access to inner urban and suburban areas of city. The city has an integrated public transport network served by 15 lines and more than 200 stations (VTPI, 2010). The public transport share in overall trips is only 9 percent despite government efforts to increase public transport patronage to meet future transport challenges (Loader and Stanley, 2009). The suburban rail network and tram network having more than 25 routes providing service for innerand middle-suburban areas; and bus services throughout the metropolitan area connecting train lines and major centres (DTV, 2009). The investment and recent improvement in public transport system has remarkable impacts in increasing bus patronage which has been grown at a rate of around 4.6 percent in The growth in bus patronage is characterised by upgraded service levels and extension of existing bus routes (Loader and Stanley, 2009). Due to heavy traffic volumes, the city roads are congested and mostly operated on their full capacity ( A gradual increase in cycle trips has been noticed in Melbourne within few years mainly due to population growth and job increase within the core city. There has been an increase bicycle trips by 78 percent within the central business district of city (Pucher et al, 2010). The other factors contributing to increases in cycling are improvements in inner Melbourne cycling infrastructure, existing grid iron street pattern providing maximum connectivity within neighbourhoods (Pucher et al; Davison, 2004), mixed uses within core city and government policy responses discouraging car travel. The cycling culture is developing slowly and requires immediate government attention particularly linking cycle routes with existing public transport network.
174 The impact of traffic calming is limited within shift towards encouraging public transport in the core city areas. The application standards and city got popularity in the 1990s to reduce car nature of traffic calming measures in Melbourne dependency on expanding areas of the city. The is far less than European cities of Germany, public transport system offers variety of Denmark and Netherlands. The speed limit on transport modes providing coverage up to 30 local roads is 50 km/h while school zones and kilometres outside the city and regulated with neighbourhood streets with heavy pedestrian integrated fare system of multi-use ticketing. volumes allow speed limit of 40 km/h. (Pucher The public transport service consists of rail et al, 2010; Garrard, 2008). Few streets share transport, metro lines, regional rail transport, bus speed limit of 10km/h; although motorists lines and tram lines ( regularly violate posted speed limits on streets (Australian Associated Motor Insurers, 2009). To manage car dependency in the city, a comprehensive program has been covered under Victorian Greenhouse Strategy and Melbourne 2030 plan. The 2030 plan for Melbourne introduces key actions to improve the efficiency and delivery of city transportation system aiming at reducing car dependency in Melbourne. a. Upgrade and develop the principal public transport network and improve local public transport services b. Encourage sustainable travel in city c. Provide for the transport needs of growth areas d. Ensure integrated planning for metropolitan transport ( 5.5 Barcelona Barcelona is a cosmopolitan Mediterranean city of Spain which presents combination of historic Roman patterns in its urban street along with modern urban design elements of 20th century. In last three decades, city carries the image of highly potential investment area and is a key business centres supported by its strategic transport links, attractive environment and good quality of life. The expansion and improved coverage by transport network has resulted in the decentralisation of the population, high car ownership and use giving rise to motorised traffic threatening the city environment. The car ownership in year 2000 was 424 cars/1000 inhabitants in the city (CfIT, 2007). The policy To manage growing motorisation in city, land use transport integration has played a vital role in guiding the new development within the existing high density areas and locations served by rail. The Metropolitan Transport Authority is responsible to set transport policy objectives in the city. The Authority has aimed to increase the share of public transport, and reduce the car use by setting targets to extend rail network to densely populated areas with a maximum distance of 500m from a metro station and 800m from local train station. The transport policy have planned to balance the supply and demand for public transport with targeted passenger for buses, trams and rail service in higher demand areas. The current fare structure has enabled to reduce journey prices in the city. The integrated ticketing system has been successful in increasing the multi-modal transport journey from 8 percent to 21 percent in To discourage use of cars the city council has imposed strict parking controls by reducing onstreet provisions for commuters and visitors which helped to reduce congestion in the city centre. Another important aspect of parking policy is the shifting of the on-street parking to underground parking garages. Car parking spaces within city centre have been reallocated for pedestrian mobility. The policy of access control has reduced, private transport (cars and motorcycles) trips by 8% in the inner city, and 4% in the suburbs since 1999 (Dunning, 2005). The central areas of the city have been converted into pedestrian areas to restrict car use and
175 encourage walking trips. However, the transport governance gaps and political conflicts are the major challenges to transport policy development and delivery for the city. The coordination and integration among regional government, Metropolitan Transport Authority and individual municipalities is key determinant towards successful operations of the public transport service and other policy measures (Dunning, 2005). 6 DISCUSSION AND FINDINGS The trends in car ownership and use in world cities identify common challenges of people moving to the suburbs, more reliance on cars, Table 4 and increased travel (vehicle kilometres) and long travel distances in urban areas. The variation in the spatial and temporal growth patterns of cities have impacted on the development structures and land use densities, provision and quality of transport infrastructure, planning frameworks and travel behaviours. The response of cities to solve the problem of growing traffic and car use has been combination of measures guided by transport policy objectives and environment safeguards. Nevertheless, success of these policy and fiscal measures has been attributed to level of integration, encouraging alternative modes, land use controls, and public participation. Comparative Review of Transport Policy Measures in World Cities Measures Multi-modal public transport system to improve quality, reliability and patronage Restricting urban sprawl through compact city developments for higher population densities Road pricing policies to reduce congestion and car use Integrated fares and ticketing system Parking standard (reducing parking spaces and charging vehicles Cities Singapore Freiburg Copenhagen Melbourne Barcelona X X X Pedestrian zone Traffic calming and home zoning Encouraging alternate transport modes (walking and cycling)
176 Cities Measures Singapore Freiburg Copenhagen Melbourne Barcelona Land use and transport integration to reduce travel demands Transport demand management The delivery of policy measures to reduce car dependency in these cities has been combined with availability of high levels of funding for large-scale public transport investment programmes, infrastructure development for cycling and pedestrians and strong institutional support. Regulating land use locations, types, sizes and population density in development process have been successful to reduce the travel demands in cities, particularly by car. However, the effectiveness of land use strategies is connected with people s decisions about their living and proximity to workplaces. The increased infrastructure capacity, speed limits in city areas, high parking charges and improved car technologies cannot guarantee an immediate reduction in car use rather assessment of travel patterns describing when and where people drive, particularly the home and work trips and during the peak hours would guide to choose traffic demand management options to limit car use in a city. The shift from private cars to public transport is not possible at once rather policy makers need to design policies discouraging the car use and providing choices in public transport travel. The attractiveness to public transport service has been achieved by integrating various public transport modes (buses, rails and trams) in many cities. The UK case is different from other European countries presenting high level of car reliance with 85 percent mode share by car but a very low use of public transport (CfIT, 2007). Although in last few years, increase in rail travel across the UK has resulted in some improvements in the public transport share. If we compare the world cities in Europe, only London in the UK possesses high share of public transport use. The cities of Manchester, Glasgow, and Birmingham remain higher in car use compared with Lyon, Copenhagen, Munich and Vienna. In UK, the cost of travelling by public transport is quite high compared with other European countries because the major portion of public transport operating costs are recovered from users through fares (Garling et al, 2002). The cost of travelling by car in UK is cheaper as compared to other European countries although the fuel pricing is also on the higher side (CfIT, 2005). The parking cost in case of London and other metropolitan cities of the UK is also on higher side but the combined cost for using cars against the public transport is much lower than countries like Germany, France, Italy, Denmark, Austria (CfIT, 2007). In UK, huge investments in transport sector has been made over a period of 50 years but there exist no official process to monitor the impact of these investment in the form of saving in travel time, travel distance and travel costs. (Headicar, 2009). Moreover, the weak policy response in developing cycling and walking programs combined with behavioural constraints has been major obstacle to shift car use in the UK. The UK commitment on Voluntary Agreements of CO 2 emissions has potential to justify government efforts in reducing car dependency
177 in cities. The country needs a strict fuel consumption targets during policy development for national, regional and local areas. The emissions standards for car use need to be legislated with respect to on road distance travelled and carbon emissions in line with the directions of the EU Commission and OECD agreements. The impact of these policies in the long run could result in reduced car travel and kilometres travelled in cities (Bonilla & Foxon, 2009). The effectiveness and success of various policy interventions to reduce car dependency in international cities has been approached with strong institutional support involving the public to frame major policy decisions in solving traffic problems (Garling et al, 2002). The key success instrument of public participation is lacking in the UK (Jakobosson et al, 2000). Moreover, the behaviour trends of car use including the pull measures and push measures to discourage and encourage car use are important consideration for designing policies in managing car dependency. The travel choices of the people changes over time, therefore targeting the behaviours of car use require integration and impact analysis of other transport modes guiding combined policies to manage car dependency in UK. The significance of non-motorised transportation for a city is advantageous in economic and environment grounds as walking and cycling cost is zero compared to motorised modes and involves almost negligible environmental costs. UK cities need to re-frame the policy programs by providing maximum coverage and promotion for non-motorised transport modes with increased capital investments.. 7 CONCLUSION Car dependence grows continuously over time consequence to government failure in adequate supply provisions for public transport services. The land use changes in a city tend to relocate the services away from residential areas shifting people s lifestyle with increased reliance on cars due to its immediate availability for journeys. The lessons from international cities conclude that nature of car dependence in urban areas of the UK have high potential to substitute large portion of daily trips by other transport modes. The comparative review of car dependency experiences in various international cities identifies a strong relationship between development patterns and car use. The form of the future development in UK cities needs to be structured encouraging transit oriented and nonmotorised modes over automobiles. The type of relationship between cost of cars (both fixed and variable costs per kilometre) and car use share are important factors to be considered in the policy development of reducing automobile dependence. Promoting sustainable transport options in implementing city plans can bring immediate and long term benefits to reduce the impacts of car dependency in the country. The implementation of transport strategies (traffic calming, pedestrian area schemes, dedicated bicycle lanes, improved storage, park and ride, transport demand management measures and improving safety for pedestrians and cyclist) need priority to achieve transport sustainability in cities. The implications of growing demand for car travel are significant for economists and policy makers in the UK. The physical planning strategies to manage car dependency in cities needs to be coordinated with the economic policies addressing the car ownership use and car cost factors with heavy charges. An informed analysis of present demand and future forecast of motor vehicle growth is essential for integrated planning, designing and road infrastructure developments, traffic management, allocation of resources, emissions and fuel demands. The application of congestion charges, bus priority lanes, cycle tracks and pedestrian zoning measures require local level ownership during policy formulation and implementation phases to enable mode shift and increased public transport patronage, currently lacking in the transport land use policy development in the UK. Managing car dependency will itself reduce the CO 2 emissions
178 in the transport sector. All is required an holistic approach for implementation of sustainable transport policies, standardising economic instruments, applying technological innovations, investing in public transport, walking and cycling, changing people s behaviours and introducing physical measures without challenging the mobility within a city. REFERENCES Abrahamse, W., Steg, L., Gifford, R. & Vlek, C. 2009, "Factors influencing car use for commuting and the intention to reduce it: a question of self-interest or morality? Journal of Transportation Research, vol. 12, no. 4, pp Acker, V.V. & Witlox, F. 2010, "Car ownership as a mediating variable in car travel behaviour research using a structural equation modelling approach to identify its dual relationship", Journal of Transport Geography, vol. 18, no. 1, pp Australian Associated Motor Insurers, Crash index: our roads of rage. AAMI. Available: [2010, 07/23]. Available: [2010, 06/08]. Available: [2010, 07/04]. Bagley, M.N. & Mokhtarian, P.L. 2002, "The impact of residential neighbourhood type in travel behaviour: a structural equation modeling approach", Journal of Regional Science, vol. 36, no. 2, pp Bonilla, D. & Foxon, T. 2009, "Demand for new car fuel economy in the UK, ", journal of Transport Economics and Policy, vol. 43, no. 1, pp Bresson, G., Dargay, J., Madre, J., jean, L. & Pirotte, A. 2003, "The main determinants of the demand for public transport: a comparative analysis of England and France using shrinkage estimators", Journal of Transportation Research, vol. 37, pp Buehler, R. & Puncher, J. 2009, "Sustainable transport that works: lessons from Germany", journal of Transport Policy and Practice, vol. 15, no. 1. Campaign for Better Transport, 2009,, The car dependency scorecard. Available: s/traffic_reduction/scorecard [2010, 02/18]. Chin, A. & Smith, P. 1997, "Automobile ownership and government policy: the economics of Singapore vehicle quota scheme", Journal of Transportation Research, vol. 31, no. 2, pp City of Freiburg 2009a, Green City, City of Freiburg, Freiburg, Germany. City of Freiburg 2007a, the new district of Freiburg: a case study of successful, sustainable urban development, City of Freiburg, Freiburg, Germany. Clark, D.S. 2009, "The determinants of car ownership in England and Wales from anonymous 2001 Census data", Journal of Transportation Research Part C: Emerging Technologies, vol. 17, no. 5, pp Commission for Integrated Transport, European best Practice 2006 update (2) [Homepage of CfIT, London], [Online]. Available: p/pdf/ebp.pdf [2010, 02/16]. Crawford, J.H. 2002, Carfree cities, International Books, Utrecht, Netherlands. Davison, G. 2004, The rise and fall of marvelous Melbourne, second edition, Melbourne University Press, Carlton, Victoria. DERT, 1999, the environmental impact of road vehicles in use, DERT, London. DERT, 1998, A New Deal for Transport: Better for Everyone, DERT, London. DfT, 2008g, Delivering a Sustainable Transport System, DfT, London. DfT, 2005a, Concessionary Fares Schemes: Explanatory Notes on the Provision of the Transport Act 1985, DfT, London. DfT, 2005e, Marking Campaignig for Smarter Choices Work: Guidelines for Local Authorities, DfT, London. Directorate General for Energy and Transport 2008, EUROSTAT ( ) Energy and transport in figures, European Commission, Brussels, Belgium. DoE, 1990, the common inheritance: Britain s Environmental Strategy, Her Majesty s Stationery Office, London. DoT, 1989, Roads for prosperity, Her Majesty s Stationery Office, London.
179 Dunning, J. 2005, Demand management policies the options for carbon reduction in in world cities, Association for European London", Journal of Transport Policy, vol. Transport and Contributors. 17, no. 2, pp Foo, T.S. 2000, "An advanced demand Ingram, G.K. & Liu, Z. 1999, Determinants of management instrument in urban transport: motorization and road provision, Brookings electronic road pricing in Singapore", Institution Press, Washington, USA. Cities, vol. 17, no. 1, pp Kain, F.J. 2001, "A tale of two cities: Foo, T.S. 1997, "An effective demand relationship between urban form, car management instrument in urban transport: ownership and use and implications for the area licensing scheme in Singapore", public policy", Journal of Transport vol. 14, no. 3, pp Economics and Policy, vol. 35, no. 1, pp. Garrard, J. 2008, Safe speed: promoting safe walking and cycling by reducing traffic Kain, J.F. & Fauth, G.R. 1977, The effects of speed, National heart foundation, urban structure on automobile ownership Melbourne. and journey to work mode choices, Gauzin-Muller, D. 2002, Sustainable Transportation Research Record. architecture and urbanism concepts, Kenworthy, J. & CfIT. 2005, World Cities technologies, examples, Birkhauser, Basel. Research: Final Report on World Cities, Gillespie, A. 1999, the changing employment Commission for Integrated Transport geography of Britain, Town and Country (CfIT)., London, UK. Planning Association, London. Kenworthy, R.J. & Laube, B.F. 1996, Giuliano, G. & Dargay, J. 2005, Car ownership, "Automobiles patterns of automobile travel and land Use: a comparison of the dependence in cities: an international US and Great Britan, Transportation overview of key physical and economic Research Board (TRB), 84th Annual dimensions with some implications for Meeting, Washington DC. urban policy", Journal of Transportation, Glaister, S., Burnham, J., Stevens, H., & vol. 33, no. 7, pp Travers, T. 2006, Transport policy in Kenworthy, R.J. & Laube, B.F. 1996, Britain,, 2nd edition, Public policy and "Automobiles dependence in the cities: politics series, Palgrave macmillan an international comparison of urban Publishers, Hempshire, UK. transport and land use patterns with Goodwin, P.B. 1994, "Traffic reduction", implications for sustainability", Journal Transport Policy, vol. 1, no. 2, pp of Environment Impact Assessment Han, L.S.S. 2010, "Managing motrization in Revised, vol. 16, no. 4-6, pp sustainable transport planning: The Kunert, U. & Kuhfeld, H. 2007, "The diverse Singapore experience", Journal of structures of passenger car taxation in Transport Geography, vol. 18, no. 2, pp. Europe and the EU Commissions proposal for reform", Journal of Hansen, G.R.M. 1993, Commuting: home Transport Policy, vol. 14, no. 4, pp sprawl, job sprawl, traffic jams. In a billion 316. trips a day: tradition and transition in Land Transport Authority (LTA) 2007, European travel patterns, Kluwer Singapore Land Transport Statistics in Academic Publisher, The Netherlands. Brief 2006, LTA, Singapore. Hansen, M. & Huang, Y. 1997, "Road supply Loader, C. & Stanley, J. 2009, "Growing bus and traffic in California urban areas", patronage and addressing transport Journal of Transportation Research, vol. disadvantage - The Melbourne 31, no. 3, pp experience", Journal of Transport Policy, Headicar, P. 2009, Transport policy and vol. 16, no. 3, pp planning in Great Britain, The natural and Low carbon economy 2010, Available: built environment series, Routledge [2010, Publishers, London. 06/18]. Hickman, R., Ashiru, O. & Banister, D. 2010, LTA 2008, Land Transport Master Plan, LTA, "Transport and climate change: simulating Singapore.
180 Lucas, K. & Jones, P. 2009, Car in British Society, Royal Automobile Club Foundation, (RAC), London, UK. Mcfadden, D. 1974, "The measurement of urban travel demand", Journal of Public Economics, vol. 3, pp Meyer, I., Leimbach, M. & Jaeger, C. 2007, "International passenger transport and climate change: a sector analysis in car demand and associated CO2 emission from 2000 to 2050", Journal of Energy urban traffic problems in British cities ", Journal of Historic Geography, vol. 31, no. 1, pp Pucher, J. & Lefevre, C. 1996, The urban transport crisis in Europe and North America, MacMillan, London. Puncher, J., Garrard, J. & Greaves, S. 2010, "Cycling down under: a comparative analysis of bicycling trends and policies in Sydney and Melbourne", Journal of Transport Geography, vol. In press. Policy, vol. 35, no. 12, pp SACTRA, 1994, Trunk Roads and the Moriarty, P. 2008, Changing the car culture, Whitelegg symposium, Monash University, Melbourne, Australia. Naess, P. 2006, Urban Structure Matters: Residential location, car dependence and travel behaviour, Ist edn, Routledge Taylor & Francis Group, Oxfordshire. Newman, P.K.,J. 1999, Sustainability and cities: overcoming automobile dependence, Island Press, Washington. Newman, P. & Kenworthy, J. 2006, "Urban design to reduce automobile dependence", Opolis: An International Journal of Suburban and Metropolitan Studies, vol. 2, no. 1. Newman, P., Kenworthy, J. & Glazebrook, G. 2008, How to create exponential decline in car use in Australian cities, AdaptNet Policy Forum, Australia. OECD 2008, OECD Statistics ( ), Organisation of Economic Cooperation and Development, Paris, France. Organisation of Economic Co-operation and Development,(OECD). 1995, Urban travel and sustainable development, European Conference of Ministers of Transport, ECMT,OECD, Paris, France. Paulley, N., Balcombe, R., Mackett, R., Titheridge, H., Preston, J., Wardman, M., Shires, J. & White, P. "The demand for public transport: the effect of fares, quality of service, income and car ownership", Transport Policy, vol. 13, pp Pooley, C. & Turnball, J. 2000, "Commuting, transport and urban form: Manchester and Glasgow in the mid-twentieth century", Urban History, vol. 27, pp Pooley, C. & Turnbull, J. 2005, "Measuring coping with congestion: Responses to Generation of Traffic, Her Majesty s Stationery Office, London. Santos, C., Antoine, P. & Thibaut, J. 2006, How bicycle can become an efficient means of public transportation, Geography Department, Roskilde University, Denmark. Santos, G., Behrendt, H. & Teytelboym, A. 2010, "Policy instruments for sustainable road transport", Journal of Transportation Economics, vol. 28, no. 1, pp Savage, C. 1996, An economic history of transport, 2nd edition, Hutchinson, London. Scottish Government 2003, Final report: Transferability of best practice in transport policy, Scottish Government, Scotland. Sharp, L. 2005, The journey- Singapore s Land Transportation Story, SNP International Publishing Ltd. Sinha, C.K. 2003, "Sustainability and urban public transportation", Journal of Transportation Engineering, vol. 129, no. 4, pp Souche, S. 2010, "Measuring the structural determinants of urban travel demand", Journal of Transport Policy, vol. 17, no. 3, pp Standing Advisory Committee on Trunk Road Assessment 1994, SACTRA, Trunk Roads and the Generation of Traffic, Department of Transport, United Kingdom. Steg, L. & Vlek, C. 1997, The role of problem awareness in willingness to change car use and in evaluating relative policy measures, Traffic and Transport Psychology edn, Pergamon Press, Oxford, UK.
181 Steg, L. 2003, Can public transport compete with the private cars, Department of Psychology, University of Groningen., Netherlands. Torslev, N. 2009, Traffic in Copenhagen, 2008, Traffic Department, City of Copenhagen, Copenhagen, Denmark. UNFPA, State of world population 2007, Unleashing the potential of urban growth. Available: [2010, 06/16]. Victoria Data Portal 2009, Department of Transport, Victoria, Australia. Available: [2010, 06/20]. Victoria Transport Policy Institute, (. 2010, Sustainable transport and TDM: Planning that balances economics, social and ecological objectives, TDM Encyclopaedia, Australia. Walle, S.V. & Steenberghen, T. 2006, "Space and time related determinants of public transport use in trips chains", Journal of Transportation Research, vol. 40, pp
182 EXPLORING LAND USE-TRANSPORT INTERACTIONS IN THE GREATER DUBLIN REGION USING THE MOLAND MODEL H. Shahumyan 1,S.Convery 2, E. Casey 1. Urban Institute Ireland, University College Dublin, Ireland; 2. Urban Institute Ireland, University College Dublin, Ireland; 3. Urban Institute Ireland, University College Dublin, Ireland; ABSTRACT Urban regions are increasingly important given the rapid pace of change of land use in these regions driven to some extent by changes in demography, economic development, environment, transport and technology. The MOLAND model provides a spatial illustration of alternative development patterns and trends; it offers a basis for the analysis of the spatial implications of particular policies and provides a useful platform for discussion and comparison of land use transport interactions under different scenarios. The MOLAND transport model was used for the Greater Dublin Region, running two possible scenarios of transport infrastructure development in the region. The influence of the Metro North line was analysed to show its effect on transport flows in the region. The results of comparison analysis are discussed in terms of the implications on future settlement and transport flow patterns in the Greater Dublin Region as a whole and particularly in the areas intersected by Metro North. Keywords: MOLAND, model, transport, land-use, cellular automata, scenario, Metro North 1 INTRODUCTION Urban regions are increasingly important given the rapid pace of change of land use in these regions driven to some extent by changes in demography, economic development, environment, transport and technology. For example, between 1996 and 2006 Ireland s population grew by 17% from 3.6 million approx. to 4.24 million approx. The numbers at work increased by 40%, the number of private cars per 1,000 adults increased by 38% and the total number of licensed vehicles increased by 72%. Energy consumed by the transport sector increased by 100% and emissions of greenhouse gases from transport increased by 88% [1-4]. In A New Transport Policy for Ireland [4] the Government reaffirms its view that transport and travel trends in Ireland are unsustainable. Despite the Transport 21 initiative to provide 7 light rail and 2 metro infrastructures by 2016 (Figure 1) which has been partially implemented, it is expected that as a result of current policies, congestion and transport emissions are likely to increase and that economic competitiveness and quality of life may decline. Given these issues, tools which can integrate transport and land use dimensions to assist in assessing policy options have great potential. The MOLAND dynamic land use model provides a spatial illustration of alternative development patterns and trends; it offers a basis for the analysis of the spatial implications of particular policies and the interactions of multiple planning actions. 3 Figure 1. Existing and planned transport network in the Greater Dublin Region Page 1 of 7
![Region (GDR), a dynamic spatial interaction based model [9] arranges for the allocation of Global growth as well as for the interregional migration of Thus, MOLAND provides a useful platform for](/docs-images/90/101837209/images/183-0.jpg "discussion and comparison of land use transport interactions under different scenarios which can inform policy interventions.")
183 Region (GDR), a dynamic spatial interaction based model [9] arranges for the allocation of Global growth as well as for the interregional migration of Thus, MOLAND provides a useful platform for discussion and comparison of land use transport interactions under different scenarios which can inform policy interventions. 2 THE MOLAND MODEL The MOLAND model was developed as part of an initiative of the European Commission s Joint Research Centre as a response to the challenge of providing a means for assessing urban and regional development trends across Europe. In order to capture the processes effecting the spatial configuration of an area, MOLAND represents the processes operating at three geographical levels: the Global (the whole area), the Regional (subregions/counties) and the Local (cellular units) [5]. The combined Global and Regional levels constitute the so-called macro-level of the model, while the Local level represents the micro-level of the model. At the Global level, the model integrates global/aggregate figures taken from economic and demographic growth scenarios representing development in the study area. From these, growth figures for the population and jobs per economic sector (industry, commerce and services) are derived and entered into the model as trend lines. Then the Global growth figures are imposed as constraints on the Regional level. At the Regional level consisting of 5 counties in the Greater Dublin activities and residents based on the relative attractiveness of the counties. Then, at the Local level the detailed allocation of economic activities and people is modelled by means of a Cellular Automata based land use model. Thus, estimates of the population will be provided for within residential and estimates of the economic activities will be provided for within industrial, commercial, and service land use types. The land use type assigned to any given cell is determined by an algorithm which aims to satisfy the demands for land use in each time step [5]. The following main elements of the model determine whether a cell is taken in by a land use or not: Suitability: a composite measure determining the physical, ecological and environmental appropriateness of cells to support a land use and the associated economic or residential activity. It is presented by one map per modelled active land use class. Zoning: specifies whether a cell may or may not be taken over by a specific land use. It is usually based on statutory zoning designations. Figure 2: Land use transition in MOLAND. Page 2 of 7
184 Proceedings of ITRN2010, 31 st August to 1 st September 2010, University College Dublin, Ireland Accessibility: describes the accessibility of Purpose and Modes a cell to the transport network. The model allows for the introduction of trips for Neighbourhood rules: express the dynamic different purposes defined by the origin and impact of land uses in the surroundings of a location. For each cell a set of rules determines the degree to which it is attracted to, or repelled by, the other land use cells present in the neighbourhood. Based on these elements the model calculates the transition potential for each cell for every simulation time step (Figure 2). Cells are changed to the land use for which they have the highest potential until regional demands are met. 2.1 MOLAND Transport model The MOLAND Transport model is built as an additional element in the MOLAND toolbox. It is based on a classical four step approach [6]. The land use model serves as an input to the transportation model, whilst the transportation model again influences the land use model by means of a local accessibility term. Hence the MOLAND Transport model is a dynamic model. Both transport and land use are calculated for every time step (yearly). At the regional level, the transport model uses information from the land use model in the form of travel demands. Cells with land uses have a density of population or jobs that is used for calculating travel demand. Besides land uses associated with population and jobs, other land uses are actively used as well. Although they are not expressed in terms of activities and densities they still contribute to the transport model for estimation of transport flow direction. For example, recreational areas generate trips for people visiting them. The numbers of people and jobs per zone are used to calculate the production and attraction of each transport zone. Trips are then assigned to the transport network based on these travel demands and the costs to move from one zone to another. Costs are an aggregate measure for distance, travel time and other costs to move from one region to another. These costs are incorporated into the regional model as interregional distances and influence the distribution of activities over these regions. At the local level, the potential for certain land uses is determined by their local accessibility, among others i.e. their distance to the transport network and the influence of this. The influence on the local accessibility is dependent on the volume of traffic on that part of the network. destination, in this case home-to-work, work-tohome, work-to-work or other. It is assumed that different activities give rise to a number of trips, either as an origin or a destination. The MOLAND Transport model supports one mode modelled endogenously (in this case mode Private transport) and several modes modelled exogenously (in this case, one general mode Public transport). Transport Network The transport network is included as a GIS shape file. The database aligned to this shape file contains several fields, described below: Roadtype is an integer value that identifies the different road types for the transportation model. In the GDR model the following road types were used: Motorway, National, Regional, Other, Railway, Motorway Junctions and Railway Stations. AccType is an integer value that identifies road types for the local accessibility. Length is a double field expressing the length of a single link in meters. Speedlimit is a double field representing the speed limit on a particular link expressed as kilometres per hour. The total capacity of a link is indicated with Capacity, which is expressed as mode equivalent per hour. The mode equivalent is typically the number of cars. Besides the speed limit, the capacity depends on the available number of lanes. Extracost is a field to indicate costs represented in Euros that are intrinsic to travelling on a link, for example toll costs. The road and rail networks of 1990, 2000 and 2006 years were used in the MOLAND model GDR application. To prevent inconsistencies the 1990 and 2000 datasets were derived from the most up to date 2006 dataset, thus ensuring positional accuracy between the reference years [7]. For accessibility mapping the key data required is the position of motorways and primary and secondary road junctions. To ensure these positions were as accurate as possible the existing dataset was compared with ancillary data provided by the Dublin Transportation Office and any required modifications were applied to the dataset. Transport Zones The MOLAND transport model also requires a map indicating the boundaries of the transport zones. The boundaries of the regions (counties) should Page 3 of 7
185 also be boundaries of the transport zones; in other place of residence, at an Electoral District (ED) words a transport zone must be fully contained in level, and place of work, at a 250 sq m level, along only one county and every cell of each county with socio-economic information and information should be covered by exactly one transport zone. about the principal mode of travelling to work, Based on these and other requirements the transport school or college. zone map of the GDR was developed using the Within the remit of the transport model data boundaries of the Urban and Rural Districts defined preparation scheme, a series of matrices were by the CSO [1]. Initially, thirty-three transport required to describe the number of trips within the zones were defined for the 5 counties. As a result study area. These trips flow from one origin to Dublin city was covered by only one transport multiple destinations and vice versa. As a result, the zone. However, given the high volume of transport information from POWCAR of most use in this flows in the city region Dublin was further work is that pertaining to both place of residence subdivided using Local Electoral Area boundaries. and place of work, at an ED level, and on the means Figure 3 illustrates the resulting 44 zones. of travel to work. The initial process involved the development of the 2006 transport flow Origin-Destination matrices. From the point of view of adequate calibration, it was also necessary to develop a series of matrices that describe the 2000 situation. In the absence of firm data for this year, a set of assumptions are made in order to estimate 2000 levels in terms of trip numbers. Details of data preparation and estimation for the transport model are described by Shahumyan et al. in [7]. 2.2 The Model Calibration In the scope of Urban Environment Project the MOLAND model was adjusted and calibrated for the Greater Dublin Region based on 1990, 2000 and 2006 social-demographic, transport and land use datasets [8]. Results of the calibration show that MOLAND performs quite well in terms of regional estimates of population and jobs, which compare favourably with actual estimates and constant share projections. Fuzzy kappa comparisons and cluster size frequency plots of the simulated maps also show that the model simulates realistic images of development trends and the spatial dynamics of the region [8]. The Transport model was calibrated separately by Research Institute for Knowledge Systems (RIKS) based on 2000 and 2006 datasets. 3 SCENARIOS The MOLAND model was used to simulate and Figure 3. The MOLAND transport zones for GDR analyse two scenarios of development in the GDR Traffic Flows In order to populate the various data tables within the transport model, an examination was carried out of the 2006 Place of Work Census of Anonymised Records (POWCAR) data set provided by the CSO [1]. This dataset contains just over 1.8 million records and provides information at an individual, but anonymised level for all persons over the age of 15 years in the State. Information is provided about Page 4 of 7 from 2006 to 2026: Scenario 1: Business as Usual (BU) - a continuation of the current settlement patterns, without substantial development in transport infrastructure. Scenario 2: Metro North (MN) - a continuation of the current settlement patterns, with implementation of the Metro North project of Transport 21 by 2016.
186 The CSO s regional population projection M2F1 Traditional [3] was used for both scenarios. It combines continuing though declining international migration with constant fertility and a return to the traditional pattern of internal migration by But, the Greater Dublin Area (GDA) used in CSO projections, comprising the Mid-East region and the Dublin region, is of similar, though not identical extent to the MOLAND study area (GDR). The GDA consists of the Dublin, Meath, Kildare and Wicklow counties. The MOLAND study area consists of the Dublin, Meath, Kildare, Wicklow and Louth counties. Therefore, the population for Louth in 2026 was estimated and added to the projected GDA population in 2026 [7]. Place of work datasets for 2002 [2] and 2006 [1] were used to estimate the appropriate job numbers for 2026 [7]. The summary results are presented in the table below. Table 1. Population and employment data of GDR used in the MOLAND model Population 1,773,803 2,553,149 Industry jobs 259, ,573 Commerce jobs 321, ,519 Services jobs 211, ,129 As the name suggests, Scenario 1 explores a continuation of the current, dispersed settlement patterns. Reflecting the current economic climate delivery of Transport 21 projects is delayed. Scenario 2 also explores dispersed settlement patterns using the same population and job projections. However, Metro North is in place by Using underground, surface and elevated tracks, Metro North will operate from St Stephen's Green, via Dublin Airport, to Belinstown, north of Swords (Figure 4). An estimated 35 million passengers a year will travel on this service. The journey time from St Stephen's Green to Dublin Airport will be in the region of 20 minutes [11]. Figure 4 shows Metro North and the transport zones it intersects within Dublin. Page 5 of 7 Figure 4. Metro North and the transport zones used in the model 4 RESULTS The focus of this study was to estimate the influence of the implementation of Metro North project on travel and land use patterns in the area. Therefore the same projections of population and jobs, and the same accessibility parameters were used in both scenarios. The differences in the simulated land use maps presented in Figure 5 are not significant and can be explained by the random factor in the CA algorithm [5]. However there are noticeable differences in the transport indicators calculated by the model. The total number of trips in the GDR by private transport is about 0.5% more in the case of the BU scenario; whilst for public transport it is 2.1% more in the case of the MN scenario. This is because with the introduction of a quicker and shorter public transport option in the MN scenario, the generalised cost of travel by public transport is reduced resulting in higher usage of public transport. Average trip distance in the region for both transport modes are about the same for both

187 scenarios, 9.5 km for private and 10.5 km for public transport is about 4% higher in the case of the BU transport. scenario. Whilst in the MN scenario there are 20% more trips between these zones generated by public transport. This shows the immediate impact of the project on specific zones is quite significant. 5 FURTHER RESEARCH Initial results of the study are interesting and illustrate the potential of MOLAND with a detailed transport model to assess the impacts of a new transport infrastructure on traffic flows However, it has to be noted that whilst MOLAND helps us to understand trends and provides predictions of future land use and transportation changes; in reality it offers not predictions of the future, but predictions of possible futures. Each time the model is run it gives different predictions, both because of random elements and because of bifurcations inherent in the dynamics of the model [10]. To overcome these limitation simulations should be run a sufficient number of times; and maps and indicators of all the output possibilities should be produced. Indicator values can then be averaged across a number of runs; and the land use maps can be presented as a probability map. Figure 5. Comparison of urban areas in County Dublin from GDR 2026 maps generated by BU and MN scenarios Average trip duration in the region by private transport is about 9 minutes in both scenarios. Trip average duration by public transport is about 29 minutes in the case of the BU scenario and 28 minutes in the case of the MN scenario. Though a 1 minute difference does not seem significant, it is noted that it is based on the average trip duration for all 44 transport zones in the region, while Metro North line intersects with only 6 of them (Figure 4). Furthermore, the transport flow between zones was analysed, concentrating on the zones intersected by the Metro North line. As illustrated in Figure 4 the Metro intersects transport zones numbered 14, 16, 17, 21, 23 and 28. The comparison shows that the number of trips between these zones by private CONCLUSIONS The MOLAND transport model was successfully tested for the Greater Dublin Region, running two possible scenarios of the regions development. The influence of the implementation of the Metro North line was analysed to show its effect on the transport flow in the region, generated trips, their average durations and distances. It was suggested that Metro North line will encourage people to travel by public transport more then by private transport. The overall increase of the trips by public transport in the region was estimated at about 2% more in the case of the Metro North scenario. Moreover, this number is much higher, approximately 20% in the zones adjacent to the Metro North line. The importance of further research was emphasised in order to produce more reliable results. Particularly the generation of probability maps and calculation of indicators based on multiple simulations were suggested as a solution. ACKNOWLEDGEMENTS The Urban Environment Project is generously sponsored by the Irish Environmental Protection Agency as part of the ERTDI programme which is funded through the National Development Plan CD-U1-M1 Decision support tools for managing urban environment in Ireland Page 6 of 7
PERSONALISED TRAVEL PLANNING IN MIDLETON, COUNTY CORK
 PERSONALISED TRAVEL PLANNING IN MIDLETON, COUNTY CORK Elaine Brick Principal Transport Planner AECOM Abstract Smarter Travel funding was awarded to the Chartered Institute of Highways and Transportation
GD 0043/18 ACTIVE TRAVEL STRATEGY
 GD 0043/18 ACTIVE TRAVEL STRATEGY 2018-2021 May 2018 Minister s Introduction There is strong evidence that regular physical activity reduces the risk of a range of health conditions. The best way to increase
Engineers and Walkability A match made in heaven or a toxic relationship?
 Engineers and Walkability A match made in heaven or a toxic relationship? The Cleaner, Greener, Leaner Study Lorraine Fitzsimons D Arcy Centre for Preventative Medicine, Dublin City University (PhD Candidate)
Living Streets response to the Draft London Plan
 Living Streets response to the Draft London Plan Contents Living Streets response to the Draft London Plan... 1 About Living Streets... 2 Summary... 2 Consultation response... 3 Chapter 1: Planning London
2. Context. Existing framework. The context. The challenge. Transport Strategy
 Transport Strategy Providing quality connections Contents 1. Introduction 2. Context 3. Long-term direction 4. Three-year priorities 5. Strategy tree Wellington City Council July 2006 1. Introduction Wellington
Determining bicycle infrastructure preferences A case study of Dublin
 *Manuscript Click here to view linked References 1 Determining bicycle infrastructure preferences A case study of Dublin Brian Caulfield 1, Elaine Brick 2, Orla Thérèse McCarthy 1 1 Department of Civil,
This objective implies that all population groups should find walking appealing, and that it is made easier for them to walk more on a daily basis.
 Walking for life The Norwegian Walking Strategy Guro Berge Norwegian public Roads Administration "Walking for life" is the slogan for the National Walking Strategy that is now being formulated in Norway.
The Walkability Indicator. The Walkability Indicator: A Case Study of the City of Boulder, CO. College of Architecture and Planning
 1 : A Case Study of the City of Boulder, CO College of Architecture and Planning University of Colorado Author Note: Daryoosh Ardalan, Urban Regional Planning, College of Architecture and Planning, University
Walking and Cycling Action Plan Summary. A Catalyst for Change The Regional Transport Strategy for the west of Scotland
 Walking and Cycling Action Plan Summary A Catalyst for Change The Regional Transport Strategy for the west of Scotland 2007-2021 Strathclyde Partnership for Transport Contents Purpose...2 Issues, Constraints
Active Travel Strategy Dumfries and Galloway
 Active Travel Strategy Dumfries and Galloway Our Active Travel Strategy The agreed Interventions for Dumfries and Galloway Council s Local Transport Strategy includes an action to Develop an Active Travel
DRAFT for a State Policy for Healthy Spaces and Places
 DRAFT for a State Policy for Healthy Spaces and Places 1 DRAFT State Policy for Healthy spaces and Places 1. Purpose To encourage the use and development of land that builds healthy communities through
BICYCLE INFRASTRUCTURE PREFERENCES A CASE STUDY OF DUBLIN
 Proceedings 31st August 1st ITRN2011 University College Cork Brick, McCarty and Caulfield: Bicycle infrastructure preferences A case study of Dublin BICYCLE INFRASTRUCTURE PREFERENCES A CASE STUDY OF DUBLIN
Summary Report: Built Environment, Health and Obesity
 Research and education Built Environment Edmonton Project Summary Report: Built Environment, Health and Obesity Introduction In 2007 the Canadian Institutes of Health Research and the Heart and Stroke
Sustainable Urban Mobility Plan for Aberdeen, Scotland. Louise Napier Senior Planner Aberdeen City Council
 Sustainable Urban Mobility Plan for Aberdeen, Scotland Louise Napier Senior Planner Aberdeen City Council A bit about me.. Louise Napier Senior Planner (Transport Strategy & Programmes) Aberdeen City Council
University of Leeds Travel Plan
 University of Leeds Travel Plan 2015-2018 Contents 1: Introduction 1.1 What is a Travel Plan? 1.2 Why do we need one? 1.3 Sustainability Strategy 2: Overview 2.1 The bigger picture 2.2 The City scale 2.3
Section 2 Strategic Alignment. Contents
 Section 2 Strategic Alignment Contents 2 Strategic Alignment... 2 2.1 General... 2 2.2 SmartGrowth Strategy and Implementation Plan... 2 2.3 Walking and Cycling Strategy... 3 2.4 Built Environment Strategy...
Paper submitted to the Scottish Transport Studies Group (STSG) April 2004
 April 2004") A SURVEY OF TRAVEL BEHAVIOUR IN EDINBURGH Paper submitted to the Scottish Transport Studies Group (STSG) April 2004 Tim Ryley Research Fellow Transport Research Institute Napier University 1. Introduction
A SURVEY OF TRAVEL BEHAVIOUR IN EDINBURGH Paper submitted to the Scottish Transport Studies Group (STSG) April 2004 Tim Ryley Research Fellow Transport Research Institute Napier University 1. Introduction
RE-CYCLING A CITY: EXAMINING THE GROWTH OF CYCLING IN DUBLIN
 Proceedings ITRN2013 5-6th September, Caulfield: Re-cycling a city: Examining the growth of cycling in Dublin RE-CYCLING A CITY: EXAMINING THE GROWTH OF CYCLING IN DUBLIN Brian Caulfield Abstract In the
Launceston's Transport Futures. Greater travel options for the people of Launceston
 Launceston's Transport Futures Greater travel options for the people of Launceston Final Draft 13 Jan 2014 1 Page Number Executive summary 3 What is Transport Futures? 4 Vision 6 Economy, access and liveability
Ormond & McKinnon Walks Response to Draft Glen Eira Community Plan
 Response to Draft Glen Eira Community Plan We would like to take this opportunity to thank Glen Eira City Council for the opportunity to comment on the Glen Eira Draft Community Plan. Below is an outline
TOWARDS A BIKE-FRIENDLY CANADA A National Cycling Strategy Overview
 TOWARDS A BIKE-FRIENDLY CANADA A National Cycling Strategy Overview NationalCyclingStrategFrameworkv3.indd 1 Potential for this modal shift can be found in municipalities of all sizes, in every population
Cycle traffic and the Strategic Road Network. Sandra Brown, Team Leader, Safer Roads- Design
 Cycle traffic and the Strategic Road Network Sandra Brown, Team Leader, Safer Roads- Design Highways England A Government owned Strategic Highways Company Department for Transport Road Investment Strategy
Exhibit 1 PLANNING COMMISSION AGENDA ITEM
 Exhibit 1 PLANNING COMMISSION AGENDA ITEM Project Name: Grand Junction Circulation Plan Grand Junction Complete Streets Policy Applicant: City of Grand Junction Representative: David Thornton Address:
Douglas Land Use and Transportation Strategy (DLUTS) Summary. August 2013
 Summary. August 2013") Douglas Land Use and Transportation Strategy (DLUTS) Summary August 2013 Background Douglas is a large and popular residential suburb of approximately 30,000 persons on the periphery of Cork City along
Douglas Land Use and Transportation Strategy (DLUTS) Summary August 2013 Background Douglas is a large and popular residential suburb of approximately 30,000 persons on the periphery of Cork City along
DOE Climate Change Proposals
 DOE Climate Change Proposals Sustrans response to Proposals for Taking Forward NI Climate Change Legislation January 2016 About Sustrans Sustrans makes smarter travel choices possible, desirable and inevitable.
Frequently asked questions about how the Transport Walkability Index was calculated are answered below.
 Transport Walkability Index The Transport Walkability Index is a relative indicator of how well the built environment in different areas supports walking for transport. The index is frequently used in
UWE has obtained warranties from all depositors as to their title in the material deposited and as to their right to deposit such material.
 Melia, S. (2012) Filtered and unfiltered permeability: The European and Anglo-Saxon approaches. Project, 4. pp. 6-9. ISSN 2042-7654 Available from: http://eprints.uwe.ac.uk/16905 We recommend you cite
GETTING WHERE WE WANT TO BE
 CAMBRIDGESHIRE & peterborough GETTING WHERE WE WANT TO BE A GREEN PARTY TRANSPORT POLICY CONTENTS Our Campaign Priorities 4 Bus Franchising 6 Supporting Active Transport 8 Workplace Parking Levy 9 Tackling
Climate Change Action Plan: Transportation Sector Discussion Paper: Cycling
 Climate Change Action Plan: Transportation Sector Discussion Paper: Cycling ontario.ca/climatechange Contents 1. Minister of Transportation s message... 3 2. Introduction... 5 3. Sector Overview and Support
ANNEX1 The investment required to achieve the Government s ambition to double cycling activity by 2025
 ANNEX1 The investment required to achieve the Government s ambition to double cycling activity by 2025 May 2016 About Sustrans Sustrans makes smarter travel choices possible, desirable and inevitable.
City of Novi Non-Motorized Master Plan 2011 Executive Summary
 City of Novi Non-Motorized Master Plan 2011 Executive Summary Prepared by: February 28, 2011 Why Plan? Encouraging healthy, active lifestyles through pathway and sidewalk connectivity has been a focus
Reflections on our learning: active travel, transport and inequalities
 Reflections on our learning: active travel, transport and inequalities Jill Muirie Glasgow Centre for Population Health Active travel definition Active travel refers to walking, cycling or using some other
ABERDEEN: CITY OF THE FUTURE
 ABERDEEN: CITY OF THE FUTURE A contribution towards discussions on a future transport strategy for Aberdeen and its Region Prepared by the Centre for Transport Research University of Aberdeen June 2010
Kevin Manaugh Department of Geography McGill School of Environment
 Kevin Manaugh Department of Geography McGill School of Environment Outline Why do people use active modes? Physical (Built environment) Factors Psychological Factors Empirical Work Neighbourhood Walkability
Baseline Survey of New Zealanders' Attitudes and Behaviours towards Cycling in Urban Settings
 Baseline Survey of New Zealanders' Attitudes and Behaviours towards Cycling in Urban Settings Highlights 67% of urban New Zealanders, 18 years of age or more own or have access to a bicycle that is in
City of Perth Cycle Plan 2029
 Bicycling Western Australia s response City of Perth Cycle Plan 2029 2012-2021 More People Cycling More Often ABOUT BICYCLING WESTERN AUSTRALIA Bicycling Western Australia is a community based, not-for-profit
Active travel and economic performance: A What Works review of evidence from cycling and walking schemes
 1 Making the economic case for active travel Active travel and economic performance: A What Works review of evidence from cycling and walking schemes Active Travel Toolkit Slide Pack July 2017 Active travel
Regional Cycling Plan
 Adopted December 2008 Quality for Life Adopted December 2008 For more information, contact: Greater Wellington 142 Wakefield Street PO Box 11646 Manners Street Wellington 6142 T 04 384 5708 F 04 385 6960
Integrated Urban Mobility
 Integrated Urban Mobility The Berlin Experience Forum Urba 2015 Conference Montreal, 23 th March 2011 Maria Krautzberger Permanent Secretary of State, Senate Department for Urban Development, Berlin The
Feasibility Analysis of China s Traffic Congestion Charge Legislation
 International Conference on Social Science and Technology Education (ICSSTE 2015) Feasibility Analysis of China s Traffic Congestion Charge Legislation Wang Jiyun Beijing Jiaotong University Law School
Rochester Area Bike Sharing Program Study
 roc bike share Rochester Area Bike Sharing Program Study Executive Summary ~ January 2015 JANUARY 2015 8484 Georgia Avenue, Suite 800 Silver Spring, MD 20910 3495 Winton Pl., Bldg E, Suite 110 Rochester,
smartertravel >>> The New Policy Framework for Transport in Ireland Aoife O Grady
 The New Policy Framework for Transport in Ireland Aoife O Grady National Sustainable Transport Office Why Smarter Travel? The new national policy Smarter Travel Areas What does this mean for What does
Update June 2018 OUR 2017 PUBLIC ENGAGEMENT
 Update June 2018 Hi, Let s Get Wellington Moving (LGWM) is developing a Recommended Programme of Investment (RPI) that meets our programme objectives and supports the city s and region s growth. As part
Non-motorized Transportation Planning Resource Book Mayor s Task Force on Walking and Bicycling City of Lansing, Michigan Spring 2007 pg.
 Non-motorized Transportation Planning Resource Book pg. 105 of 158 Non-motorized Transportation Planning Resource Book pg. 106 of 158 Non-motorized Transportation Planning Resource Book pg. 107 of 158
EXPLORING MOTIVATION AND TOURIST TYPOLOGY: THE CASE OF KOREAN GOLF TOURISTS TRAVELLING IN THE ASIA PACIFIC. Jae Hak Kim
 EXPLORING MOTIVATION AND TOURIST TYPOLOGY: THE CASE OF KOREAN GOLF TOURISTS TRAVELLING IN THE ASIA PACIFIC Jae Hak Kim Thesis submitted for the degree of Doctor of Philosophy at the University of Canberra
Birmingham Connected. Edmund Salt. Transportation Policy Birmingham City Council
 Birmingham Connected Edmund Salt Transportation Policy Birmingham City Council www.birmingham.gov.uk/connected Birmingham Connected the story so far Broadly following EU Guidance We ve done all of this
Final Plan 20 December 2016
 Final Plan 20 December 2016 Introduction Aims of the Travel Plan How do we travel? Understanding travel behaviours? The University Master Plan and its implications Galway City sustainable transport policies
THE PLANNING AND. Transport and the law Integrated transport planning Strategies Responsibilities of local government and road controlling authorities
 The planning and policy context Transport and the law Integrated transport planning Strategies Responsibilities of local government and road controlling authorities THE PLANNING AND POLICY CONTEXT Providing
What s the issue for transport in Cardiff?
 Demand for travel The number of commuters travelling to work in Cardiff has increased from 190,000 in 2001 to 198,000 in 2010, with some 124,000 Cardiff residents travelling across the city daily to their
Westminster s Joint Health and Wellbeing Strategy
 Westminster s Joint Health and Wellbeing Strategy 2013 2016 Response from Sustrans General comments From a strategic perspective, Sustrans welcomes the Health and Wellbeing Strategy s focus on encouraging
COUNCIL POLICY NAME: COUNCIL REFERENCE: 06/119 06/377 09/1C 10llC 12/1C INDEX REFERENCE: POLICY BACKGROUND
 COUNCIL POLICY NAME: COUNCIL ADVISORY COMMITTEES - TERMS OF REFERENCE ISSUED: APRIL 3, 2006 AMENDED: NOVEMBER 27, 2006 NOVEMBER 23, 2009 JANUARY 11, 2010 DECEMBER 17, 2012 POLICY COUNCIL REFERENCE: 06/119
ONE SIZE DOESN T FIT ALL RECONCILING OVERLAPPING TRANSPORT NETWORKS IN A CONSTRAINED URBAN ENVIRONMENT
 One Size Doesn t Fit All S Corbett, C Chenery Page 1 ONE SIZE DOESN T FIT ALL RECONCILING OVERLAPPING TRANSPORT NETWORKS IN A CONSTRAINED URBAN ENVIRONMENT Authors/Presenters: Sam Corbett, Principal Transport
Developing a Birmingham Transport Space Allocation policy. David Harris Transport Policy Manager Economy Directorate Birmingham City Council
 Developing a Birmingham Transport Space Allocation policy David Harris Transport Policy Manager Economy Directorate Birmingham City Council Birmingham s Sustainable Urban Mobility Plan Birmingham Connected
KEY FINDINGS OF THE INTERIM EVALUATION OF THE SMARTER TRAVEL AREAS PROGRAMME
 Proceedings 1st - 2nd September 2016 BRICK, CANTWELL, SWIFT: Smarter Travel Areas KEY FINDINGS OF THE INTERIM EVALUATION OF THE SMARTER TRAVEL AREAS PROGRAMME Elaine Brick Associate Director AECOM Mairead
4.1 Introduction. 4.2 Aspects of walkable communities
 4 Community walkability Community walkability Making communities walkable Urban form Feeling secure 4.1 Introduction Walkability describes the extent to which the built environment is walking-friendly.
Bristol City Council has produced a draft Bristol Transport Strategy document.
 Bristol Transport Strategy Summary Document Introduction Bristol City Council has produced a draft Bristol Transport Strategy document. The Strategy fills a gap in transport policy for Bristol. We have
March Maidstone Integrated Transport Strategy Boxley Parish Council Briefing Note. Context. Author: Parish Clerk 2 March 2016
 Context. Author: Parish Clerk 2 The Draft Integrated Transport Policy (DITS) sets out a vision and objectives, and identifies a detailed programme of interventions to support the Maidstone Borough Local
Purpose and Need. Chapter Introduction. 2.2 Project Purpose and Need Project Purpose Project Need
 Chapter 2 Purpose and Need 2.1 Introduction The El Camino Real Bus Rapid Transit (BRT) Project (Project) would make transit and other transportation improvements along a 17.6-mile segment of the El Camino
Sustainable Transport Solutions for Basseterre, St. Kitts - An OAS funded project (Feb 2013-Feb 2015)
") Sustainable Transport Solutions for Basseterre, St. Kitts - An OAS funded project (Feb 2013-Feb 2015) Presented by: Dr. Leighton Naraine PhD., MURP, MA, BA, Edu. Cert Director Employee, Program Development,
Sustainable Transport Solutions for Basseterre, St. Kitts - An OAS funded project (Feb 2013-Feb 2015) Presented by: Dr. Leighton Naraine PhD., MURP, MA, BA, Edu. Cert Director Employee, Program Development,
Public Consultation Centre For. Transportation Master Plan Update. Information Package
 Public Consultation Centre For Transportation Master Plan Update Information Package Date Location Hours Tuesday, September 12, 2017 Wednesday, September 13, 2017 Tuesday, September 19, 2017 Cambridge
TRANSPORTATION TOMORROW SURVEY
 Clause No. 15 in Report No. 7 of was adopted, without amendment, by the Council of The Regional Municipality of York at its meeting held on April 17, 2014. 15 2011 TRANSPORTATION TOMORROW SURVEY recommends
Exceeding expectations: The growth of walking in Vancouver and creating a more walkable city in the future through EcoDensity
 Exceeding expectations: The growth of walking in Vancouver and creating a more walkable city in the future through EcoDensity Melina Scholefield, P. Eng. Manager, Sustainability Group, City of Vancouver
Trial 3: Interactions Between Autonomous Vehicles and Pedestrians and Cyclists
 Trial 3: Interactions Between Autonomous Vehicles and Pedestrians and Cyclists What is VENTURER? VENTURER is a 5m research and development project funded by government and industry and delivered by Innovate
Building An Active Travel Future for Northern Ireland Consultation Response
 Building An Active Travel Future for Northern Ireland Consultation Response Belfast Healthy Cities welcomes the opportunity to comment on the Draft Active Travel Strategy. About Belfast Healthy Cities:
Aims and Objectives The main aims of the Walking Initiative pilot scheme were as follows:
 Title The Golden Flip Flop walking initiative Short description The Golden Flip Flop Walking Initiative was a practice developed within the overarching CIVITAS ARCIMEDES project. ARCHIMEDES (2008-2012)
Walkable Urbanism Impacts on Quality of Life Improvement
 Walkable Urbanism Impacts on Quality of Life Improvement Case Study: Knowledge and Innovation Community, Shanghai, China Adha Viala Urban Health Games Content } Research motivation and topic } Research
Target Group The target groups were cyclists, as well as representatives of creative arts and other members of the public.
 Title New Cycles Short description As part of the overarching CIVITAS MIMOSA project, the New Cycles practice was undertaken in Gdansk, Poland, between 2010-2012. It was part of a project aiming to promote
RESOLUTION NO ?? A RESOLUTION OF THE CITY OF NEPTUNE BEACH ADOPTING A COMPLETE STREETS POLICY
 RESOLUTION NO. 2018-?? A RESOLUTION OF THE CITY OF NEPTUNE BEACH ADOPTING A COMPLETE STREETS POLICY WHEREAS, safe, convenient, and accessible transportation for all users is a priority of the City of Neptune
Speed Limit Policy Isle of Wight Council
 APPENDIX B Speed Limit Policy Isle of Wight Council 2009 Contents Section 1 Introduction 1.1 Links with the Local Transport Plan Section 2 Speed Limits on Urban Roads and Residential Areas 2.1 20mph Limits
WEST YORKSHIRE LTP CYCLE PROSPECTUS
 WEST YORKSHIRE LTP CYCLE PROSPECTUS The West Yorkshire Ambition: To be recognised as a great place for safe cycling, inspiring more people to cycle more often. INTRODUCTION Cycling is low cost, environmentally
UNDERSTANDING WALKING NETWORKS TO ENABLE SMARTER CHOICES IN TRANSPORT PLANNING IN DUNDEE. Gillian Iversen Atkins
 UNDERSTANDING WALKING NETWORKS TO ENABLE SMARTER CHOICES IN TRANSPORT PLANNING IN DUNDEE Gillian Iversen Atkins 1. INTRODUCTION 1.1. Smarter Choices, Smarter Places The Smarter Choices agenda encourages
9. Parking Supporting Statement
 9. Parking Supporting Statement Content 1. Setting the Scene 2. Vision 3. Parking and the Shared Priorities 4. Issues 5. Delivery Programme in the first Plan Period 2001/02 2005/06 6. Good Practice 7.
Young Researchers Seminar 2009
 Young Researchers Seminar 2009 Torino, Italy, 3 to 5 June 2009 LOCALISATION OF SHOPPING MALLS IN SCANDINAVIA Planning regulations as a policy instrument for reducing greenhouse gas emissions Institute
Transportation Master Plan Advisory Task Force
 Transportation Master Plan Advisory Task Force Network Alternatives & Phasing Strategy February 2016 BACKGROUND Table of Contents BACKGROUND Purpose & Introduction 2 Linking the TMP to Key Council Approved
VGI for mapping change in bike ridership
 VGI for mapping change in bike ridership D. Boss 1, T.A. Nelson* 2 and M. Winters 3 1 Unviersity of Victoria, Victoria, Canada 2 Arizona State University, Arizona, USA 3 Simon Frasier University, Vancouver,
E4 Cycle Route Exeter University to Redhayes Bridge. - Recommendations from Exeter Cycling Campaign
 E4 Cycle Route Exeter University to Redhayes Bridge - Recommendations from Exeter Cycling Campaign 1.0 Introduction Exeter Cycling Campaign has prepared this report to provide recommendations for Devon
International Journal of Research (IJR) Vol-1, Issue-8, September *
 Vol-1, Issue-8, September *") Development towards Sustainable Transportation Planning in India through Management of Non-motorized Transport Akshay Patil 1 * & 2 * 1 3 rd year B. Tech Planning student at College of Engineering Pune,
Development towards Sustainable Transportation Planning in India through Management of Non-motorized Transport Akshay Patil 1 * & 2 * 1 3 rd year B. Tech Planning student at College of Engineering Pune,
Active Travel and Exposure to Air Pollution: Implications for Transportation and Land Use Planning
 Active Travel and Exposure to Air Pollution: Implications for Transportation and Land Use Planning Steve Hankey School of Public and International Affairs, Virginia Tech, 140 Otey Street, Blacksburg, VA
5. Pedestrian System. Accomplishments Over the Past Five Years
 5. Pedestrian System Accomplishments Over the Past Five Years The Alamo Area Metropolitan Planning Organization (MPO) and its partner agencies recognize the importance of improving pedestrian mobility.
How to achieve fluid traffic
 Kanton Basel-Stadt How to achieve fluid traffic Objectives, instruments and limits of traffic management Alain Groff, Office for Mobility, Canton of Basel-Stadt Overview Some figures about Basel Tools
Bike share success factors
 Bike share success factors A guide to the types of locations where bike share can flourish January 2016 Bike share success factors A guide to the types of locations where bike share can flourish and how
Planning and Design of Proposed ByPass Road connecting Kalawad Road to Gondal Road, Rajkot - Using Autodesk Civil 3D Software.
 Planning and Design of Proposed ByPass Road connecting Kalawad Road to Gondal Road, Rajkot - Using Autodesk Civil 3D Software. 1 Harshil S. Shah, 2 P.A.Shinkar 1 M.E. Student(Transportation Engineering),
Transport attitudes, residential preferences, and urban form effects on cycling and car use.
 Downloaded from orbit.dtu.dk on: Mar 10, 2019 Transport attitudes, residential preferences, and urban form effects on cycling and car use. Nielsen, Thomas Alexander Sick; Olafsson, Anton Stahl; Carstensen,
1.5 On this basis it is fundamental that the Transport Strategy for the site focuses on the following key criteria,
 1.0 Introduction 1.1 The Transport Assessment has been prepared on behalf of Eon and Roger Bullivant Ltd in respect of the proposed mixed use sustainable urban extension of Drakelow Park. 1.2 The methodology
Walking and urban planning. Maurizio TIRA Environmental Engineer, Full Professor of Town and regional planning Università degli Studi di Brescia
 Walking and urban planning Environmental Engineer, Full Professor of Town and regional planning Università degli Studi di Brescia The presentation analyses the main obstacles to walking and shows how planning
Delivering the. Strategy 7.0
 7.0 Delivering the Strategy 7.1 Introduction This chapter presents a framework for the delivery of the strategy. Key challenges and opportunities are identified that will have an impact on the successful
The Limassol SUMP Planning for a better future. Apostolos Bizakis Limassol, May 16, th Cyprus Sustainable Mobility and ITS conference
 The Limassol SUMP Planning for a better future Apostolos Bizakis Limassol, May 16, 2017 5 th Cyprus Sustainable Mobility and ITS conference Αbout Limassol Αbout Limassol The second largest city in Cyprus
CITY OF BLOOMINGTON COMPLETE STREETS POLICY
 CITY OF BLOOMINGTON COMPLETE STREETS POLICY POLICY OBJECTIVE: The City of Bloomington will enhance safety, mobility, accessibility and convenience for transportation network users of all ages and abilities,
Urban Transport Policy-making changing perspectives and consequences
 Urban Transport Policy-making changing perspectives and consequences Peter Jones, UCL ITLS, University of Sydney, 28 th March 2018 Overview Changing urban transport policy perspectives From car-based to
Municipal waste management in Cyprus
 Municipal waste management in Cyprus Prepared by Ioannis Bakas ETC/SCP February 2013 EEA project manager Almut Reichel 1 Author affiliation Ioannis Bakas, Copenhagen Resource Institute, http://www.cri.dk/
Planning Daily Work Trip under Congested Abuja Keffi Road Corridor
 ISBN 978-93-84468-19-4 Proceedings of International Conference on Transportation and Civil Engineering (ICTCE'15) London, March 21-22, 2015, pp. 43-47 Planning Daily Work Trip under Congested Abuja Keffi
DEVELOPMENT OF A SET OF TRIP GENERATION MODELS FOR TRAVEL DEMAND ESTIMATION IN THE COLOMBO METROPOLITAN REGION
 DEVELOPMENT OF A SET OF TRIP GENERATION MODELS FOR TRAVEL DEMAND ESTIMATION IN THE COLOMBO METROPOLITAN REGION Ravindra Wijesundera and Amal S. Kumarage Dept. of Civil Engineering, University of Moratuwa
Design Principle Active Transport
 Active Transport Definition Active transport includes non-motorised forms of transport involving physical activity, such as walking and cycling. It also includes public transport to meet longer distance
THESE DAYS IT S HARD TO MISS the story that Americans spend
 WHICH COMES FIRST: THE NEIGHBORHOOD OR THE WALKING? BY SUSAN HANDY AND PATRICIA MOKHTARIAN THESE DAYS IT S HARD TO MISS the story that Americans spend more time stuck in traffic than ever, that they re
Welcome Pre-conference Workshop Walk21, Vienna, 20 October 2015
 Welcome Pre-conference Workshop Walk21, Vienna, 20 October 2015 Measuring Walking (part VII): International Walking Data Standard and its benefit Daniel Sauter, Urban Mobility Research, Zurich, Switzerland
Introduction. Mode Choice and Urban Form. The Transportation Planner s Approach. The problem
 Introduction The table below shows transit s share in the urban US (all trip purposes) and the 10 urban areas where it is most popular (2008 data): Mode Choice and Urban Form Philip A. Viton April 4, 2014
Using a Mixed-Method Approach to Evaluate the Behavioural Effects of the Cycling City and Towns Programme
 1 of 25 Using a Mixed-Method Approach to Evaluate the Behavioural Effects of the Cycling City and Towns Programme Kiron Chatterjee (Centre for Transport & Society, UWE) with acknowledgements to research
Active Transportation Infrastructure Investment A Business Case
 Active Transportation Infrastructure Investment A Business Case In 2016, the Real Estate Foundation awarded the Capital Regional District a $50,000 grant for Shifting Gears: Land Use Change through Active
Joint Response to the Department for Transport Consultation on the Station Champions Report on Better Rail Stations. February 2010
 Joint Response to the Department for Transport Consultation on the Station Champions Report on Better Rail Stations Joint Response to the Better Rail Stations Consultation This response has been prepared
21.07 TRANSPORT CONNECTIVITY AND INFRASTRUCTURE
 21.07 TRANSPORT CONNECTIVITY AND INFRASTRUCTURE 21.07-1 Connectivity and Choice Transport connectivity and mode choice are critical to achieving productive, sustainable and socially just cities. Travel