Outcomes of the Cycling City and Towns programme: monitoring project report
|
|
|
- Cathleen Foster
- 5 years ago
- Views:
Transcription
1 Outcomes of the Cycling City and Towns programme: monitoring project report Individual town results: Shrewsbury April 2017 Report authors: Andy Cope, Research and Monitoring Unit, Sustrans Angela Kennedy, Research and Monitoring Unit, Sustrans Fiona Crawford, Research and Monitoring Unit, Sustrans Nick Cavill, Cavill Associates John Parkin, University of the West of England, Bristol Lynn Sloman, Transport for Quality of Life PART A: INTRODUCTION PART B: DATA COLLECTION AND ANALYTICAL METHODOLOGIES PART C: OVERALL FINDINGS PART D: INDIVIDUAL TOWN RESULTS PART D1: BLACKPOOL PART D2: CAMBRIDGE PART D3: CHESTER PART D4: COLCHESTER PART D5: GREATER BRISTOL PART D6: LEIGHTON LINSLADE PART D7: SHREWSBURY PART D8: SOUTHEND PART D9: SOUTHPORT PART D10: STOKE-ON-TRENT PART D11: WOKING PART D12: YORK
2 About Sustrans Sustrans is the charity making it easier for people to walk and cycle. We are engineers and educators, experts and advocates. We connect people and places, create liveable neighbourhoods, transform the school run and deliver a happier, healthier commute. Sustrans works in partnership, bringing people together to find the right solutions. We make the case for walking and cycling by using robust evidence and showing what can be done. We are grounded in communities and believe that grassroots support combined with political leadership drives real change, fast. Join us on our journey. Head Office Sustrans 2 Cathedral Square College Green Bristol BS1 5DD Sustrans April 2017 Registered Charity No (England and Wales) SC (Scotland) VAT Registration No Acknowledgments The authors are grateful for the extensive assistance of officers in the twelve Cycling City and Towns in supplying monitoring data for this research. We are also grateful for additional support provided by Lisa Muller, Katie Pullen, George Macklon, Katie Thomson, James O Hare, Richard Sanders, Alison Janes, Hannah Delaney, Laurence Bonner, Peter Stephenson, Charlotte Draycott and Jo Watson. Disclaimer Although this report was commissioned by the Department for Transport (DfT), the recommendations are those of the authors and do not necessarily represent the views of the DfT. While every effort has been made to ensure the information in this document is accurate, DfT does not guarantee the accuracy, completeness or usefulness of that information; and it cannot accept liability for any loss or damages of any kind resulting from reliance on the information or guidance this document contains. Mapping (c) Crown Copyright licence no Also OpenStreetMap (c) (and) contributors licence CC-BY-SA ( Outcomes of the Cycling City and Towns programme: monitoring project report
3 Table of contents 1 Introduction Description of the Cycling City and Towns programme in Shrewsbury Expenditure Summary of available monitoring data Summary of headline findings Analysis of automatic cycle counter data Town-wide analysis Analysis of data from individual counter sites Relationship between programme activity and automatic count data Analysis of manual count data M counts C counts Analysis of school related data PLASC Bike It Analysis of counts of parked bicycles data Analysis of casualty data Analysis of physical activity data Maps Outcomes of the Cycling City and Towns programme: monitoring project report
4 1 Introduction 1.1 Description of the Cycling City and Towns programme in Shrewsbury The Cycling City and Towns programme delivered in Shrewsbury Cycle Shrewsbury - aimed to increase the number of trips in the town made by bicycle, and included targets to increase levels of cycling to work and school, trips by cycle to access the town centre and recreational cycling 1. Infrastructure developments included the improvement of more than 5km of cycle routes, focusing on improving crossings and filling gaps in the existing network. Infrastructure schemes of particular benefit to workplaces include developments around Telford Way (including reduced speed limits, improved crossings and the provision of cycling facilities on either side of the road). Access to industrial estates in the Harlescott area has been improved, with the widening and surfacing of a traffic-free cycle path. Shrewsbury has also been in receipt of Connect2 funding for schemes to improve connectivity between the town centre and the north of the town. Cycle Shrewsbury has engaged with schools to improve access routes and crossings, provide training and install cycle parking. Cycle Shrewsbury targeted a number of workplaces in the town, delivering training, providing grants for cycle parking, bespoke maps and journey planning information. In order to encourage leisure cycling, Cycle Shrewsbury delivered led rides and published a number of leaflets including those promoting family friendly rides, circular leisure rides and rides incorporating travel by train. A number of events, estimated to have engaged with over 5,200 people, were delivered during the programme period including cycling festivals, guided rides, infrastructure opening events, cycle to work days and school events. 1.2 Expenditure While this report is primarily concerned with the monitoring evidence around outcomes of the Cycling City and Towns programme, it is useful to place these in context through summarising the programme inputs in terms of capital and revenue expenditure. Details of expenditure in Shrewsbury during the Cycling City and Towns programme are summarised in Table Shrewsbury Cycling Town (2011) End of Programme Report ( ), Shrewsbury Cycling Town. Available at [Accessed 31 May 2012] 4 Outcomes of the Cycling City and Towns programme: monitoring project report
5 Table 1-1 Funds invested in cycling in Shrewsbury revenue capital Total Cycling England/DfT/DH investment 578,303 1,517,697 2,096,000 Matched funding 227,366 1,319,752 1,547,118 Total 805,669 2,837,449 3,643, Summary of available monitoring data The following data sources are available: Data from 21 automatic cycle counters 12 hour manual counts performed annually since 2006 at 11 locations ( C counts ) and at 12 locations annually since 2006 increasing in frequency to quarterly since September 2009 ( M counts ) Pupil Level Annual School Census (PLASC) travel data and monitoring data from Bike It counts of parked bicycles STATS19 casualty data Active People Survey (APS) data. 1.4 Summary of headline findings Consistent evidence of growth in levels of cycling from a moderate initial baseline The most complete data sets, time series data from automatic cycle counters located predominantly on traffic-free cycle routes, indicate a growth in cycling over time. The evidence from manual count data also suggests an overall increase in cyclists accessing the town centre. Notwithstanding the limitations of the data source, levels of cycling to primary and secondary schools appear to have increased over time, although the direction of change for primary schools is not consistent year-to-year across the time series. Schools engaged with Bike It have seen a significant increase in the numbers of children cycling to school everyday. Automatic cycle counter data indicate an increase in volumes of cycles counted of +15% against a 2007 baseline. Based on data from the 21 automatic cycle counters, this growth corresponds to an increase from an estimated 2,475 trips per day counted in 2007 to 2,835 in 2011 An increase was observed at 16 of the automatic cycle counter sites, a decrease at three sites and no change at one site. Insufficient data are available to comment on the change over time at the remaining site Comparing manual counts performed at consistent locations annually since 2005 indicates a mixed picture of change, although an overall increase in cyclists into the town centre has been observed Across all schools, the percentage of children cycling to school as measured by PLASC was 8.7% in 2010/11 compared to 7.4% in 2006/07 5 Outcomes of the Cycling City and Towns programme: monitoring project report
6 Bike It data indicate an increase in children cycling to school on the day of the survey from 5.8% in pre surveys to 15.5% in post survey, and an increase in children cycling to school everyday from 6.1% in the pre survey to 11.9% in the post survey Comparison of counts of parked bicycles data collected in consistent months across Shrewsbury in 2010 and 2011 suggests an increase in the volumes of bicycles parked of +28% Compared to pre-programme data, the total number of cycling casualties has decreased significantly during the Cycling City and Town programme, although the absence of data for 2010 makes it difficult to draw conclusions regarding changes in cycling casualties during the programme period compared to before the programme Active People Survey data indicate significant decreases in Shrewsbury in the proportion of respondents cycling once or more per month and the proportion cycling 12 or more times per month between 2007/8 and 2010/11 2 Analysis of automatic cycle counter data Data from a total of 21 automatic cycle counters have been analysed. In the following sections information regarding the location, volumes of cyclists recorded and change in volumes of cyclists recorded over time are presented for each location. A number of counters are located close to the town centre, but there is also good coverage by counters of cycling facilities to the north, south and west of the centre of Shrewsbury. The majority of counters were installed in Data are available from 2005 onwards for one site, from 2006 onwards for three locations and only for 2011 for one site. In order to be consistent across towns, data from 2007 onwards are included in the analysis. Two distinct sets of analysis have been undertaken using cycle counter data in Shrewsbury. In the first, all available data were analysed using a regression model to allow an estimate of change in cycle trips recorded over the programme period against a baseline. In the second, data from individual sites were analysed in order to determine the average volumes of cyclists recorded, distribution of cycle trips over the course of the day and (where sufficient data are available) the annual percentage change in the count of cyclists. 2.1 Town-wide analysis Table 2-1 presents the percentage change in cycle counts in relative to a 2007 baseline including data to the end of September Table 2-1 Change in cycle count in Shrewsbury at the end of the Cycling City and Towns period relative to a 2007 baseline (baseline = 100%) Change against 2007 baseline % 101% 97%* 100% 115%* * indicates a significant difference (p<0.05) compared to the 2007 baseline The counter data indicate a decline in the volume of cyclists recorded in 2009 compared to previous years, potentially a result of prolonged poor weather during 6 Outcomes of the Cycling City and Towns programme: monitoring project report
7 the winter months in this year. A substantial uplift in counts is observed between 2010 and In order to explore the impact of periods of poor weather late 2009 and early and late 2009 on these estimates of change in cycle counts, an additional element was added into the regression model. Table 2-2 presents the findings of this analysis. Table 2-2 Change in cycle count in Shrewsbury at the end of the Cycling City and Towns period relative to a 2007 baseline including an adjustment for snow (baseline = 100%) Change against 2007 baseline % 101% 100% 105%* 115%* * indicates a significant difference (p<0.05) compared to the 2007 baseline When adjusting for poor weather in 2009 and 2010, there is a lesser decrease in cycling levels between 2008 and 2009 and an increased level of cycling in This suggests that the growth in cycling over the programme period can be observed from 2009 onwards as opposed to just in 2011 as the initial analysis showed. 2.2 Analysis of data from individual counter sites Data from individual cycle counters were analysed in order to determine the rate of change in volumes of counts recorded at each location over time. The results of this analysis are summarised in Table 2-3 and alongside more detailed information for each counter in Table 2-4. There are sufficient data available to robustly estimate the annual percentage change in the number of cyclists counted over time for four counters. For the remaining counters, based on the more limited data available, change over time is positive for 14 count sites and negative for two. One of the counters had less than a year of data and therefore no estimate of change over time could be made. Table 2-3 Summary of findings of detailed analysis of data from individual count sites Number of counters for which data are available 21 Number of counters for which sufficient data are available to 4 quantify change over time 2 Number of counters with quantifiable increase 2 Number of counters with no change 1 Number of counters with quantifiable decrease 1 In the following table counters are ordered by their location relative to the centre of Shrewsbury, starting with those located closest to the town centre. Map references refer to the accompanying map (section 8). 2 None of the changes at individual counters are statistically significant. 7 Outcomes of the Cycling City and Towns programme: monitoring project report
8 Table 2-4 Description of automatic cycle counters in Shrewsbury Map reference Location Time period Annual change b Average daily count in Smithfield Road c Overall: 79 Weekdays: 86 Weekend days: Castle Walk a Weekday: 0% Sat/Sun: +1% Overall: 341 Weekdays: 385 Weekend days: Betton Street Bridge Positive Overall: 141 Weekdays: 154 Weekend days: Roman Road south of Longden Road 5. Roman Road north of Longden Road Negative Overall: 101 Weekdays: 111 Weekend days: Positive Overall: 132 Weekdays: 173 Weekend days: Pritchard Way Positive Overall: 130 Weekdays: 147 Weekend days: 102 Comments Located in the town centre on a traffic-free shared use path adjacent to the A458 Smithfield Road and the River Severn. Public and administrative buildings are located nearby. Weekday counts show commuting peaks. Located on Castle Walk, a traffic-free shared use path across urban green space, close to Shrewsbury Castle and railway station. Half a mile east of the town centre. Weekday counts show commuting peaks. Located on a traffic-free shared use bridge over the railway line in the Belle Vue area, approximately half a mile south-east of the centre of Shrewsbury. Weekday counts show commuting peaks. Located either side of the same junction, on a trafficfree segregated cycle path adjacent to the B4380 Roman Road approximately one mile south-west of the centre of Shrewsbury. There are two large secondary schools sites and a playing field located close to the counters. Weekday counts show commuting and school commuting peaks. Located on a traffic-free segregated cycle path adjacent to the A5112 Pritchard Way, surrounded by urban green space and approximately half a mile south-east of the centre of Shrewsbury. The counter is on an orbital route and also provides access to a college. Weekday counts show commuting peaks. 8 Outcomes of the Cycling City and Towns programme: monitoring project report
9 7. Route 81 Shelton Road a Weekday: +2% Sat/Sun: 0% Overall: 207 Weekdays: 238 Weekend days: Hazledine Way Positive Overall: 167 Weekdays: 187 Weekend days: Sutton Road to Weekday: +4% Hazledine Way a Sat/Sun: +4% 10. Greenfields Recreation Ground Overall: 137 Weekdays: 149 Weekend days: Positive Overall: 66 Weekdays: 68 Weekend days: Herongate Positive Overall: 78 Weekdays: 89 Weekend days: 61 Located on National Route 81 of the National Cycle Network, a traffic-free segregated cycle route adjacent to Shelton Road in the Copthorne area, approximately one mile west of the centre of Shrewsbury. Weekday counts show school commuting peaks. Located on a traffic-free segregated cycle path adjacent to the A5112 Hazledine Way. It is surrounded by a golf course and is approximately one mile southeast of the centre of Shrewsbury. Weekday counts show school commuting peaks. Located on a traffic-free segregated railway path in the Sutton area, one mile south-east of the centre of Shrewsbury. A business park is located nearby. Weekday counts show school commuting peaks. Located on a traffic-free shared use path across urban green space and installed following the construction of paths through the Greenfields Recreation Ground, approximately one mile north of the centre of Shrewsbury. School sites are located nearby. Located on a traffic-free shared use path through a residential area in Greenfields, approximately one mile north of the centre of Shrewsbury. It is located on a key route to Greenfields school. Weekday counts show commuting peaks. 12. Oteley Road north Positive Overall: 50 Weekdays: 55 Weekend days: Oteley Road south Positive Overall: 33 Weekdays: 34 Weekend days: 32 Located on a traffic-free segregated cycle path adjacent to the B4380 Oteley Road in the Meole Brace area, approximately one mile south of the centre of Shrewsbury. A football stadium and a retail park are located nearby. 9 Outcomes of the Cycling City and Towns programme: monitoring project report
10 14. Bank Farm Road Negative Overall: 73 Weekdays: 84 Weekend days: Shelton Road north of Shorncliffe Drive Positive Overall: 128 Weekdays: 142 Weekend days: Telford Way west Positive Overall: 179 Weekdays: 220 Weekend days: Telford Way east Positive Overall: 191 Weekdays: 230 Weekend days: Hereford Road Positive Overall: 112 Weekdays: 127 Weekend days: Cartmel Drive Positive Overall: 76 Weekdays: 98 Weekend days: Whitchurch Road a Weekday: +4% Sat/Sun: +1% Overall: 211 Weekdays: 237 Weekend days: 103 Located on a traffic-free segregated cycle path adjacent to Bank Farm Road, approximately one mile south-west of the centre of Shrewsbury. School sites and a playing field are located nearby. Weekday counts show school commuting peaks. Located on National Route 81 of the National Cycle Network, a traffic-free segregated cycle route adjacent to Shelton Road, approximately one and a half miles west of the centre of Shrewsbury. Weekday counts show school commuting peaks. Located on a traffic-free segregated cycle path adjacent to the A5112 Telford Way in Ditherington, approximately one and a half miles north-east of the centre of Shrewsbury. Weekday counts show commuting peaks. Located on a traffic-free shared use path adjacent to the A5112 Hereford Road, approximately one and a half miles south of the centre of Shrewsbury. Weekday counts show commuting peaks. Located on a traffic-free shared use route among residential and industrial areas in Harlescott, approximately two miles north-east of the centre of Shrewsbury. Weekday counts show commuting peaks. Located on a traffic-free segregated path adjacent to the A5112 Whitchurch Road in Harlescott, two miles north-east of the centre of Shrewsbury. Weekday counts show commuting peaks. 10 Outcomes of the Cycling City and Towns programme: monitoring project report
11 21. Gains Park Positive Overall: 41 Weekdays: 43 Weekend days: 36 Located on a traffic-free segregated cycle path through a residential area approximately two miles west of the centre of Shrewsbury. a data are also available for earlier periods, but to ensure consistency these have not been included in the analysis b for counters with less than 36 months of data only a tentative indication as to the direction of the change can be reported, either positive, negative or no change c insufficient data are available for this site to enable any estimate of change over time to be made 11 Outcomes of the Cycling City and Towns programme: monitoring project report
12 2.3 Relationship between programme activity and automatic count data Telford Way development The north of Shrewsbury saw a number of key infrastructure improvements during the Cycling City and Towns programme, most notably: Whitchurch Road and Cartmel Drive cycle tracks Telford Way cycle tracks, toucan crossing and signage Herongate/Greenfields signage and Greenfields greenways (Connect2) Considering data from the six automatic cycle counters to the north of Shrewsbury, the volume of cyclists counted in 2011 increased by +43% against a 2009 baseline 3 (compared to +18% against the same baseline for all counters across the town). The substantial increase in volumes of cyclists recorded in the north of Shrewsbury is driven largely by the following counters which have been impacted by the Telford Way developments: Telford Way west (map reference 16) Telford Way east (map reference 17) Bank Farm Road (map reference 14) Two of the counters are located on the route and the third is expected to record cyclists going on to use this particular route section. Based on these three automatic cycle counters, volumes of cyclists have increased by +46% against a 2009 baseline 4. Prior to route improvements during the programme Telford Way, an A road crossing the River Severn, had in place advisory cycle lanes and a 60mph speed limit. A footway was present on one side of the road only. Improvements include road narrowing to allow cycle tracks and footways on both side of the road, the installation of a toucan crossing and the reduction of the speed limit to 40mph. Comparing median hourly counts of cyclists recorded on weekdays in 2009 with 2011 shows an overall increase in the volumes of cyclists recorded at the three count sites affected by this intervention. The increase is particularly noticeable at the times of day associated with commuting journeys, although an increase in counts at school commuting times can also be observed at the Telford Way East site (Chart 2-1). 3 significant increase (p<0.05) 4 significant increase (p<0.05) 12 Outcomes of the Cycling City and Towns programme: monitoring project report
13 Chart 2-1 Median hourly count of cyclists recorded on weekdays in 2009 and 2011 by counters on Telford Way :00 01:00 02:00 03:00 04:00 05:00 Median hourly count of cyclists 06:00 07:00 08:00 09:00 10:00 11:00 12:00 13:00 14:00 15:00 16:00 17:00 18:00 19:00 20:00 21:00 22:00 23:00 Telford Way West 2009 Telford Way West 2011 Telford Way East 2009 Telford Way East Roman Road and Longden Road Improvements Two counters monitor cyclist movement on Roman Road, one to the north (map reference 5) and one to the south (map reference 4) of Longden Road. This is a key route for pupils travelling to school from the west, and the counter located to the north of Longden Road is expected to record school trips. There have been several improvements made to cycling facilities in the area, including the implementation of cycle lanes and improved crossings. These improvements may have encouraged transfer to this route from alternative options, potentially impacting volumes of cyclists recorded at Bank Farm Road (map reference 14). Chart 2-2 presents the volumes of cyclists recorded on weekdays by the counters located on Longden Road and Bank Farm Road since March Although there are insufficient data to draw robust conclusions concerning changes in volumes of cyclists recorded over time, based on the data available, numbers of cyclists counted increase over time for the counter located to the north of Longden Road, but decline for the counter located to the south of Longden Road and the counter on Bank Farm Road. 13 Outcomes of the Cycling City and Towns programme: monitoring project report
14 Chart 2-2 Median daily count of cyclists recorded on weekdays on Longden Road (north and south of Roman Road) and Bank Farm Road Mar-09 Jun-09 Sep-09 Dec-09 Apr-10 Jul-10 Oct-10 Jan-11 May-11 Aug-11 Date Roman Road south of Longden Road Roman Road north of Longden Road Bank Farm Road Chart 2-3 presents the median hourly flow of cyclists recorded at Longden Road north of Roman Road on weekdays in 2009 and Chart 2-3 Median hourly count of cyclists recorded between Longden Road north of Roman Road on weekdays in 2009 and :00 01:00 02:00 Median daily count of cyclists Median hourly count 03:00 04:00 05:00 06:00 07:00 08:00 09:00 10:00 11:00 12:00 13:00 14:00 15:00 16:00 17:00 18:00 19:00 20:00 21:00 22:00 23: Outcomes of the Cycling City and Towns programme: monitoring project report
15 On comparing weekday hourly flows, the 8am and 3pm peaks are more prominent in 2011 than in This appears to be in part due to a shift in the timing of cycle trips, with generally more trips occurring before 7am in 2009 than in 2011, when the morning peak is concentrated between 8am and 9am. A similar although less pronounced effected is apparent in the afternoon commuting peak. 3 Analysis of manual count data In Shrewsbury two distinct sets of manual cycle counts are undertaken, the M counts which monitor movement towards the centre of Shrewsbury and the C counts which monitor important junctions further out of the town centre. 3.1 M counts Manual counts are undertaken of individuals using all modes of transport at 12 locations forming a cordon around Shrewsbury town centre. Annual counts, performed in September each year, began in 1996.These became quarterly counts from September No count was undertaken on Water Lane in 2006 and the September 2011 data from the Greyfriars site is not comparable with previous counts. Counts have been performed in the following locations, indicated on the accompanying map (section 8): Porthill Bridge (map reference M1) Kingsland (map reference M2) Greyfriars (map reference M3) English Bridge (map reference M4) Water Lane (map reference M5) The Dana (map reference M6) Station (map reference M7) Chester Street (map reference M8) Frankwell foot bridge (map reference M9) Welsh Bridge (map reference M10) Wyle Cop / St Julien Friars (map reference M11) Wyle Cop / Dogpole / High Street (map reference M12) Chart 3-1 presents the total counts in each year across the 11 count sites for which we have data since 2005 (therefore excluding Greyfriars). Although there is an increase of 22% during the programme period (between 2007 and 2011), the data does not show a consistent trend and the 2007 count is lower than the two previous counts. The annual totals are only based on one count at each site per year and are therefore likely to be influenced by weather conditions at the time of the count. 15 Outcomes of the Cycling City and Towns programme: monitoring project report
16 Chart 3-1 Total counts for 11 manual M count sites in Shrewsbury In order to include as much of the data as possible, Chart 3-2 compares data from September 2006, 2007 and 2008 with data from September 2009, 2010 and Greyfriars will be considered separately as no comparable data are available for September Chart 3-2 Comparison of manual M count data collected in Shrewsbury in 2006, 2007 and 2008 with data collected in 2009, 2010 and M1 Porthill Bridge M2 Kingsland M4 English Bridge M5 Water Lane Total count Total count M6 The Dana M7 Station M8 Chester Street M9 Frankwell foot bridge M10 Welsh Bridge M11 Wyle Cop/St Julien Friars M12 Wyle Cop/Dogpole/High Street Significant increase Significant decrease 5 Marked as significant when p< Outcomes of the Cycling City and Towns programme: monitoring project report
17 A significant increase of +12% is observed over the same period when data from the 11 sites are combined. A significant change was observed at six of the sites. Of these, four sites showed an increase and two a decrease. Note that the Frankwell foot bridge has steps on either side and therefore the very low counts at this site are as expected. Counts at the Greyfriars site recorded between 2005 and 2010 are detailed in Chart 3-3 below. The graph indicates a decline in counts to 2008, an increase in 2009 and a further decline in Chart 3-3 Total counts for the Greyfriars site in Shrewsbury hour count As no data is available for 2011, the September counts for 2005, 2006 and 2007 have been compared with the September counts for 2008, 2009 and Although this demonstrates an increase, it is not significant. This is likely to have been affected by the particularly low count in 2008 as a comparison of data collected in 2006 and 2007 with data collected in 2009 and 2010 indicates a significant increase. 3.2 C counts The C counts were designed specifically for monitoring levels of cycling on roads in Shrewsbury and focus on important junctions. These counts were originally used as the basis for reporting against the Local Transport Plan target. Annual counts, performed in September each year, began in 1996, although 12 hour counts were only performed from No count was performed at the Telford Way site in 2008, but otherwise the data series is complete. The locations of the count site are shown on the accompanying map (section 8): Mount Pleasant Road (map reference C1) Telford Way (map reference C2) Longden Roundabout (map reference C3) Abbey Foregate Junction (map reference C4) Reabrook Roundabout (map reference C5) Hereford Road (map reference C6) London Road/Wenlock Road (map reference C7) 17 Outcomes of the Cycling City and Towns programme: monitoring project report
18 Spring Gardens (map reference C8) Berwick Road Junction (map reference C9) Monkmoor Road (map reference C10) Lancaster Road/Harlescott Lane (map reference C11) Chart 3-4 presents the total counts in each year across the 10 count sites for which we have data for all years (Telford Way is excluded). There is a 5% increase in counts over the programme period (2007 to 2011) although the data does not show a consistent trend. Each site is only monitored for one 12 hour period each year and therefore the weather on that particular day is likely to have a substantial impact on the counts. Chart 3-4 Total counts for 10 manual C count sites in Shrewsbury In order to include as much of the data as possible, Chart 3-5 compares data from 2006, 2007 and 2008 with data from 2009, 2010 and Telford Way has been excluded from the analysis as no data was available for Outcomes of the Cycling City and Towns programme: monitoring project report
19 Chart 3-5 Comparison of manual C count data collected in Shrewsbury in 2006, 2007 and 2008 with data collected in 2009, 2010 and C1 Mount Pleasant Road C3 Longden Roundabout C4 Abbey Foregate Junction C5 Reabrook Roundabout C6 Hereford Road C7 London Road/Wenlock Road C8 Spring Gardens C9 Berwick Road Junction C10 Monkmoor Road Total count C11 Lancaster Road/Harlescott Lane Significant increase Significant decrease A 1% increase was observed when data from the 10 sites was compared over the same period. A significant change was observed at six of the ten sites - three increases and three decreases. The increase in counts at Reabrook roundabout is supported by the increase in counts experienced at the nearby automatic cycle counter on Pritchard Way (map reference 6). Infrastructure improvements have been made in the area around Lancaster Road/Harlescott Lane and therefore an increase was anticipated, although the analysis did not identify a significant increase. The Abbey Foregate Junction and London Road/Wenlock Road sites are located along the same corridor and so the consistency between these sites was expected, although the reason for the decrease is not known. Telford Way was excluded from the analysis above as a count was not undertaken in If we compare the data collected at this site in 2006 and 2007 with data collected in 2010 and 2011, a significant increase is observed 7 (an increase in counts from 902 to 1,089 when combining the two 12 hour counts). This increase is potentially the result of significant infrastructure work undertaken on Telford Way over the project period. The manual count data suggest that while an increase has been observed in cyclists entering the centre of Shrewsbury, this is greater than the increase observed at locations at distance from the town centre. Whilst the M counts form a cordon around the town centre, the C counts were located at strategic junctions without 6 Marked as significant when p< p< Outcomes of the Cycling City and Towns programme: monitoring project report
20 necessarily the intention of providing compete coverage of routes towards the town centre. It is therefore possible that gaps in coverage of the C counts, particularly from the north-west and west where M counts have shown an increase, have become more prominent due to infrastructure improvements. 4 Analysis of school related data During the Cycling City and Towns programme, Cycle Shrewsbury has engaged with 15 schools to encourage cycling amongst parents, students and staff. Bike It has been delivered in 15 schools. A total of 340 cycle parking spaces have been provided at schools during the programme. Bike It activities have been delivered in 15 schools, and Bikeability has been taken up by 70% of eligible pupils. During the Cycling City and Towns programme, Cycle Shrewsbury has worked to improve cycling infrastructure in and around schools through improving accesses, building new routes and new crossings. 4.1 PLASC The percentage of pupils surveyed in Shrewsbury stating cycling to be their usual mode of travel to school are summarised in Table 4-1. The proportion of pupils usually cycling to primary schools was very similar in 2010/11 as in 2006/07, at 4.4% in 2006/07 and 4.5% in 2010/11. The levels of cycling to school amongst this group do, however, appear to have dropped then increased rather than remaining constant in the intervening years. Levels of cycling in secondary schools increased from 9.7% in the 2006/07 academic year to 13.6% in 2010/11. Table 4-1 Percentage of pupils surveyed reporting cycling to be their usual mode of travel to school Academic year 2006/ / / / /11 Primary 4.4% 2.9% 3.7% 3.8% 4.5% Secondary 9.7% 10.4% 11.1% 11.5% 13.6%* All schools a 7.4% 7.0% 7.8% 7.4% 8.7%* a These figures are based on data from 20 primary schools and six secondary schools * indicates significantly more cycling in the 2010/2011 academic year compared to the 2006/07 academic year (p<0.05) 4.2 Bike It Bike It has been delivered in 15 schools in Shrewsbury during the Cycling City and Towns programme. Data are available in the standard format (i.e. pre survey followed by a post intervention survey at the end of the first academic year of engagement) for 13 schools. Aggregated percentages of children cycling everyday for schools starting Bike It in each academic year during the programme are presented in Chart 4-1. The change in the proportion of children reporting to cycle to school everyday between the pre and post survey is significant for schools staring Bike It in the 2009/10 academic year. 20 Outcomes of the Cycling City and Towns programme: monitoring project report
21 Chart 4-1 Proportion of children cycling to school everyday in the pre engagement Bike It survey and the first post-engagement survey Percentage cycling to school regularly Pre survey (n = 1822) First post survey (n = 1826) Starting Bike It 2009/10 (11 schools) Pre survey (n = 247) First post survey (n = 237) Starting Bike It 2010/11 (2 schools) Significant (p<0.05) Aggregating together data from all pre intervention and first post intervention surveys performed during the project, the percentage of children reporting to cycle to school everyday increased from 6.1% to 11.9% 8, whilst the proportion cycling to school regularly (everyday or once or twice a week) increased from 23.3% to 33.9% 9. The proportion never cycling to school decreased from 59.7% to 43.0% 10. The proportion of children cycling to school on the day of the survey increased from 5.8% to 15.5% 11. Table 4-2 presents levels of cycling to school as recorded by PLASC in schools where Bike It was delivered between 2006 and In the table below non-bike It schools are those not engaged in Bike It at any point between 2006 and Significant increase (p<0.05) 9 Significant increase (p<0.05) 10 Significant decrease (p<0.05) 11 Significant increase (p<0.05) 21 Outcomes of the Cycling City and Towns programme: monitoring project report
22 Table 4-2 Comparison of PLASC data from non-bike It schools and Bike It schools grouped by year of first engagement in Shrewsbury Non-Bike It schools a 8.1% 8.4% 9.2% 8.9% 10.4% Bike It in 2009 b,d 5.6% 3.7% 4.4% 4.3% 5.4% Bike It in 2010 c,d,e % 5.1% a Data for eight primary schools and six secondary schools that were not engaged in Bike It b Data for nine primary schools and secondary schools initially engaged in Bike It in 2009 c Data for one primary school initially engaged in Bike It in 2010 d PLASC data are collected in January. Bike It engages with schools from the beginning of the academic year. For schools starting Bike It in, for example, 2008, the relevant PLASC year is 2009 e Data was not available prior to 2010 for the school engaged in Bike It in Analysis of counts of parked bicycles data Counts of parked bicycles were undertaken in Shrewsbury in February 2010 and then quarterly from March 2010 to November Counts were undertaken in four beats, encompassing a total of 32 individual locations in the town-centre. In order to estimate change in volumes of bikes parked over time, a subset of sites with consistent data in each count period were compared. Comparing the count recorded at these sites in March, June and September 2010 to March, June and September 2011 indicates an increase of +28%. Most of this growth is observed between the March counts and part of this growth may be due to different weather conditions on the count days. Chart 5-1 shows the counts included in this analysis. Chart 5-1 Numbers of parked bicycles recorded during 10 hour counts in March, June and September 2010, and March, June and September Mar-10 Count Apr-10 May-10 Jun-10 Jul-10 Aug-10 Sep-10 Oct-10 Nov-10 Dec-10 Jan-11 Feb-11 Mar-11 Apr-11 May-11 Jun-11 Jul-11 Aug-11 Sep Outcomes of the Cycling City and Towns programme: monitoring project report
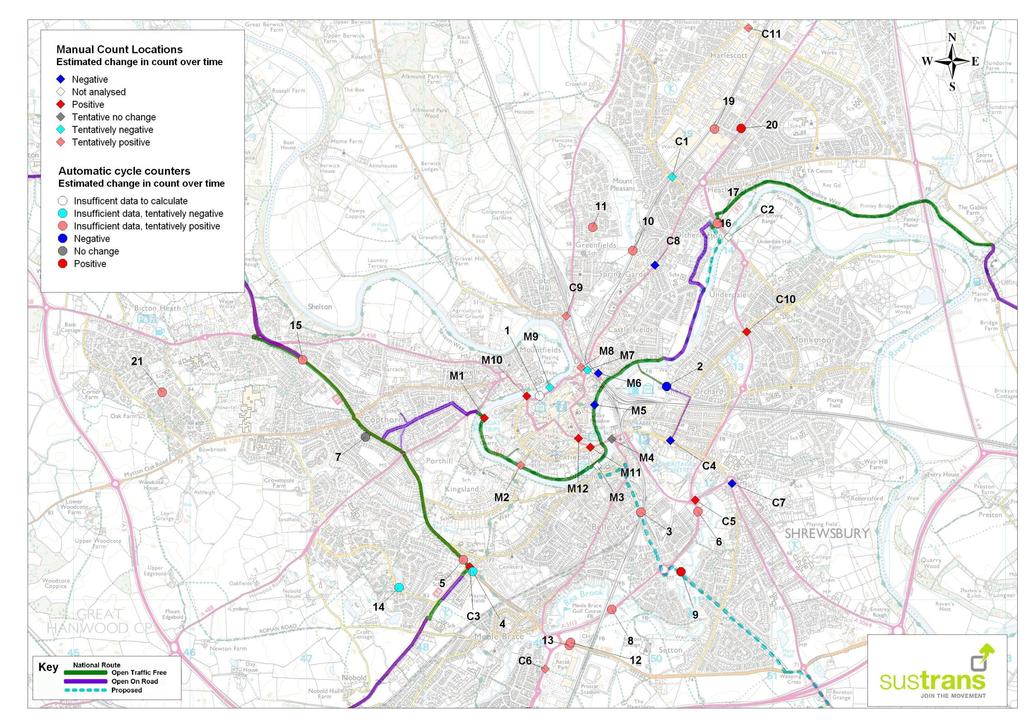
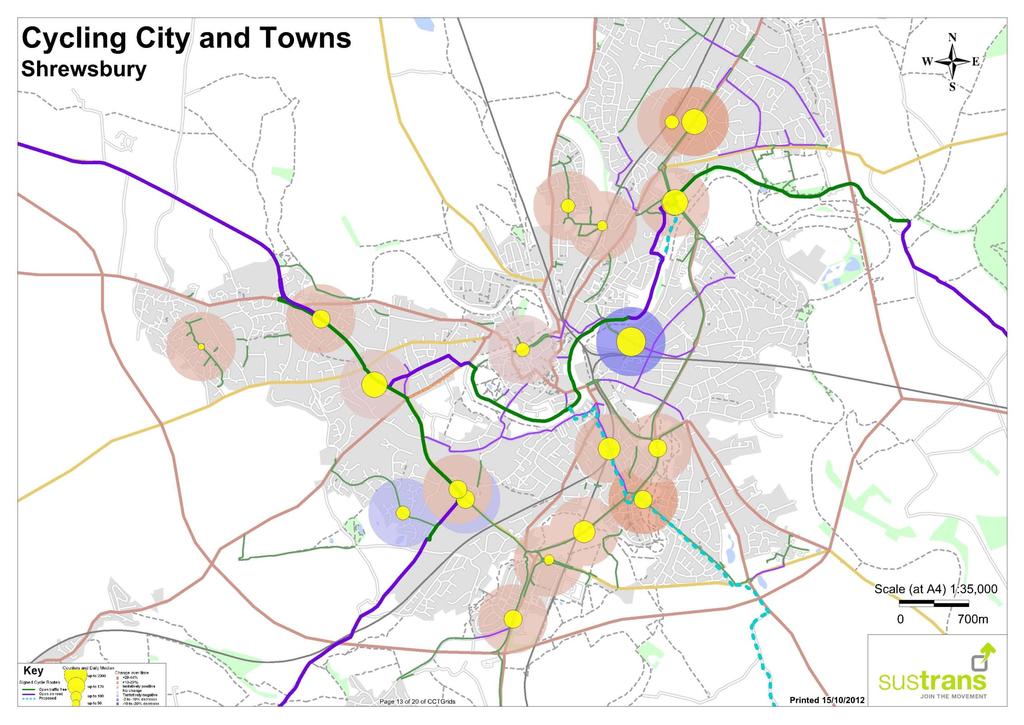
23 6 Analysis of casualty data Cycle user casualty data were derived for Shrewsbury from STATS19 collision data. The average number of killed, seriously injured and slightly injured in each year prior to the Cycling City and Towns programme ( ) are compared to those occurring during the programme in Table 6-1. Although the difference between the time periods compared is significant regarding those who reported being slightly injured, casualty data were not available for 2010 thus making it difficult to draw firm conclusions regarding numbers of cycling casualties before and during the programme. Table 6-1 Annual average number of cyclists killed or injured in Shrewsbury before ( ) and during ( ) the Cycling City and Towns programme Annual average number of casualties Killed Seriously injured Slightly injured Total Pre-programme During programme * 9.0* * indicates a significant change between cycling casualties recorded before and during the Cycling City and Town programme 7 Analysis of physical activity data Data are available from Sport England s Active People Survey (APS) for two years prior to the Cycling City and Towns programme and all three years of the project. The APS data provide information on the proportion of people cycling for at least 30 minutes once or more per month and the proportion cycling for at least 30 minutes, 12 or more times per month. It should be noted that the data refer only to cycling in bouts of 30 minutes or more and therefore this measure may under represent overall cycling in the towns as shorter journeys are not included. The proportion cycling once or more per month fell by 7.8%-points (from 17.6% to 9.8%) in Shrewsbury between 2007/8 and 2010/11. The proportion cycling 12 or more times per month fell by 1.2%-points (from 1.4% to 0.2%) over the same period. These are both significant decreases (p<0.05). 8 Maps The following pages contain maps indicating the location of manual count and automatic cycle counter locations, and the estimated change in volumes of cycles recorded at these sites. 23 Outcomes of the Cycling City and Towns programme: monitoring project report
24
25
26
Outcomes of the Cycling City and Towns programme: monitoring project report
 Outcomes of the Cycling City and Towns programme: monitoring project report Individual town results: Leighton Linslade April 2017 Report authors: Andy Cope, Research and Monitoring Unit, Sustrans Angela
Outcomes of the Cycling City and Towns programme: monitoring project report
 Outcomes of the Cycling City and Towns programme: monitoring project report Individual town results: Colchester April 2017 Report authors: Andy Cope, Research and Monitoring Unit, Sustrans Angela Kennedy,
Outcomes of the Cycling City and Towns programme: monitoring project report
 Outcomes of the Cycling City and Towns programme: monitoring project report Individual town results: Blackpool April 217 Report authors: Andy Cope, Research and Monitoring Unit, Sustrans Angela Kennedy,
Outcomes of the Cycling Demonstration Towns programme: monitoring project report
 Outcomes of the Cycling Demonstration Towns programme: monitoring project report Individual town results: Lancaster with Morecambe April 217 Report authors: Andy Cope, Research and Monitoring Unit, Sustrans
Outcomes of the Cycling Demonstration Towns programme: monitoring project report
 Outcomes of the Cycling Demonstration Towns programme: monitoring project report Individual town results: Darlington April 217 Report authors: Andy Cope, Research and Monitoring Unit, Sustrans Angela Kennedy,
Outcomes of the Cycling Demonstration Towns programme: monitoring project report
 Outcomes of the Cycling Demonstration Towns programme: monitoring project report Individual town results: Brighton and Hove April 217 Report authors: Andy Cope, Research and Monitoring Unit, Sustrans Angela
Outcomes of the Cycling City and Towns programme: monitoring project report
 Outcomes of the Cycling City and Towns programme: monitoring project report Individual town results: York April 27 Report authors: Andy Cope, Research and Monitoring Unit, Sustrans Angela Kennedy, Research
ANNEX1 The investment required to achieve the Government s ambition to double cycling activity by 2025
 ANNEX1 The investment required to achieve the Government s ambition to double cycling activity by 2025 May 2016 About Sustrans Sustrans makes smarter travel choices possible, desirable and inevitable.
Summary of Outcomes of the Cycling Demonstration Towns and Cycling City and Towns Programmes
 Summary of Outcomes of the Cycling Demonstration Towns and Cycling City and Towns Programmes Lynn Sloman, Andy Cope, Angela Kennedy, Fiona Crawford, Nick Cavill and John Parkin Report to the Department
The Infrastructure Impact Tool
 1 The Infrastructure Impact Tool Guidance notes Delivered by Sustrans in partnership with: 2 About Sustrans Sustrans is the charity making it easier for people to walk and cycle. We are engineers and educators,
The One Path Initiative
 About Sustrans 2017, Livia Lazar/Sustrans, all rights reserved Sustrans is the charity making it easier for people to walk and cycle. We are engineers and educators, experts and advocates. We connect people
European Levels of Investment in Cycling: Results and Insights
 Shifting Gears European Levels of Investment in Cycling: Results and Insights UWE, 2 July 2013 Dr Kiron Chatterjee Kiron.Chatterjee@uwe.ac.uk Associate Professor in Travel Behaviour Centre for Transport
Route User Intercept Survey Report
 Route User Intercept Survey Report Hills Road, Cambridge Fieldwork: October 2016 Report published: December 2016 1 About Sustrans Sustrans makes smarter travel choices possible, desirable and inevitable.
Active Travel Strategy Dumfries and Galloway
 Active Travel Strategy Dumfries and Galloway Our Active Travel Strategy The agreed Interventions for Dumfries and Galloway Council s Local Transport Strategy includes an action to Develop an Active Travel
Transport Poverty in Scotland. August 2016
 Transport Poverty in Scotland August 2016 About Sustrans Sustrans is the charity making it easier for people to walk and cycle. We connect people and places, create liveable neighbourhoods, transform the
Active travel and economic performance: A What Works review of evidence from cycling and walking schemes
 1 Making the economic case for active travel Active travel and economic performance: A What Works review of evidence from cycling and walking schemes Active Travel Toolkit Slide Pack July 2017 Active travel
Cycle Superhighway 4 from Tower Bridge to Greenwich
 Cycle Superhighway 4 from Tower Bridge to Greenwich About Sustrans Sustrans is the charity making it easier for people to walk and cycle. We are engineers and educators, experts and advocates. We connect
Active Travel Towns Funding Scheme Project Proposal. Sligo. Sligo Local Authorities
 Active Travel Towns Funding Scheme 2014-2016 Project Proposal for Sligo by Sligo Local Authorities Introduction Over the last two years, Sligo Local Authorities have implemented years 1 & 2 of their 5
Walking and Cycling Action Plan Summary. A Catalyst for Change The Regional Transport Strategy for the west of Scotland
 Walking and Cycling Action Plan Summary A Catalyst for Change The Regional Transport Strategy for the west of Scotland 2007-2021 Strathclyde Partnership for Transport Contents Purpose...2 Issues, Constraints
CYCLING SCOTLAND SCOTTISH CHARITY NO.SCO Annual Cycling Monitoring Report
 CYCLING SCOTLAND SCOTTISH CHARITY NO.SCO29760 Annual Cycling Monitoring Report 2018 Annual Cycling Monitoring Report 2018 4 CYCLING SCOTLAND Annual Cycling Monitoring Report 2018 National cycling.scot
Cycling and Walking Investment Strategy & Local Cycling and Walking Infrastructure Plans
 Cycling and Walking Investment Strategy & Local Cycling and Walking Infrastructure Plans 1 Investing in cycling and walking contributes to a broad range of cross-cutting policy objectives Cycling and walking
Transport Poverty in Scotland. August 2016
 Transport Poverty in Scotland August 2016 About Sustrans Sustrans makes smarter travel choices possible, desirable and inevitable. We re a leading UK charity enabling people to travel by foot, bike or
Delivering Accident Prevention at local level in the new public health system
 1 Safety issue accidents don t have to happen Delivering Accident Prevention at local level in the new public health system Part 2: Accident prevention in practice Raise awareness Fact Sheet Road casualties
GD 0043/18 ACTIVE TRAVEL STRATEGY
 GD 0043/18 ACTIVE TRAVEL STRATEGY 2018-2021 May 2018 Minister s Introduction There is strong evidence that regular physical activity reduces the risk of a range of health conditions. The best way to increase
Using a Mixed-Method Approach to Evaluate the Behavioural Effects of the Cycling City and Towns Programme
 1 of 25 Using a Mixed-Method Approach to Evaluate the Behavioural Effects of the Cycling City and Towns Programme Kiron Chatterjee (Centre for Transport & Society, UWE) with acknowledgements to research
Scottish Parent Teacher Council School Travel Survey Introduction
 Introduction Scottish Parent Teacher Council (SPTC) is a membership organisation and charity whose purpose is to make parental involvement in children's education as good as it possibly can be. Sustrans
WEST YORKSHIRE LTP CYCLE PROSPECTUS
 WEST YORKSHIRE LTP CYCLE PROSPECTUS The West Yorkshire Ambition: To be recognised as a great place for safe cycling, inspiring more people to cycle more often. INTRODUCTION Cycling is low cost, environmentally
1.5 On this basis it is fundamental that the Transport Strategy for the site focuses on the following key criteria,
 1.0 Introduction 1.1 The Transport Assessment has been prepared on behalf of Eon and Roger Bullivant Ltd in respect of the proposed mixed use sustainable urban extension of Drakelow Park. 1.2 The methodology
Summary of NWA Trail Usage Report November 2, 2015
 Summary of NWA Trail Usage Report November 2, 2015 Summary Findings: The study showed that Northwest Arkansas (NWA) had relatively high cyclist user counts per capita aggregated across the top three usage
Summary of bicycle helmet law results in Western Australia
 Summary of bicycle helmet law results in Western Australia * All graphs, charts and tables presented in this document are scanned directly from reports published by Western Australia government departments,
Westminster s Joint Health and Wellbeing Strategy
 Westminster s Joint Health and Wellbeing Strategy 2013 2016 Response from Sustrans General comments From a strategic perspective, Sustrans welcomes the Health and Wellbeing Strategy s focus on encouraging
Cambridgeshire floating bus stops interaction analysis
 Cambridgeshire floating bus stops interaction analysis Final report December 2015 About Sustrans Sustrans makes smarter travel choices possible, desirable and inevitable. We re a leading UK charity enabling
Cycle journeys on the Anderston-Argyle Street footbridge: a descriptive analysis. Karen McPherson. Glasgow Centre for Population Health
 Cycle journeys on the Anderston-Argyle Street footbridge: a descriptive analysis Karen McPherson Glasgow Centre for Population Health March 2017 Key points: There were 116,334 cycle journeys made using
Easton Safer Streets - Final Project Report BRISTOL
 - Final Project Report BRISTOL A Sustrans Community Street Design Project in partnership with Bristol City Council February 07 About Sustrans Sustrans makes smarter travel choices possible, desirable and
Stepping up a gear. Our vision for cycling in Cardiff
 Stepping up a gear Our vision for cycling in Cardiff Cardiff is growing fast in fact, over the last 10 years its population has grown quicker than any UK city outside London and this rate of expansion
Determining bicycle infrastructure preferences A case study of Dublin
 *Manuscript Click here to view linked References 1 Determining bicycle infrastructure preferences A case study of Dublin Brian Caulfield 1, Elaine Brick 2, Orla Thérèse McCarthy 1 1 Department of Civil,
12. School travel Introduction. Part III Chapter 12. School travel
 12. School travel 12.1 Introduction This chapter presents the evidence on changes in travel patterns for the journey to school in the three towns over the period of the Sustainable Travel Town project.
Regional Cycle Programme Update
 Agenda Item 10 (ii) Regional Cycle Programme Update Glossary Auckland Council Auckland Transport Cycle Action Auckland New Zealand Transport Agency Regional Cycle Network (AC) (AT) (CAA) (NZTA) (RCN) Executive
UK Integrated Behaviour Change Programmes
 UK Integrated Behaviour Change Programmes 17 th November 2009 ACT TDM Summit Conference Daniel Johnson, Transport for London Nicky Ward, Steer Davies Gleave Structure 1. UK travel behaviour change 2. An
London Cycle Network Annual Report 2000
 London Cycle Network Annual Report 2000 A cycle network for London by 2005 A cycle network for London by 2005 The London Cycle Network will: provide local links between residential neighbourhoods, railway
Cycle journeys on the South-West City Way: a descriptive analysis. Karen McPherson. Glasgow Centre for Population Health
 Cycle journeys on the South-West City Way: a descriptive analysis Karen McPherson Glasgow Centre for Population Health March 2017 Key points: There were 107,000 journeys made using the route during the
KEY FINDINGS OF THE INTERIM EVALUATION OF THE SMARTER TRAVEL AREAS PROGRAMME
 Proceedings 1st - 2nd September 2016 BRICK, CANTWELL, SWIFT: Smarter Travel Areas KEY FINDINGS OF THE INTERIM EVALUATION OF THE SMARTER TRAVEL AREAS PROGRAMME Elaine Brick Associate Director AECOM Mairead
CYCLING CHARTER ACTION PLAN EXECUTIVE SUMMARY
 CYCLING CHARTER ACTION PLAN EXECUTIVE SUMMARY THE VISION OF THE CYCLING CHARTER To realise the full potential of cycling s contribution to the health and wealth of the West Midlands creating more sustainable
A future cycle route network for North Staffordshire mb/08/16 Need for a strategy. Existing cycle route network
 Need for a strategy 1. The government s aim is to double cycling levels nationally by 2025 [note 1]. This would bring significant health, environmental, economic and traffic benefits [note 2]. It is widely
Sustrans Scotland: walking and cycling outcomes
 Sustrans Scotland: walking and cycling outcomes Sustrans' Scottish Government Grant 2012 2015: First Interim Report September 2013 About Sustrans Sustrans makes smarter travel choices possible, desirable
Bicycle Crashes. Number of Bike Crashes. Total Bike Crashes. are down 21% and severe bike crashes down 8% since 2013 (5 years).
.") Bicycle Crashes The City of Fort Collins is well known for its bike culture, and there is a strong focus on encouraging increased riding. Bike safety is an important component of supporting these efforts.
Bicycle Crashes The City of Fort Collins is well known for its bike culture, and there is a strong focus on encouraging increased riding. Bike safety is an important component of supporting these efforts.
The Scottish Collaboration for Public Health Research and Policy; and 20mph speed limits
 The Scottish Collaboration for Public Health Research and Policy; and 20mph speed limits Dr Ruth Jepson and Dr John McAteer Wellington, Jan 2018 SCPHRP* Scottish Collaboration for Public Health Research
Child Road Safety in Great Britain,
 Child Road Safety in Great Britain, 21-214 Bhavin Makwana March 216 Summary This short report looks at child road casualties in Great Britain between 21 and 214. It looks at how children travel, the geographical
Our journey a 20 year Transport Manifesto for the North East
 Our journey a 20 year Transport Manifesto for the North East Sustrans submission to North East Combined Authority (NECA). March 2016 Summary Sustrans is a leading UK charity enabling people to travel by
SUSTAINABLE TRAVEL TOWNS: RESULTS AND LESSONS
 SUSTAINABLE TRAVEL TOWNS: RESULTS AND LESSONS Joe Finlay Sustainable Travel Team Department for Transport (UK) Introduction I will: Give brief background on the Sustainable Travel Towns and the projects
A review of 2015 fatal collision statistics as of 31 December 2015
 A review of fatal collision statistics as of 31 December This report summarises the main trends in road fatalities that have emerged in. This has been prepared by the Road Safety Authority following analysis
Part 3: Active travel and public transport planning in new housing developments
 1 Linking active travel and public transport to housing growth and planning Part 3: Active travel and public transport planning in new housing developments Active Travel Toolkit Slide Pack July 2017 Linking
HAMILTON BIKING PLAN OUR VISION: A BIKE FRIENDLY CITY
 HAMILTON BIKING PLAN 2015-2045 OUR VISION: A BIKE FRIENDLY CITY INTRODUCTION Biking as a travel option is experiencing a resurgence internationally and in New Zealand, growing as a familyfriendly and healthy
2017 Northwest Arkansas Trail Usage Monitoring Report
 2017 Northwest Arkansas Trail Usage Monitoring Report Summary Findings: The study showed that average daily weekday bicycle volumes per study site increased by about 32% between 2015 and 2017, from 142
Our Cycle Promise. northernrailway.co.uk. Produced in partnership with Sustrans. July 2017
 Our Cycle Promise Produced in partnership with Sustrans July 2017 northernrailway.co.uk Contents Welcome 3 Working with others 4 Making your journey easier 5 to and from your local station 5 at the station
Loughborough University Travel Planning
 Document Ti tle Client Name Loughborough University Travel Planning Loughborough University Travel Plan Executive Summary 2015-2020 23 December 2015 Loughborough University Travel Planning Project no:
2014 peterborough city and county. active. transportation. & health. indicators primer
 2014 city and county active transportation & health indicators primer executive summary Walking, cycling and transit are good for our personal health, our local economies, and the environment. Understanding
Nottingham, the great cycle city
 Nottingham, the great cycle city Our vision for the city s cycling future Foreword Councillor Jon Collins Leader of the Council Nottingham has a world class public transport system which is essential to
Bike To School Week 2017
 Teacher resources pack England & Wales: education@sustrans.org.uk 0117 9150207 Sustrans 2 Cathedral Square, College Green, Bristol, BS1 5DD Northern Ireland schoolsni@sustrans.org.uk 028 9043 4569 Sustrans
Douglas Land Use and Transportation Strategy (DLUTS) Summary. August 2013
 Summary. August 2013") Douglas Land Use and Transportation Strategy (DLUTS) Summary August 2013 Background Douglas is a large and popular residential suburb of approximately 30,000 persons on the periphery of Cork City along
Douglas Land Use and Transportation Strategy (DLUTS) Summary August 2013 Background Douglas is a large and popular residential suburb of approximately 30,000 persons on the periphery of Cork City along
Nottingham Cycle City Frequently Asked Questions
 Nottingham Cycle City Frequently Asked Questions About the scheme How much money is to be spent on cycling? And where is the money from? We have 6.1 million in Growth Fund which we will be investing directly
To: The results of these surveys have been analysed and are summarised within this Technical Note.
 Technical Note Project: Histon Road / Milton Road, Cambridge Parking Surveys To: Andy Harrison Subject: Survey Report v1.6 From: Jonathan Barlow Date: 18 th February 2016 cc: Richard Jones / Dave Boddy
National Cycle Network - Signing and Route Branding
 National Cycle Network - Signing and Route Branding Technical Information Note No. 27 September 2012 About Sustrans Sustrans makes smarter travel choices possible, desirable and inevitable. We re a leading
E4 Cycle Route Exeter University to Redhayes Bridge. - Recommendations from Exeter Cycling Campaign
 E4 Cycle Route Exeter University to Redhayes Bridge - Recommendations from Exeter Cycling Campaign 1.0 Introduction Exeter Cycling Campaign has prepared this report to provide recommendations for Devon
Improved cycle parking at South West Trains' stations in Hampshire
 Traffic Advisory Leaflet 11/99 August 1999 Improved cycle parking at South West Trains' stations in Hampshire Introduction Hampshire County Council in partnership with South West Trains, secured cycle
21/02/2018. How Far is it Acceptable to Walk? Introduction. How Far is it Acceptable to Walk?
 21/2/218 Introduction Walking is an important mode of travel. How far people walk is factor in: Accessibility/ Sustainability. Allocating land in Local Plans. Determining planning applications. Previous
Derby Cycling Group, c/o 126, Station road, Mickleover, Derby, DE3 9FN. Date: 20 th November, 2018.
 Your Ref: Derby City Council Air Quality - Preferred Option Nov 2018 Derby Cycling Group, c/o 126, Station road, Mickleover, Derby, DE3 9FN Date: 20 th November, 2018. 1. Introduction: 1.1. Derby Cycling
Queensbury Tunnel. Estimating the economic impact of reopening walking and cycling routes around Queensbury Tunnel. June 2017
 Queensbury Tunnel Estimating the economic impact of reopening walking and cycling routes around Queensbury Tunnel June 2017 About Sustrans Sustrans makes smarter travel choices possible, desirable and
GETTING WHERE WE WANT TO BE
 CAMBRIDGESHIRE & peterborough GETTING WHERE WE WANT TO BE A GREEN PARTY TRANSPORT POLICY CONTENTS Our Campaign Priorities 4 Bus Franchising 6 Supporting Active Transport 8 Workplace Parking Levy 9 Tackling
Public Consultation on Braintree Integrated Transport Package (ITP) HAVE YOUR. Consultation open from 24 September to 5 November 2018 SAY
 HAVE YOUR. Consultation open from 24 September to 5 November 2018 SAY") Public Consultation on Braintree Integrated Transport Package (ITP) HAVE YOUR SAY Consultation open from 24 September to 5 November 2018 Contents Introduction 3 Background 4 Springwood Drive Roundabout
Public Consultation on Braintree Integrated Transport Package (ITP) HAVE YOUR SAY Consultation open from 24 September to 5 November 2018 Contents Introduction 3 Background 4 Springwood Drive Roundabout
Cycle traffic and the Strategic Road Network. Sandra Brown, Team Leader, Safer Roads- Design
 Cycle traffic and the Strategic Road Network Sandra Brown, Team Leader, Safer Roads- Design Highways England A Government owned Strategic Highways Company Department for Transport Road Investment Strategy
The case study was drafted by Rachel Aldred on behalf of the PCT team.
 Rotherhithe Case Study: Propensity to Cycle Tool This case study has been written to use the Propensity to Cycle Tool (PCT: www.pct.bike) to consider the impact of a bridge in South-East London between
January Transforming cities. The potential of everyday cycling
 January 2019 Transforming cities The potential of everyday cycling What is Bike Life? Bike Life is the UK s biggest assessment of cycling in cities. It is delivered by Sustrans in collaboration with 15
York Scarborough Bridge Economic Appraisal Update Technical Note
 York Scarborough Bridge Economic Appraisal Update Technical Note Specification No. 1 Client name West Yorkshire Combined Authority Client reference M088 Discipline Transportation Project name CCAG2 Economics
Introduction. Summary conclusions. Recommendation
 20 s Plenty for Us calls for Hampshire County Council to withdraw its report on the 20mph Pilot Programme and to press ahead with rolling out 20mph in residential streets across the county. Introduction
Launceston's Transport Futures. Greater travel options for the people of Launceston
 Launceston's Transport Futures Greater travel options for the people of Launceston Final Draft 13 Jan 2014 1 Page Number Executive summary 3 What is Transport Futures? 4 Vision 6 Economy, access and liveability
Douglas Land Use and Transportation Study
 Douglas Land Use and Transportation Study Summary: Key: Yellow Box = key project information Green Box = project recommendations Grey Box = anticipated project outcomes Background: It is an objective of
Cycle Routes. Traffic Advisory Leaflet 3/95 March Introduction. Implementation. Project aims. Design
 Traffic Advisory Leaflet 3/95 March 1995 Cycle Routes Introduction The leaflet summarises the findings of the Cycle Routes Programme. This research was undertaken for the Department of Transport by the
Cycle Route Networks Sustrans creates popular cycle routes through public involvement By Tony Russell, Sustrans, England
 ARTICLE FROM THE BOOK: Cyclists & Cycling Around the World Creating Liveable Cyclists and & Cycling Bikeable Around Cities the World Edited by Juan Carlos Dextre, Mike Hughes & Lotte Bech Published by
LESSONS FROM THE GREEN LANES: EVALUATING PROTECTED BIKE LANES IN THE U.S.
 LESSONS FROM THE GREEN LANES: EVALUATING PROTECTED BIKE LANES IN THE U.S. FINAL REPORT: APPENDIX C BICYCLIST ORIGIN AND DESTINATION ANALYSIS NITC-RR-583 by Alta Planning and Design Matt Berkow Kim Voros
What s the issue for transport in Cardiff?
 Demand for travel The number of commuters travelling to work in Cardiff has increased from 190,000 in 2001 to 198,000 in 2010, with some 124,000 Cardiff residents travelling across the city daily to their
DOE Climate Change Proposals
 DOE Climate Change Proposals Sustrans response to Proposals for Taking Forward NI Climate Change Legislation January 2016 About Sustrans Sustrans makes smarter travel choices possible, desirable and inevitable.
Appendix N(b): Portishead Station Outline Travel Plan
: Portishead Station Outline Travel Plan") Portishead Branch Lane (MetroWest Phase 1): Environment Impact Assessment Appendix N(b): Portishead Station Outline Travel Plan Prepared for West of England Councils September 2017 1 The Square Temple
Portishead Branch Lane (MetroWest Phase 1): Environment Impact Assessment Appendix N(b): Portishead Station Outline Travel Plan Prepared for West of England Councils September 2017 1 The Square Temple
University of Leeds Travel Plan
 University of Leeds Travel Plan 2015-2018 Contents 1: Introduction 1.1 What is a Travel Plan? 1.2 Why do we need one? 1.3 Sustainability Strategy 2: Overview 2.1 The bigger picture 2.2 The City scale 2.3
Baseline Survey of New Zealanders' Attitudes and Behaviours towards Cycling in Urban Settings
 Baseline Survey of New Zealanders' Attitudes and Behaviours towards Cycling in Urban Settings Highlights 67% of urban New Zealanders, 18 years of age or more own or have access to a bicycle that is in
Report on trends in mode share of vehicles and people crossing the Canal Cordon to 2013
 Report on trends in mode share of vehicles and people crossing the Canal Cordon 2006 to 2013 Dublin City Council, National Transport Authority, Civic Offices, Dun Scèine, Wood Quay, Harcourt Lane, Dublin
TYPES OF CYCLING. Figure 1: Types of Cycling by Gender (Actual) Figure 2: Types of Cycling by Gender (%) 65% Chi-squared significance test results 65%
 Figure 2: Types of Cycling by Gender (%) 65% Chi-squared significance test results 65%") TYPES OF CYCLING 1,980 responses were received to this question (multiple answers were allowed), 727 female (41%) and 1,242 (71%) from male respondents. The most common responses for both genders were
TYPES OF CYCLING 1,980 responses were received to this question (multiple answers were allowed), 727 female (41%) and 1,242 (71%) from male respondents. The most common responses for both genders were
Central London Bus Services Review
 Central London Bus Services Review Sustrans response to Transport for London November 2018 About Sustrans Sustrans is the charity making it easier for people to walk and cycle. We are engineers and educators,
Lincolnshire JSNA: Road Traffic Accidents
 Road Traffic Accidents What do we know? Summary A higher proportion of road traffic collisions in Lincolnshire result in death compared to other areas. This may be due to the types of road in the County
Congestion Reduction in Europe: Advancing Transport Efficiency. MG Tackling urban road congestion D3.4
 Congestion Reduction in Europe: Advancing Transport Efficiency MG-5.3-2014 Tackling urban road congestion D3.4 Patterns of congestion in European cities Multiple-indicator analysis using real-time GPS
COUNT ME IN PEDESTRIAN COUNTERS CASE STUDY ABOUT THIS CASE STUDY:
 COUNT ME IN PEDESTRIAN COUNTERS CASE STUDY ABOUT THIS CASE STUDY: Getting hold of good data on the number of pedestrians is invaluable to plan and prioritise walking-friendly streets. This case study explains
Improving Thetford Cycling Provision. In and Around Thetford
 Improving Cycling Provision In and Around Thetford Presentation to Thetford Town Council July 2015 About Me Lecturer in Mathematics at the University of East Anglia Keen recreational cyclist Volunteer
EUROPEAN TRANSPORT CONFERENCE 2006 ROAD SAFETY IN LONDON PAST SUCCESSES AND FUTURE INNOVATIONS
 EUROPEAN TRANSPORT CONFERENCE 26 ROAD SAFETY IN LONDON PAST SUCCESSES AND FUTURE INNOVATIONS Mr Chris Lines Head of the London Road Safety Unit, Transport for London 1. PAST SUCCESSES Road safety is a
Safe Routes to School
 Safe Routes to School Paul Osborne, Safe Routes to Schools Project Director, Sustrans The Danesmead Wing, 33 Fulford Cross, York YO10 4PB, UK paulo@sustrans.org.uk Summary Safe Routes to Schools is a practical
A127/A130 Fairglen Interchange Improvement Schemes. Information Leaflet February 2017
 A127/A130 Fairglen Interchange Improvement Schemes Information Leaflet February 2017 1 2 Foreword By Councillor Kevin Bentley Essex is continuing to grow as a vibrant economic hub and as a fantastic place
Setting Local Speed Limits. A review of recent installations of 20mph area schemes (signage only).
.") Setting Local Speed Limits A review of recent installations of 20mph area schemes (signage only). 1 Setting Local Speed Limits A review of recent 20mph area scheme installations. Contents. Background to
Setting Local Speed Limits A review of recent installations of 20mph area schemes (signage only). 1 Setting Local Speed Limits A review of recent 20mph area scheme installations. Contents. Background to
May Canal Cordon Report 2017
 May 2018 Canal Cordon Report 2017 Report on trends in mode share of vehicles and people crossing the Canal Cordon to 2017 2 Analysis of trends in mode share of people crossing the canal cordon - 2017 Contents
Cycle network linking Wolverhampton city centre and Bilston town centre with employment sites and residential areas:
 Context and Problems Corridor length 12.3 km; Population within 800m 59,922; Jobs within 800m 59,100; Unemployment 11%; Average Index of Multiple Deprivation 46; Households with no car 45%; Proportion
North West Non-Technical Summary of the Transport Assessment September 2011
 North West Non-Technical Summary of the Transport Assessment September 2011 Introduction This is a Non-Technical Summary of the findings of the Transport assessment work undertaken for the proposed North
20mph. We want to make Edinburgh a better and safer place to live, work and play.
 20mph CREATING A BETTER SAFER EDINBURGH We want to make Edinburgh a better and safer place to live, work and play. That s why on 13 January 2015 Councillors approved a new speed limit network for Edinburgh