17t h Ann u a l Re p o r t on th e ( ) POLICY STUDY
|
|
|
- Prosper Franklin Norton
- 5 years ago
- Views:
Transcription
1 July t h Ann u a l Re p o r t on th e Per f o r m a n c e of Stat e Hi g h w a y Sy s t e m s ( ) By David T. Hartgen, Ph.D., P.E., and Ravi K. Karanam Project Director: Adrian T. Moore, Ph.D. POLICY STUDY 369
2 Reason Foundation Reason Foundation s mission is to advance a free society by developing, applying, and promoting libertarian principles, including individual liberty, free markets, and the rule of law. We use journalism and public policy research to influence the frameworks and actions of policymakers, journalists, and opinion leaders. Reason Foundation s nonpartisan public policy research promotes choice, competition, and a dynamic market economy as the foundation for human dignity and progress. Reason produces rigorous, peer-reviewed research and directly engages the policy process, seeking strategies that emphasize cooperation, flexibility, local knowledge, and results. Through practical and innovative approaches to complex problems, Reason seeks to change the way people think about issues and promote policies that allow and encourage individuals and voluntary institutions to flourish. Reason Foundation is a tax-exempt research and education organization as defined under IRS code 501(c)(3). Reason Foundation is supported by voluntary contributions from individuals, foundations, and corporations. The views are those of the author, not necessarily those of Reason Foundation or its trustees. Copyright 2008 Reason Foundation. All rights reserved.
3 Reason Foundation 17th Annual Report on the Performance of State Highway Systems ( ) By David T. Hartgen, Ph.D., P.E. and Ravi K. Karanam Project Director: Adrian T. Moore, Ph.D. This is the 17 th annual report in a series on the condition and performance of the U.S. state-owned road system. The report is supported this year by Reason Foundation, a public policy research institution. The views expressed in the report are solely those of the authors. Copyright 2008, Reason Foundation. Permission to copy and reproduce by electronic or paper means with appropriate credit is given.
4 Reason Foundation Table of Contents Overview... 1 Cost-Effectiveness Rankings of the States... 4 Trends in Performance Indicators... 8 State-Controlled Miles... 9 State Highway Agency Mileage Receipts for State-Administered Highways Capital and Bridge Disbursements Maintenance Disbursements Administrative Disbursements Total Disbursements Rural Interstate Condition Urban Interstate Condition Rural Principal Arterial Pavement Condition Urban Interstate Congestion Deficient Bridges Fatality Rates Narrow Rural Lanes What Works and What Doesn t Is National Progress Still Possible? Top Ten States North Dakota Montana New Mexico Wyoming Kansas South Carolina South Dakota Nebraska Kentucky Georgia Bottom Ten States Florida... 33
5 42. Michigan Massachusetts California New York New Hampshire Hawaii Rhode Island Alaska New Jersey Individual State Results Alabama Alaska Arizona Arkansas California Colorado Connecticut Delaware Florida Georgia Hawaii Idaho Illinois Indiana Iowa Kansas Kentucky Louisiana Maine Maryland Massachusetts Michigan Minnesota Mississippi Missouri Montana Nebraska Nevada New Hampshire New Jersey New Mexico New York North Carolina... 45
6 North Dakota Ohio Oklahoma Oregon Pennsylvania Rhode Island South Carolina South Dakota Tennessee Texas Utah Vermont Virginia Washington West Virginia Wisconsin Wyoming Technical Notes Mileage by Ownership Receipts for State-Administered Highways Capital and Bridge Disbursements Maintenance Disbursements Administrative Disbursements Total Disbursements Rural Interstate Poor-Condition Mileage Rural Other Principal Arterial Poor-Condition Mileage Urban Interstate Poor-Condition Mileage Urban Interstate Congestion Fatality Rates Deficient Bridges Narrow Lanes on Rural Other Principal Arterials Overall Ratings About the Authors Related Reason Studies... 58
7 Tables and Figures Table 1: Performance of State-Owned Highways, Table 2: Overall Cost-Effectiveness Rankings... 5 Table 3: State-Controlled Highway Mileage, Table 4: State Highway Agency Mileage, Table 5: Receipts per State-Controlled Mile, Table 6: Capital and Bridge Disbursements per State-Controlled Mile, Table 7: Maintenance Disbursements per State-Controlled Mile, Table 8: Administrative Disbursements per State-Controlled Mile, Table 9: Total Disbursements per State-Controlled Mile, Table 10: Rural Interstate Condition, Table 11: Urban Interstate Condition, Table 12: Rural Arterial Condition, Table 13: Urban Interstate Congestion, Table 14: Deficient Bridges, Table 15: Fatality Rates, Table 16: Rural Narrow Lanes, Figure 1: Trends in US Highway Performance... 2 Figure 2: Overall State Ranks... 6 Figure 3: Rural Interstate Condition Figure 4: Urban Interstate Condition Figure 5: Rural Arterial Condition Figure 6: Urban Interstate Congestion Figure 7: Fatality Rates... 26
8 17 TH ANNUAL HIGHWAY STUDY 1 Part 1 Overview T his 17 th annual study tracks the performance of the state-owned roads from 1984 to Twelve indicators make up each state s overall rating. They cover highway revenues and expenditures, pavement and bridge condition, congestion, accident rates, and narrow lanes. The study is based on spending and performance data submitted to the federal government by the state highway agencies. (See Appendix 2 for definitions and discussion of the measures used). The nation s continuing trend of generally improving highway performance from 1998 to 2003 was reestablished in 2005 and continued in Six of seven key performance indicators improved between 2005 and Passage of new federal highway legislation in 2005 provided new dollars for roads, bridges, and transit systems. Using the increased funding, states improved pavements, made bridge repairs, and achieved some congestion relief. Although highway revenues and disbursements increased only modestly from the prior year (2.0 percent and 0.7 percent, respectively), highway funds directed to the pavement increased, about 8.6 percent for capital and bridge work, and about 7.1 percent for maintenance. However, administrative costs increased even faster, at about 10.4 percent. For the first time, administrative costs are more than 7 percent of highway costs.
9 2 Reason Foundation Figure 1: Trends in US Highway Performance 1.60 Disbursements v s a n c e rm P e rfo Performance vs Worse Better Rur Int Condition Rural Primary Condition Urb Int Congestion Narrow Lanes Fatality Rate Deficient Bridges Urb Int Condition Table 1: Performance of State-Owned Highways, Statistic Percent Change, Mileage under State Control 810, , , Total Revenues, All Sources, $B $ $ $ Total Expenditures, $B $ $ $ Expenditures, Capital/Bridges, $B $ $ $ Expenditures, Maintenance, $B $ $ $ Expenditures, Administration, $B $ 6.32 $ Highway Construction Price Index Rural Interstate, Percent Poor Condition Urban Interstate, Percent Poor Condition Rural Primary, Percent Poor Condition Urban Interstate, Percent Congested Bridges, Percent Deficient Fatality Rate per 100 Mil Miles Driven Rural Primary, Percent Narrow Lanes
10 17 TH ANNUAL HIGHWAY STUDY 3 The percentage of urban interstates in poor condition decreased, from 5.97 percent to 5.15 percent, and the percentage of rural primary roads in poor condition also decreased, from 0.85 percent to 0.76 percent. Almost all areas studied in this report improved, including the percentage of bridges rated deficient, fatality rates, narrow rural lanes, and (in a turn-around) urban interstate congestion. This latter statistic has been worsening since the mid-1980s, so the improvement, while slight, is encouraging. Only the percentage of rural interstates in poor condition worsened, from 1.72 to 1.98 percent. Despite welcome progress, the study highlights continuing problems. Just under one-quarter of all bridges remain deficient; 50 percent of urban interstates remain congested; accident rates are stubbornly high; and substantial urban interstate mileage remains in poor condition. The recent sharp increases in highway construction costs mean that fewer repairs can be made from the same dollars. This study also found wide variations among the states in road performance. Just six states (Alaska, Michigan, New York, California, New Hampshire, and Louisiana) have over half the poor rural interstate mileage in the country. And three states (California, Minnesota, and North Carolina) have more than 70 percent of their urban interstates congested. The states also vary widely by fatality rates: Massachusetts reported the lowest rate, Montana the highest.
11 4 Reason Foundation Part 2 Cost-Effectiveness Rankings of the States T his report continues its annual ranking of the state highway systems on costs-versuseffectiveness. Since the states have different budgets, system sizes, and traffic, comparative performance depends on both system quality and resources available. To determine relative performance, state highway budgets (per mile of responsibility) are compared with system performance, state by state. States ranked high typically have good-condition systems along with relatively lower costs i.e., better outcomes for less money. Table 2 shows the results for For 2006, the top ten states in overall cost-effectiveness are: 1. North Dakota 6. South Carolina 2. Montana 7. South Dakota 3. New Mexico 8. Nebraska 4. Wyoming 9. Kentucky 5. Kansas 10. Georgia
12 17 TH ANNUAL HIGHWAY STUDY 5 Table 2: Overall Cost-Effectiveness Rankings State 2006 Overall Cost Overall Cost- Change in Rank, Effectiveness Rank Effectiveness Rank North Dakota 1 1 Same Montana 2 5 Improved 3 New Mexico 3 4 Improved 1 Wyoming 4 7 Improved 3 Kansas 5 3 Dropped 2 South Carolina 6 2 Dropped 4 South Dakota 7 11 Improved 4 Nebraska 8 19 Improved 11 Kentucky 9 12 Improved 3 Georgia 10 6 Dropped 4 Oregon 11 8 Dropped 3 Texas Improved 3 Missouri Improved 4 Idaho Dropped 4 Indiana Dropped 1 Virginia Improved 2 Ohio Dropped 1 Minnesota Dropped 5 Tennessee Improved 1 Nevada 20 9 Dropped 11 Wisconsin Improved 1 Maine Improved 1 North Carolina Improved 8 West Virginia Improved 2 Utah Dropped 4 Arizona Improved 1 Arkansas Improved 1 Delaware Improved 12 Alabama Improved 14 Vermont Improved 7 Colorado Dropped 2 Iowa Improved 3 Oklahoma Dropped 11 Illinois Dropped 1 Connecticut Improved 4 Pennsylvania Same Maryland Improved 1 Mississippi Dropped 13 Washington Dropped 7 Louisiana Dropped 10 Florida Same Michigan Same Massachusetts Improved 2 California Same New York Improved 3 New Hampshire Dropped 12 Hawaii Dropped 1 Rhode Island Dropped 1 Alaska Same New Jersey Same


13 6 Reason Foundation Figure 2: Overall State Ranks Several states improved their rankings sharply from 2005: Alabama jumped from 43 rd to 29 th after sharp improvements in its rural and urban pavement condition. Nebraska moved up 11 positions from 19 th to 8 th, reporting no rural pavement in poor condition. Delaware ranked 28 th in 2006, a sharp improvement from 2005 where it stood 40 th. North Carolina improved from 31 st in 2005 to 23 rd in 2006, a gain of eight positions, by substantially reducing the mileage of poor urban interstate. On the other hand, several states lost ground between 2005 and 2006: Mississippi fell 13 positions, from 25 th to 38 th, due to a sharp increase in administrative and capital/bridge disbursements per mile and a sharp decrease in urban interstate condition. New Hampshire slipped 12 positions from 34 th to 46 th. It reported a very large increase in poor rural interstate mileage.
14 17 TH ANNUAL HIGHWAY STUDY 7 Nevada slipped 11 slots, from 9 th to 20 th, due to increased administrative disbursements and higher urban interstate congestion. Louisiana lost 10 positions, from 30 th to 40 th, as a result of an increase in capital/bridge disbursements and a sharp increase in percentage of poor condition rural interstates. Detailed data and trends in rankings for each of the states are shown in the attached tables.
15 8 Reason Foundation Part 3 Trends in Performance Indicators etails on the trends of performance measures follow. Selected system condition measures are Dalso shown in the attached maps.
16 17 TH ANNUAL HIGHWAY STUDY 9 State-Controlled Miles State-controlled miles include the state highway systems, state-agency toll roads, some ferry services, and smaller systems serving universities and state-owned properties. Nationwide, about 814,770 miles are under state control (Table 3, State- Controlled Highway Mileage), about 1,899 more miles than in The smallest state-owned road systems continue to be Hawaii (975 miles) and Rhode Island (1,104 miles); the largest are Texas (79,852 miles) and North Carolina (79,815 miles). Texas replaces North Carolina as the largest state-owned highway system. Table 3: State-Controlled Highway Mileage, 2006 Rank State Mileage 1 TX 79,852 2 NC 79,815 3 VA 57,505 4 PA 43,237 5 SC 41,621 6 WV 34,153 7 MO 33,681 8 KY 27,775 9 OH 22, CA 18, GA 17, WA 17, LA 16, IL 16, AR 16, NY 15, TN 14, OK 13, MN 13, NM 12, FL 12, OR 12, WI 11, IN 11, AL 11, MT 11, MS 11, KS 10, CO 10, NE 10, MI 9, IA 9, ME 8, SD 8, WY 7, ND 7, AZ 7, AK 6, NV 5, UT 5, DE 5, MD 5, ID 4, NH 4, CT 3, MA 3, NJ 2, VT 2, RI 1, HI 975 Total 814,770 Mean 16,295
17 10 Reason Foundation State Highway Agency Mileage About 777,682 miles are the responsibility of the 50 state highway agencies (Table 4, State Highway Agency Mileage). In most states these are generally the Interstates and other major U.S.- numbered and state-numbered roads, but a few states also manage major portions of the rural road system. The average number of lanes is 2.37 lanes, but a few states (New Jersey, Florida, California, and Massachusetts) manage significantly wider roads. Table 4: State Highway Agency Mileage, 2006 Rank State Miles Lane-Miles Ratio 1 WV 34,087 70, AK 5,674 11, ME 8,547 18, NC 79, , VA 57, , SC 41,430 89, DE 5,275 11, PA 39,843 88, NH 3,981 8, KY 27,530 61, MO 33,681 75, AR 16,432 36, NE 9,956 22, MT 10,780 24, ND 7,384 16, VT 2,633 6, SD 7,843 18, LA 16,687 38, WY 6,753 15, KS 10,368 23, TX 79, , NV 5,381 13, OR 7,532 18, ID 4,959 12, NM 11,994 29, OK 12,287 30, MN 11,926 29, MS 10,970 27, WI 11,771 29, CO 9,110 22, NY 15,549 39, IN 11,183 28, OH 19,266 48, AL 10,978 28, IA 8,909 22, HI 928 2, UT 5,848 15, TN 13,836 36, IL 16,083 41, WA 7,043 18, CT 3,716 9, RI 1,104 2, GA 17,910 47, AZ 6,813 18, MI 9,696 27, MD 5,150 14, MA 2,830 8, CA 15,234 50, FL 12,069 41, NJ 2,326 8, ,682 1,846,
18 17 TH ANNUAL HIGHWAY STUDY 11 Receipts for State-Administered Highways The states obtain their road funds primarily from federal funds, stateimposed fuel taxes, and vehicle/license/equipment fees, general funds, tolls, bonds and other financial initiatives. In 2006, a total of about $ billion was received by the states for stateadministered roads, up 2.0 percent from 2005 (Table 5, Receipts per State- Controlled Mile). This reflects the first full year of SAFETEA-LU funding. In 2006, receipts per mile of responsibility averaged $128,538 and ranged from a low of $31,685 per mile of responsibility for South Carolina to a high of $2,209,394 for New Jersey. Since 1984, per-mile receipts for stateowned roads have increased about 224 percent. Table 5: Receipts per State-Controlled Mile, 2006 Rank State Receipts/mile 1 SC 31,685 2 WV 31,774 3 MT 38,815 4 NC 40,736 5 NM 48,556 6 WY 51,714 7 SD 53,942 8 VA 54,799 9 AR 58, ND 58, NE 60, MO 61, ME 63, KY 68, IA 86, VT 97, MS 98, AK 100, TN 104, TX 105, KS 105, LA 106, MN 116, WA 123, OR 124, NH 125, AL 125, GA 127, PA 128, IN 130, WI 131, ID 133, OH 140, OK 150, DE 152, UT 159, NV 171, CO 173, MI 224, AZ 259, IL 281, HI 293, NY 299, MD 333, CT 337, RI 551, CA 579, MA 581, FL 599, NJ 2,209,394 Mean 128,538
19 12 Reason Foundation Capital and Bridge Disbursements Capital and bridge disbursements for state-owned roads totaled $ billion in 2006, about 8.7 percent higher than in 2005 (Table 6, Capital and Bridge Disbursements per State- Controlled Mile). This reflects the surge forward in improvement due to financing from SAFETEA-LU. Since 1984, per-mile capital and bridge disbursements have increased about 235 percent. Per-mile capital and bridge disbursements averaged $67,089 in 2006 compared to $61,891 in In 2006 the state with the lowest capital and bridge disbursements per mile was Virginia at $16,796 disbursements per mile while the highest was New Jersey with $589,361 disbursements per mile. Table 6: Capital and Bridge Disbursements per State-Controlled Mile, 2006 Rank 2006 State Disbursements/Mile 1 VA 16,796 2 SC 19,084 3 WV 20,501 4 NC 23,138 5 MT 30,027 6 WY 30,934 7 NM 31,299 8 KY 31,848 9 MO 36, ME 37, AR 37, NE 39, SD 39, ND 43, VT 44, OK 49, OR 49, CO 50, PA 52, AK 53, IA 57, MN 65, TN 65, NH 65, WA 67, ID 68, MS 70, KS 71, IN 72, TX 72, DE 73, LA 74, AL 76, OH 76, GA 90, WI 90, UT 96, NV 97, CT 133, AZ 136, MI 137, HI 158, NY 160, IL 166, CA 194, MD 207, RI 219, MA 276, FL 380, NJ 589,361 Mean 67,089
20 17 TH ANNUAL HIGHWAY STUDY 13 Maintenance Disbursements Maintenance disbursements increased by 7.1 percent from 2005 to 2006, from $15.94 billion in 2005 to $17.07 billion in 2006, and accounted for about 17.1 percent of total disbursements (Table 7, Maintenance Disbursements per State-Controlled Mile). Since 1984 per-mile maintenance disbursements have increased about 183 percent. On a per-mile basis, 2006 maintenance disbursements per mile of responsibility averaged about $20,953. The lowest per-mile maintenance disbursement was $4,643 in North Dakota, the highest $145,186 in New Jersey. Table 7: Maintenance Disbursements per State-Controlled Mile, 2006 Rank State Disbursements/mile 1 ND 4,643 2 WV 6,687 3 SD 7,422 4 MS 7,884 5 SC 8,281 6 NC 8,670 7 MT 9,251 8 NE 10,547 9 KY 10, AR 10, GA 11, AL 13, WY 13, MO 13, WI 14, ID 14, OK 14, KS 15, IA 15, AZ 15, NM 16, TN 17, UT 17, VA 18, OH 18, ME 18, NV 18, OR 19, NH 20, WA 21, TX 22, VT 24, DE 25, MI 27, LA 28, MN 29, IL 30, PA 30, AK 31, HI 32, CO 33, IN 37, CT 41, CA 43, MD 51, NY 68, MA 70, RI 85, FL 90, NJ 145,186 Mean 20,953
21 14 Reason Foundation Administrative Disbursements Administrative disbursements increased sharply: they totaled $7.02 billion in 2006, about 10.3 percent higher than in 2005 (Table 8, Administrative Disbursements per State-Controlled Mile). Administrative costs accounted for about 7.04 percent of total disbursements, up from 6.43 percent in Since 1984, per-mile administrative disbursements have increased about percent. On a per-mile basis, 2006 administrative disbursements averaged $8,611, ranging from a low of $1,132 in Kentucky to a high of $71,720 in New Jersey. Table 8: Administrative Disbursements per State- Controlled Mile, 2006 Rank 2006 State Disbursements/Mile 1 KY 1,132 2 ND 1,762 3 AR 1,875 4 MO 1,990 5 SC 2,424 6 LA 2,832 7 WV 2,917 8 NC 3,176 9 TX 3, ME 3, VA 3, ID 4, WY 4, IA 5, WA 5, IN 5, NE 5, SD 6, NM 6, KS 6, MS 6, CO 6, MT 6, OK 7, AK 7, OH 8, OR 8, MN 9, TN 10, PA 10, WI 11, MI 11, IL 11, MD 12, NH 13, GA 13, VT 13, CT 15, AL 16, DE 16, FL 17, NY 20, NV 21, RI 21, UT 22, AZ 30, HI 59, MA 66, CA 67, NJ 71,720 Mean 8,611
22 17 TH ANNUAL HIGHWAY STUDY 15 Total Disbursements In total, the states disbursed about $ billion for state-owned roads in 2006, about 1.1 percent higher than in 2005 (Table 9, Total Disbursements per State-Controlled Mile). Since 1984, per-mile total disbursements have increased about 229 percent. On a per-mile basis, 2006 disbursements averaged $122,254. The lowest disbursement per mile was $32,699 in West Virginia, the highest $1,839,188 in New Jersey. Two states (Hawaii and California) reported administrative disbursements of greater than 15 percent of their budgets. Table 9: Total Disbursements per State-Controlled Mile, 2006 Rank State Disbursements/Mile 1 WV 32,699 2 SC 33,560 3 NC 40,011 4 VA 49,281 5 KY 50,283 6 MT 51,027 7 WY 53,488 8 ND 53,827 9 SD 56, AR 58, MO 61, NE 62, NM 67, ME 69, OR 86, IA 91, MS 92, ID 94, TN 95, VT 99, AK 101, TX 110, LA 111, WA 113, MN 114, KS 115, AL 118, CO 119, NH 122, PA 122, OH 130, WI 134, GA 142, OK 145, DE 151, IN 154, NV 164, UT 165, MI 222, IL 247, AZ 264, CT 300, HI 303, NY 307, MD 324, RI 426, CA 447, FL 592, MA 749, NJ 1,839,188 Mean 122,254
23 16 Reason Foundation Rural Interstate Condition In most states road condition is measured using special machines that determine the roughness of road surfaces. (A few states continue to use visual ratings.) About 1.98 percent of U.S. rural interstates 603 miles out of 30,512 were reported in poor condition in 2006 (Table 10, Rural Interstate Condition, and Figure 3). Rural interstate condition has witnessed a slight worsening from 2005 when 1.73 percent of rural interstates were rated poor. The amount of poor mileage varies widely by state. Twenty-two states reported no poor mileage, and five more reported less than 1 percent poor mileage. On the other hand, six states (Washington, Mississippi, Louisiana, New York, Alaska, and New Jersey) reported 5-10 percent poor mileage, and two states (Michigan and New Hampshire) reported more than 10 percent poor mileage. Just six states (Louisiana, New Hampshire, California, New York, Michigan, and Alaska) collectively have more than 50 percent of the poor rural interstate mileage in the country. New Hampshire, particularly, reported an increase of 35 miles of poor-condition rural interstate measures in just one year. Table 10: Rural Interstate Condition, 2006 Rank 2006 State Percent Poor Miles 1 AZ CT FL GA HI IL IN KS KY MA MO ND NE NM NV OH OR RI SD TN TX VA ME ID MD MT PA OK WY VT UT IA MN SC WV CO WI AR AL NC CA WA MS LA NY AK NJ MI NH DE NA Mean 1.98


24 Figure 3: Rural Interstate Condition 17 TH ANNUAL HIGHWAY STUDY 17
25 18 Reason Foundation Urban Interstate Condition The urban interstates consist of major multi-lane interstates in and near urban areas. The condition of the urban interstate system improved in 2006 to 5.15 percent poor from 5.97 percent poor in 2005 (Table 11, Urban Interstate Condition, and Figure 4). The condition of the urban interstate also varies widely. Eight states reported no poor urban interstate mileage, while two states (New Jersey and Hawaii) reported more than 15 percent poor mileage. Since 1984, the percentage of poor urban interstate mileage has been reduced by about 40 percent. Table 11: Urban Interstate Condition, 2006 Rank State Percent Poor Miles 1 AK AZ GA KS ND OR RI VT FL SC MA MN OH KY SD NV IN TN TX UT NM MO ME PA NC CT WV VA WI MT IL DE WY CO MS AR MD MI AL NE ID LA OK NY WA NH IA CA NJ HI Mean 5.15


26 Figure 4: Urban Interstate Condition 17 TH ANNUAL HIGHWAY STUDY 19
27 20 Reason Foundation Rural Principal Arterial Pavement Condition The condition of the major rural highways continued to improve from 2005 to 2006 by about 0.09 percent. Overall, about 0.76 percent of the rural other principal arterial system 719 miles out of 94,500 were reported to be in poor condition (Table 12, Rural Arterial Condition, and Figure 5). This compares with 0.85 percent, or about 799 miles, in Since 1998, the percentage of poor rural primary mileage has decreased more than one-third, but since 2000, it has remained relatively constant, between 0.65 and 0.94 percent. Seven states reported no poor rural primary mileage in On the other hand, Alaska and Rhode Island reported more than 10 percent of their rural primary mileage to be in poor condition. Hawaii reported 2.73 percent of its rural primary to be in poor condition in 2006, a sharp increase from 2005 when it reported no rural primary in poor condition, Alabama showed a sharp improvement in its rural primary condition, going from 0.56 percent poor in 2005 to 0.09 percent poor in Table 12: Rural Arterial Condition, 2006 Rank State Percent Poor Miles 1 AZ DE FL GA MA MT NV TX WY OH ID KS KY AL NM VA WA SC IN MN TN MD MO WI AR OR WV NE CT IL UT CA ND NY PA NJ CO ME NC VT MI SD IA NH OK LA HI MS RI AK Mean 0.76


28 Figure 5: Rural Arterial Condition 17 TH ANNUAL HIGHWAY STUDY 21
29 22 Reason Foundation Urban Interstate Congestion There is no universally accepted definition of traffic congestion, but in reporting to the federal government, the states use the volume-to-capacity ratios that are determined by Transportation Research Board s Highway Capacity Manual. The congestion measures for 2006 are not totally comparable with earlier years, since most states increased the rated capacities of urban interstates based on the 1997 and 2000 Highway Capacity Manuals. Nevertheless, the overall 2006 statistic percent congested shows just a slight improvement from 2005 (51.85 percent congested). (See Table 13, Urban Interstate Congestion, and Figure 6). For 2006, about 8,056 miles out of 15,882 urban interstate miles were rated as having volume/capacity ratios greater than 0.70, the standard for mild congestion. In 2006, three rural states (Montana, North Dakota, and Wyoming) reported no congested urban interstates, while 18 states reported half or more of their urban interstates congested. Three states (California 83.3 percent, Minnesota 79.4 percent, and North Carolina 70.2 percent) reported more than 70 percent of their urban interstates as congested. Arizona, New Hampshire, Illinois, and Michigan showed significant reduction in their urban interstate congestion from Wisconsin, Nevada, and Oregon showed sharp increases. Table 13: Urban Interstate Congestion, 2006 Rank State Percent Miles Congested 1 MT ND WY SD ME WV VT AK NM KS IN NE OK ID AZ MS HI PA CO IA IL VA NH WA MA MI WI OR AL TN UT LA SC TX NY GA NV MO FL DE AR RI CT OH NJ KY MD NC MN CA Mean 50.72


30 Figure 6: Urban Interstate Congestion 17 TH ANNUAL HIGHWAY STUDY 23
31 24 Reason Foundation Deficient Bridges Federal law mandates the uniform inspection of all bridges for structural and functional adequacy at least every two years; bridges rated deficient are eligible for federal repair dollars. The condition of the nation's highway bridges has been slowly but steadily improving, and it continued to improve from 2005 to Of the 597,598 highway bridges in the current National Bridge Inventory, 144,225 about percent were reported deficient for 2006 (Table 14, Deficient Bridges), a slight improvement from In 1998, about 29.0 percent were rated deficient. However, progress is slow. At the current rate of improvement, it would take 62 years for all deficient bridges to be brought to standard. Nevada reported the lowest percentage of deficient bridges, 3.92 percent, while Rhode Island reported the highest, percent. Table 14: Deficient Bridges, 2006 Rank 2006 State Percent Deficient 1 NV AZ WY CO MN WI UT NM CA IL DE FL TN ID MT GA TX KS AR IN AK VA OH SC ND OR NE AL SD MS MI WA MD IA NJ KY LA ME NH MO NC OK CT VT MA WV NY HI PA RI Mean 24.13
32 17 TH ANNUAL HIGHWAY STUDY 25 Fatality Rates Fatality rates are an important overall measure of each state s road performance. The nation s highway fatality rate has improved slightly (Table 15, Fatality Rates, and Figure 7). For 2006, 42,605 fatalities were reported, lower than 43,395 reported for As travel continued to increase, the average fatality rate was fatalities per 100 million vehicle miles, down 2.2 percent from in For 2006, Massachusetts reported the lowest rate, 0.785, while Montana reported the highest, Table 15: Fatality Rates, 2006 Rank State Fatalities per 100 million miles 1 MA MN NH CT RI NY NJ MI VT CO UT OH WA MD IL VA WI ME IN CA OR NE IA PA ND TX AK GA NC HI DE KS MO OK FL ID TN KY WV AL AR NM NV SC WY SD MS AZ LA MT Mean 1.421
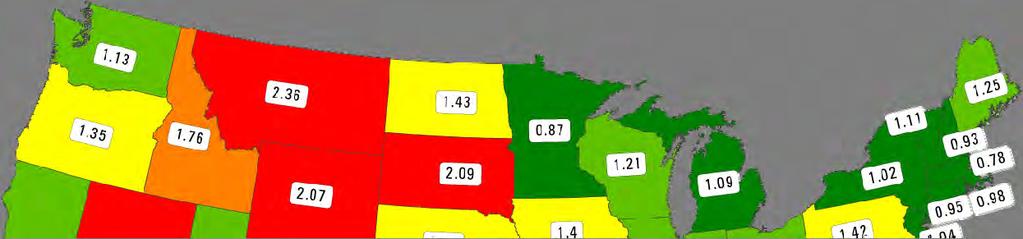
33 26 Reason Foundation Figure 7: Fatality Rates
34 17 TH ANNUAL HIGHWAY STUDY 27 Narrow Rural Lanes Narrow lanes on major rural roads indicate problems with lines of sight and design adequacy. The national design standard for lane width on major rural roads is generally 12 feet, and few, if any, major rural roads would be improved without widening lanes to the standard. In 2006, about percent of rural other principal arterials 10,064 miles out of 94,915 had narrow lanes less than 12 feet wide (Table 16, Rural Narrow Lanes), better than the percent reported in Seven states reported no narrow-lane mileage, while West Virginia (41.14 percent) reported the highest percentage of narrow lanes. Table 16: Rural Narrow Lanes, 2006 Rank State Percent Narrow 1 AZ DE ND NJ NV SD UT ID KS MT NE CT WY GA RI WI OK NH AL NM MA MN CA IN MD AK OR SC FL IA MS LA TX NC IL CO OH KY MI MO VT TN ME NY VA AR HI WA PA WV Mean 10.6
35 28 Reason Foundation Part 4 What Works and What Doesn t T he long-term data on road conditions, overall performance, and cost-effectiveness permits some generalizations regarding road management policy. Although there are many exceptions, over the long-run our analysis suggests: Regular, effective maintenance is a must. States should strive to implement policies that emphasize the treatment of problems early in the life cycle, which can reduce costs and prevent system deterioration. Delayed or deferred maintenance often reduces short-term expenditures, but allows conditions to worsen and can increase costs later. High administration costs, relative to system size, are problematic. Limiting administrative expenditures that don t actually improve road and bridge conditions is a key to success. Size and geography don t matter. Some states with large state-owned highway systems have high ratings (South Carolina 6 th, Georgia 10 th ). The two states with the smallest stateowned highway systems are actually at the bottom of the overall rankings (Hawaii 47 th, Rhode Island 48 th ). New Jersey, which ranks last in overall performance again, has the fourth smallest system. By contrast, Texas has the largest state highway system and ranks 12 th overall. Is National Progress Still Possible? Another emerging issue in this long-term data is the question of appropriate goals. There is increasing evidence that some measures may have essentially irreducible bottoms below which it may not be realistic to go. Since 2000, urban interstate congestion has hovered around 50 percent; the percent of rural primary roads in poor condition has remained near 0.75 percent; the percent of rural interstates in poor condition has remained near 2 percent; and the percent of rural primary roads with narrow lanes has remained close to 10 percent. Although some states have achieved remarkably lower statistics, overall, the nation has found it difficult to reducer these statistics even though dollars have substantially increased. This suggests that combinations of system condition, unit costs, and background trends, such as traffic, make further progress problematic. On the other hand, substantial progress still seems possible for reducing accident rates, improving bridges, and improving urban interstate condition. One of the most useful features of long-term studies, such as this, is that they help us to understand the limits of, and potential for, goal achievement relative to cost, and thereby encourage us to choose wisely, and what is most important.
36 17 TH ANNUAL HIGHWAY STUDY 29 Part 5 Top Ten States 1. North Dakota North Dakota is once again 1 st in the overall performance ratings, where it has been since The system ranks best for urban interstate condition (tied for 1 st ), urban interstate congestion (tied for 1 st ), rural primary pavements narrow (tied for 1 st ), rural interstate condition (tied for 1 st ), maintenance disbursements per mile of responsibility (1st), and administrative disbursements per mile of responsibility (2 nd ). Its lowest ratings were for rural primary pavement condition (33 rd ), deficient bridges (25 th ) and fatality rate (25 th ). North Dakota s relatively low traffic volumes, good system condition and relatively low unit costs have consistently placed it in the top-performing states. Compared to 2005, the receipts per mile of responsibility for North Dakota increased from $42,199 in 2005 to $58,872 in Its fatality rate decreased by 11.7 percent from 1.62 in 2005 to 1.43 in Other performance measures did not see significant changes from 2005 to Montana In 2006, Montana ranked 2 nd in overall performance, 5 th in With 11,075 miles, Montana has a medium-sized state highway system. Montana s best ranks are in rural primary pavement condition (tied for 1 st ), urban interstate congestion (tied for 1 st ), receipts per mile of responsibility (3 rd ), capital disbursements per mile of responsibility (5 th ), total disbursements per mile of responsibility (6 th ) and maintenance disbursements per mile of responsibility (7 th ). Its lowest rankings were for fatality rate (50 th ), urban interstate condition (30 th ), and rural interstate condition (26 th ). Montana showed significant improvement in urban interstate condition from 2005, when percent of its urban interstates were reported poor, to just 4.76 percent reported poor in At the same time its administrative costs, per mile of responsibility rose by 44.9 percent from 2005.
37 30 Reason Foundation 3. New Mexico In 2006, New Mexico ranked 3 rd in the overall performance ratings. The state has seen steady improvement in the performance ratings from 2000, when it ranked 27 th. In 2006, its best ratings were for rural interstate condition (tied for 1 st ), receipts per mile of responsibility (5 th ), capitalbridge disbursements per mile of responsibility (7 th ), deficient bridges (8 th ), and urban interstate congestion (9 th ). New Mexico s lowest rankings were for fatality rate (42 nd ), maintenance disbursements per mile of responsibility (21 st ), urban interstate condition (21 st ), rural primary pavement narrow (20 th ) and administrative disbursements per mile of responsibility (19 th ). New Mexico had a large reduction in administrative disbursements per mile of responsibility, from $11,466 per mile in 2005 (which was inordinately high) to $6,048 per mile in 2006, in line with earlier years. This occurred possibly as a result of moving dollars from administration into project budgets. 4. Wyoming In the overall performance ratings for 2006, Wyoming stood 4 th, compared with 7 th in 2005 and 2 nd in Wyoming reported a total of 7,467 miles under state control, about one-half the national average. For 2006, Wyoming s best ratings were for urban interstate congestion (tied for 1 st ), deficient bridges (3 rd ), receipts per mile of responsibility (6 th ), capital disbursements per mile of responsibility (6 th ), total disbursements per mile of responsibility (7 th ), and rural primary pavement condition (9 th ). Wyoming performed worst in fatality rate (45 th ), urban interstate condition (33 rd ), and rural interstate condition (29 th ). Between 2005 and 2006, Wyoming moved from 7 th to 4 th overall, largely as a result of cost reductions and improvement in the urban interstate. Its fatality rate worsened slightly but not enough to prevent its gains. 5. Kansas With 10,546 miles under state control in 2006, Kansas was ranked 5 th in the overall performance ratings. This compares to 3 rd in 2005 and 6 th in For 2006, Kansas s best ratings were for rural interstate condition (tied for 1 st ) with no poor miles reported for 2006, urban interstate condition (tied for 1 st ), rural narrow roads (9 th ), urban interstate congestion (10 th ), and rural primary pavement condition (12 th ). Kansas scored lowest on fatality rate (32 nd ), capital disbursements per mile of responsibility (28 th ), and total disbursements per mile of responsibility (26 th ). Kansas s 3-point drop between 2005 and 2006 was largely caused by an 8 percent worsening of its fatality rate and an increase in receipts.
38 17 TH ANNUAL HIGHWAY STUDY South Carolina South Carolina has the 5 th largest state-owned highway system at 41,621 miles. It ranked 6 th in the overall performance ratings in 2006, compared to 3 rd in 2000 and 2 nd in It ranked best on receipts per mile of responsibility (1 st ), capital disbursements per mile of responsibility (2 nd ), total disbursements per mile of responsibility (2 nd ), maintenance disbursements per mile of responsibility (5 th ) and administrative disbursements per mile of responsibility (5 th ). Its lowest ratings were for fatality rate (44 th ), rural interstate condition (34 th ), and urban interstate congestion (33 rd ). South Carolina reported a sharp increase in its rural interstate in poor condition, from 0 percent in poor condition in 2005 to 2.24 percent in poor condition in This corresponded to a 15-mile increase in poor mileage. 7. South Dakota South Dakota s 8,145-mile system ranked 7 th in the overall performance ratings in 2006 compared to 11 th in 2005 and 30 th in It performed best on percent of rural primary pavements that are narrow (tied for 1 st ), rural interstate in poor condition (tied for 1 st ), maintenance disbursements per mile of responsibility (3 rd ), and urban interstate congestion (4 th ). Its worst ratings were for fatality rate (46 th ), rural primary roads in poor condition (42 nd ) and deficient bridges (29 th ). For the first time, South Dakota reported some urban congestion in The amount was modest, just 1.45 percent of the system, and it was not enough to offset improvements in its financial picture or hurt the overall ranking. 8. Nebraska In the overall performance rankings in 2006, Nebraska ranked 8 th compared with 19 th in Since 2000, Nebraska has steadily improved its rankings from 29 th in 2000 to 8 th in The factors where Nebraska fared well in 2006 were rural interstate in poor condition (tied for 1 st ), maintenance disbursements per mile of responsibility (8 th ), receipts per mile of responsibility (11 th ), rural primary pavement narrow (11 th ), capital disbursements per mile of responsibility (12 th ), total disbursements per mile of responsibility (12 th ) and urban interstate congestion (12 th ). Its worst ratings were for urban interstate condition (40 th ), rural other primary pavement condition (28 th ), and deficient bridges (27 th ). Nebraska s jump from 19 th to 8 th in 2006 was based on significant improvement in the rural interstate system, which was improved from 2.12 percent poor (36 th ) to 0.0 percent poor. Nebraska also improved its urban interstate condition from 14.0 percent poor (45 th ) to 9.8 percent poor (40 th ).
39 32 Reason Foundation Smaller gains were also made in urban congestion, deficient bridges, narrow lanes, and fatality rate. 9. Kentucky Kentucky has 27,775 miles under state control, almost twice the national average. Kentucky was ranked 9 th in the overall performance ratings in 2006, a slight improvement from 2005 where it ranked 12 th. Its best ratings were for administrative disbursements per mile of responsibility (1 st ), rural interstate condition (tied for 1 st ) with 0 percent reported as poor, total disbursements per mile of responsibility (5 th ), capital disbursements per mile of responsibility (8 th ), and maintenance disbursements per mile of responsibility (9 th ). Its worst ratings were for (perhaps surprisingly) urban interstate congestion (46 th ), fatality rate (38 th ), rural primary pavement narrow (38 th ), and deficient bridges (36 th ). Kentucky reported a significantly lower administrative disbursement per mile of responsibility from $3,989 in 2005 to $1,132 in 2006, with 3 percent of bridges deficient and a slight improvement in its fatality rate. 10. Georgia The 17,994-mile state-owned highway system in Georgia is just slightly larger than the national average. In 2006, Georgia ranked 10 th in the overall performance ratings, a slight drop from 6 th in 2005 and 4 th in Georgia system ranked highest in rural interstate condition (tied for 1 st ), urban interstate condition (tied for 1 st ), and rural primary condition (tied for 1 st ). Apart from these, its best ratings were for maintenance disbursements per mile of responsibility (11 th ), narrow rural primary pavement (14 th ), and deficient bridges (16 th ). Georgia, in 2006, fared worst in urban interstate congestion (36 th ), administrative disbursements per mile of responsibility (36 th ), capital/bridge disbursements per mile of responsibility (35 th ), and total disbursements per mile of responsibility (33 rd ). In 2006, Georgia reported a significant increase in receipts per mile of responsibility (from 23 rd to 28 th ) and a 29.8 percent increase in its capital/bridge disbursements per mile of responsibility (from 27 th to 35 th ). The percentage of deficient bridges was reduced by about 1 percent, but the percent of narrow lanes increased. So, increased expenditures did not, generally, make their way into improved relative scores.
40 17 TH ANNUAL HIGHWAY STUDY 33 Part 6 Bottom Ten States 41. Florida Florida has 12,069 miles of highway under the state-owned highway system, slightly less than the national average. In 2006, Florida ranked 41 st in the overall state highway performance ratings, the same overall rating as in 2005; in 2000 it ranked 38 th. Florida s best ratings were for rural interstate condition (tied for 1 st ) with no percent reported as poor, rural primary pavement condition (tied for 1st) with 0 percent reported as poor, urban interstate condition (9 th ) and deficient bridges (12 th ). Its worst ratings were for receipts per mile of responsibility (49 th ), capital/bridge disbursements per mile of responsibility (49 th ), maintenance disbursements per mile of responsibility (49 th ), total disbursements per mile of responsibility (48 th ) and administrative disbursements per mile of responsibility (41 st ). Florida s statistics show very little change between 2005 and Michigan In 2006, Michigan reported about 9,734 miles of highway under state control. Michigan was ranked 43 rd in 2000, 42 nd in 2005, and 42 nd in The state s best ratings are its fatality rate (8 th ) and (perhaps surprisingly) urban interstate congestion (26 th ). It fared poorly in rural interstate condition (48 th ), rural primary pavement condition (41 st ), capital/bridge disbursements per mile of responsibility (41 st ), receipts per mile of responsibility (39 th ), total disbursements per mile of responsibility (39 th ), rural primary pavement narrow (39 th ), and urban interstate condition (38 th). Michigan s overall stable rating between 2005 and 2006 masks several large changes. Rural interstate condition worsened sharply from 7.7 to 12.8 percent poor, and the rural primary also worsened significantly, from 24 th to 41 st. But urban interstate condition improved from 12.8 to 7.3 percent poor, congestion improved slightly, deficient bridges.
41 34 Reason Foundation 43. Massachusetts The state-owned highway system in Massachusetts has about 3,244 miles, 5 th smallest in the nation. For 2006, Massachusetts is rated at 43 rd overall, up slightly from 45, in 2005; in 2000 the state was ranked 49 th. Massachusetts ranks 1 st in three of the twelve categories: rural interstate condition (tied for 1 st ), rural primary pavement condition (tied for 1 st ), and fatality rate. It also scored well on urban interstate condition (11 th ), narrow rural primary roads (21 st ), and urban interstate congestion (25 th ). However, its relative costs are higher than average, ranking 49 th in total disbursements per mile of responsibility, 48 th in administrative disbursements per mile of responsibility, 48 th in capital/bridge disbursements per mile of responsibility, 48 th in receipts per mile of responsibility, 47 th in maintenance disbursements per mile of responsibility, and 45 th in deficient bridges. Between 2005 and 2006, the state lowered its capital expenditures while increasing maintenance expenditures, 44. California California has 18,251 miles of state-owned highway system, slightly larger than the national average. In 2006, California ranked 44 th in the overall state highway performance ratings, the same as in 2005 and one spot better than in In 2006, its best ratings were for deficient bridges (9 th ), fatality rate (20 th ) and narrow rural primary pavements (23 rd ). However, California has the highest percent urban interstate congested in the entire nation, 83.3 percent. It also performed poorly on administrative disbursements per mile of responsibility (49 th ), urban interstate in poor condition (48 th ), receipts per mile of responsibility (47 th ), total disbursements per mile of responsibility (47 th ), capital/bridge disbursements per mile of responsibility (45 th ), maintenance disbursements per mile of responsibility (44 th ) and rural interstate condition (41 st ). California s total disbursements increased about 33 percent from 2005 to 2006, yet its system performance remained essentially unchanged. 45. New York New York has about 15,985 miles of state-owned highways. In 2006, it ranked 45 th in the overall state highway performance ratings, an improvement from 48th in New York was rated 47 th in 2000, but had been rated as high as 40 th in earlier reviews. Its best 2006 ratings were for its fatality rate (6 th ), rural primary pavement condition (34 th ), and urban interstate congestion (35 th ). Its worst ratings were for deficient bridges (47 th ), maintenance disbursements per mile of responsibility (46 th ), rural interstate condition (45 th ), urban interstate condition (44 th ), total disbursements per mile of responsibility (44 th ), capital/bridge disbursements per mile of responsibility (43 rd ), receipts per mile of responsibility (43 rd ), and administrative disbursements per mile of responsibility (42 nd ). On balance, New York seems to be progressing after years of declining ratings. Between 2005 and 2006, the percentage of rural interstates in poor condition was cut almost in half (from 13.3 to 8.0
42 17 TH ANNUAL HIGHWAY STUDY 35 percent), urban interstate poor mileage reduced by one-third from 16.5 to 12.0 percent, and rural primary poor mileages reduced by three-quarters from 3.9 to 1.0 percent. The percent of urban interstates congested also reduced slightly. However, the percent of deficient bridges increased about 1 percent, and the percentage of narrow lanes increased 3 percent. 46. New Hampshire New Hampshire s state-owned highway, at 4,011 miles, is the 7 th smallest in the nation. The state witnessed a sharp decline in overall performance ratings from 2005 where it stood 34 th to 46 th in This is attributed to a big increase in its percentage of rural and urban interstates in poor condition, from 0 percent in 2005 to 23.33, and 0 percent to percent, respectively. This drastic change overshadowed the improvements the state saw in fatality rate, urban interstate congestion and maintenance disbursements per mile of responsibility. New Hampshire s best ratings were for fatality rate (3 rd ) and narrow rural primary pavements (18 th ). Its worst ratings were for rural interstate condition (49 th ), urban interstate in poor condition (46 th ), and rural primary pavement condition (44 th ). 47. Hawaii With just 975 miles under the state control, Hawaii has the smallest state-owned system. In 2006, Hawaii ranked 47 th in the overall performance ratings, compared with 46 th in 2005, and 48 th in With no rural interstate reported as poor, Hawaii ranks best (1 st ) in this category. Its other better ratings were urban interstate congestion (17 th ) and fatality rate (30 th ). However, Hawaii has percent of its urban interstates in poor condition, 50 th in the nation. In addition, Hawaii did not fare well in deficient bridges (48 th ), narrow rural primary pavements (47 th ), rural primary in poor condition (47 th ), administrative disbursements per mile of responsibility (47 th ), total disbursements per mile of responsibility (43 rd ), receipts per mile of responsibility (42 nd ) and capital/bridge disbursements per mile of responsibility. Hawaii is spending two to three times the national average per mile of responsibility, yet its system is performing poorly. 48. Rhode Island Rhode Island has the second smallest state-owned system, just 1,104 miles. The state has continued to slide, from 47 th in 2005 to 48 th in 2006, down from 36 th in Rhode Island s best performance is the condition of its interstates, which reported no poor condition mileage. It also fared well in fatality rate (5 th ). Its worst ratings were for deficient bridges (50 th ), rural primary pavement condition (49 th ), maintenance disbursements per mile of responsibility (48 th ), capital/bridge disbursements per mile of responsibility (47 th ), receipts per mile of responsibility (46 th ), total disbursements per mile of responsibility (46 th ), administrative disbursements per mile of responsibility (44 th ) and urban interstate congestion (42 nd ). Clearly, Rhode Island is spending
43 36 Reason Foundation significantly more than the average state, but (except for the interstate) is not getting the basic results. 49. Alaska In the overall performance ratings for 2006, Alaska ranked the same as in 2005 but was down from 40 th in The state has 6,436 miles of state-owned highway, less than one-half the national average. Alaska s best ratings are for urban interstate condition (tied for 1 st ) with no poor mileage reported and urban interstate congestion (8 th ). Its worst ratings are for rural primary pavement condition (50 th ), rural interstate condition (46 th ), and maintenance disbursements per mile of responsibility (39 th ). Between 2005 and 2006, Alaska reduced its total disbursements but increased its maintenance costs. Its percent of rural poor interstate doubled, from 4.4 to 8.8 percent. 50. New Jersey New Jersey has 2,911 miles of state-owned highways, the 4 th smallest in the nation. In 2006, New Jersey ranked 50 th in the overall performance ratings, the same as in New Jersey ranks 50 th in several categories: receipts per mile of responsibility, capital/bridge disbursements per mile of responsibility, maintenance disbursements per mile of responsibility, administrative disbursements per mile of responsibility and total disbursements per mile of responsibility. It ranks 49 th in urban interstate condition, 47 th in rural interstate condition and 45 th in urban interstate congestion. Its best rankings are for narrow rural primary pavement (tied for 1 st ) with no rural primary pavements reported as narrow, and fatality rate (7 th ). Very high unit costs relative to other states, in combination with heavy traffic, more than offset low accident rates and rural primary pavement condition. New Jersey s disbursements were reduced slightly between 2005 and 2006, and it made modest progress in reducing rural interstate condition, congestion, and bridge condition. However the percent of urban interstates in poor condition jumped sharply from 12.8 to 17.5 percent, over three times the national average.
44 17 TH ANNUAL HIGHWAY STUDY 37 Part 7 Individual State Results Alabama Alabama ranked 29 th in overall performance and cost-effectiveness. In last year s rankings, Alabama ranked 43 rd overall. Alabama is 29 th in urban interstate congestion, with percent congested. The state ranks 39 th in rural interstate condition and 39 th in urban interstate condition. Alabama ranks 28 th in deficient bridges percent of the state s bridges are deemed structurally deficient or functionally obsolete. Alabama is 40 th in the nation in fatality rates per 100 million vehicle miles traveled. Alaska Alaska ranked 49 th in overall performance and cost-effectiveness. In last year s rankings, Alaska ranked 49 th overall. Alaska is 8 th in urban interstate congestion, with 7.25 percent congested. The state ranks 46 th in rural interstate condition and tied for 1 st in urban interstate condition. Alaska ranks 21 st in deficient bridges percent of the state s bridges are deemed structurally deficient or functionally obsolete. Alaska is 27 th in the nation in fatality rates per 100 million vehicle miles traveled. Arizona Arizona ranked 26 th in overall performance and cost-effectiveness. In last year s rankings, Arizona ranked 27 th overall. Arizona is 15 th in urban interstate congestion, with percent congested. The state tied for 1 st in rural interstate condition and tied for 1 st in urban interstate condition. Arizona ranks 2 nd in deficient bridges 5.54 percent of the state s bridges are deemed structurally deficient or functionally obsolete. Arizona is 48 th in the nation in fatality rates per 100 million vehicle miles traveled.
45 38 Reason Foundation Arkansas Arkansas ranked 27 th in overall performance and cost-effectiveness. In last year s rankings, Arkansas ranked 28 th overall. Arkansas is 41 st in urban interstate congestion, with percent congested. The state ranks 38 th in rural interstate condition and 36 th in urban interstate condition. Arkansas ranks 19 th in deficient bridges percent of the state s bridges are deemed structurally deficient or functionally obsolete. Arkansas is 41 st in the nation in fatality rates per 100 million vehicle miles traveled. California California ranked 44 th in overall performance and cost-effectiveness. In last year s rankings, California ranked 44 th overall. California is 50 th in urban interstate congestion, with percent congested. The state ranks 41 st in rural interstate condition and 48 th in urban interstate condition. California ranks 9 th in deficient bridges percent of the state s bridges are deemed structurally deficient or functionally obsolete. California is 20 th in the nation in fatality rates per 100 million vehicle miles traveled. Colorado Colorado ranked 31 st in overall performance and cost-effectiveness. In last year s rankings, Colorado ranked 29 th overall. Colorado is 19 th in urban interstate congestion, with percent congested. The state ranks 36 th in rural interstate condition and 34 th in urban interstate condition. Colorado ranks 4 th in deficient bridges percent of the state s bridges are deemed structurally deficient or functionally obsolete. Colorado is 10 th in the nation in fatality rates per 100 million vehicle miles traveled. Connecticut Connecticut ranked 35 th in overall performance and cost-effectiveness. In last year s rankings, Connecticut ranked 39 th overall. Connecticut is 43 rd in urban interstate congestion, with percent congested. The state tied for 1 st in rural interstate condition and 26 th in urban interstate condition. Connecticut ranks 43 rd in deficient bridges percent of the state s bridges are deemed structurally deficient or functionally obsolete. Connecticut is 4 th in the nation in fatality rates per 100 million vehicle miles traveled.
46 17 TH ANNUAL HIGHWAY STUDY 39 Delaware Delaware ranked 28 th in overall performance and cost-effectiveness. In last year s rankings, Delaware ranked 40 th overall. Delaware is 40 th in urban interstate congestion, with percent congested. The state ranks 32 nd in urban interstate condition. Delaware ranks 11 th in deficient bridges percent of the state s bridges are deemed structurally deficient or functionally obsolete. Delaware is 31 st in the nation in fatality rates per 100 million vehicle miles traveled. Florida Florida ranked 41 st in overall performance and cost-effectiveness. In last year s rankings, Florida ranked 41 st overall. Florida is 39 th in urban interstate congestion, with percent congested. The state tied for 1 st in rural interstate condition and 9 th in urban interstate condition. Florida ranks 12 th in deficient bridges percent of the state s bridges are deemed structurally deficient or functionally obsolete. Florida is 35 th in the nation in fatality rates per 100 million vehicle miles traveled. Georgia Georgia ranked 10 th in overall performance and cost-effectiveness. In last year s rankings, Georgia ranked 6 th overall. Georgia is 36 th in urban interstate congestion, with percent congested. The state tied for 1 st in rural interstate condition and tied for 1 st in urban interstate condition. Georgia ranks 16 th in deficient bridges percent of the state s bridges are deemed structurally deficient or functionally obsolete. Georgia is 28 th in the nation in fatality rates per 100 million vehicle miles traveled. Hawaii Hawaii ranked 47 th in overall performance and cost-effectiveness. In last year s rankings, Hawaii ranked 46 th overall. Hawaii is 17 th in urban interstate congestion, with percent congested. The state tied for 1 st in rural interstate condition and 50 th in urban interstate condition. Hawaii ranks 48 th in deficient bridges percent of the state s bridges are deemed structurally deficient or functionally obsolete. Hawaii is 30 th in the nation in fatality rates per 100 million vehicle miles traveled.
47 40 Reason Foundation Idaho Idaho ranked 14 th in overall performance and cost-effectiveness. In last year s rankings, Idaho ranked 10 th overall. Idaho is 14 th in urban interstate congestion, with percent congested. The state ranks 24 th in rural interstate condition and 41 st in urban interstate condition. Idaho ranks 14 th in deficient bridges percent of the state s bridges are deemed structurally deficient or functionally obsolete. Idaho is 36 th in the nation in fatality rates per 100 million vehicle miles traveled. Illinois Illinois ranked 34 th in overall performance and cost-effectiveness. In last year s rankings, Illinois ranked 33 rd overall. Illinois is 21 st in urban interstate congestion, with percent congested. The state tied for 1 st in rural interstate condition and 31 st in urban interstate condition. Illinois ranks 10 th in deficient bridges percent of the state s bridges are deemed structurally deficient or functionally obsolete. Illinois is 15 th in the nation in fatality rates per 100 million vehicle miles traveled. Indiana Indiana ranked 15 th in overall performance and cost-effectiveness. In last year s rankings, Indiana ranked 14 th overall. Indiana is 11 th in urban interstate congestion, with percent congested. The state tied for 1 st in rural interstate condition and 17 th in urban interstate condition. Indiana ranks 20 th in deficient bridges percent of the state s bridges are deemed structurally deficient or functionally obsolete. Indiana is 19 th in the nation in fatality rates per 100 million vehicle miles traveled. Iowa Iowa ranked 32 nd in overall performance and cost-effectiveness. In last year s rankings, Iowa ranked 35 th overall. Iowa is 20 th in urban interstate congestion, with percent congested. The state ranks 32 nd in rural interstate condition and 47 th in urban interstate condition. Iowa ranks 34 th in deficient bridges percent of the state s bridges are deemed structurally deficient or functionally obsolete. Iowa is 23 rd in the nation in fatality rates per 100 million vehicle miles traveled.
48 17 TH ANNUAL HIGHWAY STUDY 41 Kansas Kansas ranked 5 th in overall performance and cost-effectiveness. In last year s rankings, Kansas ranked 3 rd overall. Kansas is 10 th in urban interstate congestion, with percent congested. The state tied for 1 st in rural interstate condition and tied for 1 st in urban interstate condition. Kansas ranks 18 th in deficient bridges percent of the state s bridges are deemed structurally deficient or functionally obsolete. Kansas is 32 nd in the nation in fatality rates per 100 million vehicle miles traveled. Kentucky Kentucky ranked 9 th in overall performance and cost-effectiveness. In last year s rankings, Kentucky ranked 12 th overall. Kentucky is 46 th in urban interstate congestion, with percent congested. The state tied for 1 st in rural interstate condition and 14 th in urban interstate condition. Kentucky ranks 36 th in deficient bridges percent of the state s bridges are deemed structurally deficient or functionally obsolete. Kentucky is 38 th in the nation in fatality rates per 100 million vehicle miles traveled. Louisiana Louisiana ranked 40 th in overall performance and cost-effectiveness. In last year s rankings, Louisiana ranked 30 th overall. Louisiana is 32 nd in urban interstate congestion, with percent congested. The state ranks 44 th in rural interstate condition and 42 nd in urban interstate condition. Louisiana ranks 37 th in deficient bridges percent of the state s bridges are deemed structurally deficient or functionally obsolete. Louisiana is 49 th in the nation in fatality rates per 100 million vehicle miles traveled. Maine Maine ranked 22 nd in overall performance and cost-effectiveness. In last year s rankings, Maine ranked 23 rd overall. Maine is 5 th in urban interstate congestion, with 2.99 percent congested. The state ranks 23 rd in rural interstate condition and 23 rd in urban interstate condition. Maine ranks 38 th in deficient bridges percent of the state s bridges are deemed structurally deficient or functionally obsolete. Maine is 18 th in the nation in fatality rates per 100 million vehicle miles traveled.
49 42 Reason Foundation Maryland Maryland ranked 37 th in overall performance and cost-effectiveness. In last year s rankings, Maryland ranked 38 th overall. Maryland is 47 th in urban interstate congestion, with percent congested. The state ranks 25 th in rural interstate condition and 37 th in urban interstate condition. Maryland ranks 33 rd in deficient bridges percent of the state s bridges are deemed structurally deficient or functionally obsolete. Maryland is 14 th in the nation in fatality rates per 100 million vehicle miles traveled. Massachusetts Massachusetts ranked 43 rd in overall performance and cost-effectiveness. In last year s rankings, Massachusetts ranked 45 th overall. Massachusetts is 25 th in urban interstate congestion, with percent congested. The state tied for 1 st in rural interstate condition and 11 th in urban interstate condition. Massachusetts ranks 45 th in deficient bridges percent of the state s bridges are deemed structurally deficient or functionally obsolete. Massachusetts is 1 st in the nation in fatality rates per 100 million vehicle miles traveled. Michigan Michigan ranked 42 nd in overall performance and cost-effectiveness. In last year s rankings, Michigan ranked 42 nd overall. Michigan is 26 th in urban interstate congestion, with percent congested. The state ranks 48 th in rural interstate condition and 38 th in urban interstate condition. Michigan ranks 31 st in deficient bridges percent of the state s bridges are deemed structurally deficient or functionally obsolete. Michigan is 8 th in the nation in fatality rates per 100 million vehicle miles traveled. Minnesota Minnesota ranked 18 th in overall performance and cost-effectiveness. In last year s rankings, Minnesota ranked 13 th overall. Minnesota is 49 th in urban interstate congestion, with percent congested. The state ranks 33 rd in rural interstate condition and 12 th in urban interstate condition. Minnesota ranks 5 th in deficient bridges 13 percent of the state s bridges are deemed structurally deficient or functionally obsolete. Minnesota is 2 nd in the nation in fatality rates per 100 million vehicle miles traveled.
50 17 TH ANNUAL HIGHWAY STUDY 43 Mississippi Mississippi ranked 38 th in overall performance and cost-effectiveness. In last year s rankings, Mississippi ranked 25 th overall. Mississippi is 16 th in urban interstate congestion, with percent congested. The state ranks 43 rd in rural interstate condition and 35 th in urban interstate condition. Mississippi ranks 30 th in deficient bridges percent of the state s bridges are deemed structurally deficient or functionally obsolete. Mississippi is 47 th in the nation in fatality rates per 100 million vehicle miles traveled. Missouri Missouri ranked 13 th in overall performance and cost-effectiveness. In last year s rankings, Missouri ranked 17 th overall. Missouri is 38 th in urban interstate congestion, with percent congested. The state tied for 1 st in rural interstate condition and 22 nd in urban interstate condition. Missouri ranks 40 th in deficient bridges percent of the state s bridges are deemed structurally deficient or functionally obsolete. Missouri is 33 rd in the nation in fatality rates per 100 million vehicle miles traveled. Montana Montana ranked 2 nd in overall performance and cost-effectiveness. In last year s rankings, Montana ranked 5 th overall. Montana tied for 1 st in urban interstate congestion, with 0 percent congested. The state ranks 26 th in rural interstate condition and 30 th in urban interstate condition. Montana ranks 15 th in deficient bridges percent of the state s bridges are deemed structurally deficient or functionally obsolete. Montana is 50 th in the nation in fatality rates per 100 million vehicle miles traveled. Nebraska Nebraska ranked 8 th in overall performance and cost-effectiveness. In last year s rankings, Nebraska ranked 19 th overall. Nebraska is 12 th in urban interstate congestion, with percent congested. The state tied for 1 st in rural interstate condition and 40 th in urban interstate condition. Nebraska ranks 27 th in deficient bridges percent of the state s bridges are deemed structurally deficient or functionally obsolete. Nebraska is 22 nd in the nation in fatality rates per 100 million vehicle miles traveled.
51 44 Reason Foundation Nevada Nevada ranked 20 th in overall performance and cost-effectiveness. In last year s rankings, Nevada ranked 9 th overall. Nevada is 37 th in urban interstate congestion, with percent congested. The state tied for 1 st in rural interstate condition and 16 th in urban interstate condition. Nevada ranks 1 st in deficient bridges 3.92 percent of the state s bridges are deemed structurally deficient or functionally obsolete. Nevada is 43 rd in the nation in fatality rates per 100 million vehicle miles traveled. New Hampshire New Hampshire ranked 46 th in overall performance and cost-effectiveness. In last year s rankings, New Hampshire ranked 34 th overall. New Hampshire is 23 rd in urban interstate congestion, with percent congested. The state ranks 49 th in rural interstate condition and 46 th in urban interstate condition. New Hampshire ranks 39 th in deficient bridges percent of the state s bridges are deemed structurally deficient or functionally obsolete. New Hampshire is 3 rd in the nation in fatality rates per 100 million vehicle miles traveled. New Jersey New Jersey ranked 50 th in overall performance and cost-effectiveness. In last year s rankings, New Jersey ranked 50 th overall. New Jersey is 45 th in urban interstate congestion, with percent congested. The state ranks 47 th in rural interstate condition and 49 th in urban interstate condition. New Jersey ranks 35 th in deficient bridges percent of the state s bridges are deemed structurally deficient or functionally obsolete. New Jersey is 7 th in the nation in fatality rates per 100 million vehicle miles traveled. New Mexico New Mexico ranked 3 rd in overall performance and cost-effectiveness. In last year s rankings, New Mexico ranked 4 th overall. New Mexico is 9 th in urban interstate congestion, with percent congested. The state tied for 1 st in rural interstate condition and 21 st in urban interstate condition. New Mexico ranks 8 th in deficient bridges percent of the state s bridges are deemed structurally deficient or functionally obsolete. New Mexico is 42 nd in the nation in fatality rates per 100 million vehicle miles traveled.
52 17 TH ANNUAL HIGHWAY STUDY 45 New York New York ranked 45 th in overall performance and cost-effectiveness. In last year s rankings, New York ranked 48 th overall. New York is 35 th in urban interstate congestion, with percent congested. The state ranks 45 th in rural interstate condition and 44 th in urban interstate condition. New York ranks 47 th in deficient bridges percent of the state s bridges are deemed structurally deficient or functionally obsolete. New York is 6 th in the nation in fatality rates per 100 million vehicle miles traveled. North Carolina North Carolina ranked 23 rd in overall performance and cost-effectiveness. In last year s rankings, North Carolina ranked 31 st overall. North Carolina is 48 th in urban interstate congestion, with percent congested. The state ranks 40 th in rural interstate condition and 25 th in urban interstate condition. North Carolina ranks 41 st in deficient bridges percent of the state s bridges are deemed structurally deficient or functionally obsolete. North Carolina is 29 th in the nation in fatality rates per 100 million vehicle miles traveled. North Dakota North Dakota ranked 1 st in overall performance and cost-effectiveness. In last year s rankings, North Dakota ranked 1 st overall. North Dakota tied for 1 st in urban interstate congestion, with 0 percent congested. The state tied for 1 st in rural interstate condition and tied for 1 st in urban interstate condition. North Dakota ranks 25 th in deficient bridges percent of the state s bridges are deemed structurally deficient or functionally obsolete. North Dakota is 25 th in the nation in fatality rates per 100 million vehicle miles traveled. Ohio Ohio ranked 17 th in overall performance and cost-effectiveness. In last year s rankings, Ohio ranked 16 th overall. Ohio is 44 th in urban interstate congestion, with percent congested. The state tied for 1 st in rural interstate condition and 13 th in urban interstate condition. Ohio ranks 23 rd in deficient bridges percent of the state s bridges are deemed structurally deficient or functionally obsolete. Ohio is 12 th in the nation in fatality rates per 100 million vehicle miles traveled.
53 46 Reason Foundation Oklahoma Oklahoma ranked 33 rd in overall performance and cost-effectiveness. In last year s rankings, Oklahoma ranked 24 th overall. Oklahoma is 13 th in urban interstate congestion, with percent congested. The state ranks 28 th in rural interstate condition and 43 rd in urban interstate condition. Oklahoma ranks 42 nd in deficient bridges percent of the state s bridges are deemed structurally deficient or functionally obsolete. Oklahoma is 34 th in the nation in fatality rates per 100 million vehicle miles traveled. Oregon Oregon ranked 11 th in overall performance and cost-effectiveness. In last year s rankings, Oregon ranked 8 th overall. Oregon is 28 th in urban interstate congestion, with percent congested. The state tied for 1 st in rural interstate condition and tied for 1 st in urban interstate condition. Oregon ranks 26 th in deficient bridges percent of the state s bridges are deemed structurally deficient or functionally obsolete. Oregon is 21 st in the nation in fatality rates per 100 million vehicle miles traveled. Pennsylvania Pennsylvania ranked 36 th in overall performance and cost-effectiveness. In last year s rankings, Pennsylvania ranked 36 th overall. Pennsylvania is 18 th in urban interstate congestion, with percent congested. The state ranks 27 th in rural interstate condition and 24 th in urban interstate condition. Pennsylvania ranks 49 th in deficient bridges percent of the state s bridges are deemed structurally deficient or functionally obsolete. Pennsylvania is 24 th in the nation in fatality rates per 100 million vehicle miles traveled. Rhode Island Rhode Island ranked 48 th in overall performance and cost-effectiveness. In last year s rankings, Rhode Island ranked 47 th overall. Rhode Island is 42 nd in urban interstate congestion, with 62 percent congested. The state tied for 1 st in rural interstate condition and tied for 1 st in urban interstate condition. Rhode Island ranks 50 th in deficient bridges percent of the state s bridges are deemed structurally deficient or functionally obsolete. Rhode Island is 5 th in the nation in fatality rates per 100 million vehicle miles traveled.
54 17 TH ANNUAL HIGHWAY STUDY 47 South Carolina South Carolina ranked 6 th in overall performance and cost-effectiveness. In last year s rankings, South Carolina ranked 2 nd overall. South Carolina is 33 rd in urban interstate congestion, with 50 percent congested. The state ranks 34 th in rural interstate condition and 10 th in urban interstate condition. South Carolina ranks 24 th in deficient bridges percent of the state s bridges are deemed structurally deficient or functionally obsolete. South Carolina is 44 th in the nation in fatality rates per 100 million vehicle miles. South Dakota South Dakota ranked 7 th in overall performance and cost-effectiveness. In last year s rankings, South Dakota ranked 11 th overall. South Dakota is 4 th in urban interstate congestion, with 1.45 percent congested. The state tied for 1 st in rural interstate condition and 15 th in urban interstate condition. South Dakota ranks 29 th in deficient bridges percent of the state s bridges are deemed structurally deficient or functionally obsolete. South Dakota is 46 th in the nation in fatality rates per 100 million vehicle miles traveled. Tennessee Tennessee ranked 19 th in overall performance and cost-effectiveness. In last year s rankings, Tennessee ranked 20 th overall. Tennessee is 30 th in urban interstate congestion, with percent congested. The state tied for 1 st in rural interstate condition and 18 th in urban interstate condition. Tennessee ranks 13 th in deficient bridges percent of the state s bridges are deemed structurally deficient or functionally obsolete. Tennessee is 37 th in the nation in fatality rates per 100 million vehicle miles traveled. Texas Texas ranked 12 th in overall performance and cost-effectiveness. In last year s rankings, Texas ranked 15 th overall. Texas is 34 th in urban interstate congestion, with percent congested. The state tied for 1 st in rural interstate condition and 19 th in urban interstate condition. Texas ranks 17 th in deficient bridges percent of the state s bridges are deemed structurally deficient or functionally obsolete. Texas is 26 th in the nation in fatality rates per 100 million vehicle miles traveled.
55 48 Reason Foundation Utah Utah ranked 25 th in overall performance and cost-effectiveness. In last year s rankings, Utah ranked 21 st overall. Utah is 31 st in urban interstate congestion, with percent congested. The state ranks 31 st in rural interstate condition and 20 th in urban interstate condition. Utah ranks 7 th in deficient bridges percent of the state s bridges are deemed structurally deficient or functionally obsolete. Utah is 11 th in the nation in fatality rates per 100 million vehicle miles traveled. Vermont Vermont ranked 30 th in overall performance and cost-effectiveness. In last year s rankings, Vermont ranked 37 th overall. Vermont is 7 th in urban interstate congestion, with 5 percent congested. The state ranks 30 th in rural interstate condition and tied for 1 st in urban interstate condition. Vermont ranks 44 th in deficient bridges percent of the state s bridges are deemed structurally deficient or functionally obsolete. Vermont is 9 th in the nation in fatality rates per 100 million vehicle miles traveled. Virginia Virginia ranked 16 th in overall performance and cost-effectiveness. In last year s rankings, Virginia ranked 18 th overall. Virginia is 22 nd in urban interstate congestion, with percent congested. The state tied for 1 st in rural interstate condition and 28 th in urban interstate condition. Virginia ranks 22 nd in deficient bridges percent of the state s bridges are deemed structurally deficient or functionally obsolete. Virginia is 16 th in the nation in fatality rates per 100 million vehicle miles traveled. Washington Washington ranked 39 th in overall performance and cost-effectiveness. In last year s rankings, Washington ranked 32 nd overall. Washington is 24 th in urban interstate congestion, with percent congested. The state ranks 42 nd in rural interstate condition and 45 th in urban interstate condition. Washington ranks 32 nd in deficient bridges percent of the state s bridges are deemed structurally deficient or functionally obsolete. Washington is 13 th in the nation in fatality rates per 100 million vehicle miles traveled.
56 17 TH ANNUAL HIGHWAY STUDY 49 West Virginia West Virginia ranked 24 th in overall performance and cost-effectiveness. In last year s rankings, West Virginia ranked 26 th overall. West Virginia is 6 th in urban interstate congestion, with 4.49 percent congested. The state ranks 35 th in rural interstate condition and 27 th in urban interstate condition. West Virginia ranks 46 th in deficient bridges percent of the state s bridges are deemed structurally deficient or functionally obsolete. West Virginia is 39 th in the nation in fatality rates per 100 million vehicle miles traveled. Wisconsin Wisconsin ranked 21 st in overall performance and cost-effectiveness. In last year s rankings, Wisconsin ranked 22 nd overall. Wisconsin is 27 th in urban interstate congestion, with percent congested. The state ranks 37 th in rural interstate condition and 29 th in urban interstate condition. Wisconsin ranks 6 th in deficient bridges percent of the state s bridges are deemed structurally deficient or functionally obsolete. Wisconsin is 17 th in the nation in fatality rates per 100 million vehicle miles traveled. Wyoming Wyoming ranked 4 th in overall performance and cost-effectiveness. In last year s rankings, Wyoming ranked 7 th overall. Wyoming tied for 1 st in urban interstate congestion, with 0 percent congested. The state ranks 29 th in rural interstate condition and 33 rd in urban interstate condition. Wyoming ranks 3 rd in deficient bridges percent of the state s bridges are deemed structurally deficient or functionally obsolete. Wyoming is 45 th in the nation in fatality rates per 100 million vehicle miles traveled.
57 50 Reason Foundation Part 8 Technical Notes T his brief technical section summarizes the definitions and sources of the data used in this assessment. The discussion is based on the assumption that comparative cost-effectiveness requires not just data on system condition or performance, but also on what it costs to operate and improve the system. Mileage by Ownership Since it is generally easier to achieve high performance with a larger budget than with a smaller one, measures of resources should reflect the different sizes of the state-owned systems. In this study, the mileage of state-owned roads is used as the basic metric for bringing the states to a common basis. In each state, the state-owned highway systems consist of the State Highway System and other systems, such as toll roads or similar, state-owned smaller systems in state parks, universities, prisons, medical facilities, etc. Each state s responsibility for roads varies. In some, for instance North Carolina, the state is responsible for almost all roads outside of municipalities, while in others, such as New Jersey, the state is responsible for primarily the major multiple-lane roads. In addition, other features, such as bridges, vary with some states having many and others few. Since several agencies are included, this report should not be viewed as a cost-effectiveness study of the state highway departments. Instead, it should be viewed as an assessment of how the state, as a whole, is managing the state-owned roads. The source of this data is statistics on State Highway Agency mileage (rural and urban), and other rural state-owned mileage, as reported by each state to the Federal Highway Administration, in Highway Statistics, 2006, Table HM-10. (
58 17 TH ANNUAL HIGHWAY STUDY 51 Receipts for State-Administered Highways Receipts for state-administered highways include all revenues from a variety of sources, including highway user revenues, general fund appropriations, other state fees, bond issuance and debt service, federal funds, and funds from local governments. The source of the data is statistics on revenues used for state-administered highways, as reported by the states in Highway Statistics, 2006, Table SF-3, ( Revenues include those of all state-administered roads, not just the state highway system. (Indiana did not report for 2006, so FHWA used 2005). To bring each state to a common base, total receipts are divided by total mileage under state control. This produces receipts per mile of responsibility a close measure of the relative resources each state has to work with per mile of responsibility. All other things being equal, states with higher resources per mile of responsibility should have a better performing system. Since large per-mile revenues are also a burden on taxpayers, the states are ranked inversely by this measure, with the highest per-mile receipts being rated lowest. Capital and Bridge Disbursements Disbursements for state-administered highways are of several types: capital and bridge work, maintenance and highway services, administration, research and planning, law enforcement and safety, interest (on bond payments), and bond retirement. Capital actions are those intended to reconstruct or improve the system, whereas maintenance actions are those intended to preserve or repair the system, but not improve it. However, the definitions of these categories vary somewhat between the states, particularly on capital and maintenance actions. Most states use contracts with the private sector to build and reconstruct the system, although in some cases they may also use their own workforce for some major jobs. Most states also conduct maintenance largely with agency forces and the work is generally light in character, but some also conduct some major repairs such as thick overlays using contracted forces from the private sector. The source of data for disbursements for capital and bridges is Highway Statistics, 2006, Federal Highway Administration, Table SF-4. ( (Indiana and Colorado did not report 2006 numbers, so FHWA used 2005 numbers). These disbursements are divided by mileage under state control to arrive at a relative measure of capital expenditure per unit of responsibility. Since large per-mile capital and bridge expenditures are also a burden on taxpayers, the states are ranked inversely by this measure, with the highest per-mile expenditures being rated lowest.
59 52 Reason Foundation Maintenance Disbursements The source for maintenance disbursements is also Table SF-4, Highway Statistics 2006, Federal Highway Administration. ( (Indiana and Colorado did not report 2006 numbers, so FHWA used 2005). These maintenance disbursements are divided by mileage under state control to arrive at a relative measure of maintenance activity per unit of responsibility. Since large per-mile maintenance expenditures are also a burden on taxpayers, the states are ranked inversely by this measure, with the highest per-mile expenditures being rated lowest. Administrative Disbursements Administrative disbursements are intended to include all non-project-specific disbursements, and typically include most main-office and regional-office costs, research, planning and similar activities. Sometimes this category also includes bond restructurings and other non-project-specific financial actions. As a result, administrative disbursement can sometimes vary widely from year to year. The source for administrative disbursements is also Table SF-4, Highway Statistics 2006, Federal Highway Administration. ( (Indiana and Colorado did not report 2006 numbers, so FHWA used 2005). These disbursements are divided by mileage under state control to arrive at a relative measure of administrative costs per unit of responsibility. Since large per-mile administrative expenditures are also a burden on taxpayers, the states are ranked inversely by this measure, with the highest per-mile expenditures being rated lowest. Total Disbursements Total disbursements represent total state outlays for state-administered roads, and include several categories not detailed above. Usually, states disburse about 2 to 3 percent less funds than they take in, the difference being due to timing differences and delays in getting projects completed. However, states sometimes bring in revenues that are not immediately expended, such as major bond sales, which show up as major increases in receipts without a similar increase in disbursements. And sometimes, later-year disbursements can be higher in receipts as states move money into projects without increasing revenues. The source for total disbursements is also Table SF-4, Highway Statistics 2006, Federal Highway Administration. ( (Indiana and Colorado did not report 2006 numbers, so FHWA used 2005 numbers). These disbursements are divided by mileage under state control to arrive at a relative measure of administrative costs per unit of
60 17 TH ANNUAL HIGHWAY STUDY 53 responsibility. Since large per-mile total expenditures are also a burden on taxpayers, the states are ranked inversely by this measure. Rural Interstate Poor-Condition Mileage Perhaps no measure is more fundamental to road performance than a measure of road condition. There are numerous ways of defining road condition, but the one used for the U.S. higher-road system is the International Roughness Index (IRI), essentially a measure of surface bumpiness in inches of vertical deviation per mile of length. The states use a variety of procedures in gathering this data, but most use mechanical or laser equipment driven over the road system. They often supplement this data with detailed information on road distress features, but this information is not generally used in federal reporting. A few states, however, still use visual ratings as the basis of their reports. Higher roughness index scores mean a worse condition. By convention, interstate sections with roughness of greater than 170 inches per mile of roughness (about three inches of vertical variation per 100 feet of road) are classified as poor in most reports. Roads classified as poor typically have visible bumps and create noticeable annoying bumpiness in vehicles. By comparison, sections with less than 60 inches of roughness per mile (about one inch per 100 feet) would be classified as excellent. These measures also vary by section length: long smooth sections (greater than one mile in length) tend to dampen out short rough ones, so if a state has long sections in its database it can report very little rough mileage as a percent of the system, even though it has some. The source of road roughness data is also Highway Statistics 2006, Federal Highway Administration, Table HM-64. ( This table shows miles by roughness for several functional classes for each state. We use the mileage at IRI greater than 170 inches per mile. This mileage is then converted into a percent to account for different sizes of rural interstate systems in each state. (Note: Delaware has no rural interstate and is not rated on this measure.) Rural Other Principal Arterial Poor-Condition Mileage Rural other principal arterials are the major inter-city connectors, off the interstate system, connecting regions of states. They can be U.S.-numbered and state-numbered roads, and sometimes toll roads or parkways. This system would generally be a top priority of most state highway agencies because of its importance to the economic wellbeing of the state. The roughness measure used for rural other principal arterials is also the International Roughness Index (IRI). By convention, however, road sections with greater than 220 inches per mile of roughness are classified as poor in most reports. The cutoff is higher than for interstate since speeds on these roads are typically lower and roughness not as noticeable.
61 54 Reason Foundation The source of this road roughness data is also Highway Statistics 2006, Federal Highway Administration, Table HM-64. ( We use the mileage at IRI greater than 220 inches per mile. This mileage is then converted into a percent to account for different sizes of rural other principal arterial systems in each state. Urban Interstate Poor-Condition Mileage The measure used for urban interstate road condition is also the International Roughness Index (IRI), with the same cutoff 170 inches per mile or higher for poor mileage. The source of road roughness data is also Highway Statistics 2006, Federal Highway Administration, Table HM-64. ( This table shows miles by roughness for several functional classes for each state. We use the mileage at IRI greater than 170 inches per mile. This mileage is then converted into a percent, to account for different sizes of urban interstate systems in each state. Urban Interstate Congestion Urban interstate congestion is measured as the ratio of traffic volume to the maximum carrying capacity of each road section. Road capacity is limited by driver skill, traffic, and geometric characteristics. For most modern interstates, carrying capacity is about 2,400 vehicles per lane per hour, or one vehicle each 1.5 second passing by a roadside observer. Congestion (the delay caused by the presence of other vehicles) builds up incrementally as vehicles compete for road space and have to slow to avoid each other and drive safely. Maximum flow (and maximum delay) at capacity, defined as 2,400 vehicles per lane per hour, occurs not at high speeds but at about mph. However, even at lower flow rates, some congestion occurs. The source of urban interstate congestion data is Table HM 61, Highway Statistics 2006, Federal Highway Administration ( Data is shown as miles of road, in each state, with various volume/capacity ratios. We use 0.70 as the cutoff for congested ; although other studies sometimes use 0.80 and 0.95 as cutoffs, the use of these higher cutoffs would result in modest congestion not being counted, a distinct advantage for rural states. Of course, traffic volumes have generally been rising over time, increasing congestion. But since driver skills and road geometrics have also been improving over time, road capacity is also rising, although not as rapidly as traffic. The definition of maximum flow was 2,000 vehicles per lane per hour until 1994, then 2,200 in 2000, and now is 2,400 vehicles per lane per hour. For this reason, comparisons of congestion trends before about 2001 should be cautious.
62 17 TH ANNUAL HIGHWAY STUDY 55 Fatality Rates Road safety is an undisputed important measure of system performance, and fatality rates are a key measure of safety. The overall state fatality rate has long been seen as a measure of state performance in road safety. The source of the data for fatality rates is from two tables in Highway Statistics. Table FI-20, Highway Statistics 2006, Federal Highway Administration ( hs06/xls/fi20.xls) provides a count of fatalities by state and functional class for Table HM 81 ( provides an estimate of daily vehiclemiles of travel, for the state highway system, by state. At the time of this analysis, an estimate of total state VMT was not available, so the daily SHA VMT for 2005 and 2006 was used to estimate total 2006 VMT. Deficient Bridges As a result of several major bridges disasters in the 1960s and 1970s, states are required to inspect bridges biennially (every year if rated structurally deficient) and maintain uniform records of inspections. This data source, called the National Bridge Inventory, is the source of information on deficient bridges. Bridges are classified as deficient if their structural elements score poorly, or if they are no longer functionally adequate for the road system. Our source for deficient bridges is an annual summary of bridges deficiencies prepared by Better Roads, a trade publication. Each year, Better Roads asks the state highway agencies to summarize their bridge inventories. The data, published in November of each year, generally report the inventory as of September/October, which represents bridges in various stages of inspection. For our purposes we consider the Better Roads data to be representative of about a year earlier, 2006, since some would have been inspected in late 2007 and others as long ago as Narrow Lanes on Rural Other Principal Arterials Narrow lanes on rural roads are a surrogate measure for system quality since no data on other (perhaps more accurate) features, such as sight distance, shoulder width, or pavement edge dropoffs, are readily available nationwide. The standard lane width for most major rural roads is 12 feet, and it is unlikely that a major rural road would be upgraded without widening its lanes to that standard. The data source for our measure is also Highway Statistics 2006, Table HM-52, Federal Highway Administration ( This table shows the mileage of roads by functional class, in various lane-width categories, by state. We use the
63 56 Reason Foundation percentage of mileage on the rural other principal arterial system with less than 12-ft lanes, to adjust for different system lengths in different states. Overall Ratings Overall ratings for each state are developed in several steps. First, the relative performance of each state on each of the 12 performance measures is determined by computing each state s performance ratio. This is defined as the ratio of each state s measure to the weighted U.S. mean for the measure. The mathematical structure is as follows: M is = Measure i for state s (e.g., percent of rural interstates in poor condition) N = Number of measures (12; 11 for Delaware, which has no rural interstate) R is = Performance Ratio for State s, measure i. = M is / M, where M is the aggregate (weighted) mean of M over the 50 states. For the five financial measures, these ratios are adjusted again for the average width of each state s state-owned system, on the assumption that states with wider roads should be given some credit for the extra per-mile cost of that. R is = R is (L/L s ) Then, all 12 ratios (11 ratios for Delaware) are averaged: Grand Performance Ratio state = ( N is)/12 er mod This method essentially treats each of the 12 measures as equally important.
64 17 TH ANNUAL HIGHWAY STUDY 57 About the Authors D avid T. Hartgen is a senior fellow at Reason Foundation and emeritus professor of Transportation Studies at the University of North Carolina at Charlotte, where he established the Center for Interdisciplinary Transportation Studies and now conducts research in transportation policy. Before coming to Charlotte, he was at the New York State Department of Transportation and the Federal Highway Administration He is the author of about 335 papers and reports on transportation policy and planning, is U.S. editor of the international journal, Transportation, and is active in professional organizations, particularly the Transportation Research Board. He holds engineering degrees from Duke University and Northwestern University, has taught at SUNY Albany, Union University, Syracuse University, and lectures widely. His recent studies of congestion for Reason Foundation (at and transit and congestion for the John Locke Foundation (at have attracted wide national attention. He can be contacted at dthartge@uncc.edu, or by telephone at Ravi K. Karanam is a System-On-Chip Verification Engineer at Qualcomm Incorporated. He graduated from the University of North Carolina at Charlotte with an MS in Electrical Engineering. His primary areas of interest are in the design and verification of system-on-chips for mobile computing.
65 58 Reason Foundation Related Reason Studies David T. Hartgen, Ph.D., P.E., and Ravi K. Karanam, 16th Annual Report on the Performance of State Highway Systems ( ), Reason Foundation Policy Study No.360, June 2007, Peter Samuel, Leasing State Toll Roads: Frequently Asked Questions, Reason Foundation Policy Brief No.60, March 2007, Leonard C. Gilroy, Robert W. Poole, Jr., Peter Samuel, and Geoffrey Segal, Building New Roads Through Public-Private Partnerships: Frequently Asked Questions, Reason Foundation Policy Brief No.58, March 2007, Peter Samuel, Innovative Roadway Design: Making Highways More Likeable, Reason Foundation Policy Study No.348, September 2006, David T. Hartgen, Ph.D., P.E., and M. Gregory Fields, Building Roads to Reduce Traffic Congestion in America 's Cities: How Much and at What Cost?, Policy Study No. 346, August 2006


66 Reason Foundation 3415 S. Sepulveda Blvd., Suite 400 Los Angeles, CA / / (fax)
Are Highways Crumbling? State Performance Summaries,
 Policy Summary 407 February 2013 Are Highways Crumbling? State Performance Summaries, 1989 2008 by David T. Hartgen, Ph.D., P.E., M. Gregory Fields and Elizabeth San José Project Director: Adrian T. Moore,
Traffic Safety Facts. State Traffic Data Data. Overview
 Traffic Safety Facts 2015 Data June 2017 DOT HS 812 412 State Traffic Data Key Findings Traffic fatalities increased by 7 percent from 2014 to 2015 (32,744 to 35,092) for the United States. The fatality
Are Highways Crumbling? State and U.S. Highway Performance Trends,
 Policy Study 407 February 2013 Are Highways Crumbling? State and U.S. Highway Performance Trends, 1989 2008 by David T. Hartgen, Ph.D., P.E., M. Gregory Fields and Elizabeth San José Project Director:
States. Postal Abbreviations LEARN THE. AND. by Joy A. Miller
 1 States LEARN THE AND Postal Abbreviations by Joy A. Miller http://fivejs.com Learn the States and Postal Abbreviations Copyright 2009 Published by Joy A. Miller http://fivejs.com All rights reserved.
Target Shooting by Hunters and Their Use of Shooting Ranges: 1975, 1991, and 2011
 U.S. Fish & Wildlife Service Target Shooting by Hunters and Their Use of Shooting Ranges: 1975, 1991, and 2011 Addendum to the 2011 National Survey of Fishing, Hunting, and Wildlife-Associated Recreation
USA TRIATHLON MEMBERSHIP REPORT TABLE OF CONTENTS
 USA TRIATHLON MEMBERSHIP REPORT This report has been prepared by the Membership Services staff based on active memberships on December 31, 2015. Media requests can be addressed to communications@usatriathlon.org.
2016 River Use Statistics -by Steve Sullivan
 Grand Canyon River Office 2016 River Use Statistics -by Steve Sullivan Topics River Use Statistics Overview Commercial River Use Statistics Noncommercial River Use Statistics Noncommercial River Lottery
Understanding the Regional Divergence in Adult Mortality in the United States
 Understanding the Regional Divergence in Adult Mortality in the United States Andrew Fenelon, PhD University of Maryland, College Park American Life Expectancy 77 76 75 Life Expectancy in Years 74 73 72
TABLE C: STATE MANDATES AND FUNDING LEVELS
 TABLE C: STATE MANDATES AND FUNDING LEVELS Information was collected from the 2012-2013 State of the States in Gifted Education report. Empty cells indicate no response to the question Hatched cells indicate
A Comparison of Highway Construction Costs in the Midwest and Nationally
 A Comparison of Highway Construction Costs in the Midwest and Nationally March 20, 2018 Mary Craighead, AICP 1 INTRODUCTION State Departments of Transportation play a significant role in the construction
Conduent EDI Solutions, Inc. Eligibility Gateway 270/271 Payer Guide Medicaid
 Conduent EDI Solutions, Inc. Eligibility Gateway 270/271 Payer Guide Medicaid Version 4010 Technical Support: egateway@conduent.com May 10, 2017 2017 Conduent Business Services, LLC. All rights reserved.
Education Committee Economic Background and Issue Review
 Education Committee Economic Background and Issue Review Montpelier, Vermont January 22, 2014 Thomas E. Kavet State Economist and Principal Economic Advisor to the Vermont State Legislature Since 1996
2011 National Survey of Fishing, Hunting, and Wildlife-Associated Recreation
 U.S. Fish & Wildlife Service 2011 National Survey of Fishing, Hunting, and Wildlife-Associated Recreation State Overview Issued September 2012 Preliminary Estimates 2 2011 National Survey of Fishing, Hunting,
Xerox EDI Eligibility Gateway 270/271 Payer Guide
 Xerox EDI Eligibility Gateway 270/271 Payer Guide Medicaid Version 4010 Technical Support: egateway@xerox.com Updated March 25, 2016 2015 Xerox Corporation. All rights reserved. XEROX and XEROX and Design
U.S MINT STATE DUCKS SALE
 U.S. 2007-2014 MINT STATE DUCKS SALE POPULAR ISSUES FROM AROUND THE U.S. CHOOSE YOUR HOME STATE OR REGION. ALL VERY FINE, NEVER HINGED. ALABAMA AL 29-36 2007-14 Set of 8... 117.50 82.50 AL 29 2007 $5 Blue-winged
SECTION SEVEN. Characteristics of People with IDD and Staff in Large Public Residential Facilities
 SECTION SEVEN Characteristics of People with IDD and Staff in Large Public Residential Facilities FY Section 7: Characteristics of People with IDD and Staff in Large State-Operated IDD Facilities This
HANDICAP ACTIVE AND INACTIVE SEASON SCHEDULE
 HANDICAP ACTIVE AND INACTIVE SEASON SCHEDULE The authorized golf association having jurisdiction in an area is responsible for declaring the duration of any inactive season. Any non-member club of an authorized
Back in the Black. States Gambling Revenues Rose in Introduction Gambling revenues to states rose modestly in fiscal 2010, HIGHLIGHTS
 F I S C A L S T U D I E S WWW.ROCKINST.ORG JUNE 23, 2011 Back in the Black States Gambling Revenues Rose in 2010 Lucy Dadayan and Robert B. Ward HIGHLIGHTS State-local gambling revenues from lotteries,
SUMMARY MEMBERSHIP ANALYSIS FOR THE STATE OF. Trends of first-time 4 to 8 year-old male ice hockey players to
 SUMMARY MEMBERSHIP ANALYSIS FOR THE STATE OF Rhode Island Trends of first-time 4 to 8 year-old male ice hockey players 1997-98 to 27-8 p.2 -Background and Methodology p.3 -National Acquisition and Retention
SUMMARY MEMBERSHIP ANALYSIS FOR THE STATE OF. Trends of first-time 4 to 8 year-old male ice hockey players to
 SUMMARY MEMBERSHIP ANALYSIS FOR THE STATE OF New York Trends of first-time 4 to 8 year-old male ice hockey players 1997-98 to 27-8 p.2 -Background and Methodology p.3 -National Acquisition and Retention
SUMMARY MEMBERSHIP ANALYSIS FOR THE STATE OF. Trends of first-time 4 to 8 year-old male ice hockey players to
 SUMMARY MEMBERSHIP ANALYSIS FOR THE STATE OF New Mexico Trends of first-time 4 to 8 year-old male ice hockey players 1997-98 to 27-8 p.2 -Background and Methodology p.3 -National Acquisition and Retention
SEASON FINAL REGISTRATION REPORTS
 Materials Included: 2015-2016 SEASON FINAL REGISTRATION REPORTS 2014-15 & 2015-16 Comparison by Group 2 2015-16 USA Hockey Member Counts 3 2015-16 8 and Under Report 4 2015-16 Players & Girls/Women by
TABLE 3. Level of Activity in State Financial Assurance Funds 2017
 of of where of where Annual Approximate Amount Paid Annual and and total Alabama 752 28 78 47,792 47,462 2,810 2,810 59 $40.60 $568.00 $1.30 $10.30 $41.90 $578.30 $175,309 $163,492 2,519 1 Alaska* N/A
SUMMARY MEMBERSHIP ANALYSIS FOR THE STATE OF. New Hampshire. Trends of first-time 4 to 8 year-old male ice hockey players to
 SUMMARY MEMBERSHIP ANALYSIS FOR THE STATE OF New Hampshire Trends of first-time 4 to 8 year-old male ice hockey players 1997-98 to 27-8 p.2 -Background and Methodology p.3 -National Acquisition and Retention
The 2019 Economic Outlook Forum The Outlook for MS
 The 2019 Economic Outlook Forum The Outlook for MS February 2019 Mississippi University Research Center Mississippi Institutions of Higher Learning Darrin Webb, State Economist dwebb@mississippi.edu (601)432-6556
Gay Gilbert, Administrator Unemployment Insurance USDOL/ETA June 22, 2016
 Gay Gilbert, Administrator Unemployment Insurance USDOL/ETA June 22, 2016 Where is Our Program Today? Most Critical Challenges A Program in Transition Using our Valuable Resources What s Important for
THE FUTURE OF SALES TAX REVENUE
 THE FUTURE OF SALES TAX REVENUE Presented by Adam Fulton, Senior Economic Associate The Outlook for Sales Taxes State governments rely on state sales taxes for more than a fifth of their revenue Economic
For the First Time, a Smaller Jackpot
 F I S C A L S T U D I E S WWW.ROCKINST.ORG SEPTEMBER 21, 2009 For the First Time, a Smaller Jackpot Trends in State Revenues from Gambling Lucy Dadayan and Robert B. Ward HIGHLIGHTS State-local gambling
Zions Bank Municipal Conference Economic Overview August 13, 2015
 Zions Bank Municipal Conference Economic Overview August 13, 2015 Overview National Economic Conditions Utah Economic Conditions Utah is One of the Fastest Growing CA 0.9% States in the Country Percent
ECONOMIC IMP ACT REPORT 2018
 FIREARMS AND AMMUNITION INDUSTRY ECONOMIC IMP ACT REPORT 218 THE FIREARMS INDUSTRY TRADE ASSOCIATION NSSF.ORG Who is the National Shooting Sports Foundation? The National Shooting Sports Foundation (NSSF)
Federal Regulatory Update WTBA/WisDOT Contractor/Engineer Conference
 Federal Regulatory Update 2019 WTBA/WisDOT Contractor/Engineer Conference by Nick Goldstein ARTBA Vice President of Regulatory & Legal Issues January 17, 2019 How the Public Feels Regulations and Transportation
Occupant Protection Laws
 Occupant Protection s Alabama Alaska Arizona Under 1 yr. or
7. Ranking the States with the Greatest Energy Intensity and Residual Effect Reductions
 37 7. Ranking the States with the Greatest Energy Intensity and Residual Effect Reductions In this chapter, we report on the states that had the greatest reductions in energy intensity and residuals over
More of the Same; Or now for Something Completely Different?
 More of the Same; Or now for Something Completely Different? C2ER Place cover image here Richard Wobbekind Chief Economist and Associate Dean for Business and Government Relations June 14, 2017 Real GDP
 Alabama Alaska Arizona Under 1 yr. or
 TABLE 3. Level of Activity in State Financial Assurance Funds 2016
 TABLE 3. Level of Activity in Financial Assurance Funds 2016 have where have Annual Approximate Amount Paid Annual and and total closed average Annual Claims Alabama 3,186 60 71 45,335 44,928 2,745 2,745
Black Homicide Victimization in the Great Lakes States
 APRIL 2018 Victimization in the Great Lakes States An Analysis of 2015 Homicide Data WWW.VPC.ORG BLACK HOMICIDE VICTIMIZATION IN THE GREAT LAKES STATES VIOLENCE POLICY CENTER 1 COPYRIGHT AND ACKNOWLEDGMENTS
Occupant Protection Laws
 Alabama Alaska Arizona ; under 5 yrs. and 20 lbs. forward-facing ; 4-8 yrs.,
Legislative Economic Briefing
 Legislative Economic Briefing February 16, 2017 Mississippi University Research Center Mississippi Institutions of Higher Learning Darrin Webb, State Economist dwebb@mississippi.edu (601)432-6556 To subscribe
There are three major federal data sources that we evaluate in our Bicycle Friendly States ranking:
 Since the landmark Intermodal Surface Transportation Efficiency Act (ISTEA) created the Transportation Enhancements program in 1991 bicycle and pedestrian projects have been eligible for programmatic federal
Traffic Safety Facts 2007 Data
 Traffic Safety Facts 2007 Data Bicyclists and Other Cyclists DOT HS 810 986 Bicyclists and other cyclists include riders of two-wheel nonmotorized vehicles, tricycles, and unicycles powered solely by pedals.
Occupant Protection Laws
 Occupant rotection Laws tate Must Be in Child Restraint* Additional eat Belt Coverage* Who is Covered & Where rimary or econdary Alabama Under 6 yrs.** 6 until 15 yrs. 15+ yrs. in Alaska Under 4 yrs.**
MEDICAID EXPENDITURES FOR LONG-TERM SERVICES AND SUPPORTS: 2011 UPDATE
 RESEARCH PAPER MEDICAID EXPENDITURES FOR LONG-TERM SERVICES AND SUPPORTS: 2011 UPDATE STEVE EIKEN, KATE SREDL, BRIAN BURWELL, AND LISA GOLD THOMSON REUTERS 150 CAMBRIDGEPARK DRIVE CAMBRIDGE, MA 02140 OCTOBER
Population of Puerto Rico (Millions of people)
") Dr. Mario Marazzi-Santiago Instituto de Estadísticas Executive Director August 15, 2015 Population of Puerto Rico (Millions of people) 4.5 4 3.5 3 2.5 2 1.5 1 0.5 1950 1955 1960 1965 1970 1975 1980 1985
Dr. Mario Marazzi-Santiago Instituto de Estadísticas Executive Director August 15, 2015 Population of Puerto Rico (Millions of people) 4.5 4 3.5 3 2.5 2 1.5 1 0.5 1950 1955 1960 1965 1970 1975 1980 1985
Agricultural Weather Assessments World Agricultural Outlook Board
 Texas (8) Missouri (7) South Dakota (6) Kansas () Nebraska () North Dakota () Oklahoma () Kentucky (4) Montana (4) California (3) Minnesota (3) New York (3) Pennsylvania (3) Tennessee (3) Wisconsin (3)
Agricultural Weather Assessments World Agricultural Outlook Board
 Texas (8) Missouri (7) South Dakota (6) Kansas (5) Nebraska (5) North Dakota (5) Oklahoma (5) Kentucky (4) Montana (4) California (3) Minnesota (3) New York (3) Pennsylvania (3) Tennessee (3) Wisconsin
Regional Summit on GROWING STATE ECONOMIES Nashville, TN November 14, Global Entrepreneurship Monitor Research: Highlights. Abdul Ali, Ph.D.
 Regional Summit on GROWING STATE ECONOMIES Nashville, TN November 14, 2011 Global Entrepreneurship Monitor Research: Highlights Abdul Ali, Ph.D. 1 Babson College # 1 Entrepreneurship Undergraduate: 1995-2011
DOT HS November 2009 Geospatial Analysis of Rural Motor Vehicle Traffic Fatalities
 DOT HS 811 196 November 2009 Geospatial Analysis of Rural Motor Vehicle Traffic Fatalities This document is available to the public from the National Technical Information Service, Springfield, Virginia
2009 National Pharmacist Workforce Study. Visual Data
 2009 National Pharmacist Workforce Study Visual Data Figure 1.1: National Aggregate g Demand Index Values http://www.pharmacymanpower.com/ 5 4 3 4.28 4.07 Shortage Surplus 4.19 4.07 4.02 3.97 3.92 4.21
Catena Media analysis of how we expect sports betting to roll out across the United States of America.
 Catena Media analysis of how we expect sports betting to roll out across the United States of America. The impacts of this ruling on sports betting in the United States The state of New Jersey can now
Purpose of the Efficiency Program Industry By State and Region Appendices and Limitations of Data
 Purpose of the Efficiency Program Industry By State and Region Appendices and Limitations of Data CEE collaborates with the American Gas Association (AGA) to survey and collect data in the United States
CHAPTER 6. APPENDICES
 CHAPTER 6. APPENDICES Appendix 6.1. Summary of State Regulations Pertaining to Asian Carps. Some states prohibit or restrict the possession of certain species of Asian carps. State regulations pertaining
The Walking College: Building the Local Capacity of the National Walking Movement
 The Walking College: Building the Local Capacity of the National Walking Movement Ian Thomas, America Walks Faye Paige Edwards, GirlTrek Team Meeting of the National Physical Activity Society: October
Table B-8: U.S. Medical School MD-PhD Applications and Matriculants by School, In-State Status, and Sex,
 MD-PhD and Table B-8: U.S. Medical School MD-PhD and, In-State Status, and Sex, 2017-2018 1 AL Alabama 283 4.9 95.1 45.6 54.4 9 22.2 77.8 44.4 55.6 South Alabama 14 28.6 71.4 50.0 50.0 0 0.0 0.0 0.0 0.0
Legal Meaning of Flashing Don't Walk - Survey Question raised by Mark Luszcz, DE Distributed 4/5/16
 Legal Meaning of Flashing Don't Walk - Survey Question raised by Mark Luszcz, DE Distributed 4/5/16 Issue/Question: MUTCD 4E.02 The MUTCD and UVC are consistent in that pedestrians are not legally allowed
Anatomy of a Jackpot: Characteristics of Purchasers of Large Jackpot Lottery Tickets
 Anatomy of a Jackpot: Characteristics of Purchasers of Large Jackpot Lottery Tickets The 15 th International Conference on Gambling & Risk Taking May 27-31, 2013 Todd Maki & Don Feeney 1 Although not shown
Zions Bank Economic Overview
 Zions Bank Economic Overview Intermountain Credit Education League May 10, 2018 Dow Tops 26,000 Up 48% Since 2016 Election Jan 26, 2018 26,616 Oct 30, 2016 17,888 Source: Wall Street Journal Dow Around
SIA SNOW SPORTS PARTICIPANT STUDY
 2012-2013 SIA SNOW SPORTS PARTICIPANT STUDY TABLE OF CONTENTS Section Page Number Participation Demographics 5 Gender and Age Demographics 27 Income and Education Demographics 38 Ethnic Demographics 54
Together, we are creating a world that works better.
 Together, we are creating a world that works better. www.td.org/powermember www.td.org/membership TIPS, TOOLS & INTELLIGENCE FOR DEVELOPING TALENT HUMAN CAPITAL ISSUE 1801 Alan Landers JANUARY 2018 $19.50
Wildlife Watching in the U.S.: The Economic Impacts on National and State Economies in 2011
 U.S. Fish & Wildlife Service Wildlife Watching in the U.S.: The Economic Impacts on National and State Economies in 2011 Addendum to the 2011 National Survey of Fishing, Hunting, and Wildlife-Associated
Zions Bank Economic Overview
 Zions Bank Economic Overview Kenworth National Dealers Conference November 8, 2018 1 National Economic Conditions 2 Volatility Returns to the Stock Market 27,000 Dow Jones Industrial Average October 10,
Pedestrian Traffic Fatalities by State
 Spotlight on Highway Safety Pedestrian Prepared for Governors Highway Safety Association by Dr. James Hedlund HIGHWAY SAFETY NORTH Summary The number of pedestrian traffic fatalities in the United States
Catena Media analysis of how we expect sports betting to roll out across the United States of America.
 Catena Media analysis of how we expect sports betting to roll out across the United States of America. The impacts of this ruling on sports betting in the United States The state of New Jersey can now
COLORADO 1200 COLORADO (5H) 4.95R UPC # ISBN # TITLES IN RED ARE FIVE STAR PAPER FOLD MAPS
 4.95R UPC # ISBN # TITLES IN RED ARE FIVE STAR PAPER FOLD MAPS") TITLES IN RED ARE FIVE STAR PAPER FOLD MAPS ALABAMA 1002 ALABAMA (5H) 4.95R UPC #7-68306-11340-3 ISBN #978-1-59214-061-9 1010 HUNTSVILLE, AL (SEG-5H ) 4.95R UPC #7-68306-11346-5 ISBN #978-1-59214-088-6
TITLES IN RED ARE FIVE STAR PAPER FOLD MAPS ALABAMA 1002 ALABAMA (5H) 4.95R UPC #7-68306-11340-3 ISBN #978-1-59214-061-9 1010 HUNTSVILLE, AL (SEG-5H ) 4.95R UPC #7-68306-11346-5 ISBN #978-1-59214-088-6
FARS Acc_Aux Analytical Users Manual. The Tables in this Manual Contain Fatal Crash Counts
 FARS Acc_Aux Analytical Users Manual The Tables in this Manual Contain Fatal Crash Counts FARS Acc_Aux File s 2005-2014 ANCHOR Table of Contents 1 A_CRAINJ A_CT A_D15_19 A_D15_20 A_D16_19 A_D16_20 A_D16_24
Colorado Counties Treasurers Association
 Colorado Counties Treasurers Association Place cover image here Richard Wobbekind Executive Director, Business Research Division June 21, 2016 Real GDP Growth Quarterly and Annualized Real GDP 1990-2016
FARS Acc_Aux Analytical Users Manual
 FARS Acc_Aux Analytical Users Manual The s Included in the 'ACC_AUX' database are produced from definitions defined in the 'NCSA - Analytical Data Classification Manual' The Tables in this Manual Contain
Official Match Program
 Official Match Program 2013-14 The American Legion presents its 24 th Junior 3-Position Air Rifle Tournament, which provides competitors an opportunity to test their marksmanship ability in competition
Pedestrian Fatalities on Interstate Highways, United States, Saving lives through research and education.
 Saving lives through research and education Pedestrian Fatalities on Interstate Highways, United States, 1993-2012 September 2014 607 14th Street, NW, Suite 201 Washington, DC 20005 AAAFoundation.org 202-638-5944
Overview of the Regional Economy
 Overview of the Regional Economy Jason Bram, Research Officer Presentation to the Community Depository Institutions Advisory Council (CDIAC) October 13, 2017 The views expressed here are those of the presenter
Zions Bank Economic Overview
 Zions Bank Economic Overview Veteran Owned Business Conference May 11, 2018 Dow Tops 26,000 Up 48% Since 2016 Election Jan 26, 2018 26,616 Oct 30, 2016 17,888 Source: Wall Street Journal Dow Around Correction
Bikes Belong Survey: The Size & Impact of Road Riding Events
 Bikes Belong Survey: The Size & Impact of Road Riding Events November 2009 Recreational road bicycling events are popular all across the United States. Participants are inspired by the opportunities to
Appendix B. State Minimum Wage Standards with Exemptions for Agriculture and Citations
 Appendix B. State Minimum Wage Standards with Exemptions for Agriculture and Citations STATE LAW? (Y/N) EXEMPTION FOR AGRICULTURE? (Y/N/NA/NE) EXEMPTION DETAILS FEDERAL Y Y Exempts from coverage farmworkers
Warm Mix Asphalt in the United States: From Evolution to Revolution
 Warm Mix Asphalt in the United States: From Evolution to Revolution Matthew Corrigan, P.E. Asphalt Pavement Engineer Mobile Asphalt Testing Trailer Technical Manager U.S. DOT Federal Highway Administration
ARD/RD CHAPTER ASSIGNMENTS
 /RD CHAPTER ASSIGNMENTS 2017-2019 CENTRAL REGION (Bruce Norris) Indiana, Kentucky, Michigan, MID-ATLANTIC REGION (Bill Carter) District of Columbia, Ohio, Western Pennsylvania, West Virginia Delaware,
Zions Bank Economic Overview
 Zions Bank Economic Overview Utah Bankruptcy Lawyers Forum March 20, 2018 National Economic Conditions When Good News is Bad News Is Good News?? Dow Tops 26,000 Up 44% Since 2016 Election Source: Wall
Washington, D.C Washington, D.C
 November 10, 2010 The Honorable Harry Reid The Honorable Mitch McConnell Majority Leader Minority Leader United States Senate United States Senate Washington, D.C. 20510 Washington, D.C. 20510 The Honorable
June 26 27, Gainesville, Florida
 June 26 27, 2018 Gainesville, Florida Welcome, Introductions + Agenda Chris Craig Introductions Name Agency/organization Number of years you ve worked in traffic safety Agenda DAY 1 DAY 2 Action Plan Group
Minimum Wages By State, Municipality and County
 Compliance Alert January 21 st, 2019 Minimum Wages By State, Municipality and County AL N/A N/A AK $9.89 AZ $11.00 $12.00 - January 1, 2020 Flagstaff $12.00 $13.00 - January 1, 2020 $15.00 - January 1,
North Carolina Transportation Issues
 North Carolina Transportation Issues David T. Hartgen, Ph.D., P.E. Emeritus Professor of Transportation Studies UNC Charlotte Remarks at the Shaftesbury Lecture John Locke Foundation Raleigh, North Carolina
Legal Heat: 50 State Guide to Firearm Laws and Regulations
 Legal Heat: 50 State Guide to Firearm Laws and Regulations First Edition A Traveler s resource for all 50 states and the District of Columbia. Plus User-friendly overviews of essential information like:
STUN GUN LAWS/ REQUIREMENTS DATED
 STUN GUN LAWS/ REQUIREMENTS DATED 11-09-15 State Laws / Permit Requirements Penalties-At-A-Glance Alabama Under Alabama law, a stun gun is not considered a firearm. Rather, Alabama defines a firearm as
Regional Economic Conditions
 Regional Economic Conditions Jason Bram, Research Officer Community Advisory Group Meeting June 27, 2017 The views expressed here are those of the presenter and do not necessarily represent those of the
Jessica Mendoza Two- Time Olympic medalist USA Softball female athlete of the year
 Jessica Mendoza Two- Time Olympic medalist USA Softball female athlete of the year INDEX ITEM NUMBER ASSOCIATION BALL TYPE COR COMPRESSION SIZE COVER FP/SP CASE PACK PAGE 4A-066Y ASA Thunder HyCon.52 300
America s Brightest ORANGE
 America s Brightest ORANGE Oklahoma State University 2013 Survey of Alumni of Graduate Programs Jeremy Penn, Ph.D. Director Mark Nicholas, Ph.D. Assistant Director John Hathcoat, Ph.D. Statistical Analyst
The Burden of HPV Related Cancers in Kentucky
 The Burden of HPV Related Cancers in Kentucky Presented on November 15, 2017 by Katie Bathje, Kentucky Cancer Consortium Many thanks to: Thomas C. Tucker, PhD, MPH Jaclyn Nee, DrPH 1 % coverage Adolescent
Office of Science & Technology
 NOAA Fisheries Highlights of FEUS 2015 Highlights from the Annual Report Fisheries Economics of the United States, 2015 Office of Science & Technology Fisheries and the Economy U.S. fisheries provide jobs,
2018 KENTUCKY FACT BOOK
 2018 KENTUCKY FACT BOOK A statistical guide to the Thoroughbred industry in Kentucky Prepared by The Jockey Club Preface This report has been compiled as an industry service by The Jockey Club with the
8:00 am 5:00 pm NASRO Basic Course Music Road Resort Hotel. 8:00 am 5:00 pm NASRO Basic Course - ** Music Road Resort Hotel
 NASRO NATIONAL SCHOOL SAFETY CONFERENCE Smoky Mountains, TN June 23 28, 2019 This event has been approved for UASI reimbursement. Travel, Per Diem, Tuition reimbursement, Backfill and Overtime is at the
Trends in Gambling Revenue to the States
 Trends in Gambling Revenue to the States Presentation to the Stop Predatory Gambling Lucy Dadayan November 9, 2009 Overview Gambling availability across the nation National trends in gambling revenue Growth
Zions Bank Economic Overview
 Zions Bank Economic Overview Logan Rotary Club June 28, 2018 Dow Tops 26,000 Up 48% Since 2016 Election Jan 26, 2018 26,616 Oct 30, 2016 17,888 Source: Wall Street Journal Dow Around Correction Territory
Produce Safety Alliance Course and Trainer Totals through September 19, 2018
 Course and Trainer Totals through 19, 218 Totals: 216 218 Train-the-Trainer Courses Domestic 58 Total TTT Courses since Sept. 216 International 12 Total 7 2,27 Total Trainer Participants 1,716 (Domestic)
Community of Practice on Traumatic Brain Injury
 Community of Practice on Traumatic Brain Injury First Meeting September 18 th, 2013 For audio, please call: 866-835-7973 Your phone lines are currently muted. Today s Agenda Overview of the CoP Hear about
LATE CE COURSE CATALOG These are the ONLY Courses Approved to Make-up CE Requirements
 LATE CE COURSE CATALOG These are the ONLY Courses Approved to Make-up CE Requirements Make-up CE Requirements for Years 2017, 2016, 2015, 2014, 2013, 2012, 2011, 2010 This catalog is used for MLOs who
Iragavarapu, Khazraee, Lord, Fitzpatrick PEDESTRIAN FATAL CRASHES ON FREEWAYS IN TEXAS
 Iragavarapu, Khazraee, Lord, Fitzpatrick PEDESTRIAN FATAL CRASHES ON FREEWAYS IN TEXAS By Vichika Iragavarapu, P.E. (Corresponding author) Assistant Research Engineer Texas A&M Transportation Institute,
Wildlife Watching in the U.S.: The Economic Impacts on National and State Economies in 2006
 U.S. Fish & Wildlife Service Wildlife Watching in the U.S.: The Economic Impacts on National and State Economies in 2006 Addendum to the 2006 National Survey of Fishing, Hunting, and Wildlife-Associated
SHOOTING IN AMERICA. An Economic Force for Conservation 2018 EDITION
 TARGET SHOOTING IN AMERICA An Economic Force for Conservation 2018 EDITION INTRODUCTION Target shooting is enjoyed by millions of Americans each year. It is so popular, in fact: More people participate
Sustainable Transportation Planning in the Portland Region
 Sustainable Transportation Planning in the Portland Region Jennifer Dill, Ph.D. Associate Professor School of Urban Studies & Planning jdill@pdx.edu http://web.pdx.edu/~jdill/ Outline Elements of a sustainable
Cement & Construction Outlook
 Cement & Construction Outlook Minnesota Concrete Council November 17, 2011 Dave Zwicke, PCA Analytics Manager, Sr. Economist Bottom Line Economy in a slow growth period characterized by tepid job gains.
CLIFF PENNINGTON. Oakland A s 2012 Math Educational Program. 3 rd -5 th Grade Workbook
 CLIFF PENNINGTON Oakland A s 2012 Math Educational Program 3 rd -5 th Grade Workbook EARN 2 VOUCHERS TO A 2012 A s GAME! ELIGIBILITY Students from 1st through 8th grade are eligible to participate in the