Preview. Second midterm Tables in your paper Mass Transit as alternative to auto California s problems in urban transportation
|
|
|
- Meredith Anderson
- 5 years ago
- Views:
Transcription
1
2
3 Preview Second midterm Tables in your paper Mass Transit as alternative to auto California s problems in urban transportation
4 Score Distribution 1 st Midterm 2 nd Midterm % 21% % 34% % 22% % 21% % 2%
5 Start with the concept Land Value=Present Value of Rents minus Cost of Construction V=PK-C(K) As P increases, K increases and C(K) increases. So, higher P implies higher K is not enough. Yes, revenue is higher, but so is cost
6 Picturing Land Value $ per sq. ft. Marginal Cost P Land Value K Square feet
7 Changes in Rent and Value $ per sq. ft. ΔP ΔP K K Change in value for a given change in rent Office space per square foot of land
8 Integrating tables in your writing
9 Commuting in Urban Areas Last time auto and congestion This time mass transit
10 Alternatives to the Automobile Bus system Cheap--uses same roadway as car Flexible route structure Subject to congestion, too Rail system Separate roadway not subject to congestion Expensive to build (cheap to operate) Inflexible route structure

11 Bay Area Rapid Transit (BART) Walnut Creek to Embarcadero: 34 min, $4.25
12
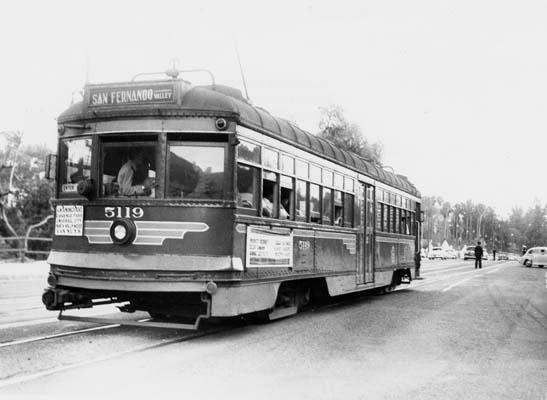
13 San Francisco Municipal Railway (Muni)

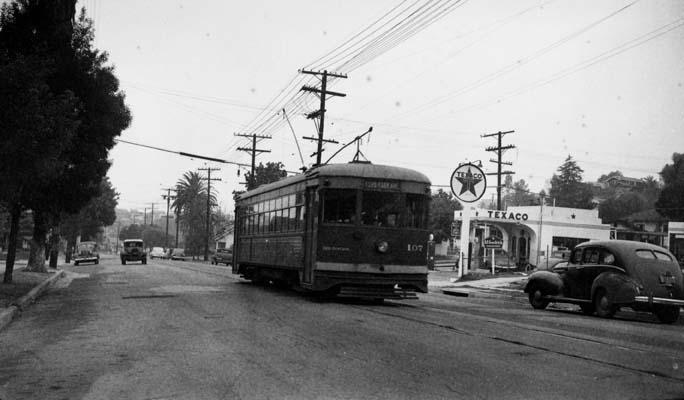
14 Long Beach to LA: 55 minutes, $1.25

15 Southern Half of NY subway: $2.00

16 Washington Metro Rockville to Metro Center: 30 min, $3.75
17 The Issue with Rail Transit Large capacity Rapid Expensive High fixed cost Relatively low operating cost
18 The Economics of Mass Transit High fixed cost cost of construction annualized Relatively low variable cost cost per ride assume constant variable cost equal to marginal cost
19 $/year average total cost marginal cost riders/year
20 $/year Demand riders/year
21 Should we build the subway? $/year A Benefit Cost Benefit-Cost =A-B B riders/year
22 Higher Demand $/year A Benefit-Cost =A-B B riders/year
23 Even higher demand $/year Fares can cover costs, but should they? P P* riders/year
24 What to do? Charge fare equal to marginal cost and subsidize
25 Urban Transit Policy Cars versus mass transit Rail transit most likely to get people out of their cars How has this played out in California?
26 California is spending on mass transit Total Fare Revenue Net Expenditures from Public Subsidies to Expenditures on Public Transit Transit Private Transit California US-California Florida * Illinois New York Texas * *rounded to zero Table 8.3 Net Expenditures on Mass Transit per Capita, 2002 (dollars)
27 Figure 8.2 Capital Expenditures on Mass Transit per Capita, California US-California Expenditures per Capita (2002 $)
28 Figure 8.3 Current Expenditures on Mass Transit per Capita, California US-California Expenditures per Capita (2002 $)
29 California is not spending much on highways Table 8.12 Current and Capital Expenditures on Highways per Capita, 2002 (dollars) Total Current Capital Expenditures Expenditures Expenditures California US-California Florida Illinois New York Texas
30 Capital spending low for many years Figure 8.4 Capital Expenditures on Highways per Capita, California US-California Expenditures per Capita (2002 $)
31 Change happened in 1970s Table 8.13 Highway Capital Expenditures per Capita (2002 dollars) California US-California Florida Illinois New York Texas
32 Since 1980, highway capacity hasn t kept up with population Table 8.14 Growth in Lane Miles and Population, 1980 to 2002 Freeways and Other Principal Arterials Lane Miles per Million People Percentage Increase, 1980 to Population Lane Miles California 2,038 1, US-California 2,484 2, Florida 2,151 1, Illinois 1,287 1, New York 1,260 1, Texas 3,496 2,
33 Highway capacity hasn t keep up with population 3,000 Figure 8.5 Lane Miles per Capita, Freeways and Other Principal Arterials Lane Miles per Million People 2,500 2,000 California US-California 1,
34 Despite Mass Transit, Road Use High in California Annual Mass Transit Trips Table 8.22 Road Congestion and Delay, 85 Urban Areas, 2002 Daily Vehicle Miles Traveled Lane Miles of Freeways and Arterials per Daily Vehicle Miles per Annual Hours of Delay per Capita per Capita Per Capita Million Residents Lane Mile California ,388 11, US-California ,327 10, Florida ,584 9, Illinois ,033 11, New York , Texas ,576 10,582 30
35 Figure 8.6 Annual Hours of Delay in Largest Urban Areas, Annual Hours of Delay per Capita Dallas Riverside- San Bernadino Orlando Tampa San Antonio Buffalo Miami Jacksonville San Jose Los Angeles San Francisco Houston Chicago San Diego New York Sacramento 6,000 8,000 10,000 12,000 14,000 16,000 Daily Vehicle Miles Traveled per Lane Mile
36 A Summary CA emphasized mass transit over highways Lane miles per capita fell as state grew Mass transit use is relatively high But highway use is also high Capacity less, but use is not Congested freeways
37 Interpretations Failed policy or, haven t tried hard enough
38 Where now Massive infrastructure investment Highways, mass transit, or both Or, demand management Highway tolls Anti-sprawl policies Planning better in new areas Central Valley Inland Empire
39 Next Time Racial segregation in housing Two readings from LA Times Family Stood Up to Restrictive Covenants What It Is. (And What It Was).
Preview. Tables in your paper Mass Transit as alternative to auto California s problems in urban transportation
 Preview Tables in your paper Mass Transit as alternative to auto California s problems in urban transportation Integrating tables in your writing Commuting in Urban Areas Last time auto and congestion
Arnold Hinojosa
 Policy Analysis of the Mass Transit Challenges Facing Rapidly Growing Southern and Western Cities and How These Challenges Can Be Addressed Using the Model Set by Chicago Arnold Hinojosa ahinojosa@kentlaw.edu
Sustainable Transportation Planning in the Portland Region
 Sustainable Transportation Planning in the Portland Region Jennifer Dill, Ph.D. Associate Professor School of Urban Studies & Planning jdill@pdx.edu http://web.pdx.edu/~jdill/ Outline Elements of a sustainable
CONGESTED LOS ANGELES
 CONGESTED LOS ANGELES Prepared For: Mayor Antonio Villaraigosa and City Council City of Los Angeles Prepared By: Jacki Murdock Transportation Analyst LADOT December 11 th, 2011 Outline What causes congestion?
Presented by: Keith Nichols, PE Principal Transportation Engineer, TTAC Agenda Item #14 October 7, 2015
 TTI URBAN MOBILITY SCORECARD 2015 Report Presented by: Keith Nichols, PE Principal Transportation Engineer, TTAC Agenda Item #14 October 7, 2015 INTRODUCTION The TTI Urban Mobility Scorecard report evaluates
MOVEABLE BARRIER. Congestion Management Solutions
 MOVEABLE BARRIER Congestion Management Solutions 1 Portland area morning congestion (AM) 2 Portland area afternoon congestion (PM) 3 30 year planning - Portland Area 100% Growth over 30 years 4 Movable
Win-Win Transportation Solutions
 Win-Win Transportation Solutions Todd Litman Victoria Transport Policy Institute Presented Lipinski Symposium on Transportation Policy Chicago, Illinois 15 October 2007 What is The Transportation Problem?
Public Transport and Development: Making It Work
 Public Transport and Development: Making It Work Robert T. Dunphy Urban Land Institute World Bank Transport Forum 2006 March 28, 2006 Transportation Development Disconnect Now Few Then places w/o car Many
METRO Now. Transit Leader. One of only four urban. gain bus ridership in Purple and Green Lines. Red Line is one
 Transit Leader Our commuter buses provide 8 million trips each year third most trips of any U.S. transit agency. 1 One of only four urban transit agencies in the country to gain bus ridership in 2016 2
Measuring the Distribution and Costs of Congestion. Tim Lomax Texas Transportation Institute
 Measuring the Distribution and Costs of Congestion Tim Lomax Texas Transportation Institute http://mobility.tamu.edu The Congestion Measurement Story Travel time, variations, compare to goals WHAT? WHY?
U.S. Economic and Apartment Market Overview and Outlook. July 15, 2014
 2014 U.S. Economic and Apartment Market Overview and Outlook July 15, 2014 U.S. Economic Overview U.S. GDP Growth Persistent Despite 1Q Polar Vortex Annualized Quarterly Percent Change 10% 5% 0% -5% -10%
Reversible Elevated Express Lanes. A Solution for Urban Traffic Congestion
 Lee Roy Selmon Crosstown Expressway Reversible Elevated Express Lanes A Solution for Urban Traffic Congestion Martin Stone, Ph.D., AICP Director of Planning Tampa-Hillsborough Expressway Authority Pensacola
Riverside Rising Economic Outlook for the Region April 2015
 Analysis. Answers Riverside Rising Economic Outlook for the Region April 2015 Beacon Economics, LLC California fact versus fiction Looking back a few years (2009 / 2010) everyone was saying that CA would
THE MOST INFORMATIVE EVENT COVERING REAL ESTATE INVESTMENTS
 THE MOST INFORMATIVE EVENT COVERING REAL ESTATE INVESTMENTS 2014 U.S. Economic, Capital Markets, and Retail Market Overview and Outlook Retail Trends 2014 U.S. Economic Overview and Outlook Total Employment
POTENTIAL SANTA CLARA COUNTY TRANSPORTATION MEASURE
 POTENTIAL SANTA CLARA COUNTY TRANSPORTATION MEASURE OVERALL DRAFT EXPENDITURE PLAN TRANSIT/Mode Shift Millions % BART to Downtown San Jose/Santa Clara* 1,400 23% Caltrain Capacity & Safety 1,014 17% Mass
Findings. TSTC went line-by-line through the STIP and categorized projects into 15 categories:
 Tracking the Dollars 2012-2015: A Review of Planned Transportation Investments in Connecticut and what it says about Connecticut s transportation priorities The Connecticut Department of Transportation
INFRASTRUCTURE: Using the Grid to Create a more Self-Sustaining Downtown. Studio Spring 2013
 EMERGENT FUTURES The San Diego Section of the American Society of Civil Engineers (ASCE) released a new report, the 2012 San Diego County Infrastructure Report Card. Since the last San Diego Report Card
Transit Signal Priority (TSP) Application to Miami-Dade Transit
 Application to Miami-Dade Transit") Transit Signal Priority (TSP) Application to Miami-Dade Transit Amar Sarvepalli Parsons Brinckerhoff Southeast Florida FSUTMS Users Group August 15, 2008 Overview PART A WHAT IS TSP INTRODUCTION PURPOSE
Transit Signal Priority (TSP) Application to Miami-Dade Transit Amar Sarvepalli Parsons Brinckerhoff Southeast Florida FSUTMS Users Group August 15, 2008 Overview PART A WHAT IS TSP INTRODUCTION PURPOSE
modes, the increased roadway capacity is the implied solution, which, in turn, has been shown to lead to more driving (induced demand).
.") EXECUTIVE SUMMARY A. Introduction The San Francisco Congestion Management Program (CMP) is a biennial program conducted in accordance with state law to monitor congestion and adopt plans for mitigating
EXECUTIVE SUMMARY A. Introduction The San Francisco Congestion Management Program (CMP) is a biennial program conducted in accordance with state law to monitor congestion and adopt plans for mitigating
It s Been 15 Years Already?!
 It s Been 15 Years Already?! What We ve Learned from 12 Operational Facilities 14 Parsons Brinckerhoff, 2012. THEY WORK! May 24, 2012 Parsons Brinckerhoff, 2012. 2 David Ungemah ungemah@pbworld.com May
Complete Streets Policies in Charlotte
 Complete Streets Policies in Charlotte Complete Streets Peer Exchange Baton Rouge, LA January 19, 2016 Norm Steinman, AICP Charlotte DOT Changing what we do to change what will happen 1. Inventory of Conditions
Fundamental Certainty
 Fundamental Certainty.or No? a presentation at: R. Mark Woodworth PKF Hospitality Research, LLC May 7, 2013 mark.woodworth@pkfc.com Hotel Horizons Forecasting Model Smith Travel Research Historical rooms
Real Estate: Investing for the Future. Sponsored By:
 Real Estate: Investing for the Future Sponsored By: Percent Change, Year Ago 6 5 4 3 2 1 Real GDP Growth United States, 2000 Prices 0 1994 1995 1996 1997 1998 1999 2000 2001 2002 2003 2004 U.S. Employment
Mobility and Congestion
 Technical Memorandum Mobility and Congestion Prepared for: Prepared by: September 25, 2013 1 Table of Contents 1. Introduction... 1 2. Congestion Forecasting Process... 1 2.1 Mobility and Congestion Terms...
Traffic Congestion in Houston. Presented by Bill King
 Traffic Congestion in Houston Presented by Bill King www.billkinghouston.com The Travel Time Index Defined 1.36 30 Minute Trip = 41 Minute Trip (+ 36%) The History of Congestion in Houston Growing Congestion
Managed Lanes: A National Perspective Managed Lane Strategies
 Managed Lanes: A National Perspective Managed Lane Strategies Use the following control strategies to manage a lane(s) to provide a reliable transportation option: Eligibility/occupancy Access control
Performance Measure Summary - San Jose CA. Performance Measures and Definition of Terms
 Performance Measure Summary - San Jose CA There are several inventory and performance measures listed in the pages of this Urban Area Report for the years from 1982 to 2014. There is no single performance
TAMPA BAY EXPRESS (TBX)
") TAMPA BAY EXPRESS (TBX) Hank Schneider, P.E. FDOT- District 7 Consultant Project Manager Florida Department of TRANSPORTATION TAMPA BAY EXPRESS AGENDA What is TBX? What does TBX do? Why is TBX Important?
TAMPA BAY EXPRESS (TBX) Hank Schneider, P.E. FDOT- District 7 Consultant Project Manager Florida Department of TRANSPORTATION TAMPA BAY EXPRESS AGENDA What is TBX? What does TBX do? Why is TBX Important?
An Incentive-Based Approach to Curbing Automobile Use in the Washington, DC Metropolitan Area
 An Incentive-Based Approach to Curbing Automobile Use in the Washington, DC Metropolitan Area Emily Freimuth Daniel Selden Andrew Kimmel Brendan Shera The Problem Urban Sprawl Increased Commuting from
Passenger Rail in Virginia
 Passenger Rail in Virginia Executive Summary! In 2011, Washington DC-VA-MD ranked 1st in the U.S. per auto commuter in the following categories:1 o Yearly Delay; 67 hours o Excess Fuel; 32 gallons o Congestion
METRO RTA TRANSIT MASTER PLAN. May 25-26, 2011
 METRO RTA TRANSIT MASTER PLAN May 25-26, 2011 WHAT IS THE TRANSIT MASTER PLAN? A twenty-year plan for METRO RTA What will METRO look like in 2031? 1 TRANSIT TECHNOLOGIES 2 TRANSIT TECHNOLOGIES Transit
Going Green: How California is Reviving Passenger Rail. APTA/ AASHTO AASHTO 2008 State Public Transit Partnerships. August 7, 2008
 Going Green: How California is Reviving Passenger Rail APTA/ AASHTO AASHTO 2008 State Public Transit Partnerships August 7, 2008 Eugene K. Skoropowski, Managing Director Capitol Corridor Joint Powers Authority
Improving Mobility Without Building More Lanes
 Improving Mobility Without Building More Lanes By Mike Salisbury and Will Toor July 2017 Copyright 2017 by Southwest Energy Efficiency Project. All rights reserved. Photo: Courtesy of the Denver Post Anyone
FACTS AND FIGURES: MAKING THE CASE FOR COMPLETE STREETS IN LEE COUNTY
 FACTS AND FIGURES: MAKING THE CASE FOR COMPLETE STREETS IN LEE COUNTY Safety: Close to 5,000 pedestrians and bicyclists die each year on U.S. roads, and more than 70,000 are injured. [Mean Streets, Surface
DALLAS MIDTOWN REDEVELOPMENT PLAN FOCUS NORTH TEXAS Peer Chacko, AICP, Assistant Director, City of Dallas
 DALLAS MIDTOWN REDEVELOPMENT PLAN FOCUS NORTH TEXAS 2014 Peer Chacko, AICP, Assistant Director, City of Dallas Dallas Midtown: Strategic growth area Future transit node 2 Peterson Road Study Area Galleria
Members of the Board of Directors. Wendy Knowles, Clerk of the Board. Metrolink Ridership and Revenue Annual Report
 COMMITTEE TRANSMITTAL January 13, 2014 To: From: Subject: Members of the Board of Directors Wendy Knowles, Clerk of the Board Metrolink Ridership and Revenue Annual Report Transit Committee Meeting of
Ranking Walkable Urbanism in America s Largest Metros
 Ranking Walkable Urbanism in America s Largest Metros The Largest 30 Metros in the United States SHARE OF U.S. POPULATION SHARE OF U.S. GDP 54% 46% 42% 58% LARGEST 30 METROS REST OF U.S. The Old Dichotomy
Managed Lanes 2017: What They Are and How They Work. Robert W. Poole, Jr. Director of Transportation Policy Reason Foundation
 Managed Lanes 2017: What They Are and How They Work Robert W. Poole, Jr. Director of Transportation Policy Reason Foundation http://reason.org What are Managed Lanes? Lanes restricted by price or vehicle
Pinellas County. Transportation Task Force. June 21, 2010
 Pinellas County Transportation Task Force June 21, 2010 1 Welcome and Introductions Karen Williams Seel, Pinellas Board of County Commissioners 2 Agenda Approval of Minutes MPO Long Range Plan Brian Smith,
ORANGE COUNTY TRANSPORTATION AUTHORITY. Metrolink Ridership and Revenue Quarterly Report. Staff Report
 ORANGE COUNTY TRANSPORTATION AUTHORITY Metrolink Ridership and Revenue Quarterly Report Staff Report March 8, 2012 To: From: Subject: Transit Committee Will Kempton, Chief Executive Officer Metrolink Ridership
Performance Measure Summary - Chicago IL-IN. Performance Measures and Definition of Terms
 Performance Measure Summary - Chicago IL-IN There are several inventory and performance measures listed in the pages of this Urban Area Report for the years from 1982 to 2014. There is no single performance
WHAT IFS: Over the course of
 WHAT IFS: Over the course of the 422plus Project certain questions have arisen multiple times at meetings, briefings and on-line at the website. Most of these questions start with WHAT IF. WHAT IF vehicle
Economics of Highway Spending and Traffic Congestion. Todd Litman Victoria Transport Policy Institute Presented Strong Towns Webinar 3 February 2016
 Economics of Highway Spending and Traffic Congestion Todd Litman Victoria Transport Policy Institute Presented Strong Towns Webinar 3 February 2016 Motor Vehicle Travel is Peaking Annual Vehicle Mileage
1.221J/11.527J/ESD.201J TRANSPORTATION SYSTEMS FALL 2003 FINAL EXAMINATION. 1. Open-book and open-notes, calculators are fine -- no laptops.
 1.221J/11.527J/ESD.201J TRANSPORTATION SYSTEMS FALL 2003 FINAL EXAMINATION Instructions: PROFESSOR JOSEPH M. SUSSMAN (LECTURER) 1. Open-book and open-notes, calculators are fine -- no laptops. 2. The exam
A Federal Perspective on Congestion Pricing. Wayne Berman Federal Highway Administration July 8, 2010
 A Federal Perspective on Congestion Pricing Wayne Berman Federal Highway Administration July 8, 2010 Overview Background on Congestion Pricing Benefits and Experiences of Pricing Case Study Miami I-95
Capital and Strategic Planning Committee. Item III - B. April 12, WMATA s Transit-Oriented Development Objectives
 Capital and Strategic Planning Committee Item III - B April 12, 2018 WMATA s Transit-Oriented Development Objectives Page 24 of 76 Washington Metropolitan Area Transit Authority Board Action/Information
Overview of 64 Express Lanes. Secretary of Transportation Aubrey Layne April 12, 2017
 Overview of 64 Express Lanes Secretary of Transportation Aubrey Layne April 12, 2017 2 More Choices for Motorists Coming December 2017 Purpose and Use Our purpose is two-fold: Reduce congestion by making
ALTERNATIVES ANALYSIS EXECUTIVE SUMMARY
 West Valley Connector Corridor ALTERNATIVES ANALYSIS EXECUTIVE SUMMARY FINAL September 2014 Ontario International Airport Ontario Mills Rancho Cucamonga Metrolink Station Kaiser Permanente PARSONS EXECUTIVE
Travel and Parking Behavior in the United States
 Portland State University PDXScholar Center for Urban Studies Publications and Reports Center for Urban Studies 12-1996 Travel and Parking Behavior in the United States Gerard C. Mildner Portland State
Managed Lanes: The Fitch Approach. Saavan Gatfield, Senior Director
 Managed Lanes: The Fitch Approach Saavan Gatfield, Senior Director HOT Lanes Getting Hotter Priced Managed Lanes Across the United States As of 4/27/14 Sources: HNTB Corporation; GAO analysis of USDOT,
Regional Transportation Needs Within Southeastern Wisconsin
 Regional Transportation Needs Within Southeastern Wisconsin #118274 May 24, 2006 1 Introduction The Southeastern Wisconsin Regional Planning Commission (SEWRPC) is the official areawide planning agency
I-80 Corridor Overhaul
 I-80 Corridor Overhaul MTC Horizon Transformative Projects 15 November, 2018 Megan Gee Arup Vision A rightsized freeway network future-proofs the region for population growth, new mobility innovations,
Congestion Evaluation Best Practices
 Congestion Evaluation Best Practices Todd Litman Victoria Transport Policy Institute Presented International Transportation and Economic Development Conference 10 April 2014 Congestion Indicators Indicator
Investing in Real Estate. The smart choice for today s investor
 Investing in Real Estate The smart choice for today s investor Real Estate is preferred over stocks Real estate out performs stocks http://blog.863katy.com/category/national-housing-news/page/2/ Real Estate
VISION Long Range Plan Update Board Workshop. February 10, 2016
 VISION 2040 Long Range Plan Update Board Workshop February 10, 2016 Vision 2040 Key Milestones UNDERSTAND THE NEED IDENTIFY A RANGE OF OPTIONS EVALUATE COMMUNITY OPTIONS DEFINE PROJECTS & PLANS Vision
WHITE PAPER: TRANSIT SERVICE FOR SOUTH SHAGANAPPI
 9/27/2012 TRANSIT PLANNING WHITE PAPER: TRANSIT SERVICE FOR SOUTH SHAGANAPPI 2012 Calgary Transit 1 Table of Contents Purpose... 3 Area of Change... 3 Background... 3 Access to destinations... 5 Connecting
Toll Express Lanes for the Research Triangle region Including discussion of possible applications on I-40
 Toll Express Lanes for the Research Triangle region Including discussion of possible applications on I-40 Presentation for discussion at Durham-Chapel Hill-Carrboro MPO TAC meeting Wednesday, December
Highway 217 Corridor Study. Phase I Overview Report
 Highway 217 Corridor Study Phase I Overview Report November 3, 24 BACKGROUND AND OVERVIEW Study purpose The Highway 217 Corridor Study is developing multi-modal transportation solutions for traffic problems
Cities Connect. Cities Connect! How Urbanity Supports Social Inclusion
 Cities Connect! How Urbanity Supports Social Inclusion Todd Litman Victoria Transport Policy Institute Metropolis Toronto, Canada - 14 June 2006 Cities Connect People with people. People with jobs. People
Transportation Master Plan Advisory Task Force
 Transportation Master Plan Advisory Task Force Network Alternatives & Phasing Strategy February 2016 BACKGROUND Table of Contents BACKGROUND Purpose & Introduction 2 Linking the TMP to Key Council Approved
Addressing Bicycle Capacity Issues on Public Transportation
 Addressing Bicycle Capacity Issues on Public Transportation Advanced Transportation Technologies Clean Transportation Solutions SM Whitney Pitkanen Project Manager MISSION STATEMENT CALSTART is dedicated
Predicted vs. Actual Costs and Ridership - Urban Transport Projects
 Predicted vs. Actual Costs and Ridership - Urban Transport Projects Lessons from the US presented by Steve Lewis-Workman, Transport Economist East Asia Department, Transport Division ADB Transport Forum
About the Active Transportation Alliance
 About the Active Transportation Alliance Chicagoland s voice for better biking, walking and transit Founded 1985 7,000 members, ~33 full time staff Serve Chicago metro region 1 More Cars, More Driving
SUMMARY OF TRANSPORTATION INVESTMENTS
 Santa Cruz County 2016 Measure D: Transportation Improvement Expenditure Plan - Approved by over 2/3 of Santa Cruz County voters on November 8, 2016 - Overview Measure D, the 2016 Transportation Improvement
Performance Measure Summary - Denver-Aurora CO. Performance Measures and Definition of Terms
 Performance Measure Summary - Denver-Aurora CO There are several inventory and performance measures listed in the pages of this Urban Area Report for the years from 1982 to 2014. There is no single performance
EL CAMINO REAL BUS RAPID TRANSIT (BRT) PROJECT
 PROJECT") Agenda Item #4.2 EL CAMINO REAL BUS RAPID TRANSIT (BRT) PROJECT VTA BOARD WORKSHOP MAY 1, 2015 ABOUT THIS PRESENTATION CONTEXT Existing conditions and planning for growth WHAT IS THE PROJECT? Project alternatives
Agenda Item #4.2 EL CAMINO REAL BUS RAPID TRANSIT (BRT) PROJECT VTA BOARD WORKSHOP MAY 1, 2015 ABOUT THIS PRESENTATION CONTEXT Existing conditions and planning for growth WHAT IS THE PROJECT? Project alternatives
Dear City Council Members,
 From: Bob Kenyon [mailto: ] Sent: Monday, February 08, 2016 10:20 AM To: City Clerk Subject: Please prioritize Caltrain and a complete transit network Thank you for prioritizing bringing BART to San Jose
2015 Urban Mobility Scorecard. Scott Weber, Transportation Planner & Analyst James Winters, Regional Planner & Policy Analyst
 2015 Urban Mobility Scorecard Scott Weber, Transportation Planner & Analyst James Winters, Regional Planner & Policy Analyst Introduction 1. Congestion Trends 2. Compounding Problems 3. Possible Solutions
Keep Placer Moving. Placer is Growing. POPULATION (From 2014 to 2045) 70,000 new homes and well over 180,000 more residents
 70,000 new homes and well over 180,000 more residents") Keep Placer Moving Placer is Growing Keep Placer Moving POPULATION (From 2014 to 2045) 70,000 new homes and well over 180,000 more residents 30% of the total housing market growth in the Sacramento region.
Keep Placer Moving Placer is Growing Keep Placer Moving POPULATION (From 2014 to 2045) 70,000 new homes and well over 180,000 more residents 30% of the total housing market growth in the Sacramento region.
6/14/2013. Welcome. to the US 75 Corridor Study. Public Meeting. US 75 Corridor Study Area
 Welcome to the US 75 Corridor Study Public Meeting US 75 Corridor Study Area 1 Existing and Future Congestion Levels 2012 2035 A do-nothing approach does not address the severe congestion in the region
Chapter 2 Current and Future Conditions
 Chapter 2 Current and Future Conditions 2.1 An Overview of Ottawa s Transportation System The City of Ottawa is home to about 870,700 people. The city covers an area of 2,760 square kilometres of which
These draft test specifications and sample items and other materials are just that drafts. As such, they will systematically evolve over time.
 t h e redesigned sat These draft test specifications and sample items and other materials are just that drafts. As such, they will systematically evolve over time. These sample items are meant to illustrate
Governor s Transportation Vision Panel
 Office of Governor Kate Brown Governor s Transportation Vision Panel JLA Public Involvement Project Overview The is a yearlong effort to develop a series of recommendations for the Governor that address
modes, the increased roadway capacity is the implied solution, which, in turn, has been shown to lead to more driving (induced demand).
.") CONGESTION MANAGEMEN T PROGRAM DECEMBER, 201 7 EXECUTIVE SUMMARY A. Introduction Every two years, the San Francisco County Transportation Authority (SFCTA) prepares the San Francisco Congestion Management
CONGESTION MANAGEMEN T PROGRAM DECEMBER, 201 7 EXECUTIVE SUMMARY A. Introduction Every two years, the San Francisco County Transportation Authority (SFCTA) prepares the San Francisco Congestion Management
Demographic Characteristics and Trends of Bexar County and San Antonio, TX
 Demographic Characteristics and Trends of Bexar County and San Antonio, TX Leadership San Antonio Understand Infrastructure. Prepare for Growth. May 2, 2012 San Antonio, TX Select Growing States, 2000-2010
13,351. Overall Statewide Results. How was the survey taken? Do you own or lease a personal vehicle? What is your primary means of transportation?
 Overall Statewide Results 3 1 Houston 2 Dallas 3 Fort Worth 4 San Antonio 2 11 12 Austin 6 Laredo / Pharr 7 Corpus Christi / Yoakum 8 Bryan / Waco 9 Atlanta / Beaumont / Lufkin / Paris / Tyler Amarillo
the 54th Annual Conference of the Association of Collegiate School of Planning (ACSP) in Philadelphia, Pennsylvania November 2 nd, 2014
 in Philadelphia, Pennsylvania November 2 nd, 2014") the 54th Annual Conference of the Association of Collegiate School of Planning (ACSP) in Philadelphia, Pennsylvania November 2 nd, 2014 Hiroyuki Iseki, Ph.D. Assistant Professor Urban Studies and Planning
the 54th Annual Conference of the Association of Collegiate School of Planning (ACSP) in Philadelphia, Pennsylvania November 2 nd, 2014 Hiroyuki Iseki, Ph.D. Assistant Professor Urban Studies and Planning
Managed Lanes Fundamentals and Opportunities. September 12, 2013
 Managed Lanes Fundamentals and Opportunities September 12, 2013 What are managed lanes? What are managed lanes? Specialized lanes rather than general purpose Synonym for high occupancy toll (HOT) lanes
Turnpike System Projected Debt Service Coverage Ratio ($000)*
*") Fiscal Year Toll Concession Turnpike System Projected Debt Service Coverage Ratio ($000)* Toll Administrative Charges** Total Gross O&M Expenses*** Net Existing Annual Senior Debt Service Requirement****
Fiscal Year Toll Concession Turnpike System Projected Debt Service Coverage Ratio ($000)* Toll Administrative Charges** Total Gross O&M Expenses*** Net Existing Annual Senior Debt Service Requirement****
SFMTA Annual Parking Rates & Policies Survey
 SFMTA Annual Parking Rates & Policies Survey December 2011 2011 Parking Rates and Policies Survey/ 1 Parking rates and policies survey The purpose of the survey is to track changes over time in other cities
Ridership Trends of New Start Rail Projects
 Trends of New Start Rail Projects Steven E. Polzin, Ph.D., P.E. Public Transit Research Tampa, FL Kyle K. Taniguchi Graduate Research Assistant Tampa, FL Abstract This paper reports on the ridership trends
Building Community Partnerships for Mobility:
 Building Community Partnerships for Mobility: San Francisco 2008 Presented by: Cynthia Hoyle, AICP Transportation Planning Consultant Champaign-Urbana Mass Transit District Background The Heartland Champaign-Urbana,
Honolulu Rail Transit Brochure Source List
 Honolulu Rail Transit Brochure Source List PAGE 1 What is Honolulu Rail Transit? Ordinance 07-001, "Selection of the Locally Preferred Alternative." City Council, City and County of Honolulu, January 6,
History Recent Problems Alternative Routes
 History Recent Problems Alternative Routes Built in 1936 Length: 8.4 miles Made up of two suspension bridges Meet in the middle of the San Francisco Bay at Yerba Buena Island Double-deck bridge Average
ACTIA Programs Annual Compliance Report Reporting Year Bicycle and Pedestrian Safety Table 1: Summary of Expenditures and Accomplishments
 Bicycle and Pedestrian Safety Table 1: Summary of Expenditures and Accomplishments Note: Definitions for each drop down menu appear as Comments (scroll over the column title or in the Review mode, choose
Purpose and Need. Chapter Introduction. 2.2 Project Purpose and Need Project Purpose Project Need
 Chapter 2 Purpose and Need 2.1 Introduction The El Camino Real Bus Rapid Transit (BRT) Project (Project) would make transit and other transportation improvements along a 17.6-mile segment of the El Camino
PEDESTRIAN COLLISIONS IN LOS ANGELES 1994 through 2000
 PEDESTRIAN COLLISIONS IN LOS ANGELES 1994 through 2000 City of Los Angeles Department of Transportation Gloria Jeff, General Manager March, 2006 This document printed with grant funds from the California
Growth, Innovation, and the Future of the Arizona Economy. Michael Crow Arizona State University December 21, 2016
 Growth, Innovation, and the Future of the Arizona Economy Michael Crow Arizona State University December 21, 2016 Billions Arizona Gross Domestic Product, 2005-2016 $280 $275 $270 $265 $260 $255 $250 $245
Kevin Thorpe Financial Economist & Principal Cassidy Turley
 Kevin Thorpe Financial Economist & Principal Cassidy Turley Economic & Commercial Real Estate Outlook Kevin Thorpe, Chief Economist 2012 Another Year Of Modest Improvement 2006Q1 2006Q3 2007Q1 2007Q3 2008Q1
Project Description Form 6V
 Project Description Form 6V Basic Project Information Submitting Jurisdiction/Agency: Prince William County Project Title: Route 15 Widening: Route 55 to south of RR tracks & Construct RR Overpass Project
Typical Rush Hour Commute. PennyforTransportation.com
 Typical Rush Hour Commute In the News Overview of the Plan Collaborative plan with projects in every community Prioritizing connectivity and congestion relief Dedicated transportation-specific funding;
INTRODUCTION DISCUSSION
 INTRODUCTION A study released by the Toronto Board of Trade reports that Toronto s traffic congestion has grown into a serious and costly problem. It states that Toronto commuters spend about 80 minutes
DOWNTOWN MIAMI PEDESTRIAN PRIORITY ZONE
 DOWNTOWN MIAMI PEDESTRIAN PRIORITY ZONE AUGUST 6, 2013 DOWNTOWN MIAMI BY THE NUMBERS more than 200,000 people live, work, and play here every day is home to more than 1,000 events each year hosts more
Bus Rapid Transit Plans
 Twin Cities Region Bus Rapid Transit Plans ULI Minnesota Workshop Connecting Bus Rapid Transit to the Community December 15, 2009 John Levin Director of Service Development Metro Transit Metropolitan Area
DANGEROUS BY DESIGN MARYLAND. Solving the Epidemic of Preventable Pedestrian Deaths (And Making Great Neighborhoods)
") DANGEROUS BY DESIGN 2011 MARYLAND Solving the Epidemic of Preventable Pedestrian Deaths (And Making Great Neighborhoods) DANGEROUS BY DESIGN 2011 Maryland T4AMERICA.ORG Between 2000 and 2009, 1,057 people
DANGEROUS BY DESIGN 2011 MARYLAND Solving the Epidemic of Preventable Pedestrian Deaths (And Making Great Neighborhoods) DANGEROUS BY DESIGN 2011 Maryland T4AMERICA.ORG Between 2000 and 2009, 1,057 people
Finals Brackets. Finals Brackets... 73
 Finals Brackets Finals Brackets... 73 VOLLEYBALL FINALS - FINALS BRACKETS 73 1981 Finals Bracket San Diego St. (37-6) UCLA (33-10) Pacific (27-11) Southern California (25-10) UCLA 4-15, 15-8, 15-9, 15-8
Public Hearing October 21, 2014 University of North Florida Adam W. Herbert University Center Alumni Drive Jacksonville, FL 32224
 - Project Development & Environment Study from SR 9B to SR 202 (JTB Blvd.) Duval County, Florida Financial Project ID: 209301-3-22-01 Public Hearing October 21, 2014 University of North Florida Adam W.
1. Operate along freeways, either in regular traffic lanes, in high-occupancy vehicle (HOV) lanes, or along the shoulders.
 lanes, or along the shoulders.") Most decisions about whether or not to use transit involve time and cost, and most transit services are slower than travel by private vehicle. However, when transit is faster or nearly as fast as travel
Most decisions about whether or not to use transit involve time and cost, and most transit services are slower than travel by private vehicle. However, when transit is faster or nearly as fast as travel
Bus Rapid Transit on Silicon Valley s El Camino Real: Working Together to Create a Grand Boulevard Steven Fisher
 Bus Rapid Transit on Silicon Valley s El Camino Real: Working Together to Create a Grand Boulevard Steven Fisher Senior Transportation Planner Santa Clara Valley Transportation Authority San Jose, CA How
Highway Transitway Corridor Study
 Highway Transitway Corridor Study CTS Research Conference May 21, 2014 1 2030 Transportation Policy Plan Transitway modes on highways: Highway bus rapid transit (BRT), plan identified 6 total Highway BRT