Demand Estimation Model for Park-and-Ride Service: Fort Bend County to Central Houston
|
|
|
- Coral Hunt
- 5 years ago
- Views:
Transcription
1 Demand Estimation Model for Park-and-Ride Service: Fort Bend County to Central Houston 1
2 Investigation of past and present methods/thoughts LITERATURE/SOURCE REVIEW RELATIVE DEMAND ESTIMATION 2
3 General Notions About Shape of Market-Shed for Park-and-Rides Limited by distance to facility vs. destination Facilities close together may reduce each other s market generation effectiveness Riders willingness to backtrack limited Parabola is most common shape 50% of riders typically live within 2.5 mile radius circle around facility 3
4 4
5 A close look at nine park-and-ride facilities CASE STUDY ANALYSIS OF HOUSTON AREA PARK-AND-RIDES 5
6 Location of Case Study Facilities 27 mi 27 mi 25 mi 21 mi 20 mi 21 mi 28 mi Nine Metro Facilities: 4, Spring 7, Kingwood 8, Townsen 18, Bay Area 49, Grand Parkway 51, Kingsland 55, Cypress 56, Northwest Station Current FBC Facilities: 42, AMC Movie Theater 43, University of Houston 22 mi 24 mi 5 miles 10 miles 20 miles 24 mi 6
7 Observations 2.5 mi radius circle covers approximately 37% of riders based on 2008 or 2009 data for 8 case study facilities Parabola can describe general distribution Findings concur with research 2.5 mile radius circle to measure/estimate demand may safely represent 37% of riders 7
8 Summary of Case Study Average distance to CBD: 24.3 miles Average peak weekday CBD bound riders: 726 Average # of inbound bus trips: 25 Average boardings per bus trip at P&R:
9 Use the Census online tool to obtain paired geography analysis of worker flows by income bracket. OBTAIN LEHD DATA FOR ANALYSIS 9
10 LEHD OnTheMap Data, US Census Bureau Available annually from Longitudinal Employer-Household Dynamics (LEHD) Links home to work Census Blocks Work data, not exactly travel data OnTheMap is online tool for analysis 10
11 Paired Analysis to Get Worker Flows Selecting 2.5 mile radius around P&R Selecting 1.0 mile radius to encompass CBD Tabulating worker flow by income brackets $1,250 per month or less $1,251 to $3,333 per month More than $3,333 per month 11

12 Step 1. Select areas for analysis 2.5 mile radius circle around facility used to identify home Census Blocks 1 mile radius circle around CBD used to identify work Census Block 12

13 Step 2. Select analysis settings 13

14 Step 3. Run analysis, record findings 14
15 Use of existing, local, and LEHD data to estimate demand for P&R service MODEL FOR P&R DEMAND ESTIMATION USING LEHD DATA 15
16 Demand Estimation Model Simplified Steps Obtain initial LEHD and P&R data Clean, arrange P&R data for use Create case study rates by combining P&R and LEHD data Obtain LEHD data for study sites Estimate demand for P&R services by applying rates from case study to LEHD data for new P&R sites 16


17 Location of Final Study Site Current FBC Facilities: 42, AMC Movie Theater 43, University of Houston Workgroup selected site for service/cost scenario analysis: 43, University of Houston CBD 22 mi 5 miles 10 miles 24 mi 20 miles 17

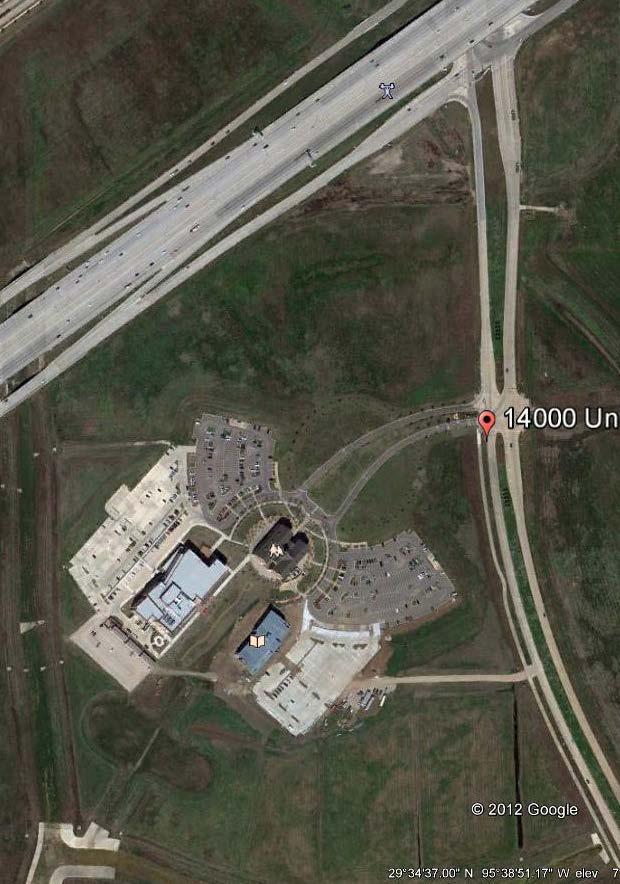
18 43, University of Houston 18
19 Based on Eight Case Study Sites: Model Inputs Average distance to CBD: 24.3 miles Average peak weekday CBD bound riders: 767 Average # of inbound bus trips: 28 Average boardings per bus trip at P&R: 27.9 Average LEHD worker flow to CBD: 1,579 Case study P&R worker-flow capture ratio for AM riders traveling to Central Houston from the 2.5 mile circle around P&R facility: Low estimate 10.72% Medium or average estimate 17.76% High estimate 28.18% 19
20 Things to Note Estimated ridership is to Central Houston in peak hours, does not include other riders Estimated ridership is for transit services equivalent to the high-quality service at the 8 case study P&Rs The five options for P&R service in FBC each affect estimated demand differently 20
21 Ridership Estimation: Avg/Low/High LOW SCENARIO: RIDERSHIP GENERATION SIMILAR TO THREE LOWEST CASE STUDY PARK-AND-RIDE FACILITIES Grand Parkway, Kingwood, and Spring Analysis P&R Site On or near UH Campus in Sugar Land (workgrp agreed assumption) Current Lot Spaces Future Lot Capacity Workers Living Within 2.5 miles of P&R with Jobs in Houston CBD Model Worker Flow P&R Capture Ratio (LOW) Earn $1,250 month or less Earn $1,251 to $3,333 More than $3,333 per month Distance to next Metro competing parkand-ride facility in corridor: Estimated Demand for Peak Hour P&R Service to Central Houston 576?? 1, % 4.0% 7.3% 88.7% AVERAGE SCENARIO: RIDERSHIP GENERATION SIMILAR TO ALL CASE STUDY PARK-AND-RIDE FACILITIES Analysis P&R Site On or near UH Campus in Sugar Land (workgrp agreed assumption) Current Lot Spaces Future Lot Capacity Workers Living Within 2.5 miles of P&R with Jobs in Houston CBD Model Worker Flow P&R Capture Ratio (AVERAGE) Earn $1,250 month or less Earn $1,251 to $3,333 More than $3,333 per month Distance to next Metro competing parkand-ride facility in corridor: Estimated Demand for Peak Hour P&R Service to Central Houston 576?? 1, % 4.0% 7.3% 88.7% HIGH SCENARIO: RIDERSHIP GENERATION SIMILAR TO THREE HIGHEST CASE STUDY PARK-AND-RIDE FACILITIES Townsen, Cypress, and Northwest Station Analysis P&R Site On or near UH Campus in Sugar Land (workgrp agreed assumption) Current Lot Spaces Future Lot Capacity Workers Living Within 2.5 miles of P&R with Jobs in Houston CBD Model Worker Flow P&R Capture Ratio (HIGH) Earn $1,250 month or less Earn $1,251 to $3,333 More than $3,333 per month Distance to next Metro competing parkand-ride facility in corridor: Estimated Demand for Peak Hour P&R Service to Central Houston 576?? 1, % 4.0% 7.3% 88.7%
22 Ridership Estimation by Option Options Description Example from Case Studies Operator Type of Service Fort Bend Shuttle Extension METRO 262 New Fort Bend Route New METRO Route Loudoun County Mesquite to DART Baytown P&R Cobb County Loudoun County GRTA Express Planned Brazoria P&R The Woodlands Express Fort Bend County (Contractor) METRO Shuttle from FBC to Commuter Express with West Bellfort Park & Ride[1] stops at Westwood P&R Fort Bend County (Contractor) Park & Ride METRO Park & Ride Type of Vehicle Service Assumptions Cost Model Small transit bus 32 seats Buses operate from P&R in FBC on a schedule to meet METRO Route 265 West Bellfort P&R Current FBC contract with First Transit Small transit bus 32 seats Current METRO vehicle assign Selected bus trips on the Buses operate from P&R METRO Route 262 start/end in FBC directly to at P&R in FBC downtown Houston METRO cost model for Baytown P&R $5.00 each way Fare Assumptions See Option 1 from Sugar Land ESTIMATED AM PEAK RIDERSHIP - Fort Bend County to Central Houston Current FBC contract with First Transit $5.00 each way Assume current METRO Park & Ride vehicle Buses operate from P&R in FBC directly to downtown Houston METRO cost model for Planned Brazoria P&R $5.00 each way Option 2 Option 3 Options 4 and 5 Non-Stop P&R to Downtown 35% of Low 50% of Low 75% of Low 100% of Low Non-stop Non-Stop Non-stop Non-Stop Low Medium High Location P&R P&R P&R P&R On or near UH
Ujari Mohite. Vijay Mahal and Vincent Sanders. Revised Ridership Forecasts for the Uptown DBL project. Date: August 17, 2015 INTRODUCTION/SUMMARY:
 To: From: Subject: Ujari Mohite Vijay Mahal and Vincent Sanders Revised Ridership Forecasts for the Uptown DBL project Date: August 17, 2015 INTRODUCTION/SUMMARY: This memorandum presents updated ridership
Guidelines for Providing Access to Public Transportation Stations APPENDIX C TRANSIT STATION ACCESS PLANNING TOOL INSTRUCTIONS
 APPENDIX C TRANSIT STATION ACCESS PLANNING TOOL INSTRUCTIONS Transit Station Access Planning Tool Instructions Page C-1 Revised Final Report September 2011 TRANSIT STATION ACCESS PLANNING TOOL INSTRUCTIONS
Executive Summary. TUCSON TRANSIT ON BOARD ORIGIN AND DESTINATION SURVEY Conducted October City of Tucson Department of Transportation
 Executive Summary TUCSON TRANSIT ON BOARD ORIGIN AND DESTINATION SURVEY Conducted October 2004 Prepared for: City of Tucson Department of Transportation May 2005 TUCSON TRANSIT ON BOARD ORIGIN AND DESTINATION
Flyaway Bus: GIS Analysis on Current and Potential Ridership, Revenue, and Prospective Stations
 ProfessorBarry Waite & Bonnie Shrewsbury Flyaway Bus: GIS Analysis on Current and Potential Ridership, Revenue, and Prospective Stations 1. Abstract The Flyaway Bus is a long distance non-stop shuttle
. ' motion. APPLtlDK.L - L"iLC_t1GLR 201b APPENDIX 7 TECHNICAL MEMOS
 . ' motion APPLtlDK.L - L"iLC_t1GLR 201b APPENDIX 7 TECHNICAL MEMOS The nmotion program will provide a large number of benefits for Middle Tennessee. This document presents selected benefits and other
Calgary Transit Route 302 Southeast BRT Year One Review June
 Calgary Transit Route 302 Southeast BRT Year One Review 2011 June Calgary Transit Route 302 Southeast BRT: Year One Review 2011 April Table of Contents 1.0 Executive Summary... 1 2.0 Introduction... 3
9 COMMUTER SERVICES: DEMAND EVALUATION OF CORRIDORS
 9 COMMUTER SERVICES: DEMAND EVALUATION OF CORRIDORS INTRODUCTION To assess which corridors are appropriate for the various types of services discussed in Chapter 8, the consulting team led an effort to
Possible Bike Sharing Stations in UCLA. -Given the Arriving Purple Line Subway UP M206A. March Tsai-wei Wen. Department of Public Policy
 Possible Bike Sharing Stations in UCLA -Given the Arriving Purple Line Subway UP M206A March 2011 Tsai-wei Wen Department of Public Policy Introduction As the Westside Subway Extension program of Los Angeles
Travel and Rider Characteristics for Metrobus
 Travel and Rider Characteristics for Metrobus 040829040.15 Travel and Rider Characteristics for Metrobus: 2012-2015 Overview The Miami Dade County Metropolitan Planning Organization (MPO) conducted a series
Using GIS and CTPP Data for Transit Ridership Forecasting in Central Florida
 Using GIS and CTPP Data for Transit Ridership Forecasting in Central Florida Xiaobo Liu, Jeffery Stiles Jacobs Engineering Group Mei Chen University of Kentucky For GIS in Transit Conference, 2009 St.
Eliminate on-street parking where it will allow for a dedicated bus only lane %
 Traffic Dashboard Priorities Survey Responses Introduction 1) Are you familiar with bus rapid transit (BRT)? a. No, BRT is new to me. 597 23.5% b. I ve heard of BRT, but I don t know much about it. 1,136
ROUTE 52 ALLENTOWN. Port Authority of Allegheny County
 ROUTE 52 ALLENTOWN Route 52 Allentown is a limited service LRT line that operates on weekdays between South Hills Junction and downtown Pittsburgh. The route serves the Allentown neighborhood and skirts
Capital Metro Monthly Ridership Report November 2016 (Fiscal Year 2017)
") Capital Metro Monthly Ridership Report November 2016 (Fiscal Year 2017) Page 1 of 5 Ridership Summary This is a summary of Capital Metro system-wide ridership statistics for the month of November 2016
Capital Metro Monthly Ridership Report November 2016 (Fiscal Year 2017) Page 1 of 5 Ridership Summary This is a summary of Capital Metro system-wide ridership statistics for the month of November 2016
SOUNDCAST CALIBRATION AND SENSITIVITY TEST RESULTS (DRAFT) TABLE OF CONTENTS. Puget Sound Regional Council. Suzanne Childress.
 TABLE OF CONTENTS. Puget Sound Regional Council. Suzanne Childress.") SOUNDCAST CALIBRATION AND SENSITIVITY TEST RESULTS (DRAFT) Puget Sound Regional Council Suzanne Childress June 2015 This document describes the activity-based model calibration to the 2010 using the following
SOUNDCAST CALIBRATION AND SENSITIVITY TEST RESULTS (DRAFT) Puget Sound Regional Council Suzanne Childress June 2015 This document describes the activity-based model calibration to the 2010 using the following
Capital Metro Monthly Ridership Report December 2016 (Fiscal Year 2017)
") Capital Metro Monthly Ridership Report December 2016 (Fiscal Year 2017) Page 1 of 5 Ridership Summary This is a summary of Capital Metro system-wide ridership statistics for the month of December 2016
Capital Metro Monthly Ridership Report December 2016 (Fiscal Year 2017) Page 1 of 5 Ridership Summary This is a summary of Capital Metro system-wide ridership statistics for the month of December 2016
Evan Johnson, Tindale Oliver & Associates. Alan Danaher, P.E., PTOE, AICP, PTP
 To: Copies: From: Evan Johnson, Tindale Oliver & Associates Matt Muller, RTS Jesus Gomez, RTS Alan Danaher, P.E., PTOE, AICP, PTP Date: January 14, 2014 Subject: Ridership Projections Gainesville Streetcar
DART Ridership. Board Workshop January 5, 2018
 DART Ridership Board Workshop January 5, 2018 0 Overview This presentation looks at many facets of DART s bus and rail ridership trends. No single factor can adequately explains the current trends Key
Community Transit Solutions for the Suburbs APTA Annual Meeting Steve Fittante, New Jersey Transit Corporation September 30, 2013
 Community Transit Solutions for the Suburbs APTA Annual Meeting Steve Fittante, New Jersey Transit Corporation September 30, 2013 New Suburban Challenges Lower density development patterns Where is the
Philadelphia Bus Network Choices Report
 Philadelphia Bus Network Choices Report JUNE 2018 SEPTA Table of Contents Executive Summary...7 What if transit gave us more freedom?... 8 What is this report?... 8 The main conclusions... 9 What is happening
Changing Commuting Patterns and Impacts on Planning & Infrastructure. William E. Frawley, AICP Texas A&M Transportation Institute October 3, 2013
 Changing Commuting Patterns and Impacts on Planning & Infrastructure William E. Frawley, AICP Texas A&M Transportation Institute October 3, 2013 Change is Constant... Various studies and data sources 1960
City of Davenport CitiBus Public Transportation Study. April 2015
 City of Davenport CitiBus Public Transportation Study April 2015 Overview Project Background Key Findings CitiBus Service Allocation Policy Discussion 2 Project Background 3 About CitiBus Operates 17 routes
Transportation Trends, Conditions and Issues. Regional Transportation Plan 2030
 Transportation Trends, Conditions and Issues Regional Transportation Plan 2030 23 Regional Transportation Plan 2030 24 Travel Characteristics Why Do People Travel? Over one-half of trips taken in Dane
2010 Pedestrian and Bicyclist Special Districts Study Update
 2010 Pedestrian and Bicyclist Special Districts Study Update Pedestrian and Bicyclist Special Districts Program Overview H-GAC s Special Districts Program aims to provide strategic investments in pedestrian
Arterial Transitway Corridors Study. Ave
 Arterial Transitway Corridors Study Ave January 2012 Arterial Transitway Corridors Study Overview Corridor Features and Demographics 11 study corridors, 95 route miles 86,000 daily rides and half of existing
Metropolitan Council Transportation Committee
 Nicollet-Central Transit Alternatives Metropolitan Council Transportation Committee August 2013 Project Purpose (approved by Policy Advisory Committee 10/25/2012) The purpose is to improve transit connectivity,
Arterial Transitway Corridors Study
 Arterial Transitway Corridors Study February 2012 Arterial Transitway Corridors Study Overview Corridor Features and Demographics 11 study corridors, 95 route miles Routes: 86,000 daily rides and half
Notice and Agenda of a Meeting of the Board of Directors Capital and Strategic Planning Committee
 CAPITAL and STRATEGIC PLANNING Thomas C. Lambert President & CEO COMMITTEE MEMBERS Christof Spieler, Chair Sanjay Ramabhadran Jim Robinson Cindy Siegel Lex Frieden Troi Taylor Notice and Agenda of a Meeting
Everett Transit Action Plan. Community Open House November 16, 2015
 Everett Transit Action Plan Community Open House Everett has a great location, but getting around the city and into surrounding communities is a problem for all ages Many Voices, One Future: The Everett
BEAR CREEK PARK AND RIDE
 BEAR CREEK PARK AND RIDE 7760 178th Pl NE, Redmond, WA 98052 700 Average weekday transit boardings 283 Parking spaces Owned by King County Metro Served by Sound Transit and King County Metro Bear Creek
What Are The Benefits? How RIDERSHIP + Can Help You. Select RIDERSHIP + Projects
 Ridership + is a suite of regression-based direct ridership forecasting tools that harness station area built environment variables to estimate ridership on a wide variety of transit modes. What Are The
Appendix C. NORTH METRO STATION AREA TRAFFIC IMPACT STATEMENT 88th Avenue Station
 Appendix C NORTH METRO STATION AREA TRAFFIC IMPACT STATEMENT 88th Avenue Station Prepared for: Regional Transportation Department and URS Corporation as part of the North Metro EIS David Evans and Associates,
Route 9 Davidson County Business 85 Service Equity Analysis
 Route 9 Davidson County Business 85 Service Equity Analysis Transportation is not an end in and of itself, but a means to providing access to opportunity. Source: LivingCities.org 1 P a g e This analysis
Market Factors and Demand Analysis. World Bank
 Market Factors and Demand Analysis Bank Workshop and Training on Urban Transport Planning and Reform. Baku, April 14-16, 2009 Market Factors The market for Public Transport is affected by a variety of
Capital and Strategic Planning Committee. Item III - B. April 12, WMATA s Transit-Oriented Development Objectives
 Capital and Strategic Planning Committee Item III - B April 12, 2018 WMATA s Transit-Oriented Development Objectives Page 24 of 76 Washington Metropolitan Area Transit Authority Board Action/Information
2014 Metro Transit Customer Survey Highlights
 2014 Metro Transit Customer Survey Highlights Metropolitan Council Transportation Committee - April 13, 2015 Presented by: Bruce Howard, Director of Customer Services and Marketing METHODOLOGY : Quantitative
I-20 East Transit Initiative. Stakeholder Advisory Committee Meeting September 9, :00-6:00 PM
 I-20 East Transit Initiative Stakeholder Advisory Committee Meeting September 9, 2010 4:00-6:00 PM Meeting Agenda Introductions Project Background Study Overview Role of the SAC Initial Study Findings
VI. Market Factors and Deamnd Analysis
 VI. Market Factors and Deamnd Analysis Introduction to Public Transport Planning and Reform VI-1 Market Factors The market for Public Transport is affected by a variety of factors No two cities or even
1999 On-Board Sacramento Regional Transit District Survey
 SACOG-00-009 1999 On-Board Sacramento Regional Transit District Survey June 2000 Sacramento Area Council of Governments 1999 On-Board Sacramento Regional Transit District Survey June 2000 Table of Contents
El Paso to Las Cruces Proposed Rail Service Estimated Ridership and Proposed Schedule
 to Las Cruces Proposed Rail Service Estimated Ridership and Proposed Schedule Ridership estimation is a central consideration when assessing the feasibility of a proposed transit line. A sketch model is
Midtown Corridor Alternatives Analysis
 Midtown Corridor Alternatives Analysis Ridership Forecast Methodology and Results December 2013 Prepared by the SRF Consulting Group Team for Table of Contents Introduction... 1 Methodology... 1 Assumptions...
PASSENGER SURVEY RESULTS
 ROGUE VALLEY TRANSPORTATION DISTRICT PASSENGER SURVEY RESULTS Date: December 12, 2018 Project #: 21289 To: Paige West, RVTD From: Susan Wright, PE; Molly McCormick; (Kittelson & Associates, Inc.) Subject:
I-35W Solutions Alliance Project Update July 13, 2017
 Title I-35W Solutions Alliance Project Update July 13, 2017 Evaluating the potential for Bus Rapid Transit and MnPASS Express Lanes in the southwest Metro, Investigating options for improved bus service
Notice and Agenda of a Meeting of the Capital and Strategic Planning Committee of the METRO Board of Directors
 CAPITAL and STRATEGIC PLANNING Thomas C. Lambert President & CEO COMMITTEE MEMBERS Christof Spieler, Chair Sanjay Ramabhadran Jim Robinson Cindy Siegel Lex Frieden Troi Taylor Notice and Agenda of a Meeting
Transit Operations in the I-95 Express Lanes
 Transit Operations in the I-95 Express Lanes TRB 15 th International Conference on Managed Lanes Miami, Florida Presented by Diane Quigley FDOT Transit Planning Administrator May 5, 2016 FDOT Governance
The Broadway SkyTrain Extension
 The Broadway SkyTrain Extension Grandview Woodland Citizens Assembly Lon LaClaire Manager, Strategic Transportation Planning, City of Vancouver January 24, 2015 Commercial-Broadway is a Transit Crossroads
Title. Metropolitan Council Transportation Committee December 12, Brad Larson Metro District MnDOT
 Title Metropolitan Council Transportation Committee December 12, 2016 Evaluating the potential for Bus Rapid Transit and MnPASS Express Lanes in the southwest Metro Brad Larson Metro District MnDOT Background
Capital Metro Monthly Ridership Report September 2017 (Fiscal Year-end 2017)
") Capital Metro Monthly Ridership Report September 2017 (Fiscal Year-end 2017) Page 1 of 6 Ridership Summary This is a summary of Capital Metro system-wide ridership statistics for fiscal year-end and the
Capital Metro Monthly Ridership Report September 2017 (Fiscal Year-end 2017) Page 1 of 6 Ridership Summary This is a summary of Capital Metro system-wide ridership statistics for fiscal year-end and the
I-105 Corridor Sustainability Study (CSS)
") I-105 Corridor Sustainability Study (CSS) Metro Streets and Freeways Subcommittee March 21, 2019 Gary Hamrick Cambridge Systematics, Inc. I-105 CSS Project History & Background Funded by Caltrans Sustainable
I-105 Corridor Sustainability Study (CSS) Metro Streets and Freeways Subcommittee March 21, 2019 Gary Hamrick Cambridge Systematics, Inc. I-105 CSS Project History & Background Funded by Caltrans Sustainable
BIKE AND RIDE ACCESS AND IMPLEMENTATION PLAN
 BIKE AND RIDE ACCESS AND IMPLEMENTATION PLAN Linking the region s expanding bicycle networks to transit infrastructure, implementing a prioritized set of projects that will provide attractive, safe, healthy,
July 2016 Monthly Ridership Report
 July 2016 Monthly Ridership Report Ridership Summary Executive Summary Local Bus Red Routes Blue Routes Green Routes Other Routes Community Connector Light Rail Park & Ride Note: Fo r optimal results,
Cobb Community Transit
 Cobb Community Transit Ridership Survey January 2014 1 Methodology Paper survey of 315 CCT riders 165 on local routes (margin of sampling error: ± 7.6%) 150 on express routes (margin of sampling error:
Interim Transit Ridership Forecast Results Technical Memorandum
 Interim Transit Ridership 401 South Jackson Street Seattle, WA 98104-2826 September 2012 Table of Contents 1 INTRODUCTION... 1-1 1.1 Project Background... 1-1 2 RIDERSHIP FORECASTS... 2-1 2.1 System Ridership
Monthly Ridership and Service Level Report March, Safety, Courtesy, Reliability, and the Environment
 Monthly Ridership and Service Level Report March, 2017 Safety, Courtesy, Reliability, and the Environment TABLE OF CONTENTS Glossary & Route Abbreviations 3 Summary All Routes 4 Total Ridership per Route
Cape Cod Regional Transit Authority Comprehensive Service Assessment. December 2015
 Cape Cod Regional Transit Authority Comprehensive Service Assessment December 2015 Executive Summary The Cape Cod Regional Transit Authority (CCRTA) serves a region that is both large - more the 400 square
Rail Station Fact Sheet CentrePort/DFW Airport Station
 Rail Station Fact Sheet CentrePort/DFW Airport Station Station Overview CentrePort/DFW Airport Station is located by Statler Boulevard at Breezewood Drive in Fort Worth. Free shuttles connect the station
Commuter Credits Pilot Project
 Commuter Credits Pilot Project IBTTA 2015 Washington, DC Briefing -- March 31, 2015 State and Local Innovations in Surface Transportation Funding Christopher Tomlinson Executive Director State Road and
WELCOME BUS RAPID TRANSIT PUBLIC MEETING. MEETING TIME: 5 p.m. - 8 p.m.
 WELCOME BUS RAPID TRANSIT PUBLIC MEETING MEETING TIME: 5 p.m. - 8 p.m. Milwaukee County in conjunction with the Federal Transit Administration is hosting today s meeting to give the public an opportunity
Preliminary Transportation Analysis
 Preliminary Transportation Analysis Goals of a Robust, Multimodal Transportation Network Safe Accessible/Connected Efficient Comfortable Context-Sensitive Motor Vehicle: Continue to analyze the data to
Central Oregon Intergovernmental Council
 Central Oregon Intergovernmental Council Regional Transit Master Plan (RTMP) Technical Advisory Committee Kick-Off Meeting May 16, 2012 Meeting Agenda Project Orientation Presentation of Survey Results
TRANSPORTATION & MOBILITY
 TRANSPORTATION & MOBILITY ROADWAY SYSTEM There are approximately 40 miles of roadways in Manitou Springs. For planning purposes, roadways are typically assigned a functional classification which defines
Regional Alternatives Analysis. Downtown Corridor Tier 2 Evaluation
 Regional Alternatives Analysis Downtown Corridor Tier 2 Evaluation September 19, 2011 EVALUATION PROCESS REVIEW OF EVALUATION PROCESS Tier 1: Screen Seven Alignment Options into a Short List Tier 2: Evaluate
July 23, Transit Workshop
 Agenda 1. Introductions 2. Presentation: Public Transit in Regina Review of Practices Elsewhere 3. Discussion #1: Transit Today 4. Break 5. Discussion #2: Transit Tomorrow Corridors, Service, and Amenities
Key objectives of the survey were to gain a better understanding of:
 3 COMMUNITY INPUT Community input is an essential part of corridor studies. For the SR 87 corridor study, VTA staff conducted an extensive online survey of people living and commuting along the corridor.
NJ Transit Mercer County Bus Survey
 NJ Transit Mercer County Bus Survey November 2009 The Delaware Valley Regional Planning Commission is dedicated to uniting the region s elected officials, planning professionals and the public with the
Gratiot Avenue Transit Study Tech Memo #4: Ridership
 Gratiot Avenue Transit Study Tech Memo #4: Ridership 5/31/2016 Table of Contents 1 INTRODUCTION... 3 PROJECT DESCRIPTION... 3 2 TECH MEMO #4 OVERVIEW... 5 METHODOLOGY... 5 3 THE ALTERNATIVES AND POTENTIAL
Welcome. Wilmington Transit Moving Forward Workshop Presentation. October 16, 2013
 Welcome Wilmington Transit Moving Forward Workshop Presentation October 16, 2013 Project Purpose Evaluate recommendations from previous studies Wilmington Downtown Circulation Study (WDCS) 2012 State Smart
EXECUTIVE SUMMARY... vii 1 STUDY OVERVIEW Study Scope Study Area Study Objectives
 Contents EXECUTIVE SUMMARY... vii 1 STUDY OVERVIEW... 1-1 1.1 Study Scope... 1-1 1.2 Study Area... 1-1 1.3 Study Objectives... 1-3 2 EXISTING CONDITIONS... 2-1 2.1 Existing Freeway Conditions... 2-4 2.1.1
VIRGINIA BEACH TRANSIT EXTENSION STUDY
 Dra Environmental Impact Statement VIRGINIA BEACH TRANSIT EXTENSION STUDY Appendix K Travel Forecast February 2015 Cover image: courtesy of the City of Virginia Beach Virginia Beach Transit Extension Study
METRO Now. Transit Leader. One of only four urban. gain bus ridership in Purple and Green Lines. Red Line is one
 Transit Leader Our commuter buses provide 8 million trips each year third most trips of any U.S. transit agency. 1 One of only four urban transit agencies in the country to gain bus ridership in 2016 2
2016 REGIONAL ORIGIN AND DESTINATION STUDY TDCHR WORKSHOP APRIL 27, 2017
 2016 REGIONAL ORIGIN AND DESTINATION STUDY TDCHR WORKSHOP APRIL 27, 2017 WORKSHOP AGENDA 2016 Regional Origin & Destination (O&D) Study Purpose Methodology How our Riders use the HRT System? Who Are Our
More buses on the way: Balancing act, changes coming to Snoqualmie Valley transit Photos
 Snoqualmie Valley Record 5/3/2013 http://www.valleyrecord.com/news/210001291.html More buses on the way: Balancing act, changes coming to Snoqualmie Valley transit Photos Carol Ladwig/Staff Photo Nearly
ITS-NY ANNUAL MEETING Bus Rapid Transit in New York City: Bus Lane Operations on One-Way Arterial Streets
 ITS-NY ANNUAL MEETING Bus Rapid Transit in New York City: Bus Lane Operations on One-Way Arterial Streets June 9, 2011 Ted Orosz AICP, Director Long Range Bus Planning MTA New York City Transit 1 Overview
Appendix T 1: Additional Supporting Data
 Appendix T 1: Additional Supporting Data Project Delivery Delays with the implementation of the 2000 TIP became apparent early in the decade. In response to direction among policy officials, ARC began
Webinar- Importance of Multi- Modal Transit Connections and Fare Policy for Regional Transit Mobility & Equity
 Webinar- Importance of Multi- Modal Transit Connections and Fare Policy for Regional Transit Mobility & Equity Thomas Marchwinski Metro North RR (Previously with NJ Transit) Importance of Multi-Modal Transit
REGIONAL HOUSEHOLD TRAVEL SURVEY:
 Defining the Vision. Shaping the Future. REGIONAL HOUSEHOLD TRAVEL SURVEY: Profile Why we travel How we travel Who we are and how often we travel When we travel Where we travel How far and how long we travel
Westside Transportation Access Needs Assessment - Short and Long Term Improvements
 ABSTRACT The Los Angeles County Metropolitan Transportation Authority (MTA) adopted the 2001 Long Range Transportation Plan (LRTP), which sets out the County s transportation investments for the next 20-25
Title VI Fare Change Equity Analysis
 Title VI Fare Change Equity Analysis Evaluation Report Submitted to Dallas Area Rapid Transit Submitted by TranSystems June 2012 Title VI Fare Change Equity Analysis Introduction DART has proposed a schedule
US 19 Pedestrian and Bicycle Safe Access to Transit Corridor Study
 US 19 Pedestrian and Bicycle Safe Access to Transit Corridor Study DRAFT Technical Memorandum #3 Active Bus Stop Review and Observations August 2016 Prepared for: FLORIDA DEPARTMENT OF TRANSPORTATION DISTRICT
Appendix F: Detailed Modeling Results
 Appendix F: Detailed Modeling Results TransAction Technical Report (This page intentionally left blank) METHODOLOGY FOR CALCULATION OF PERFORMANCE MEASURES F-3 (This page intentionally left blank) Approved
VIRGINIA RAILWAY EXPRESS
 PREPARING FOR THE NEXT QUARTER-CENTURY Arlington County Board Work Session June 28, 2017 1 TODAY S PRESENTATION VRE Overview VRE in Arlington County VRE System 2040 Plan Future Vision for Crystal City
THE 2010 MSP REGION TRAVEL BEHAVIOR INVENTORY (TBI) REPORT HOME INTERVIEW SURVEY. A Summary of Resident Travel in the Twin Cities Region
 REPORT HOME INTERVIEW SURVEY. A Summary of Resident Travel in the Twin Cities Region") THE 2010 MSP REGION TRAVEL BEHAVIOR INVENTORY (TBI) REPORT HOME INTERVIEW SURVEY A Summary of Resident Travel in the Twin Cities Region October 2013 WHAT IS THE TBI? The Travel Behavior Inventory (TBI)
THE 2010 MSP REGION TRAVEL BEHAVIOR INVENTORY (TBI) REPORT HOME INTERVIEW SURVEY A Summary of Resident Travel in the Twin Cities Region October 2013 WHAT IS THE TBI? The Travel Behavior Inventory (TBI)
Intermodal Connections with Light Rail in Phoenix, AZ Wulf Grote, P.E. Director, Planning & Development
 Intermodal Connections with Light Rail in Phoenix, AZ Wulf Grote, P.E. Director, Planning & Development 12th National LRT Conference Salt Lake City, UT November 12, 2012 Outline METRO Light Rail Overview
TRB Managed Lanes Conference May 22 24, 2012, Oakland, CA
 HOT LLanes and d TTransit i P f Performance TRB Managed Lanes Conference May 22 24, 2012, Oakland, CA Miami UPA Transit Results (2008 2010 Data) Miami UPA Transit Improvements 2 new routes Dade-Broward
Model Applications for Oakland Park Boulevard Transit Corridor Study
 Model Applications for Oakland Park Boulevard Transit Corridor Study Southeast Florida FSUTMS Users Group June 13, 2014 Vikas Jain, AICP, GISP FDOT District Four Auditorium 3400 West Commercial Boulevard,
Benefits for the Bronx, Brooklyn, Queens and Staten Island
 Congestion Pricing for New York: Benefits for the Bronx, Brooklyn, and Staten Island Prepared for the Coalition for Traffic Relief April 007 Schaller Consulting 94 Windsor Place, Brooklyn, NY (78) 768-3487
TORONTO TRANSIT COMMISSION REPORT NO.
 Form Revised: February 2005 TORONTO TRANSIT COMMISSION REPORT NO. MEETING DATE: May 30, 2012 SUBJECT: ADDITIONAL OPERATING RESOURCE REQUIREMENTS TO MEET INCREASING TTC RIDERSHIP ACTION ITEM RECOMMENDATIONS
Topics To Be Covered. Summarize Tier 2 Council Direction Discuss Mill and Ash Alternatives Next Steps
 Topics To Be Covered Summarize Tier 2 Council Direction Discuss Mill and Ash Alternatives Next Steps Tier 2 Council Direction Dismiss Bus Rapid Transit along the Union Pacific Railroad Dismiss Bus Rapid
I-20 East Transit Initiative
 I-20 East Transit Initiative Public Meetings Tuesday, October 26 DeKalb Medical Center Hillandale Community Room 2801 DeKalb Medical Parkway Lithonia, GA 30058 6:00pm 8:00pm Wednesday, October 27 East
BID Strategy Group and Stakeholders Meeting. April 17, 2018
 BID Strategy Group and Stakeholders Meeting April 17, 2018 Agenda Meeting Objectives Background Short-Term Improvements Long-Term Study Goals Data Review Schedule & Next Steps Open House April 17, 2018
Rail Station Fact Sheet University of Dallas Station
 Rail Station Fact Sheet University of Dallas Station Station Overview University of Dallas Station is located on John Carpenter Freeway and west of Loop 12 across from the University of Dallas in Irving.
DAILY TRIPS (OUTBOUND/INBOUND) Weekdays 6:05 AM to 11:23 PM 30/30/ /28 Saturday 6:15 AM to 8:23 PM 60/60 24/23 Sunday / /
 Weekdays 6:05 AM to 11:23 PM 30/30/ /28 Saturday 6:15 AM to 8:23 PM 60/60 24/23 Sunday / /") ROUTE 6 Shelburne Road SERVICE DESIGN Figure 1: Route Map Route 6 is a Major Local route that operates between Shelburne and the Burlington Downtown Transit Center (DTC). The route travels primarily along
ROUTE 6 Shelburne Road SERVICE DESIGN Figure 1: Route Map Route 6 is a Major Local route that operates between Shelburne and the Burlington Downtown Transit Center (DTC). The route travels primarily along
Project Narrative. Albuquerque, NM. July 31, 2015
 Project Narrative Albuquerque, NM July 31, 2015 1 Project Identification As the first bus rapid transit (BRT) project in New Mexico, the Albuquerque Rapid Transit (ART) line will run through the heart
Highway Transitway Corridor Study
 Highway Transitway Corridor Study CTS Research Conference May 21, 2014 1 2030 Transportation Policy Plan Transitway modes on highways: Highway bus rapid transit (BRT), plan identified 6 total Highway BRT
Tunnel Reconstruction South 5 th Street Association October 16, 2018
 Tunnel Reconstruction South 5 th Street Association October 16, 2018 Reconstructing the Tunnel 2 Service During Tunnel Reconstruction April 2019 through July 2020 3 Projected Cross River Travel Paths of
Feasibility Study of Pedestrian Crossings Along Route 7, East of Cascades Parkway and West of Dranesville Road. October 3, 2017
 Feasibility Study of Pedestrian Crossings Along Route 7, East of Cascades Parkway and West of Dranesville Road October 3, 2017 Study Area (area within a ¼-mile radius of the study intersections) Route
SOLTRANS BOARD MEETING SUPPLEMENTAL REPORTS / HANDOUTS January 15, 2015 MEETING HANDOUTS
 SOLTRANS BOARD MEETING SUPPLEMENTAL REPORTS / HANDOUTS January 15, 2015 MEETING HANDOUTS Agenda Item 10 January 2015 System Improvements Update - PowerPoint Presentation Agenda Item 12 Construction Projects
Cotton Belt Corridor Regional Rail Project
 Cotton Belt Corridor Regional Rail Project Ridership July 2013 Prepared by URS Corporation Prepared for Dallas Area Rapid Transit General Planning Consultant Managed by URS Corporation Document Revision
Capital Metro Monthly Ridership Report January 2018 (Fiscal Year 2018)
") Capital Metro Monthly Ridership Report January 2018 (Fiscal Year 2018) Page 1 of 5 Ridership Summary This is a summary of Capital Metro system-wide ridership statistics for the month of January 2018 by
Capital Metro Monthly Ridership Report January 2018 (Fiscal Year 2018) Page 1 of 5 Ridership Summary This is a summary of Capital Metro system-wide ridership statistics for the month of January 2018 by
METRO Light Rail: Changing Transit Markets in the Phoenix Metropolitan Area
 METRO Light Rail: Changing Transit Markets in the Phoenix Metropolitan Area Abhishek Dayal, AICP Planner III, METRO Light Rail Phoenix, AZ BACKGROUND Transit in the Phoenix Region Transit services in the
DAILY TRIPS (OUTBOUND) Monday-Friday 6:45 AM to 7:40 PM 30/30/30 26 Saturday 6:45 AM to 6:40 PM 30/30 24 Sunday - - -
 Monday-Friday 6:45 AM to 7:40 PM 30/30/30 26 Saturday 6:45 AM to 6:40 PM 30/30 24 Sunday - - -") ROUTE 8 City Loop SERVICE OVERVIEW Route 8 is an Urban Local route that operates as a one-way loop serving the Downtown Transit Center (DTC), Fern Hill, McAuley Square, UVM s Waterman Building, and Champlain
ROUTE 8 City Loop SERVICE OVERVIEW Route 8 is an Urban Local route that operates as a one-way loop serving the Downtown Transit Center (DTC), Fern Hill, McAuley Square, UVM s Waterman Building, and Champlain