City of San Francisco 2010 Bicycle Count Report
|
|
|
- Cori West
- 5 years ago
- Views:
Transcription


1 City of San Francisco 2010 Bicycle Count Report November
2 Table of Contents Page No. List of Tables & Figures 2 Report Highlights 3 Introduction 4 Methodology 6 Results 6 Recommendations 12 Conclusions 18 List of Appendices 20 Appendix A: Weather Report ( ) 21 Appendix B: 2010 Bicycle Count Locations 24 Appendix C: Sidewalk Riders 25 Appendix D: Wrong Way Riders 26 Appendix E: Helmet Usage 27 Appendix F: Rider Gender 28 Appendix G: San Francisco Bicycle Count Data 29 Appendix H: San Francisco Bicycle Count Data 30 Appendix I: San Francisco Bicycle Count Data 31 Appendix J: Downtown Cordon Counts ( ) 32 Appendix K: Non-Downtown Cordon Counts ( ) 33 1
3 List of Tables and Figures Tables Table 1: San Francisco Citywide Bicycle Counts ( ) Table 2: American Community Survey Percentage of Bicycle Trips Table 3: American Community Survey Travel Mode to Work Percent Change: Table 4: San Francisco Bicycle Count Data Table 5: San Francisco Bicycle Count Data Table 6: Downtown and Non-Downtown Count Locations Table 7: Rider Gender ( ) and Helmet Use ( ) Table 8: Helmet Use ( ) Table 9: Most Frequent Sidewalk Riding Locations Table 10: Percent of Weekend and Weekday Ridership on Fell Street, 2010 Table 11: Weekend and Weekday ridership variation westbound Fell Street Table 12: Monthly Ridership s for 2009 and 2010 for Westbound Fell Street Table 13: Proposed 1st Phase of Automated Counter Locations Table 14: Number of High Volume Locations by Year Figures Figure 1: San Francisco Citywide Bicycle Counts ( ) Figure 2: American Community Survey Travel Mode to Work Percent Change: Figure 3: Percent of Weekend and Weekday Ridership on Fell Street, 2010 Figure 4: Weekend and Weekday Ridership Variation Westbound Fell Street Figure 5: Monthly Ridership s for 2009 and 2010 for westbound Fell Street 2
4 Report Highlights The 2010 counts showed a 3 percent overall increase in the number of observed bicyclists in comparison to the 2009 counts (Figure 1). Since the 2006 baseline counts, there has been a 58 percent increase in the number of observed bicyclists. In 2010, the location with the most observed bicyclists was 11 th Street at Market Street, totaling 818 bicyclists. This was a 50 percent increase from Women represented 28 percent of bicyclists in 2010, down from 29 percent in 2009, and up from 27 percent in The level of helmet use increased slightly from 69 percent in 2009 to 71 percent in Figure 1: San Francisco Citywide Bicycle Counts ( )* 10,000 9,000 8,441 8,713 8,000 7,000 6,334 7,884 Non Downtown locations Number of bicyclists 6,000 5,000 4,000 3,000 2,000 1,000 5,500 3,683 3,105 2,395 2,1 5,075 5,010 4,509 3,375 3,431 3,638 Downtown locations * For comparison purposes these totals exclude all count locations which were omitted from any previous results (JFK/Transverse, Illinois St. Bridge, Ferry Building)
5 Table 1: San Francisco Citywide Bicycle Counts ( )* Downtown locations 2,395 2,1 3,375 3,431 3,638 Non-Downtown locations 3,105 3,683 4,509 5,010 5,075 s* *For comparison purposes, these totals exclude all count locations which were omitted from any previous results (JFK & Transverse, Illinois St. Bridge, Ferry Building). Introduction In August 2006, the San Francisco Municipal Transportation Agency (SFMTA) Bicycle Program conducted its first citywide bicycle count, with the goal of establishing a baseline of bicycling use in the City. Since then, the SFMTA has continued with bicycle counts in the first three weeks of August. The data gathered from the last five years has enabled the SFMTA to identify and measure some basic trends in bicycle ridership throughout San Francisco. The bicycle counts also inform the ongoing bicycle planning efforts in the City, providing data needed to evaluate the efficacy and efficiency of the City's bicycle network, as well as identifying locations where there is a need for additional infrastructure improvements. The SFMTA bicycle counts are not meant to measure the exact number of people who use bicycles in San Francisco, nor are they intended to determine travel mode split. These counts are designed to help identify basic trends in bicycle use over time. Identifying the exact level of bicycle ridership in San Francisco is better accomplished through a combination of U.S. Census results, a representative survey of City residents, and automated bicycle counters.1 These data sources are summarized in the San Francisco State of Cycling Report. As shown in Table 1, the overall travel to work mode split for bicycling in San Francisco has increased since 2003 from 1.9 to 3.2 percent in 2009, or a 68 percent change, while the state of California and the U.S. percentage of bicycle trips to work have stayed relatively constant. Figure 2 presents the percent change in all modes to work between 2006 and As it shows, bicycling has the most consistent and largest increase over the four year period. Table 2: American Community Survey Percentage of Bicycle Trips to Work SF CA US Percentage of trips to work by bicycle (2003 ACS)* 1.9% 0.7% 0.4% Percentage of trips to work by bicycle (2006 ACS)* 2.5% 0.8% 0.5% Percentage of trips to work by bicycle (2007 ACS)* 2.7% 0.9% 0.5% Percentage of trips to work by bicycle (2009 ACS)* 3.2% 1.0% 0.6% Estimated percentage of all trips by bicycle (2008)** 6.0% Estimated daily number of bicycle trips (2008)** 128,000 1 Please see discussion of automated bicycle counters in the Recommendations section. 4
6 SF CA US * Does not include workers who worked at home. Source: American Community Survey, B08301 ** Source: Figure 2: American Community Survey Travel Mode to Work Percent Change: Percent Change Relative To % 40% 30% 20% 10% 0% Bicycle Public Transit Drove Alone Walk Carpool Other 10% 2006 ACS 2007 ACS 2008 ACS 2009 ACS Year and Data Source Table 3: American Community Survey Travel Mode to Work Percent Change: ACS 2007 ACS 2008 ACS 2009 ACS Drove Alone 0.0% 0.9% 6.4% 6.5% Carpool 0.0% -3.5% 21.5% 6.9% Public Transit 0.0% 14.8% 18.0% 16.2% Walk 0.0% 6.1% 9.7% 19.2% Bicycle 0.0% 17.6% 34.7% 45.7% Other 0.0% 18.6% -1.4% -5.5% The SFMTA bicycle counts seek to complement this mode split data by offering a more detailed profile of bicyclist activity at key intersections throughout the City. While only a snapshot of bicycle use over a brief amount of time, the counts provide useful insights into bicycle use from year to year and remain a key metric for the SFMTA bicycle planning and implementation efforts. 5
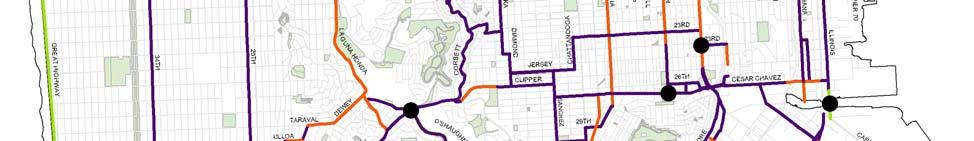
7 Methodology Since 2006, all of the San Francisco bicycle counts have been conducted in August due to the typically dry weather and longer days that generally encourage bicycling, as well as the availability of SFMTA summer interns to assist with the counts. All of the counts were performed manually by SFMTA staff. All observers attended an hour-long training session prior to field observation. A total of 35 counts were conducted at 33 locations, with 31 counts occurring during the evening peak period, from 5:00-6:30 PM. Three counts took place in the morning peak period, from 8:00-9:00 AM, and one during the midday period, from 1:00-2:00 PM. Bicyclists at 5th and Market Streets were counted during all three periods. Counts were only conducted when it was not raining. A detailed weather report for the counts can be found in Appendix A. Counts were focused around the downtown core to capture the volume of bicycle commuters on some of the City s most heavily used bicycle routes. Twelve of the thirtythree locations were counted simultaneously on August 12th as part of the downtown cordon count in order to capture travel in and out of the downtown core. Conducting counts at multiple locations on the same day may result in counting the same bicyclists at multiple locations. For example, a bicyclist may pass two or three locations when leaving the downtown core. This cyclist is considered a new count at each location. Since the SFMTA has conducted counts at consistent locations since 2006, this effect is normalized into the overall volume numbers. A secondary cordon, established approximately midway across the City along key bicycle routes, was used to count cross-town riders. The secondary cordon counts were not conducted simultaneously but were spaced out over a three week period. Lastly, some count locations were in outlying neighborhoods. Most count locations were at the intersection of two bicycle routes in order to maximize coverage of the City s bicycle route network. A map of the count locations is shown in Appendix B. At each count location, bicyclists on all legs of an intersection were counted manually, with each movement noted left turn, right turn, and straight through the intersection. Bicyclists riding on sidewalks were counted and grouped separately from bicyclists riding on the street (Appendix C). Wrong-way riders were also counted (Appendix D). At locations where the volume of bicyclists was not as high, demanding all of the attention of the observer, helmet use and cyclist gender were also recorded (Appendix E and Appendix F). 2 Locations where portions of the data were not collected are noted in the appendices. Results The 2010 counts, presented in Table 2 and Table 3, show a 3 percent increase in the number of observed bicyclists compared to the 2009 counts, and an overall 58 percent increase from the 2006 baseline counts.3 In comparison, the increase from 2008 to 2 See discussion of high volume locations in the Recommendations section. 3 All longitudinal comparisons omit the JFK/Transverse, Ferry Building, and 3 rd /Illinois Street Bridge counts because these locations were not included in earlier counts for various reasons. 6
8 2009 was 8 percent, 25 percent from 2007 to 2008, and 14 percent from 2006 to Results from previous years are in Appendices G, H, and I. Table 4: San Francisco Bicycle Count Data Intersection Time* % Change ( ) 11th & Howard PM % 11th & Market PM % 14th & Folsom AM % 17th & Valencia PM % 23rd & Potrero PM % 2nd & Townsend PM % 3rd St. Bridge / Illinois St. Bridge PM % 5th & Market Midday % 5th & Market PM % 5th & Market AM % 5th & Townsend PM % 7th & 16th PM % 7th & Kirkham PM % 8th & Townsend PM % Alemany & Geneva PM % Arguello & Lake PM % Broadway & Columbus PM % Broadway & Embarcadero PM % Cervantes & Marina PM % Cesar Chavez & Harrison PM % Embarcadero & Townsend PM % Ferry Building Terminals** PM % Fell & Scott PM % Golden Gate & Masonic PM % Great Highway & Sloat PM % Illinois & Mariposa/Terry Francois PM % JFK & Transverse*** PM % Lake Merced & Winston PM % Masonic & Panhandle AM % McAllister & Polk PM % O'Shaughnessy & Portola PM % Page & Scott PM % Polk & Sutter PM % Randall & San Jose PM % Stockton & Sutter PM % 1. TOTALS % 2. TOTALS** % * AM: 8AM 9 AM, Midday: 1 PM 2 PM, PM: 5 PM 6:30 PM ** Due to the high variability in tourists and ferry schedules between years, these totals exclude the Ferry Terminal counts. 4 A table comparison of the 2006 to 2007 and 2007 to 2008 counts can be found in Appendices C&D. 7
9 Intersection Time* % Change ( ) ***Count for JFK/Transverse was found to be inaccurate. For comparison purposes, JFK/Transverse was omitted from these totals. A map showing the relative distribution of bicyclists counted can be found in Appendix B. Table 5: San Francisco Bicycle Count Data Intersection Time* % Change ( ) 11th & Howard PM % 11th & Market PM % 14th & Folsom AM % 17th & Valencia PM % 23rd & Potrero PM % 2nd & Townsend PM % 3rd St. Bridge / Illinois St. Bridge PM % 5th & Market Midday % 5th & Market PM % 5th & Market AM % 5th & Townsend PM % 7th & 16th PM % 7th & Kirkham PM % 8th & Townsend PM % Alemany & Geneva PM % Arguello & Lake PM % Broadway & Columbus PM % Broadway & Embarcadero PM % Cervantes & Marina PM % Cesar Chavez & Harrison PM % Embarcadero & Townsend PM % Embarcadero to/from Ferry PM % Building** Fell & Scott PM % Golden Gate & Masonic PM % Great Highway & Sloat PM % Illinois & Mariposa/Terry Francois PM % JFK & Transverse*** PM % Lake Merced & Winston PM % Masonic & Panhandle AM % McAllister & Polk PM % O'Shaughnessy & Portola PM % Page & Scott PM % Polk & Sutter PM % Randall & San Jose PM % Stockton & Sutter PM % 1. TOTALS TOTALS** %
10 Intersection Time* % Change ( ) * AM: 8AM 9 AM, Midday: 1 PM 2 PM, PM: 5 PM 6:30 PM ** Due to the high variability in tourists and ferry schedules between years, these totals exclude the Ferry Terminal counts. ***Count for JFK/Transverse was found to be inaccurate. For comparison purposes, JFK/Transverse was omitted from these totals. A map showing the relative distribution of bicyclists counted can be found in Appendix B. The observed increases in bicycle ridership are especially significant when viewed in light of the court injunction against the City s Bicycle Plan. The injunction, which began in November of 2006, prevented the City from installing new bicycle facilities, such as bicycle lanes, shared roadway pavement markings, (sharrows), and bicycle racks, until June Despite a lack of improvements or additions to the City s bicycle route network during this span, bicycling in San Francisco increased. Given the myriad of factors that contribute to bicycle use, it is difficult to estimate if there would have been a larger increase in bicyclist use over this time period if the injunction had not been in place. Although the percent increase from 2009 to 2010 is lower than that from 2008 to 2009, it is clear that an increasing number of San Franciscans are choosing to travel by bicycle and this growth trend continues to emphasize the need for adequate and safe bicycling facilities and programs. This slight decrease compared to other years may be a result of the unusually cold weather conditions on the count days. Downtown vs. Non-Downtown Results The downtown count locations showed a 6 percent increase in bicycle volumes from 2009 to The non-downtown locations showed a 1 percent increase in bicycle volumes from 2009 to Table 4 presents the downtown and non-downtown locations. Results of the downtown and non-downtown counts are in Appendices J and K. Table 6: Downtown and Non-Downtown Count Locations Downtown 11th & Howard 11th & Market 2nd & Townsend 5th & Townsend 8th & Townsend Broadway & Columbus Broadway & Embarcadero Non-Downtown 14th & Folsom 17th & Valencia 23rd & Potrero 3rd St. Bridge / Illinois St. Bridge 5th & Market 7th & 16th 7th & Kirkham 5 There are approximately 258 miles of streets or paths in San Francisco that have bicycling facilities - Class I (bike path), II (bike lane), or III (shared roadway pavement markings or sharrows ). 9
11 Downtown Embarcadero & Townsend Ferry Building Terminals McAllister & Polk Polk & Sutter Stockton & Sutter Non-Downtown Alemany & Geneva Arguello & Lake Cervantes & Marina Cesar Chavez & Harrison Fell & Scott Golden Gate & Masonic Great Highway & Sloat Illinois & Mariposa/Terry Francois JFK & Transverse Lake Merced & Winston Masonic & Panhandle O'Shaughnessy & Portola Page & Scott Randall & San Jose These numbers show a variation in the growth rate from last year, but continue to show bicycling increases in both the downtown cordon and outlying neighborhood routes. The SFMTA will continue to monitor downtown versus non-downtown bicycle ridership, especially as new facilities are installed in the coming months and years. Rider Gender and Helmet Use Rider gender and helmet usage were not measured at all count locations from 2006 to This is due to the challenges presented by high volume locations (see discussion of "high volume" locations below). Despite the challenges of capturing rider characteristics at high volume locations, generally consistent trends in the data have been established over the past five years of counts. The observed proportions of male and female bicyclists continue to suggest that the majority of people using bicycles in San Francisco are male. As Table 5 presents, in 2010, 72 percent of counted cyclists were male and 28 percent were female. However, the counts suggest that the overall number of female riders may be increasing, albeit at a slow rate. Since 2006, the female share of bicyclists has increased from 25 to 28 percent. 10
12 Table 7: Rider Gender ( ) % Male % Female As Table 6 presents, the level of observed helmet usage increased slightly from 2009 to 2010 (69 percent to 71 percent) and showed an overall increase of six percent from the base line counts in 2006 ( percent to 71 percent). Table 8: Helmet Use ( ) % Helmet % No Helmet More detailed numbers on rider gender and helmet use are available in Appendices E and F. The SFMTA will continue to monitor trends in bicyclist demographics and helmet usage. More detailed information on bicyclist demographics can be found in the 2008 State of Cycling Report and the next State of Cycling Report that will be released in Sidewalk & Wrong-Way Riding As San Francisco continues to move forward with planning and constructing a continuous network of bicycle facilities, the bicycle counts reinforce the need to pay close attention to both sidewalk and wrong-way riding. At almost every count location sidewalk and/or wrong-way riding was observed. Locations in Table 7 have the highest percentages of sidewalk riding. Table 9: Most Frequent Sidewalk Riding Locations Percent of Directions Location Cyclists with riding on Sidewalk Sidewalk Riding East, Alemany at Geneva 28 West, Golden Gate at Masonic Portola at O Shaughnessy South North, South East, West, North Existing Bicycle Facility Type Shared Roadway and Signed Route Bike Lane and Signed Route Signed Route At all of the count locations, the percentage of people riding the wrong-way was much lower overall than in previous years, with the highest share being 16 percent at Randall 6 Percentages are based on total reported total male/female riders not on the total number of bicyclists counted citywide. 11
13 and San Jose Streets. Appendices C and D include more information on sidewalk and wrong-way riding. The SFMTA does not condone wrong-way and sidewalk riding by adults because they are illegal and can endanger the people riding and other roadway users. At the same time, the observation of such behavior can highlight segments of the bicycle network where people perceive unsafe conditions or where certain facilities may be lacking. The SFMTA will continue to monitor sidewalk and wrong-way riding and implement additional bicycle safety and education campaigns on these two cycling behaviors Weather Conditions The 2010 counts took place during a particularly cold three weeks in August and it is likely these conditions had some negative consequence on ridership totals. With the implementation of more automated counters throughout the city, a better understanding of how weather affects ridership can be developed. More weather data is available in Appendix A. Recommendations Make the Transition to September Bicycle Counts The National Bicycle and Pedestrian Documentation Project (NBPD) is an annual bicycle and pedestrian count and survey effort sponsored by the Institute of Transportation Engineers Pedestrian and Bicycle Council. It seeks to establish a standardized bicycle and pedestrian count methodology and disseminate this methodology to cities across the country. The ultimate goal is to develop a national database of count information that will provide bicycle and pedestrian planners with crucial data to support their work. The NBPD has established September as the ideal month for conducting bicycle and pedestrian counts given the mild weather conditions and less variability due to summer vacations. Conducting bicycle counts in September, however, has been a great challenge for the SFMTA. The bicycle counts require a mobilization of a tremendous amount of staff resources roughly 20 part-time counters and one full-time staff member to coordinate the counts, compile the data, and write the report. As a result, the SFMTA has relied heavily on its summer intern program to support the bicycle counts, and, unfortunately, most of the summer interns have returned to school by September. It is recommended that the counts continue occurring in August as performed since However, the SFMTA will provide the NBPD with count data for the month of September when the automated bicycle counter pilot program expands in (see discussion below). Only 13 of the 33 count locations, however, will be covered by the initial phase of automated bicycle counters. Therefore, manual counts will still be required until expanded implementation. Prioritize Installation of Automated Bicycle Counters While the manual citywide bicycle counts have allowed the SFMTA to identify various bicycling trends, they only produce a snapshot of bicycling in the San Francisco. In 12
14 order to address many of the limitations of the manual counts and to provide continuous data on bicycle ridership throughout the City, the SFMTA is currently working to install automated bicycle counters at 13 locations. Automated bicycle counters are a proven technology that provides continuous streams of ridership data in a fast and costeffective manner. San Francisco s first automated counter started collecting data in March 2009 on Fell Street between Scott and Divisadero Streets. This pilot project has enabled the SFMTA to test ZELT Inductive Loop Counters.7 Inductive loop counters are installed 1 to 3 inches below the road surface and each time a bicycle travels over the loop, the system detects its electromagnetic signature and registers a count. These counters are invisible to the public and are designed to distinguish between bicyclists and other users of the street, such as automobiles or pedestrians. Furthermore, they require minimal maintenance, as the batteries last for approximately one year. The counts collected at this location using the automated counter have proven to be accurate. An analysis was performed comparing the manual counts from the Fell Street and Scott Street location with the automated count data on Fell Street from the same day. The results between the two data sets were less than a 10 percent difference in accuracy. Figures 3, 4, and 5 offer a brief summary of the automated count data collected on Fell Street. This type of robust data will enable the SFMTA to track changes in bicycle ridership more accurately. Figure 3 presents the percent of users on weekends and weekdays. As the figure shows, 71 percent of bicycle ridership occurs Monday through Friday and 29 percent occurs on Saturday and Sunday. Figure 3: Percent of Weekend and Weekday Ridership on Fell Street, 2010 Weekend 29% Weekday 71% Table 10: Percent of Weekend and Weekday Ridership on Fell Street, Weekday 71.2% Weekend 28.8% 100.0% 7 See for more information. 13
15 Figure 4 presents the bicycling peak hours for weekdays and weekends. The peak percent of trips on weekdays occurs between 5:00 PM and 6:00 PM (14 percent) and the peak percent of trips on weekend trips occur between 1:00 PM and 2:00 PM (9 percent). Fell Street is a one-way street, outbound from downtown, therefore it does not have a peak in counts during the AM commute time like a typical two-way street. Figure 4: Weekend and Weekday Ridership Variation Westbound Fell Street 16.0% Percentage of Daily Use 14.0% 12.0% 10.0% 8.0% 6.0% 4.0% 2.0% 0.0% 12:00 AM 1:00 AM 2:00 AM 3:00 AM 4:00 AM 5:00 AM 6:00 AM 7:00 AM 8:00 AM 9:00 AM 10:00 AM 11:00 AM 12:00 PM Time of Day 1:00 PM 2:00 PM 3:00 PM 4:00 PM 5:00 PM 6:00 PM 7:00 PM 8:00 PM 9:00 PM 10:00 PM 11:00 PM 2010 Weekday 2010 Weekend Table 11: Weekend and Weekday Ridership Variation Westbound Fell Street Hour 2010 Weekend 2010 Weekday 12:00 AM 2.8% 1.5% 1:00 AM 2.0% 0.8% 2:00 AM 1.4% 0.4% 3:00 AM 0.6% 0.2% 4:00 AM 0.2% 0.1% 5:00 AM 0.3% 0.5% 6:00 AM 0.9% 1.7% 7:00 AM 1.8% 3.1% 8:00 AM 3.6% 4.1% 9:00 AM 5.4% 3.6% 10:00 AM 6.3% 3.4% 11:00 AM 6.8% 3.4% 12:00 PM 8.2% 3.8% 1:00 PM 9.4% 4.3% 2:00 PM 9.0% 4.4% 3:00 PM 7.9% 5.1% 4:00 PM 6.8% 7.0% 14
16 Hour 2010 Weekend 2010 Weekday 5:00 PM 6.1% 13.2% 6:00 PM 5.5% 13.7% 7:00 PM 4.2% 8.4% 8:00 PM 3.2% 5.6% 9:00 PM 2.6% 4.8% 10:00 PM 2.8% 4.0% 11:00 PM 2.3% 3.0% 100.0% 100.0% Figure 5 highlights the growth of cycling during the spring and summer months when the counter was installed. This chart reveals an overall increase in volumes for every month of data available between the two years. Noted in the figure are the percent increases for every month between 2009 and The overall average percent increase from March to September was 26 percent. Figure 5: Monthly Ridership s for 2009 and 2010 for westbound Fell Street 60,000 50,000 40, Counts 2010 Counts 53% 11% 28% 23% 23% 17% 27% Bicycles 30,000 20,000 10,000 0 Mar Apr May Jun Jul Aug Sep Month Table 12: Monthly Ridership s for 2009 and 2010 for Westbound Fell Street Increase March 25, % April 34, % May 33, % June 36, % July 36, % August 40, % September 41, % 15
17 As Table 8 presents, within the next year, the SFMTA will be installing the first phase of 22 counters at 13 locations throughout the City. It is the goal of the SFMTA to eventually install automated counters at all 33 count locations throughout the City. Table 13: Proposed 1st Phase of Automated Counter Locations On Approaching Number of Counters 1 Panhandle Path Masonic Avenue 1 2 Market Street 11th Street/Van Ness Avenue 2 3 7th Avenue and Kirkham Street Potrero Avenue 23rd Street 2 5 North Point Street Polk Street 2 6 Polk Street Grove Street 1 7 Grove Street Polk Street 1 8 Valencia Street 14th Street th Street Julian Avenue (east of Valencia) 1 10 Arguello Boulevard and Lake Street Clipper Street High Street and Clipper Terrace 1 12 Golden Gate Avenue west of Baker Street 1 13 Baker Street south of Golden Gate Avenue 1 22 The primary drawback of the automated bicycle counters is their inability to detect rider gender, helmet usage, or to document other forms of bicyclist behavior. The SFMTA will continue with its annual bicycle counts until all of the automated counters have been installed. It is recommended that the SFMTA continue to utilize manual counts on a systematic basis to not only monitor rider gender, helmet usage, and ground conditions at the locations, but also to validate the automated counts. Closely Monitor Count Locations Special attention should continue to be paid at downtown locations, as they can be more difficult to count than periphery locations given the high volume of bicyclists. Furthermore, due to close proximity to AT&T Park, bicycle counts can be distorted if they are conducted on days when a ballgame or other major event is scheduled. For consistency, counts should continue to be taken on days when events are not scheduled. Properly Account for High Volume Locations While the observed increase in bicycling is a trend to be celebrated, the sheer volume of people on bicycles at many of the count locations presents another set of challenges for 16
18 the annual bicycle count. As Table 9 shows, in 2010 there were 12 locations where more than 300 bicyclists were counted during the 1 to 1.5 hour observation period. Table 14: Number of High Volume Locations by Year Number of Bicyclists * * excludes inaccurate JFK/Transverse count As part of the SFMTA count methodology, locations with more than 300 bicyclists from previous counts require the use of "click-counters." However, the high volumes at these locations may be greater than the observational capacity of even the best counter. Furthermore, at these locations it is all but impossible for the observer(s) to gather much of the auxiliary rider data (gender, helmet use, etc.) that provides another useful dimension to the data. As the number of 300+ locations continues to increase, the chance for counting error increases, while the amount of auxiliary data that is gathered decreases. One solution to this problem is increasing the number of counters per location, but with limited staffing, it is not necessarily practical. Another potential solution is automated bicycle counters, but automated counters are not able to capture rider gender or helmet use. Future organizers of the citywide bicycle count should continue to consult past volumes to determine where to deploy click-counters, and/or additional counters. Maintain High Training Standards for Manual Counting Staff It is recommended that the citywide bicycle count continue to be officially incorporated into the SFMTA Intern Program. All supervisors and interns should be aware of the count and interns should continue to have it assigned as one of the required tasks for the summer. Thorough training of staff and interns should continue to ensure that each counter understands the proper methodology for counting bicycles. Ensure SFMTA Methodology is Consistent with National Bicycle Count Efforts The National Bicycle and Pedestrian Documentation Project (NBPD) is an annual bicycle and pedestrian count and survey effort sponsored by the Institute of Transportation Engineers Pedestrian and Bicycle Council. NBPD seeks to establish a standardized bicycle and pedestrian count methodology and to disseminate this methodology to cities across the country. The ultimate goal is to develop a national database of count information that will provide bicycle and pedestrian planners with crucial data to support their work. The SFMTA has been careful to ensure that its bicycle counts follow bicycle count best practices and a consistent methodology. Nevertheless, as the NBPD refines its own sample count forms, surveys, and tabulation methodologies, the SFMTA should continually integrate these best practices to ensure consistency with national standards. 17
19 Supplement Bicycle Counts with Additional Data Collect vehicular traffic data at all bicycle count locations. One of the key long-term goals of the SFMTA bicycle counts is to assess the effectiveness of bicycle infrastructure and program improvements in encouraging greater levels of cycling. To better understand the true cause of an increase in bicycle volumes, it is critical to identify whether or not an increase in bicycle volumes is an artifact of overall increases in transportation use or whether it is due to some other external factor controlled or influenced by SFMTA. Percent changes in motor vehicle traffic counts are used as one proxy for comparing changes in overall transportation use to changes in bicycle use. There is a need for additional automatic vehicle counts throughout San Francisco for comparing bicycle riding trends to driving trends. Continue to publish the State of Cycling Report. The State of Cycling report continues to be a valuable supplement to the Citywide Count Report. A new State of Cycling Report is scheduled for release in Work with BART, AC Transit, and Golden Gate Transit to collect bicycle use data at adjacent ferry terminals and transit stations. Transit stations are a key destination for cyclists linking trips for the purpose of regional travel. While the count effort is concerned primarily with local bicycle travel within San Francisco, it is important to understand the role bike and transit affects on bicycle volumes. Work with bicycle messenger companies or the San Francisco Bicycle Messenger Association (SFBMA) to maintain data about numbers of messengers operating. While commuters make a trip choice based on a variety of possible modes, bicycle messengers are professional riders whose mode does not vary. For this reason, volumes of bicycle messengers are likely to change based on other socio-economic factors rather than external factors controlled by SFMTA. Understanding the number of bicycle courier trips in downtown San Francisco could lead to a more accurate understanding of changes in bicycle volumes in that area. Work with bicycle rental companies to maintain data about numbers of rentals and routes selected by users. This data would allow a more specific analysis of the impact of bicycle rentals on the bicycle volumes at select locations, such as the ferry terminals. Conclusion The 2010 Citywide Bicycle Count was successful in its goal of capturing a sample of bicycle use across the City. The recorded increase in volume of 3 percent over the 2009 count and 58 percent over the 2006 count indicates that bicycling in San Francisco continues to rise. As future counts occur and additional data from automated bicycle counters becomes available, it will be possible to remark more conclusively on specific trends at certain 18
20 locations and throughout San Francisco. More specifically, the 2011 bicycle counts should help explain the impacts of new infrastructure on bicycle ridership. The four years that San Francisco has been monitoring bicycle ridership without the installation of new bicycle facilities provides us with a robust data set by which to analyze the effects of the variety of network improvements to be made in the near future. With the court injunction against the Bike Plan lifted and new bicycling infrastructure being implemented at a rate higher than ever, future counts offer a unique opportunity for the SFMTA to document the impacts of new bicycle infrastructure on ridership. 19
21 Appendices Appendix A: Weather Report ( ) Appendix B: 2010 Bicycle Count Locations Appendix C: Sidewalk Riders Appendix D: Wrong Way Riders Appendix E: Helmet Usage Appendix F: Rider Gender Appendix G: San Francisco Bicycle Count Data Appendix H: San Francisco Bicycle Count Data Appendix I: San Francisco Bicycle Count Data Appendix J: Downtown Cordon Counts ( ) Appendix K: Non-downtown Cordon Counts ( ) 20
22 Appendix A: Weather Report ( ) Intersection Time Temp ( F) Conditions Temp ( F) Conditions Temp ( F) Conditions Temp ( F) Conditions Temp ( F) Conditions 11th & Howard 11th & Market 14th & Folsom 17th & Valencia 23rd & Potrero 2nd & Townsend 3rd & Islais Creek (Illinois St. in 2008/09) 5th & Market PM PM AM 64 PM 62 PM 68 PM PM 64 Midd ay 5th & Market PM 63 Mostly 5th & Market AM 56 Clear 55 5th & Townsend PM 7th & 16th PM 63 7th & Kirkham 8th & Townsend PM 62 PM Mostly Clear 69 Clear 62 Clear/Wind 60 Clear then foggy Clear 62 Clear 60 Clear 64 Clear 70 Clear 70 Clear 62 Clear 70 Clear 70 Overcast/Wi nd 63 Clear/Cool/ Wind 68 Clear 68 Clear 70 Clear 73 Clear 73 Overcast` 64 Foggy/Very windy/cold 76 Clear 76 Clear 62 Clear Mostly Mostly 59 Clear 60 Overcast 60 Overcast 62 Overcast 68 Clear 68 Clear 62 Clear 70 Clear 70 Clear Mostly 66 Clear/Warm 60 Overcast/Co ld Overcast/wi nd15-20 mph 67 Clear 67 Clear 62 Clear/Wind 21
23 Intersection Time Temp ( F) Conditions Temp ( F) Conditions Temp ( F) Conditions Temp ( F) Conditions Temp ( F) Conditions Alemany & Geneva Arguello & Lake Broadway & Columbus Broadway & Embarcadero Cervantes & Marina Cesar Chavez & Harrison Embarcadero & Townsend Embarcadero to/from Ferry Building PM 64 PM 64 PM PM PM 66 PM 64 PM PM Fell & Scott PM 68 Golden Gate & Masonic Great Highway & Sloat Illinois & Mariposa/Ter ry Francois JFK & Transverse Lake Merced & Winston PM 68 PM 66 PM 66 PM 66 PM Overcast/Wi nd Clear 68 Clear/Wind Clear then foggy Overcast/Wi nd/cold Overcast/Wi nd 68 Clear 62 Foggy 70 Clear 70 Clear 62 Clear then Foggy 73 Clear 71 Clear 71 Clear 63 Clear/Windy Clear 62 Cleay/Overc ast 68 Clear 68 Breeze 62 Clear 70 Clear 70 Clear 62 Clear 58 Mostly 58 Clear Clear 64 Fog/Wind Mostly 58 Clear 62 Overcast/Wi nd/cold Foggy/Wind/ Very Cold Overcast/Wi nd/very Cold 73 Clear 73 Clear 62 Clear Clear/Wind Mostly 60 Clear/Wind 64 Heavely Overcast Overcast/Wi nd/cold 22
24 Intersection Time Temp ( F) Conditions Temp ( F) Conditions Temp ( F) Conditions Temp ( F) Conditions Temp ( F) Conditions Masonic & Panhandle McAllister & Polk O'Shaughnes sy & Portola AM 68 PM PM 62 Page & Scott PM 68 Polk & Sutter PM Randall & San Jose Stockton & Sutter PM 66 PM 2006 Avg. Temp: Mostly 2007 Avg. Temp: Avg. Temp: 62 Mostly 62 Overcast 60 Windy 62 Grey/Cold/A lmost raining Clear/Overc ast/cool/wi nd 68 Clear 68 Overcast 63 Clear 64 Clear 64 Overcast/Wi nd 63 Clear/Wind/ Cold Clear 62 Clear 70 Clear 70 Breeze 60 Clear Clear Avg. Temp: Avg. Temp: 62 Overcast/Wi nd Clear/Freezi ng AM: 8AM 9 AM, Midday: 1 PM 2 PM, PM: 5 PM 6:30 PM 23


25 Appendix B: 2010 Bicycle Count Locations 24
26 Appendix C: Sidewalk Riders Intersection 2009 Sidewalk Riders 2009 % Sidewalk Riders Sidewalk Riders 2010 % Sidewalk Riders th & Howard % % 11th & Market % % 14th & Folsom % % 17th & Valencia % % 23rd & Potrero % % 2nd & Townsend % % Illinois Street Bridge % 27 Not applicable to this location 5th & Market (Morning) % 5th & Market (Midday) % % 5th & Market (Evening) % % 5th & Townsend % % 7th & 16th % % 7th & Kirkham % % 8th & Townsend % % Alemany & Geneva % % Arguello & Lake % % Broadway & Columbus % % Broadway & Embarcadero % % Cervantes & Marina % % Cesar Chavez & Harrison % % Embarcadero & Townsend % % Embarcadero to/from Ferry Not applicable to this Not applicable to this Building location location Fell & Scott* % % Golden Gate & Masonic % % Great Highway & Sloat % % Illinois & Mariposa/Terry Francois % % JFK & Transverse % % Lake Merced & Winston % % Masonic & Panhandle % % McAllister & Polk % % O'Shaughnessy & Portola % % Page & Scott % % Polk & Sutter % % Randall & San Jose % % Stockton & Sutter % % TOTALS % % *This total includes those cyclists who made an illegal left turn against the red light on Fell St. 25
27 Appendix D: Wrong-Way Riders Intersection 2009 Wrong Way Riders 2009 % Wrong Way Riders Wrong Way Riders 2010 % Wrong Way Riders th & Howard % % 11th & Market % % 14th & Folsom % % 17th & Valencia % % 23rd & Potrero % % 2nd & Townsend % % Illinois Street Bridge % 27 Not applicable to this location 5th & Market (Midday) % % 5th & Market (Evening) % % 5th & Market (Morning) 470 No data available % 5th & Townsend % % 7th & 16th % % 7th & Kirkham % % 8th & Townsend % % Alemany & Geneva % % Arguello & Lake % % Broadway & Columbus % % Broadway & Embarcadero % % Cervantes & Marina % % Cesar Chavez & Harrison % % Embarcadero & Townsend % % Embarcadero to/from Ferry Not applicable to Not applicable to Building this location this location Fell & Scott* % 410 No data available Golden Gate & Masonic % % Great Highway & Sloat % % Illinois & Mariposa/Terry % % Francois JFK & Transverse % % Lake Merced & Winston % % Masonic & Panhandle % % McAllister & Polk % % O'Shaughnessy & Portola % % Page & Scott % % Polk & Sutter % % Randall & San Jose % % Stockton & Sutter % % TOTALS % % *This total includes those cyclists who made an illegal left turn against the red light on Fell St. 26
28 Appendix E: Helmet Usage 11th & Howard Intersection Helmet % Helmet No Helmet 27 % No Helmet 11th & Market % % 14th & Folsom % 58 20% 17th & Valencia 23rd & Potrero % 39 46% 2nd & Townsend % 40 30% Illinois Street Bridge % 7 27% 5th & Market (Midday) % 56 38% 5th & Market (Evening) % 36 41% 5th & Market (Morning) 5th & Townsend 7th & 16th 7th & Kirkham % 6 11% 8th & Townsend Alemany & Geneva % 14 47% Arguello & Lake % 10 9% Broadway & Columbus Broadway & Embarcadero Cervantes & Marina % % Cesar Chavez & Harrison % 16 34% Embarcadero & Townsend Embarcadero to/from Ferry Building % 96 48% Fell & Scott Golden Gate & Masonic % 12 22% Great Highway & Sloat % 2 5% Illinois & Mariposa/Terry Francois JFK & Transverse Lake Merced & Winston % 13 25% Masonic & Panhandle McAllister & Polk % 92 30% O'Shaughnessy & Portola % 1 5% Page & Scott % % Polk & Sutter Randall & San Jose % 13 17% Stockton & Sutter % 41 38% TOTALS % % Percentages are based on total reported total helmet/no helmet riders, not on the total number of bicyclists counted citywide.
29 Appendix F: Rider Gender 11th & Howard Intersection Female Riders % Female Riders Male Riders % Male Riders 11th & Market % % 14th & Folsom % % 17th & Valencia 23rd & Potrero % 64 91% 2nd & Townsend % % Illinois Street Bridge % 23 85% 5th & Market (Midday) % % 5th & Market (Evening) % 8% 5th & Market (Morning) 5th & Townsend 7th & 16th 7th & Kirkham % 38 69% 8th & Townsend Alemany & Geneva % 23 92% Arguello & Lake % 86 77% Broadway & Columbus Broadway & Embarcadero Cervantes & Marina % % Cesar Chavez & Harrison % 33 94% Embarcadero & Townsend Embarcadero to/from Ferry Building % % Fell & Scott* Golden Gate & Masonic % 32 59% Great Highway & Sloat % 26 68% Illinois & Mariposa/Terry Francois JFK & Transverse Lake Merced & Winston % % Masonic & Panhandle McAllister & Polk % % O'Shaughnessy & Portola % % Page & Scott % 449 % Polk & Sutter Randall & San Jose % 51 69% Stockton & Sutter % 78 55% TOTALS % % Percentages are based on total reported total male/female riders, not on the total number of bicyclists counted citywide.
30 Appendix G: San Francisco Bicycle Count Data Intersection Time* % Change (06-07) 11th & Howard PM % 11th & Market PM % 14th & Folsom AM % 17th & Valencia PM % 23rd & Potrero PM % 2nd & Townsend PM % 3rd St. Bridge PM % 5th & Market Midday % 5th & Market PM % 5th & Market AM % 5th & Townsend PM % 7th & 16th PM % 7th & Kirkham PM % 8th & Townsend PM % Alemany & Geneva PM % Arguello & Lake PM % Broadway & Columbus PM % Broadway & Embarcadero PM % Cervantes & Marina PM % Cesar Chavez & Harrison PM % Embarcadero & Townsend PM % Embarcadero to/from Ferry Building PM % Fell & Scott PM % Golden Gate & Masonic PM % Great Highway & Sloat PM % Illinois & Mariposa/Terry Francois PM % JFK & Transverse** PM % Lake Merced & Winston PM % Masonic & Panhandle AM % McAllister & Polk PM % O'Shaughnessy & Portola PM % Page & Scott PM % Polk & Sutter PM % Randall & San Jose PM % Stockton & Sutter PM % 1. TOTALS TOTALS* % * AM: 8AM 9 AM, Midday: 1 PM 2 PM, PM: 5 PM 6:30 PM **2006 count for JFK/Transverse was found to be inaccurate. For comparison purposes, JFK/Transverse was omitted from these totals. 29
31 Appendix H: San Francisco Bicycle Count Data Intersection Time* % Change (07-08) 11th & Howard PM % 11th & Market PM % 14th & Folsom AM % 17th & Valencia PM % 23rd & Potrero PM % 2nd & Townsend PM % 3rd St. Bridge / Illinois St. Bridge** PM % 5th & Market Midday % 5th & Market PM % 5th & Market AM % 5th & Townsend PM % 7th & 16th PM % 7th & Kirkham PM % 8th & Townsend PM % Alemany & Geneva PM % Arguello & Lake PM % Broadway & Columbus PM % Broadway & Embarcadero PM % Cervantes & Marina PM % Cesar Chavez & Harrison PM % Embarcadero & Townsend PM % Embarcadero to/from Ferry Building*** PM % Fell & Scott PM % Golden Gate & Masonic PM % Great Highway & Sloat PM % Illinois & Mariposa/Terry Francois PM % JFK & Transverse PM % Lake Merced & Winston PM % Masonic & Panhandle AM % McAllister & Polk PM % O'Shaughnessy & Portola PM % Page & Scott PM % Polk & Sutter PM % Randall & San Jose PM % Stockton & Sutter PM % 1. TOTALS TOTALS**** % * AM: 8AM 9 AM, Midday: 1 PM 2 PM, PM: 5 PM 6:30 PM ** Count location was changed from 3rd Street bridge ( ) to Illinois Street bridge (2008). *** Count location was changed from the Embarcadero at Market Street ( ) to the two ferry terminals behind the Ferry Building (2008). **** For comparison purposes, omits changed count locations. 30
32 Appendix I: San Francisco Bicycle Count Data Intersection Time % Change (08-09) 11th & Howard PM % 11th & Market PM % 14th & Folsom AM % 17th & Valencia PM % 23rd & Potrero PM % 2nd & Townsend PM % 3rd St. Bridge / Illinois St. Bridge PM % 5th & Market Middday % 5th & Market PM % 5th & Market AM % 5th & Townsend PM % 7th & 16th PM % 7th & Kirkham PM % 8th & Townsend PM % Alemany & Geneva PM % Arguello & Lake PM % Broadway & Columbus PM % Broadway & Embarcadero PM % Cervantes & Marina PM % Cesar Chavez & Harrison PM % Embarcadero & Townsend PM % Ferry Building Terminals** PM % Fell & Scott PM % Golden Gate & Masonic PM % Great Highway & Sloat PM % Illinois & Mariposa/Terry Francois PM % JFK & Transverse PM % Lake Merced & Winston PM % Masonic & Panhandle AM % McAllister & Polk PM % O'Shaughnessy & Portola PM % Page & Scott PM % Polk & Sutter PM % Randall & San Jose PM % Stockton & Sutter PM % 1. TOTALS TOTALS* % * AM: 8AM 9 AM, Midday: 1 PM 2 PM, PM: 5 PM 6:30 PM * Due to the high variability in tourists and ferry schedules between years, these totals exclude the Ferry Terminal counts. A map showing the relative distribution of bicyclists counted can be found in Appendix B. 31
33 Appendix J: Downtown Cordon Counts ( ) Downtown Cordon Intersections 2010 % Change (06-07) % Change (07-08) % Change (08-09) % Change (06-09) % Change (09-10) % Change (06-10) 11th & Howard % 33% 0% 46% -3% 42% 11th & Market % 24% 11% 48% 1% 50% 2nd & Townsend % 31% -5% 32% -3% 28% 5th & Townsend % 15% 6% 28% 28% 64% 8th & Townsend % 23% 5% % 2% 68% Broadway & Columbus % 18% -33% -34% 52% 1% Broadway & Embarcadero % 61% -7% 41% -10% 27% Embarcadero & Townsend % 23% -1% 62% 16% 88% Ferry Building Terminals* % 536% -51% 104% 64% 233% McAllister & Polk % 11% 5% 39% 1% 39% Polk & Sutter % 15% -3% 28% 27% 63% Stockton & Sutter % 28% 19% 205% 25% 281% TOTALS* % 27% 2% 43% 6% 52% Time: 5:00 p.m. - 6:30 p.m. * For comparison purposes, the Ferry Building Terminals was omitted from these totals, which was relocated in 2008.
34 Appendix K: Non-downtown Cordon Counts ( ) Non-Downtown Cordon Intersections Time % Change (06-07) % Change (07-08) % Change (08-09) % Change (06-09) % Change (09-10) % Change (06-10) 14th & Folsom AM % 7% 21% 58% -2% 55% 17th & Valencia PM % 28% -12% 37% 27% 75% 23rd & Potrero PM % 115% 1% 111% -5% 100% 3rd St. Bridge / PM % -38% -19% -69% 108% -36% Illinois St. Bridge* 5th & Market Midday % 7% 18% 23% -5% 17% 5th & Market PM % 18% 21% 59% 7% 70% 5th & Market AM % 3% 15% 24% 33% % 7th & 16th PM % 18% 40% 201% -34% 99% 7th & Kirkham PM % 4% 15% 54% 2% 57% Alemany & Geneva PM % 0% 4% 222% -14% 178% Arguello & Lake PM % 6% 33% 71% -52% -18% Cervantes & Marina PM % 68% 6% 116% -26% 59% Cesar Chavez & Harrison PM % 13% 6% 46% -39% -10% Fell & Scott PM % 21% 24% 85% 10% 103% Golden Gate & Masonic PM % 24% -9% 2% 26% 29% Great Highway & Sloat PM % -26% 110% 64% -54% -24% Illinois & Mariposa/Terry Francois PM % -10% 39% 117% -5% 106% JFK & Transverse* PM % 45% 52% 37% -53% -36% Lake Merced & Winston PM % 7% 21% 97% -26% 45% Masonic & Panhandle AM % 23% 8% 50% 7% 61% O'Shaughnessy & Portola PM % 0% -3% 22% -61% -52% Page & Scott PM % 38% 6% 63% 12% 83% Randall & San Jose PM % 35% -28% 150% 6% 164% TOTALS* % 22% 11% 61% 1% 63% AM: 8AM 9 AM, Midday: 1 PM 2 PM, PM: 5 PM 6:30 PM * For comparison purposes, these totals exclude the observations from the 2 changed count locations in 2008.
SAN FRANCISCO State of Cycling Report
 2008 SAN FRANCISCO State of Cycling Report City of San Francisco Mayor Gavin Newsom San Francisco Board of Supervisors San Francisco Municipal Transportation Agency (SFMTA) Nathaniel P. Ford Sr., Eecutive
Northbound San Jose Avenue & I-280 Off-Ramp Road Diet Pilot Project
 Project Overview Fed by a two-lane Interstate-280 (I-280) off-ramp, high vehicular volumes and speeds are longstanding issues along San Jose Avenue. Residents in the surrounding neighborhoods have expressed
2011 Bicycle Count Report
 2011 Bicycle Count Report City of San Francisco December 2011 SFMTA Municipal Transportation Agency The San Francisco Municipal Transportation Agency (SFMTA) 2011 Bicycle Count Report is a collaborative
City of San Francisco 2009 Pedestrian Count Report. April 2010
 April 2010 TABLE OF CONTENTS Introduction... 3 Background... 3 Methodology:... 4 Results... 4 Recommendations... 6 Conclusion... 7 APPENDIX A: CENSUS DATA... 8 APPENDIX B: COUNT LOCATIONS... 8 APPENDIX
BICYCLE STRATEGY UPDATE
 SFMTA Municipal Transportation Agency Image: Bike locks in front of San Francisco main library BICYCLE STRATEGY UPDATE 2015 SAN FRANCISCO, CALIFORNIA Bicycle Strategy Overview Four Goals: 1. Improve safety
Instructions for Counting Pedestrians at Intersections. September 2014
 Instructions for Counting Pedestrians at Intersections September 2014 Purpose This document introduces the concept of the pedestrian count and provides instructions for performing a manual intersection
January Project No
 January 13 2015 Project No. 5070.05 Neil Connelly, Director University of Victoria, Campus Planning and Sustainability PO Box 1700 STN CSC Victoria, BC V8P 5C2 Dear Neil: Re: UVic 2014 Traffic Final Report
REPORT CARD ON BICYCLING SAN FRANCISCO 2008
 REPORT CARD ON BICYCLING SAN FRANCISCO 2008 1 TABLE OF CONTENTS - BICYCLING IN SAN FRANCISCO 2008 FOREWORD... PG. 3 BICYCLING IN SAN FRANCISCO... PG. 4 WHO AND WHY... PG. 5 BICYCLE ENVIRONMENT THE CITYWIDE
Protected Bike Lanes in San Francisco Mike Sallaberry SFMTA NACTO Workshop - Chicago IL
 Protected Bike Lanes in San Francisco Mike Sallaberry SFMTA 10 14 2011 NACTO Workshop - Chicago IL San Francisco 2 nd Highest Density in the U.S. 47 square miles Mild Climate Market Population ~810,000
MEMORANDUM. City Constituents. Leilani Schwarcz, Vision Zero Surveillance Epidemiologist, SFDPH
 MEMORANDUM TO: FROM: CC: City Constituents Leilani Schwarcz, Vision Zero Surveillance Epidemiologist, SFDPH Megan Wier, Co-Chair, San Francisco Vision Zero Task Force, SFDPH Commander Ann Mannix, Traffic
1999 On-Board Sacramento Regional Transit District Survey
 SACOG-00-009 1999 On-Board Sacramento Regional Transit District Survey June 2000 Sacramento Area Council of Governments 1999 On-Board Sacramento Regional Transit District Survey June 2000 Table of Contents
SAN FRANCISCO. State of Cycling Report
 2008 SAN FRANCISCO State of Cycling Report 2008 SAN FRANCISCO State of Cycling Report Table of Contents 1 Introduction 2 Purpose of the State of Cycling Report 3 History of the State of Cycling Report
Compiled by the SFMTA Livable Streets Subdivision Staff
 March 2012 SFMTA Livable Streets Report to the San Francisco Bicycle Advisory Committee (BAC) See www.sfgov.org/bac for more information. Compiled by the SFMTA Livable Streets Subdivision Staff A. BICYCLE
LESSONS FROM THE GREEN LANES: EVALUATING PROTECTED BIKE LANES IN THE U.S.
 LESSONS FROM THE GREEN LANES: EVALUATING PROTECTED BIKE LANES IN THE U.S. FINAL REPORT: APPENDIX C BICYCLIST ORIGIN AND DESTINATION ANALYSIS NITC-RR-583 by Alta Planning and Design Matt Berkow Kim Voros
City of San Francisco Pedestrian Count Report
 June 2011 Preparation of this report was made possible entirely by the San Francisco County Transportation Authority through a grant of Proposition K Local Transportation Sales Tax Funds Introduction In
WELCOME Mission-Geneva Transportation Study
 WELCOME Mission-Geneva Transportation Study Study Process and Schedule 2005 2006 Oct Nov Dec Jan Feb Mar Apr May Jun Jul Aug Sept Oct Task 2 Develop Outreach Plan Task 3 Document Existing Conditions/ Prioritize
City of Elizabeth City Neighborhood Traffic Calming Policy and Guidelines
 City of Elizabeth City Neighborhood Traffic Calming Policy and Guidelines I. Purpose: The City of Elizabeth City is committed to ensure the overall safety and livability of residential neighborhoods. One
SAN FRANCISCO MUNICIPAL TRANSPORTATION AGENCY Order # 5883 FOR PUBLIC HEARING
 The Sustainable Streets Division of the San Francisco Municipal Transportation Agency will hold a public hearing on Friday, March 2, 2018, at 10:00 AM, in Room 416 (Hearing Room 4), City Hall, 1 Dr. Carlton
CAPITOL REGION COUNCIL OF GOVERNMENTS. Bike / Pedestrian Count Project
 CAPITOL REGION COUNCIL OF GOVERNMENTS Bike / Pedestrian Count Project October 2009 Introduction In 2008, the Capitol Region Council of Governments (CRCOG) updated the Regional Bike/Ped Plan, The CRCOG
Bicycle Master Plan Goals, Strategies, and Policies
 Bicycle Master Plan Goals, Strategies, and Policies Mobilizing 5 This chapter outlines the overarching goals, action statements, and action items Long Beach will take in order to achieve its vision of
BICYCLE SAFETY OBSERVATION STUDY 2014
 County of Santa Cruz Health Services Agency BICYCLE SAFETY OBSERVATION STUDY BACKGROUND AND PURPOSE The County of Santa Cruz Health Services Agency (HSA) in conjunction with the Community Safety Coalition
Upper Market Street Bike Lane Project
 Upper Market Street Bike Lane Project 17th Street to Octavia Boulevard 6 30 2010 SAN FRANCISCO, CALIFORNIA Agenda San Francisco & Sustainable Transportation Project Goals Outreach & Coordination Project
MEMORANDUM. Charlotte Fleetwood, Transportation Planner
 MEMORANDUM Date: Updated August 22, 2017 To: Organization: Charlotte Fleetwood, Transportation Planner Boston Transportation Department From: Jason DeGray, P.E., PTOE, Regional Director of Engineering
Data Analysis February to March Identified safety needs from reported collisions and existing travel patterns.
 Welcome! Thank you for participating in today s Valencia Bikeway Improvements workshop. Data Analysis February to March Identified safety needs from reported collisions and existing travel patterns. Initial
SAN FRANCISCO MUNICIPAL TRANSPORTATION AGENCY
 THIS PRINT COVERS CALENDAR ITEM NO. : 10.2 DIVISION: Sustainable Streets BRIEF DESCRIPTION: SAN FRANCISCO MUNICIPAL TRANSPORTATION AGENCY Adopting Conceptual Proposal for Streetscape Improvements to Broadway,
Marin County. Nonmotorized Transportation Pilot Program. Bicycle and Pedestrian Counts Update
 Marin County Nonmotorized Transportation Pilot Program Bicycle and Pedestrian Counts 2013 Update Prepared for: County of Marin Department of Public works Contact: Dan Dawson walkbikemarin@marincounty.org
Central Freeway and Octavia Circulation Study
 Central Freeway and Octavia Circulation Study Final Report Plans and Programs Committee San Francisco County Transportation Authority September 18, 2012 Presentation Outline Background and Study Purpose
Lincoln Avenue Road Diet Trial
 Lincoln Avenue Road Diet Trial Data Collection Report June 1, 2015 Department of Transportation Table of Contents I. Introduction...... 3 II. Data Collection Methodology & Results...... 5 A. Traffic Volume
The Traffic Monitoring Guide: Counting Bicyclists and Pedestrians. APBP 2017 June 28: 11:15am-12:45pm
 The Traffic Monitoring Guide: Counting Bicyclists and Pedestrians APBP 2017 June 28: 11:15am-12:45pm 2 Presentation Organization Why count bicyclists and pedestrians? Why report count data? What resources
ADOT Statewide Bicycle and Pedestrian Program Summary of Phase IV Activities APPENDIX B PEDESTRIAN DEMAND INDEX
 ADOT Statewide Bicycle and Pedestrian Program Summary of Activities APPENDIX B PEDESTRIAN DEMAND INDEX May 24, 2009 Pedestrian Demand Index for State Highway Facilities Revised: May 29, 2007 Introduction
San Francisco 2008 Collisions Report December 18, 2009
 San Francisco 2008 Report December 18, 2009 City and County of San Francisco San Francisco Municipal Transportation Agency 1 South Van Ness Avenue, 7 th Floor San Francisco CA 94103 CONTENTS Safer Streets
Bicycle Count Data. December 2008
 Bicycle Count Data December 28 Published By: San Luis Obispo Public Works Department 919 Palm Street, San Luis Obispo, California 9341 Telephone (85) 781 719; FAX (85) 781 7198 www.slocity.org Introduction
National Bicycle and Pedestrian Documentation Project INSTRUCTIONS
 National Bicycle and Pedestrian Documentation Project INSTRUCTIONS The National Documentation Project (NBPD) is an annual bicycle and pedestrian count and survey effort sponsored by the Institute of Transportation
San Francisco Pedestrian Safety Capital Improvement Program: A Step Towards Vision Zero
 San Francisco Safety Capital Improvement Program: A Step Towards Vision Zero March 5, 2014 The First Steps In April 2013, Mayor Lee issued the Strategy which directed City departments to implement solutions
Chapter 14 PARLIER RELATIONSHIP TO CITY PLANS AND POLICIES. Recommendations to Improve Pedestrian Safety in the City of Parlier (2014)
") Chapter 14 PARLIER This chapter describes the current status and future plans for biking and walking in the City of Parlier. RELATIONSHIP TO CITY PLANS AND POLICIES The Parlier General Plan is the primary
Chapter 14 PARLIER This chapter describes the current status and future plans for biking and walking in the City of Parlier. RELATIONSHIP TO CITY PLANS AND POLICIES The Parlier General Plan is the primary
Welcome! San Jose Avenue Open House August 25, 2015
 Welcome! San Jose Avenue Open House August 25, 2015 Vision Zero The City and County of San Francisco adopted Vision Zero San Francisco Vision Zero High Injury Network as a policy in 2014, committing an
Compiled by the SFMTA Livable Streets Subdivision Staff
 January 2012 SFMTA Livable Streets Report to the San Francisco Bicycle Advisory Committee (BAC) See www.sfgov.org/bac for more information. Compiled by the SFMTA Livable Streets Subdivision Staff A. BICYCLE
DPT Bicycle Program Report to the BAC 1/13/05
 City and County of San Francisco GAVIN NEWSOM, MAYOR BOND M. YEE, ACTING EXECUTIVE DIRECTOR DPT Bicycle Program Report to the BAC 1/13/05 ITEMS RECOMMENDED FOR BAC ACTION AT JANUARY MEETING: 1. GEARY BOULEVARD
Purpose and Need. Chapter Introduction. 2.2 Project Purpose and Need Project Purpose Project Need
 Chapter 2 Purpose and Need 2.1 Introduction The El Camino Real Bus Rapid Transit (BRT) Project (Project) would make transit and other transportation improvements along a 17.6-mile segment of the El Camino
Chapter 2. Bellingham Bicycle Master Plan Chapter 2: Policies and Actions
 Chapter 2 Bellingham Bicycle Master Plan Chapter 2: Policies and Actions Chapter 2: Policies and Actions The Bicycle Master Plan provides a road map for making bicycling in Bellingham a viable transportation
SAN FRANCISCO MUNICIPAL TRANSPORTATION AGENCY BOARD OF DIRECTORS. RESOLUTION No
 SAN FRANCISCO MUNICIPAL TRANSPORTATION AGENCY BOARD OF DIRECTORS RESOLUTION No. 170606-069 WHEREAS, The City Traffic Engineer is authorized to conduct engineering and traffic surveys to modify speed limits
92% COMMUTING IN THE METRO. Congested Roadways Mode Share. Roadway Congestion & Mode Share
 COMMUTING IN THE METRO Roadway Congestion & Mode Share The majority of major roadways in Greater Des Moines are without congestion and have underutilized capacity. This surplus capacity could be used for
North Shore Transportation Improvement Strategy
 North Shore Transportation Improvement Strategy Preliminary, Near-term Recommendation 2016 April Transportation Improvement Strategy (TIS) Comprehensive and Analytical A multi-modal transportation strategy
November 2011 SFMTA Livable Streets Report to the San Francisco Bicycle Advisory Committee (BAC)
") November 2011 SFMTA Livable Streets Report to the San Francisco Bicycle Advisory Committee (BAC) See www.sfgov.org/bac for more information. Compiled by the SFMTA Livable Streets Subdivision Staff A. BICYCLE
November 2011 SFMTA Livable Streets Report to the San Francisco Bicycle Advisory Committee (BAC) See www.sfgov.org/bac for more information. Compiled by the SFMTA Livable Streets Subdivision Staff A. BICYCLE
Capitol Region Council of Governments Bike/Pedestrian Count Project
 Capitol Region Council of Governments Bike/Pedestrian Count Project 2015 REPORT CAPITOL REGION COUNCIL OF GOVERNMENTS Bike / Pedestrian Count Project 2015 Count Introduction This report presents an analysis
San Francisco 2009 Collisions Report April 21, 2011
 San Francisco 29 Collisions Report April 21, 211 City and County of San Francisco San Francisco Municipal Transportation Agency 1 South Van Ness Avenue, 7 th Floor San Francisco CA 9413 CONTENTS About
Magnolia Place. Traffic Impact Analysis. Prepared for: City of San Mateo. Prepared by: Hexagon Transportation Consultants, Inc.
 Magnolia Place Traffic Impact Analysis Prepared for: City of San Mateo Prepared by: Hexagon Transportation Consultants, Inc. Updated January 4, 2010 Table of Contents 1. Introduction...1 2. Existing Conditions...6
Solana Beach Comprehensive Active Transportation Strategy (CATS)
") Solana Beach Comprehensive Active Transportation Strategy (CATS) 3.0 Goals & Policies The Solana Beach CATS goals and objectives outlined below were largely drawn from the Solana Beach Circulation Element
Solana Beach Comprehensive Active Transportation Strategy (CATS) 3.0 Goals & Policies The Solana Beach CATS goals and objectives outlined below were largely drawn from the Solana Beach Circulation Element
TRANSPORTATION & MOBILITY
 TRANSPORTATION & MOBILITY ROADWAY SYSTEM There are approximately 40 miles of roadways in Manitou Springs. For planning purposes, roadways are typically assigned a functional classification which defines
NM-POLICY 1: Improve service levels, participation, and options for non-motorized transportation modes throughout the County.
 Transportation PRINCE WILLIAM COUNTY 2008 COMPREHENSIVE PLAN NON-MOTORIZED PLAN CONTENTS Goals, Policies, and Action Strategies Table 4 (Bike Facility Classifications and Descriptions) Table 5 (Bike Facility
EUCLID AVENUE PARKING STUDY CITY OF SYRACUSE, ONONDAGA COUNTY, NEW YORK
 EUCLID AVENUE PARKING STUDY CITY OF SYRACUSE, ONONDAGA COUNTY, NEW YORK CITY OF SYRACUSE DEPARTMENT OF PUBLIC WORKS 1200 CANAL STREET EXTENSION SYRACUSE, NEW YORK 13210 DRAFT REPORT DATE: November 13,
8. Collisions INTRODUCTION
 8. Collisions INTRODUCTION While traffic collisions can affect anyone, they have a disproportionate impact on bicyclists, who along with pedestrians are the most vulnerable users of the transportation
EXECUTIVE SUMMARY... vii 1 STUDY OVERVIEW Study Scope Study Area Study Objectives
 Contents EXECUTIVE SUMMARY... vii 1 STUDY OVERVIEW... 1-1 1.1 Study Scope... 1-1 1.2 Study Area... 1-1 1.3 Study Objectives... 1-3 2 EXISTING CONDITIONS... 2-1 2.1 Existing Freeway Conditions... 2-4 2.1.1
Active TFCA Projects to Date - TFCA Allocations and Total Project Costs San Francisco County Transportation Authority
 Active s to Date - TFCA Allocations and Total Project Costs 11SF05 Solar Electric Vehicle Charging Stations $28,000 $74,967 Integrated Public-Private Travel Demand SFCTA 11SF07 Management (TDM) Partnership
Dear Mr. Tweed: Sincerely, Min Zhou, P.E. Vice President
 December 17, 2012 Mr. Steve Tweed City of Long Beach, Department of Public Works Traffic & Transportation Bureau, 10 th Floor City Hall 333 West Ocean Boulevard Long Beach, CA 90802 Subject: Broadway and
Improve the livability of our streets by
 Pedestrian and Traffic Calming Policy March 2018 2 of 6 Neighborhood Traffic Calming Policy The City of Aspen continually strives to protect multimodal function while maintaining a high standard of safety.
METHODOLOGY. Signalized Intersection Average Control Delay (sec/veh)
") Chapter 5 Traffic Analysis 5.1 SUMMARY US /West 6 th Street assumes a unique role in the Lawrence Douglas County transportation system. This principal arterial street currently conveys commuter traffic
Chapter 5 Traffic Analysis 5.1 SUMMARY US /West 6 th Street assumes a unique role in the Lawrence Douglas County transportation system. This principal arterial street currently conveys commuter traffic
Goodlettsville Bicycle and Pedestrian Plan Executive Summary
 Goodlettsville Bicycle and Pedestrian Plan July 2010 In Cooperation with the Nashville Area Metropolitan Planning Executive Organization Summary Introduction Progressive and forward thinking communities
Vision Zero Priority Projects (March 2017)
") Key in 201 or of Key Potrero Ave., from Division to Cesar Chavez Begin Construction Spring 201 Winter 201 Achieved Safety measures include dedicated transit lane, sidewalk widening, buffers for existing
Key in 201 or of Key Potrero Ave., from Division to Cesar Chavez Begin Construction Spring 201 Winter 201 Achieved Safety measures include dedicated transit lane, sidewalk widening, buffers for existing
Freeway ramp intersection study
 Freeway ramp intersection study Supporting Vision Zero: Zero traffic deaths in San Francisco by 2024 Study Goals: Primary Improve Safety Improve Accessibility Secondary Provide Efficient Circulation Accommodate
SNCC Demographic Trends
 Employment Population SNCC Demographic Trends In 1970 the SNCC population was 10,040, accounting for roughly 3% of the County population In 2015, SNCC grew to 60,567 people, roughly 11% of the County population
The five potential solutions and some of their benefits and costs are listed in the following table: Ferry Patron Bike Parking Alternatives
 STAFF REPORT City Council of the City of Sausalito AGENDA TITLE: Ferry Patron Bicycle Parking Plan - Summer 2014 RECOMMENDED MOTION: Note and file informational item, no action necessary SUMMARY In April
PAGE San Francisco State of Cycling Report
 PAGE 1. 2012 San Francisco State of Cycling Report Cover image: Photo of bicyclists and a light rail vehicle on the Third Street corridor Image: SFMTA logo PAGE 2. Edwin M. Lee Mayor City and County of
RED COLORED TRANSIT-ONLY LANES REQUEST TO EXPERIMENT
 RED COLORED TRANSIT-ONLY LANES REQUEST TO EXPERIMENT Submitted to: California Traffic Control Devices Committee Federal Highway Administration, Office of Traffic Operations Submitted by: San Francisco
SF Transportation Plan Update
 SF Transportation Plan Update CAC Meeting #11 Existing Conditions and Future Baseline Needs Revised, Part I www.sfcta.org/movesmartsf twitter.com/sanfranciscota www.facebook.com/movesmartsf January 30,
Data Analysis February to March Identified safety needs from reported collisions and existing travel patterns.
 Welcome! Thank you for participating in today s Valencia Bikeway Improvements workshop. Data Analysis February to March Identified safety needs from reported collisions and existing travel patterns. Initial
ABOUT THIS STUDY The Tenderloin-Little Saigon Community-Based Transportation Plan
 ABOUT THIS STUDY The Tenderloin-Little Saigon Community-Based Transportation Plan The Greater Tenderloin Community Study Milestones October Community based organizations (Tenderloin Housing Clinic and
FEDERAL HIGHWAY ADMINISTRATION APPLICATION
 FEDERAL HIGHWAY ADMINISTRATION APPLICATION REQUEST FOR PERMISSION TO EXPERIMENT WITH A BICYCLE BOX INTERSECTION TREATMENT Submitted by: City of Columbus Department of Public Service Date: June 26, 2009
TABLE OF CONTENTS. Executive Summary
 Executive Summary Background... ES-1 Pedestrian Network... ES-2 Bikeway Network... ES-2 Collision History... ES-2 Public Input... ES-4 Conclusions and Recommendations... ES-4 1. Introduction and Setting
Regional Bicycle and Pedestrian Count Summary Report
 2013 Regional Bicycle and Pedestrian Count Summary Report Prepared by PAG staff Published June 2014 Table of Contents Introduction and Overview... 1 Process and Methodology... 1 2013 Bicycle and Pedestrian
2014 Fishers Trail Count
 2014 Fishers Trail Count July 2014 Table of Contents Introduction...1 Trail Count Locations...3 Ellipse Parkway at Holland Drive...4 Lantern Road at Sunblest Boulevard...5 126th Street at Cumberland Road...6
Speed Limits Study and Proposal. Public Input Session: 8/14/13
 Speed Limits Study and Proposal Public Input Session: 8/14/13 Why is Decatur a unique place for this project? First Community Transportation Plan in the nation with a Health Impact Assessment. Strong sense
SAN FRANCISCO MUNICIPAL TRANSPORTATION AGENCY
 THIS PRINT COVERS CALENDAR ITEM NO. : 10.4 DIVISION: Sustainable Streets BRIEF DESCRIPTION: SAN FRANCISCO MUNICIPAL TRANSPORTATION AGENCY Amending Transportation Code, Division II, Section 702 to modify
modes, the increased roadway capacity is the implied solution, which, in turn, has been shown to lead to more driving (induced demand).
.") EXECUTIVE SUMMARY A. Introduction The San Francisco Congestion Management Program (CMP) is a biennial program conducted in accordance with state law to monitor congestion and adopt plans for mitigating
EXECUTIVE SUMMARY A. Introduction The San Francisco Congestion Management Program (CMP) is a biennial program conducted in accordance with state law to monitor congestion and adopt plans for mitigating
APPENDIX H EXISTING TRAFFIC CONDITIONS ANALYSIS
 APPENDIX H EXISTING TRAFFIC CONDITIONS ANALYSIS MEMO : Peter Steacy, P.Eng. Date: December 3, 2014 : Ian Borsuk, P.Eng. Job No.: 3414015-000 Subject: City of Ottawa O-Train Extension Planning & EA Study
Appendix E: Bike Crash Analysis ( )
") Appendix E: Bike Crash Analysis (2009-2012) Davis Bicycle Crashes Analysis 2009-2012 December 2013 Ride Walk Davis Active Transportation Program City of Davis December 2013 Prepared by: Jimmy Fong Active
Appendix E: Bike Crash Analysis (2009-2012) Davis Bicycle Crashes Analysis 2009-2012 December 2013 Ride Walk Davis Active Transportation Program City of Davis December 2013 Prepared by: Jimmy Fong Active
COLUMBUS AVENUE NEIGHBORHOOD TRANSPORTATION STUDY
 COLUMBUS AVENUE NEIGHBORHOOD TRANSPORTATION STUDY Pedestrian Survey Findings Survey Main Findings: Transit and walking are the main two modes used by both visitors and residents of the area, regardless
SANTA CLARA COUNTYWIDE BICYCLE PLAN August 2008
 SANTA CLARA COUNTYWIDE BICYCLE PLAN August 2008 To assist VTA and Member Agencies in the planning, development and programming of bicycle improvements in Santa Clara County. Vision Statement To establish,
Complete Street Analysis of a Road Diet: Orange Grove Boulevard, Pasadena, CA
 Complete Street Analysis of a Road Diet: Orange Grove Boulevard, Pasadena, CA Aaron Elias, Bill Cisco Abstract As part of evaluating the feasibility of a road diet on Orange Grove Boulevard in Pasadena,
Appendix B Sample Evaluation Reports
 Appendix B Sample Evaluation Reports REPORT CARD ON BICYCLING SAN FRANCISCO 2008 REPORT CARD ON BICYCLING, SAN FRANCISCO 2008 1 TABLE OF CONTENTS - BICYCLING IN SAN FRANCISCO 2008 FOREWORD... PG. 3 BICYCLING
MoPac South: Impact on Cesar Chavez Street and the Downtown Network
 MoPac South: Impact on Cesar Chavez Street and the Downtown Network Prepared by: The University of Texas at Austin Center for Transportation Research Prepared for: Central Texas Regional Mobility Authority
o n - m o t o r i z e d transportation is an overlooked element that can greatly enhance the overall quality of life for the community s residents.
 N o n - m o t o r i z e d transportation is an overlooked element that can greatly enhance the overall quality of life for the community s residents. 84 Transportation CHAPTER 11 INTRODUCTION Transportation
CITY OF HAMILTON PLANNING AND ECONOMIC DEVELOPMENT DEPARTMENT Transportation Planning and Parking Division
 CITY OF HAMILTON PLANNING AND ECONOMIC DEVELOPMENT DEPARTMENT Transportation Planning and Parking Division TO: Chair and Members Public Works Committee COMMITTEE DATE: June 18, 2018 SUBJECT/REPORT NO:
Building a bike friendly Chicago
 CASE STUDY Miovision Scout Building a bike friendly Chicago How video data is moving Chicago forward Chicago 2020 Becoming the Most Bike-Friendly City in the United States In 2011, Mayor Rahm Emanuel set
Chapter 5 Future Transportation
 Chapter 5 Future Transportation The Future Land Use Plan identifies the desired land use designations. The land uses desired for Crozet depend, in large part, on the success of the transportation system,
CITY OF ALPHARETTA DOWNTOWN MASTER PLAN TRAFFIC EVALUATION
 CITY OF ALPHARETTA DOWNTOWN MASTER PLAN TRAFFIC EVALUATION June 2015 CITY OF ALPHARETTA DOWNTOWN MASTER PLAN TRAFFIC EVALUATION Introduction The Alpharetta Downtown Master Plan was developed in the fall
Rochester Area Bike Sharing Program Study
 roc bike share Rochester Area Bike Sharing Program Study Executive Summary ~ January 2015 JANUARY 2015 8484 Georgia Avenue, Suite 800 Silver Spring, MD 20910 3495 Winton Pl., Bldg E, Suite 110 Rochester,
San Francisco Mobility Trends Report 2018
 San Francisco Mobility Trends Report 2018 San Francisco Municipal Transportation Agency Jan 28, 2019 San Francisco, California 2 Table of Contents 2 5 6 7 9 11 12 13 Executive Summary Transit Bicycling
FINAL PLAN APPENDIX D CITY OF BERKELEY BIKE PLAN D-1
 CITY OF BERKELEY BIKE PLAN D-1 . Proposed Programs D.1. EDUCATION This appendix presents the recommended bicycle-related programs for the City of Berkeley. The recommendations are organized in four E s:
Chapter PERFORMANCE MEASURES AND ACCOUNTABILITY. Introduction
 PERFORMANCE MEASURES AND ACCOUNTABILITY Introduction Performance measures are helpful in evaluating the progress being made toward achieving the goals and objectives of the Gateway Bicycle Plan. The Plan
DOWNTOWN TUPELO MAIN STREET: ROAD DIET STUDY
 DOWNTOWN TUPELO MAIN STREET: ROAD DIET STUDY Since mid-2009, RPM Transportation Consultants (RPM) has worked with the Downtown Tupelo Main Street Association to evaluate traffic conditions and potential
3 ROADWAYS 3.1 CMS ROADWAY NETWORK 3.2 TRAVEL-TIME-BASED PERFORMANCE MEASURES Roadway Travel Time Measures
 ROADWAYS Approximately 6 million trips are made in the Boston metropolitan region every day. The vast majority of these trips (80 to percent, depending on trip type) involve the use of the roadway network
TRAFFIC IMPACT STUDY CRITERIA
 Chapter 6 - TRAFFIC IMPACT STUDY CRITERIA 6.1 GENERAL PROVISIONS 6.1.1. Purpose: The purpose of this document is to outline a standard format for preparing a traffic impact study in the City of Steamboat
CITY OF COCOA BEACH 2025 COMPREHENSIVE PLAN. Section VIII Mobility Element Goals, Objectives, and Policies
 CITY OF COCOA BEACH 2025 COMPREHENSIVE PLAN Section VIII Mobility Element Goals, Objectives, and Policies Adopted August 6, 2015 by Ordinance No. 1591 VIII MOBILITY ELEMENT Table of Contents Page Number
METROPOLITAN TRANSPORTATION PLAN OUTREACH: INTERACTIVE MAP SUMMARY REPORT- 10/03/14
 METROPOLITAN TRANSPORTATION PLAN OUTREACH: INTERACTIVE MAP SUMMARY REPORT- 10/03/14 INTRODUCTION This document summarizes the results of the online interactive mapping exercise implemented by MIG for the
Active Transportation on the Rise
 Integrated Approaches to Shared-Use Paths Doug Sarkkinen, PE Windi Shapley, PE Mandi Roberts, AICP, PLA Why? Biking and walking are important active transportation options. Shared-use paths are critical
FOLSOM-HOWARD STREETSCAPE OVERVIEW
 FOLSOM-HOWARD STREETSCAPE OVERVIEW SoMa residents should have the same kinds of amenities that other neighborhoods have. The Folsom- Howard Streetscape Project will make SoMa more livable by making it
Saturday 12:00 p.m 2:00 p.m Bicycle Pedestrian
 Overall Trip Numbers by Time Period Weekday 5:00 p.m. 7:00 p.m. Saturday 12:00 p.m 2:00 p.m. 2009 2010 2009 2010 Bicycle 216 336 180 260 Pedestrian 1384 1362 1936 2507 Summary by Location Count locations
Tunnel Reconstruction Brooklyn CB 1 August 14, 2018
 Tunnel Reconstruction Brooklyn CB 1 August 14, 2018 Reconstructing the Tunnel 2 Service During Tunnel Reconstruction April 2019 through July 2020 3 Projected Cross River Travel Paths of Customers The Service
Traffic Safety Plan Traffic Safety Plan 2015
 Traffic Safety Plan 2015 Purpose Airdrie s last Traffic Safety Plan was created in 2011. The 2015 Traffic Safety Plan is a revised model of the traffic operations for the City of Airdrie. The purpose of